zweig group bbr webinar know your numbers -kpi - session 4
TRANSCRIPT


–Johnny Appleseed
“Type a quote here.”

©ZweigGroup 2016
If you don’t measure what you do, how do you know if it’s working?

©ZweigGroup 2016
Know Your Numbers A good recruitment program keeps track of all the statistics related to talent acquisition analytics.
• How many candidates do we have on every job opening? • How long does it take to fill a position in days? • What is our cost for advertising, online, newspaper? • What is our cost for employment fees?
©ZweigGroup 2016
Know Your Numbers (cont.)
• What is our cost for relocation? • Offer to Acceptance ratio? • Opportunity cost based on lost revenue from an unfilled
position? • Turnover of new employees vs old?
Drive these metrics in the right direction and show trendlines over time.
©ZweigGroup 2016
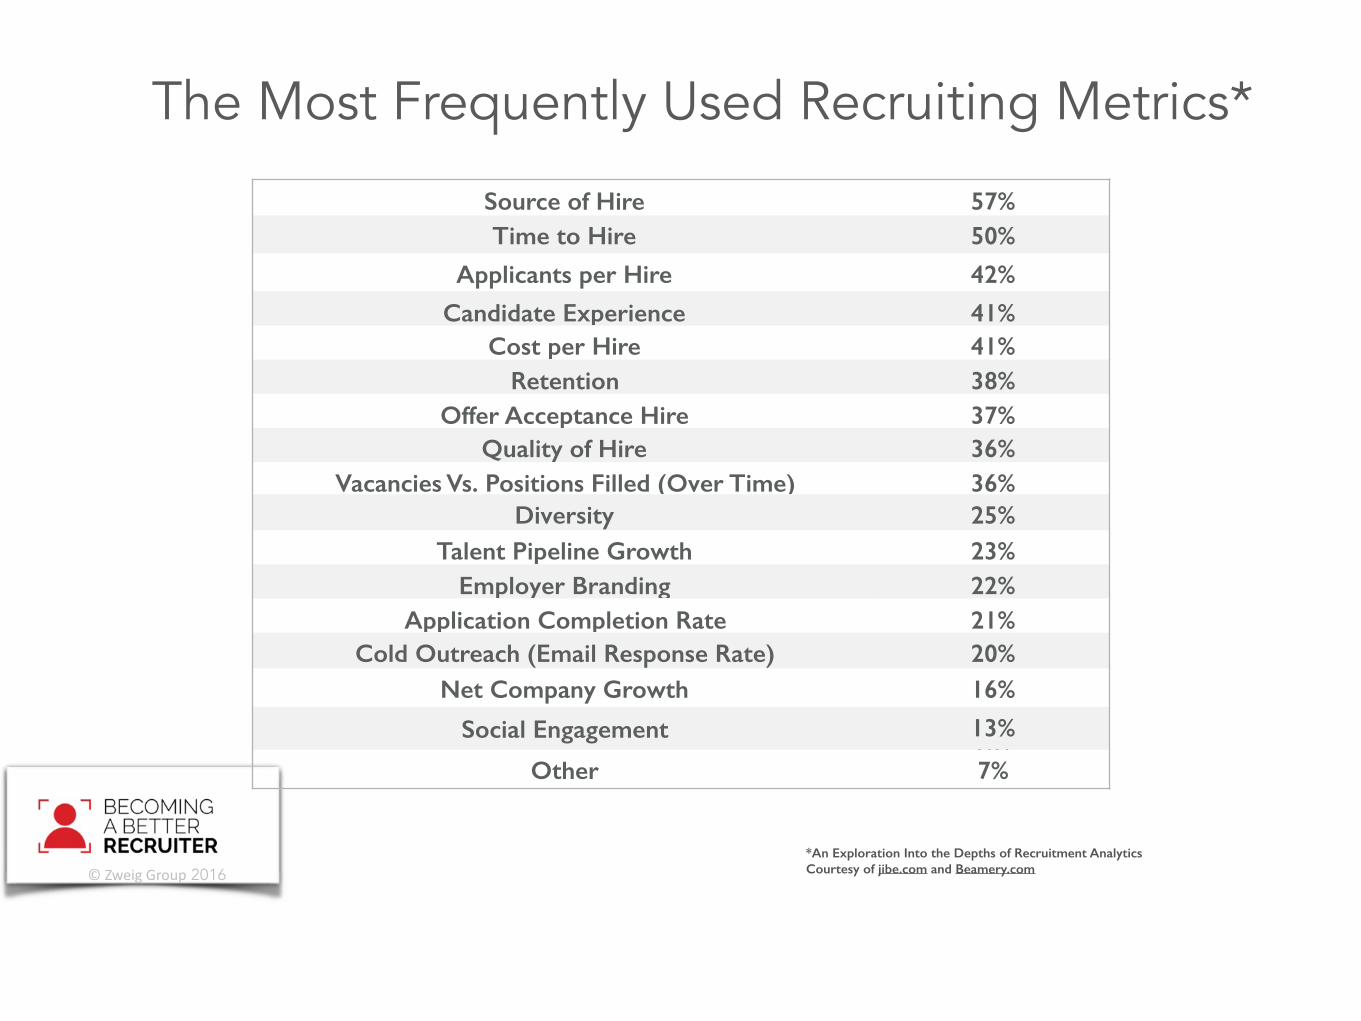
The Most Frequently Used Recruiting Metrics*
Source of Hire 57%Time to Hire 50%
Applicants per Hire 42%
Candidate Experience 41%Cost per Hire 41%
Retention 38%Offer Acceptance Hire 37%
Quality of Hire 36%Vacancies Vs. Positions Filled (Over Time) 36%
Diversity 25%Talent Pipeline Growth 23%
Employer Branding 22%Application Completion Rate 21%
Cold Outreach (Email Response Rate) 20%Net Company Growth 16%
Social Engagement 13% %%Other 7%
*An Exploration Into the Depths of Recruitment Analytics Courtesy of jibe.com and Beamery.com

©ZweigGroup 2016
When it Comes to Recruitment and Retention at Your Firm, How Many Key Performance Indicators
(KPI’s) are You Tracking?

©ZweigGroup 2016
7 Common KPI’s& How to Calculate Them

©ZweigGroup 2016
1. Qualified Candidates
For our purposes think of a Qualified Candidate as someone that is determined to be a good fit for the job after an initial phone interview.

©ZweigGroup 2016
Calculating Qualified Candidates
Qualified Candidates = Total Candidates Per Opening Who Advance Past the Phone Screen Stage
©ZweigGroup 2016
2. Time to FillTime to Fill gives you a clear picture of the efficiency of your recruitment strategy.
Issues that can skew these numbers include whether or not yourrecruiters are reaching out immediately after a candidate apply’sand the time it takes to schedule an interview.
©ZweigGroup 2016
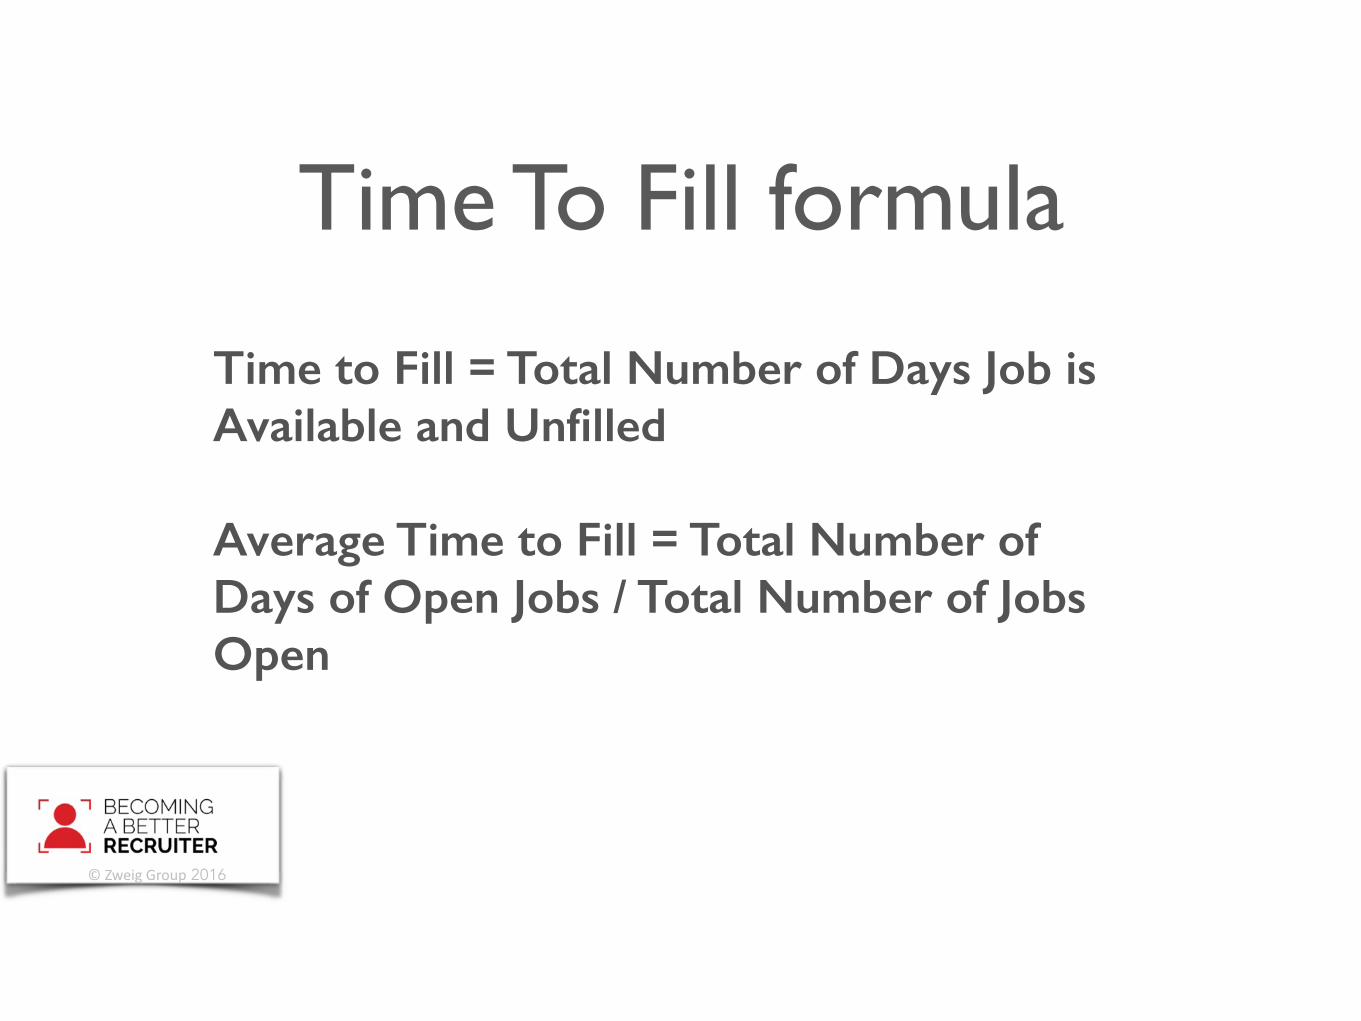
Time To Fill formula
Time to Fill = Total Number of Days Job is Available and Unfilled
Average Time to Fill = Total Number of Days of Open Jobs / Total Number of Jobs Open

©ZweigGroup 2016
3. Offer Acceptance Rate
This recruitment metric tracks the offers you extend to candidates and whether they get accepted or not. You should consider calculating this figure after the interview and application process is complete.
©ZweigGroup 2016
Offer Acceptance Rate formula
Offer Acceptance Rate (%)= (Number of Acceptances / Number of Offers) x 100
or
Offer-to-Acceptance Ratio = Number of Offers / Number of Acceptances

©ZweigGroup 2016
4. Hires to GoalThis is the total number of hires you need within a set period of time. You can set a monthly, quarterly, or annual target goal.
If you run into problems with this goal you should consider looking at other recruitment metrics like the time to source a candidate and move through the recruitment process, etc. This can help to identify pain points that impact your firms ability to reach your hiring goal.

©ZweigGroup 2016
Hires to Goal formula
Hires to Goal = Total New Hires / Hiring Goal

©ZweigGroup 2016
5. Cost Per Hire (CPH)
The CPH metric adds up all expenses that go towards hiring a new employee and demonstrates the value of your recruitment methods.
©ZweigGroup 2016
Cost per Hire formula
Cost per Hire ($) = [Total External Costs] + [Total Internal Costs] / Total Number of Hires

©ZweigGroup 2016
6. Diversity Hiring MetricsWhile we don’t have a specific formula for this metric it is one that more firms are trying to keep track of to determine areas of shortcomings if any.
You can track diversity based on levels of change of minority representation, changes in pay disparities, retention of underrepresented staff, sources of diversity hires, and more.
Courtesy of Jibe and WorkforceDiversityNetwork.com
©ZweigGroup 2016
7. Retention Rates
The retention rate tracks the total number of employees who stay with your firm over a given period of time, out of the total number of employees you had when that period began.

©ZweigGroup 2016
Retention Rate formula
Retention Rate (%) = (Total Employees Still Employed at End of Period / Total Employees at Start of Period) x 100

©ZweigGroup 2016
Developing KPI’s for Recruiting requires you to ask the right questions
Two of the best questions that you can ask are, who’s your audience, and how often do they want insights?
©ZweigGroup 2016
Things to do back at the office…Know Your Numbers 1. Go over all of your numbers and find a format to keep
track of them; Excel, SalesForce, Jibe, Taleo. 2. Develop a monthly reporting mechanism to help you keep
track of recruiting. Determine the frequency of other KPI reports (Monthly, Quarterly, Annually)
3. Share monthly reports with your entire firm! 4. Try to focus on these metrics for optimum results: Sourcing,
Interviewing, Hiring, and Team Performance Management.

©ZweigGroup 2016
Q&A


Up Next!
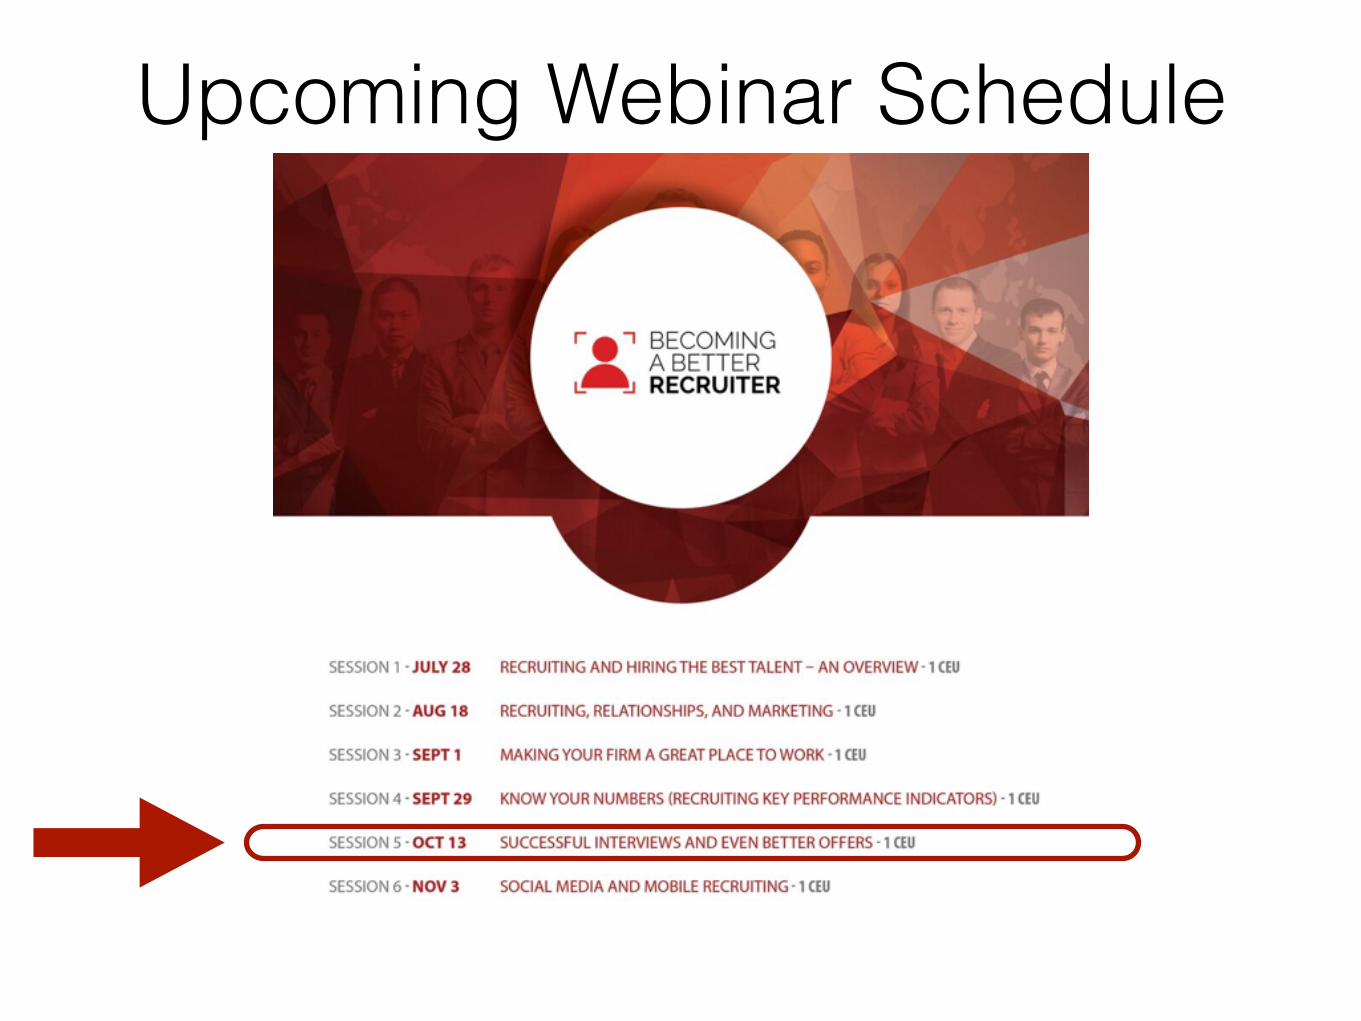
Upcoming Webinar Schedule

Continue the discussion about recruitment and retention online. Use the hashtags #BBRWebinar and #ZweigGroup. We will respond to anything posted on Social Media on this topic.
Presenter: Randy Wilburn 617-828-9093
[email protected] @randywilburn
Thank You!