zpcr capacity sizing lab exercise - share€¦ · © 2015 ibm corporation share ... click minimum...
TRANSCRIPT

zPCR Capacity Sizing Lab Exercise
Page 1 of 35© 2015 IBM Corporation SHARE – March 2015

zPCR Capacity Sizing Lab Exercise
Page 2 of 35© 2015 IBM Corporation SHARE – March 2015
zPCR Capacity Sizing Lab – Part 2 Hands On Lab Exercise
John Burg
Function Selection Window

zPCR Capacity Sizing Lab Exercise
Page 3 of 35© 2015 IBM Corporation SHARE – March 2015
Objective
You will use zPCR (in Advanced Mode) to define a customer's current LPARconfiguration and then project the capacity expectation for an upgrade to newertechnology. The capacity results will then be used to determine if the upgrade model isadequate to support all of the work, and to determine if the amount of CP resourceavailable to each partition is adequate to support that partition’s workload with theanticipated growth applied.
Problem
XYZ Corporation currently has a z196 2817-707 (7-way processor) installed, whichbased on their last zPCR study as having about 7,164 MIPS of usable capacity. The2817-707 is currently averaging 100% busy during peak processing periods. Theworkload environment includes multiple logical partitions, all running on GeneralPurpose CPs, as shown in the table below.
PartitionLP-mode
LCPs Weight Capped Workload Category
1 CICSA Share 7 340 No z/OS-2.1 Average
2 BATCHA Share 7 195 No z/OS-2.1 Average
3 BATCHB Share 2 32 No z/OS-2.1 Average
4 TESTB Share 2 12 No z/OS-2.1 Average
5 TESTIMS Share 5 36 No z/OS-2.1 Average
6 CICSB Share 7 297 No z/OS-2.1 Average
7 IMSA Share 5 73 No z/OS-2.1 Average
8 TESTCICS Share 2 15 No z/OS-2.1 Average
A plan is being developed to replace the z196 2817-707 with a newer technology zSystems (z13) processor. The specific model chosen must provide at least 36%additional capacity, or 9,743 MIPS (7,164 x 1.36). The current configuration is to bemoved to the new processor with the partitions and their workloads continuing as today.The customer has turned on CPU MF counters and has collected SMF 113 data. Theyran CP3KEXTR and created an EDF file containing data from 2/03. The data spans from8:00 am through 12:00 pm using 15 minute intervals. In addition the customer is lookingat moving some work to Linux on IBM z Systems.

zPCR Capacity Sizing Lab Exercise
Page 4 of 35© 2015 IBM Corporation SHARE – March 2015
Tasks Overview
Here are the 6 tasks that comprise this zPCR familiarization exercise, addressing theproblem described above.
*** The actual Lab starts on the next page ***
Task 1 - Load the EDF which contains the latest RMF/SMF data includingSMF 113 data.
Task 2 - Rename the configuration.
Task 3 - Save the current study in Advanced-Mode (e.g. task2.zpcr).
Task 4 - Find an appropriate IBM z13/700 model replacement processor.
Task 5 - Model the intended IBM z13/700 processor.
Task 6 - Review the capacity results and save the study (use a differentfile name than Task 3, e.g. task6.zpcr).
Additional Analysis To Try
– A. Model a z13/600 as an alternative.
– B. Add 1 IFL partition to the z13/700 running Linux guests underz/VM using SMT with a 20% capacity benefit, and add 1 zIIPpartition to the CICSA partition (2 zIIPs) using SMT with a 25%capacity benefit.
Note: When instructed to Return the icon should be used.
The Double Return icon may be used to close multiple openwindows, returning directly to the Advanced-Mode Control Panelwindow.

zPCR Capacity Sizing Lab Exercise
Page 5 of 35© 2015 IBM Corporation SHARE – March 2015
Task 1: Load the EDF with the RMF/SMF data
In this task you will load the current LPAR configuration into zPCR from the file supplied.
Note: zPCR’s default Reference-CPU setting is the 2094-701 rated at 1.00. In order tohave capacity results represented with typical MIPS values, we need to set theReference-CPU to the 2094-701 rated at 593 MIPS.
Analysis Steps
1. Start zPCR. After the Logo window stages, you will be viewing the FunctionSelection window, on the Multi-Image Capacity tab.
2. Select the Advanced-Mode check box if it is not already checked
3. Click the Enter Advanced-Mode button.

zPCR Capacity Sizing Lab Exercise
Page 6 of 35© 2015 IBM Corporation SHARE – March 2015
4. On the Advanced-Mode Control Panel window, double click on the
Reference-CPU icon , currently tagged with “2094-701 @ 1.000 {ITR Ratio}”.The Reference-CPU window will appear.
a) Click Typical to set the Reference-CPU to the 2094-701 rated at 593 MIPS.
b) Click Return.
5. Open Windows Explorer (by clicking on “Start”, “All Programs”, “Accessories”,“Windows Explorer”). Then using Windows Explorer (under My Computer\LocalDisk (C:)) select the C:\CPSTOOLS\zPCR\EDF Files directory, where the Task1.edf file is located and visible. You’ll probably want to size the Windows Explorerwindow down, so that it can be visible with zPCR active. *** For the lab there is ashortcut to this folder on the desktop ***
6. Drag the “Task 1.edf” file from the “zPCR” subdirectory underneath or on top of the
“Configuration #1” icon to open the EDF Interval Selection window.

zPCR Capacity Sizing Lab Exercise
Page 7 of 35© 2015 IBM Corporation SHARE – March 2015
EDF Interval Selection Window
Analysis Steps
1. Sort (Click) on the Pool 1 GP Pool Utilization column.
2. Select Interval #12 and double click to open the Create LPAR Configuration fromEDF window.

zPCR Capacity Sizing Lab Exercise
Page 8 of 35© 2015 IBM Corporation SHARE – March 2015
3. Click on Create LPAR Configuration to transfer the LPAR host processor and its 8partitions to the active zPCR study.
4. Click OK to dismiss the zPCR EDF Copy Partitions transfer dialog.
Advanced-Mode Control Panel Window

zPCR Capacity Sizing Lab Exercise
Page 9 of 35© 2015 IBM Corporation SHARE – March 2015
Task 2: Rename the configuration
Review the capacity assessment and rename the configuration.
Analysis Steps
1. Refer to the “Rename an LPAR Configuration” at the end of this document torename the configurations as shown in the lab.
2. Using the directions above to rename "Configuration #1" to "Current 2817-707"
3. Double-click on the Current 2817-707 LPAR configuration icon to open theLPAR Host and Partition Configuration window for the Current 2817-707 LPARconfiguration.
4. Click Partition Detail in the Capacity Reports Groupbox to open the PartitionDetail Report window. This window will reveal the total GP capacity available as7,164 MIPS.

zPCR Capacity Sizing Lab Exercise
Page 10 of 35© 2015 IBM Corporation SHARE – March 2015
Task 3: Save the study
Analysis Steps
1. Click Return twice (or click the Double Return) to close the LPAR configurationwindows.
2. From the menu-bar on the Advanced-Mode Control Panel window, clickFileSave as, to save your LPAR definitions for the current LPAR host processor.(e.g. task2.zpcr)
Task 4: Find an appropriate replacement processor
Browsing the z/OS-2.1 Multi-Image LSPR Capacity Ratios table, find the IBM z13processor that can provide the required capacity increment using the z/OS Averageworkload category.
Analysis Steps
1. From the Advanced-Mode window, double click on General Purpose CPsto open the LSPR Multi-Image Processor Capacity Ratios table.
2. Find an IBM z13 processor that can provide the required 9,743 MIPS. (tip: right clickfor a list of the Families, select Scroll to IBM, then select z13/700).
For the purposes of this exercise, choose the 2964-707, which appears to have justa bit more capacity than we require, (e.g. 9,964 for Average). Remember thatcapacity values in the multi-image table represent typical (or average) partitionconfigurations, and therefore can only generalize on capacity.
3. Click Return to go back to the Advanced-Mode Control Panel window.

zPCR Capacity Sizing Lab Exercise
Page 11 of 35© 2015 IBM Corporation SHARE – March 2015

zPCR Capacity Sizing Lab Exercise
Page 12 of 35© 2015 IBM Corporation SHARE – March 2015
Task 5: Model the intended LPAR host
Using the current z196 LPAR configuration as a starting point, we will transfer it to thenew IBM z13 processor, making any necessary adjustments to the partition definitions.
Analysis Steps
1. Single-click the Current 2817-707 icon on the Advanced-Mode Control Panelwindow to select it.
2. Click the Clone toolbar button. A 2nd LPAR configuration is created as an exact
copy of the first. It is icon , Rename it to Proposed 2964-707.
3. Double-click the Proposed 2964-707 icon to open the LPAR Host andPartition Configuration window for the Proposed 2964-707 LPAR configuration.
4. Click Specify Host to open the LPAR Host window.
a) Set the Family to be z13/700.
b) Set the Model to 2964-N30/700 (this model has a maximum total of 30 CPs).
c) Leave z13 & z196 Power set to Full.
d) Leave General Purpose CPs set at 7 (recognized as a 2964-707). There are noother CP types planned at this time.
e) Click Return.

zPCR Capacity Sizing Lab Exercise
Page 13 of 35© 2015 IBM Corporation SHARE – March 2015
5. Click Partition Detail in the Capacity Reports group box.

zPCR Capacity Sizing Lab Exercise
Page 14 of 35© 2015 IBM Corporation SHARE – March 2015
Task 6: Review capacity results and save the study
Using the capacity results for this new LPAR host, determine if we realized the desired36% capacity increase (9,743 MIPS), for the overall host and for each individualpartition.
Analysis Steps
1. On the Partition Detail Report window, the overall effective capacity for the z132964-707 is 9,970 MIPS for this LPAR configuration. The effective capacity for thez196 2817-707 is 7,164 MIPS. (see page 9)
2. Click two Return buttons (or click the Double Return button) to close the LPARConfiguration windows.
3. On the Advanced-Mode Control Panel window, select the two configurations (hold
the Ctrl key and click on both) and click the Compare tool bar icon. The HostCapacity Comparison window presents a processor oriented summary of the twoLPAR host configurations. The first LPAR configuration is shown on the left, and thesecond is shown on the right. The partition types are listed in separate rows; themetrics presented are their combined values representing the number of partitions,the number of RCPs, the number of LCPs and the resulting capacity.

zPCR Capacity Sizing Lab Exercise
Page 15 of 35© 2015 IBM Corporation SHARE – March 2015
4. Click Minimum Capacity in the Comparison Report by Partition group box. Notethat all of the partitions see an increase of approximately 36% or more.
5. Click Optimize SHR LCPs for GPs in the Change Controls group box to see if youcan improve the results by reducing the number of LCPs assign to each partition tothat required to accommodate its weight.

zPCR Capacity Sizing Lab Exercise
Page 16 of 35© 2015 IBM Corporation SHARE – March 2015
6. Click Optimize using the default “Moderate” to see if you can improve the results byreducing the number of LCPs assign to each partition. Note: The weight percent isused to determine the exact number of LCPs (rounded up to the nearest wholenumber) to be assigned.
7. For availability reasons we will increase all of the partition LCPs showing only 1LCP (i.e., BATCHB, IMSA, TESTB, TESTCICS, and TESTIMS) to have 2 LCPs asshown below.

zPCR Capacity Sizing Lab Exercise
Page 17 of 35© 2015 IBM Corporation SHARE – March 2015
8. Click Consider Margin-of-Error
The capacity expectation derived from zPCR for a new machine should normally beconsidered to have up to a ±5% margin-of-error. The full ±5% margin of errorshould be considered whenever the LPAR host processor family is changed, orwhen very significant changes are made to either the LPAR host CP configurationor to the partition configuration itself. At this point all of the partitions realize theintended 36% capacity increase when considering the ±5% Margin-of-Error.

zPCR Capacity Sizing Lab Exercise
Page 18 of 35© 2015 IBM Corporation SHARE – March 2015
9. First close the Partition-Margin-of- Error window. Then click Commit Changes inthe Change Controls group box to change the LPAR configuration to permanentlyinclude the modified metrics, (from the Optimize). Note that the Host CapacityComparison window now shows we are delivering 10,401 MIPS (9,881 MIPS whenconsidering the ±5% Margin-of-Error), both of which are greater than the 9,743MIPS objective.
10. Close all of the comparison windows by clicking the Return toolbar icon on theHost Capacity Comparison window.
11. From the menu bar on the Advanced-Mode Control Panel window clickFileSave as, and save the complete study which will include both LPARconfigurations. (Use a different file name than in Task 3, e.g. “Task6.zpcr”.)
At this point we have met the 9,743 MIPS overall objective and 36% for each partitioneven when considering a potential ±5% Margin-of-Error.
*** End of Task 6 ***

zPCR Capacity Sizing Lab Exercise
Page 19 of 35© 2015 IBM Corporation SHARE – March 2015
Additional Analysis To Try
A. Evaluate a z13/600 as an alternative
Browsing the z/OS-2.1 Multi-Image LSPR Capacity Ratios table, find the IBM z13/600processor that can provide the required capacity increment using the z/OS Averageworkload.
Analysis Steps
1. From the Advanced-Mode window, double click on General Purpose CPs
to open the LSPR Multi-Image Processor Capacity Ratios table.
2. Find an IBM z13/600 processor that can provide the required 9,743 MIPS. (tipright click for a list of the Families, then select via Scroll to IBM, then selectz13/600)
For the purposes of this exercise, choose the 2964-612, which appears to have a bitmore capacity than we require, (e.g. 10,070 MIPS for Average etc). Remember thatcapacity values in the Multi-Image LSPR table represent typical (or average)partition configurations, and therefore can only generalize on capacity.

zPCR Capacity Sizing Lab Exercise
Page 20 of 35© 2015 IBM Corporation SHARE – March 2015
4. Click Return to go back to the Advanced-Mode Control Panel window.
Analysis Steps
1. Single-click the Current 2817-707 on the Advanced-Mode Control Panelwindow to select it.
2. Click the Clone toolbar button. A third LPAR configuration is created as an
exact copy of the second. Its icon , Rename it Proposed 2964-612
3. Double-click the Proposed 2964-612 icon to open the LPAR Host andPartition Configuration window for the Proposed 2964-612 LPAR configuration.
4. Click Specify Host
a) Set the Family to z13/600.
b) Set the Model to 2964-N30/600 (this model has a maximum of 30 CPs).
c) Leave z13 and z196 Power set to Full.
d) Set General Purpose CPs to 12 (recognized as a 2964-612).
e) Click Return

zPCR Capacity Sizing Lab Exercise
Page 21 of 35© 2015 IBM Corporation SHARE – March 2015
5. Click Partition Detail. In the Capacity Reports group box, review the capacity forthe General Purpose CP pool.
a) Note that one partition, CICSA, doesn't have a sufficient number of LCPs tosatisfy the weight assigned. We will fix this later
b) Note that Total capacity (10,648 MIPS vs 9,671 requirement). Click Return 2times (or click the Double Return) to get back to Advanced-Mode ControlPanel window.
c) Select both the 2817-707 and the 2964-612 configurations and then
click Compare icon on the Advanced-Mode Control Panel window.

zPCR Capacity Sizing Lab Exercise
Page 22 of 35© 2015 IBM Corporation SHARE – March 2015
d) Click Minimum Capacity. Note that now all partitions are seeing more than therequired 35% capacity increase over the old 2817-707 configuration except forCICSA.
e) Click Optimize SHR LCPs for GPs in the Change Controls group box to see ifyou can improve the results by reducing (increasing) the number of LCPs assignto each partition to that required to accommodate its weight. Click Optimize withthe Moderate option.

zPCR Capacity Sizing Lab Exercise
Page 23 of 35© 2015 IBM Corporation SHARE – March 2015
f) The CICSA partition has 49.7% more capacity and we have more than met our35% objective for all partitions. We should also consider changing all of thepartitions with only 1 LCP to have 2 LCPs for availability reasons as shownbelow. Increase the LCPs to 2 for partitions BATCHB, IMSA, TESTB,TESTCICS, and TESTIMS. (CICSA now has 48.5% more capacity).
g) Click on Consider Margin of Error. We also want to validate that all of thepartitions have enough capacity to ensure they cover the -5% Margin-of-Error.We can see that all partitions are >35% delta on the projected minus 5%. morecapacity.

zPCR Capacity Sizing Lab Exercise
Page 24 of 35© 2015 IBM Corporation SHARE – March 2015
h) First close the Partition-Margin-of-Error window. Then click Commit Changesin the Change Controls group box to change the LPAR configuration topermanently include the modified metrics, (from the Optimize). Note that theHost Capacity Comparison window now shows we are delivering 10,866 MIPS,which is more than the 9,743 MIPS objective.
i) Click two Return buttons to close the windows.
While we won’t execute the following in this lab, there are some things to consider sincethis z13 2964-612 has more capacity than is required. Perhaps a z13 2964-611 couldbe an option, although getting 36% more capacity with a ±5% Margin-of-Error is unlikely.If the partitions have zIIP/zAAP eligible workload content, perhaps their GCPrequirement / weight could be reduced making a 2964-611 an option closer to the GCPcapacity requirement.
In addition, this sub-capacity model has “more & slower” engines than the z196 2817-707 and the z13 2964-707 option (which will be shown and briefly discussed at the endof the lab).
In summary there are many additional “real world” considerations when utilizing zPCR toanalyze z Systems configuration alternatives to achieve desired capacity.
*** End of Additional Analysis A ***

zPCR Capacity Sizing Lab Exercise
Page 25 of 35© 2015 IBM Corporation SHARE – March 2015
B. Add an IFL to the z13 2964-707 Configuration for the Linux workloadAdd zIIPs to the z13 2964-707 Configuration for the CICSA workload
Analysis Steps
1. Single-click on the Proposed 2964-707 icon on the Advanced-Mode ControlPanel window to select it.
2. Click the Clone toolbar button. A 4th LPAR configuration is created as an exact
copy of the second. Its icon , Rename it Proposed 2964-707 with IFL.
3. Double-click the Proposed 2964-707 w IFL zIIPs icon to open the LPARHost and Partition Configuration window for the Proposed 2964-707 w IFL zIIPsLPAR configuration.
4. Click Specify Host
a) Add 1 IFL CP.
b) Add 2 zIIP CPs.
c) Click Return.

zPCR Capacity Sizing Lab Exercise
Page 26 of 35© 2015 IBM Corporation SHARE – March 2015
5. From the LPAR Host and Partition Configuration window, click IFL in the DefinePartitions group box.
6. From the LPAR Partition Definition window, edit the partition name (from IFL-01)by double-clicking the name field to open it and entering text to “TESTLNX", andhitting enter.
Click Return.

zPCR Capacity Sizing Lab Exercise
Page 27 of 35© 2015 IBM Corporation SHARE – March 2015
7. From the LPAR Host and Partition Configuration window, click GP / zIIP in theDefine Partitions group box.
8. From the LPAR Partition Definition select the CICSA partition, then click on thez/OS only zIIP in the Associate with Selected GP group box. This will create theassociated zIIP partition for CICSA. Assign 2 LCPS to the zIIP partition.
Click Return.

zPCR Capacity Sizing Lab Exercise
Page 28 of 35© 2015 IBM Corporation SHARE – March 2015
9. From the LPAR Host and Partition Configuration window, click Partition Detail inthe Capacity Reports group box to open the Partition Detail Report window,revealing the updated capacity picture. The overall capacity increased to 15,083MIPS.
Click Return

zPCR Capacity Sizing Lab Exercise
Page 29 of 35© 2015 IBM Corporation SHARE – March 2015
10. From the Partition Detail Report window, click the Add SMT Benefit to CapacityResults button to open the SMT Benefit dialog and the Global SMT window.
Click OK.
You’ll note that the SMT Benefit is defaulted to 25% for zIIPs and 20% for IFLs. Inthis case since the customer has no experience with SMT we’ll the defaults. Theyare also expecting to support Linux under z/VM in the near future. Click OK on theinformation dialog and click Return on the Global SMT window. This will apply anSMT Benefit to the Minimum and Maximum Capacity result for each zIIP and IFLpartition.

zPCR Capacity Sizing Lab Exercise
Page 30 of 35© 2015 IBM Corporation SHARE – March 2015
Note that with the SMT Benefit applied, the zIIP capacity has increase by 25%,from 3,147 MIPS to 3,933 MIPS. The IFL capacity has increased by 20% from1,747 MIPS to 2,097 MIPS, and the total capacity has increased from 15,083 MIPSto 16,219 MIPS.

zPCR Capacity Sizing Lab Exercise
Page 31 of 35© 2015 IBM Corporation SHARE – March 2015
11. Close all windows. On the Advanced-Mode Control Panel window, select the twoconfigurations #1 and #4 (hold the Ctrl key and click on both) and click the Compare
tool bar icon. Click on Minimum Capacity, and then click Consider Margin-of-Error to see the Partition Margin-of-Error window.
Verify that all of our partitions will still meet our objective of > 36% with the additionof the zIIP and IFL partitions, (consider 35.6% and 36.8% as rounding up to 36%).The one exception is the CICSA partition, which is only reaching 29% capacityimprovement. Since we expect this partition to start offloading work to the zIIPLCPs, 29% may be acceptable.
zPCR Capacity Sizing Lab Exercise
Page 32 of 35© 2015 IBM Corporation SHARE – March 2015
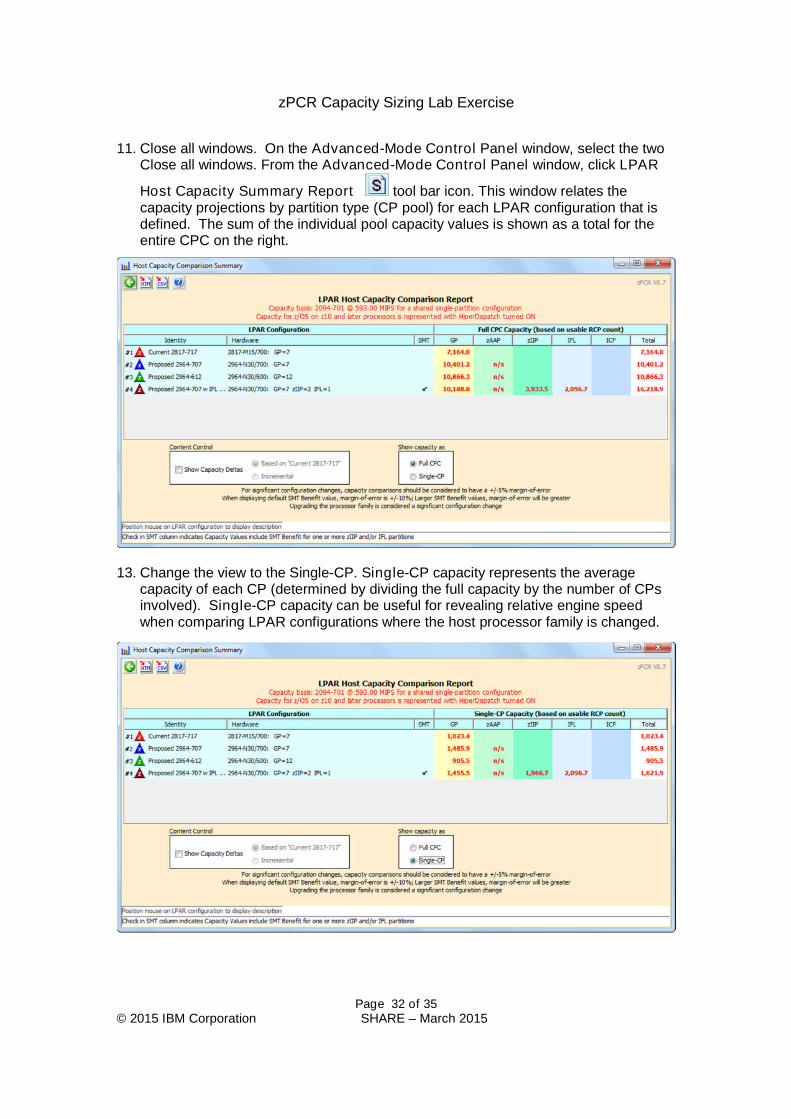
11. Close all windows. On the Advanced-Mode Control Panel window, select the twoClose all windows. From the Advanced-Mode Control Panel window, click LPAR
Host Capacity Summary Report tool bar icon. This window relates thecapacity projections by partition type (CP pool) for each LPAR configuration that isdefined. The sum of the individual pool capacity values is shown as a total for theentire CPC on the right.
13. Change the view to the Single-CP. Single-CP capacity represents the averagecapacity of each CP (determined by dividing the full capacity by the number of CPsinvolved). Single-CP capacity can be useful for revealing relative engine speedwhen comparing LPAR configurations where the host processor family is changed.

zPCR Capacity Sizing Lab Exercise
Page 33 of 35© 2015 IBM Corporation SHARE – March 2015
One use of the Single-CP option is to compare the z13 2964-612 alternative. In thiscase it has “more & slower” engines (12 engines with 905.5 MIPS relative capacityper General Purpose CP) than the z13 2964-707 option (1,485.9 MIPS) and theoriginal z196 (1,023.4 MIPS), but more total GCP capacity. This would be oneconsideration for a sub-capacity model, along with the type of work, number ofpartitions, dispatch points, CPU per Tran etc.
*** End of Additional Analysis B ***
*** End of zPCR Lab ***

zPCR Capacity Sizing Lab Exercise
Page 34 of 35© 2015 IBM Corporation SHARE – March 2015
Renaming an LPAR Configuration
Procedure
1. On the Advanced-Mode Control Panel window, sSingle-click the LPARConfiguration icon to select it.
2. Right click on Rename Configuration popup.

zPCR Capacity Sizing Lab Exercise
Page 35 of 35© 2015 IBM Corporation SHARE – March 2015
3. Key in the LPAR Configuration name that you wish to use and press Enter.