zone modification method for systemwide mass transit...
TRANSCRIPT
22 TRANSPORTATION RESEARCH RECORD 1285
Zone Modification Method for Systemwide Mass Transit Ridership Forecasting
PETER s. LINDQUIST
One of the major problems encountered in urban mass transit ridership forecasting is the incompatibility between traffic analysis zone (T AZ) boundaries and service areas for mass transit routes. This incompatibility results in limited sensitivity of many T AZ systems to passenger access to transit and often results in erroneous ridership estimates. A method to modify existing T AZ systems to account for passenger access to specific transit routes in systemwide mass transit ridership forecasting is documented. Three problems are identified and addressed in the application of this method to conventional forecasting methods that use the four-step modeling process of trip generation, trip distribution, mode split, and trip assignment. The first problem concerns how the zone system can be modified to account for passenger access but retain both the basic structure of the T AZ system and a T AZbased trip table through the entire four-step process. The second problem concerns how model data may be efficiently and accurately reformatted in the framework of the modified zone system. The third problem concerns the adaptation of the four-step urban transportation modeling process for execution in the modified zone system-particularly in the stages of mode split and trip assignment.
One of the major problems encountered in urban mass transit ridership forecasting is the incompatibility between traffic analysis zone (T AZ) boundaries and the boundaries of service areas surrounding individual transit routes. Transit service areas are defined here as the catchment areas surrounding transit stops that are bounded by a maximum walking distance to the route.
Incompatible boundary alignment can significantly affect the performance of T AZ-based aggregate forecasting models , particularly in the mode split and trip assignment stages. Traditional T AZ-based forecasting methods are insensitive to the ability of riders to gain access to the transit system. As a result, it is difficult to identify the portion of the trip-making population in a given T AZ that can gain access to the network within the limits of transit service areas .
A number of studies have demonstrated that walking distance to the nearest stop is a critical factor influencing the rate of use of urban bus service. Generally, the rate of use drops sharply in most areas after 100 m (0.06 mi) , and in most cases, few riders will walk beyond 600 m (0.36 mi) (1-3). In practice, 0.25-mi walking distance is often used as the maximum walking distance or service area radius.
Extending this concept to the route level, each stop along a transit route will form its own service or catchment area
Department of Geography and Planning, University of Toledo, Toledo, Ohio. Current affiliation: Department of Geography-Geology, Illinois State University, Normal, Ill. 61761.
defined by the service area radius. With sufficiently close stop spacing, the service areas will converge to form a service corridor centered on the main axis of the route . The width of the corridor may vary among transit systems according to local ridership behavior in using the system.
It has been argued that the service corridor is a more realistic geographic unit of analysis than the TAZ for transit ridership forecasting ( 4), but the boundaries of service corridors rarely coincide with the boundaries of the TAZ system. As a result, serious problems arise in mode split and trip assignment modeling for transit ridership .
Trip assignment is particularly affected by this inconsistency because the proportion of trip makers truly having access to specific routes cannot be identified and loaded onto those routes. For example, difficulties are encountered in large TAZs with dimensions exceeding the service corridor width; the possibility exists for the overassignment of riders to routes that can serve only a portion of any given TAZ. Conventional methods cannot systematically exclude riders from being loaded onto inaccessible routes within a TAZ (4,5). This problem is compounded with the use of all-or-nothing trip assignment, which loads all trips to the shortest path between a given T AZ pair. As a result, trips may be overassigned to some routes and underassigned to others. This problem may be alleviated by multiple path trip assignment, but better zone definition on the basis of accessibility is still necessary to ensure that trips are loaded onto the correct routes ( 4,6).
Mode split estimates are difficult to obtain because existing methods cannot easily exclude trip makers located beyond the service area of any transit facility. The inability to isolate inaccessible trip makers will result in an overestimate of potential transit trips within T AZs whose dimensions exceed the given service corridor width .
The zone incompatibility problem has been overcome in single-route forecasting through the service corridor approach (4,7,8). However, these methods are limited in their application to systemwide forecasting because the specialized zone systems generated in these cases are focused strictly on the service corridor of the route under study. Each route must generate its own specialized zone system, which will inevitably conflict with the specialized zone system of another route. Therefore, it is difficult to simultaneously forecast ridership among several routes by using a highly specialized zone system focused on each route-particularly in transit networks with extensive circuitry. This problem has been discussed in previous work (4,5).
Lindquist
This paper introduces a method to overcome the zonal incompatibility problem in systemwide ridership forecasting. The method described modifies the T AZ system to account for passenger access to transit and facilitates the execution of the four-step modeling process (i.e., trip generation, trip distribution, mode split, and trip assignment) in the modified zone system. Three critical problems are identified and addressed in meeting these objectives:
1. Construction of a modified zone system that preserves the structure of the TAZ system for execution of the fourstep process yet accounts for passenger access to the transit system,
2. Modification of trip data in the T AZ system for execution of the four-step process in the modified zone system, and
3. Minimal modification of the four-step process for execution in the modified zone system.
The procedure described outlines the basic operation of the Zone Program, an experimental microcomputer program developed to modify the T AZ system and to allocate trips to specific routes within zones for use in mode split and trip assignment. This software was developed for execution with the Quick Response System II (QRS-11), a microcomputerbased modeling package for forecasting highway traffic and transit ridership. The software and the procedures described in this paper were developed concurrently with QRS-11.
METHOD
A major objective of the zone modification method is to preserve the TAZ system to the greatest extent possible. By preserving the TAZ system, it is possible to forecast transit ridership together with highway traffic and preserve a TAZbased trip table. The approach seeks to refine the TAZ system rather than generate a separate, independent zone system as seen in previous single-route ridership models.
This approach makes unnecessary the complete transformation of the zone system, which results in a considerable saving of effort and expense in boundary realignment, data acquisition, and model execution. In addition, a single TAZ system ensures that trip generation and trip distribution need only be executed once for all modes of travel. This is particularly significant in trip distribution . Previous work has demonstrated that trip distribution models are highly sensitive to changes in zone structure (9-11).
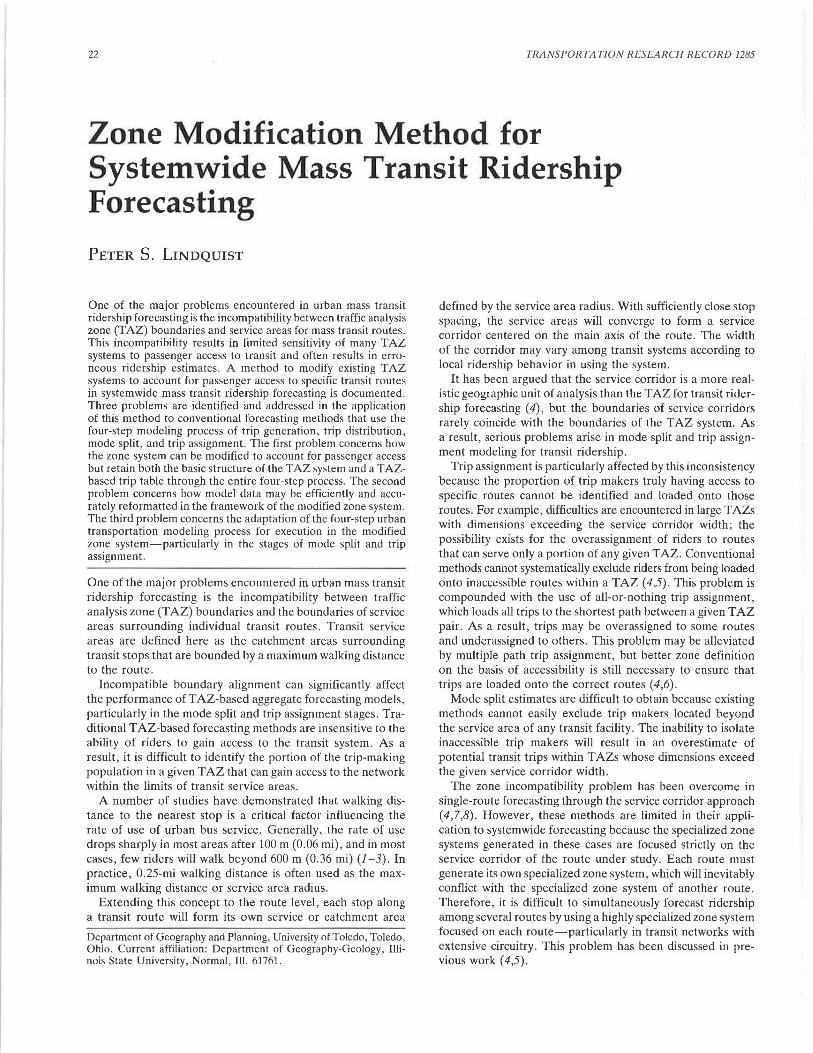
An overview of the proposed zone modification procedure is presented in the framework of the four-step process in Figure 1. The left side of Figure 1 shows that the four-step process remains intact for both transit and highway traffic forecasting through the mode split stage. The right side of Figure 1 shows a parallel process, in which the T AZ system is modified and trip data are reformatted in the modified zone system for execution of mode split and trip assignment for transit . The zone modification procedure (shown in the right half of Figure 1) can be divided into three parts:
1. Modification of the TAZ system, 2. Identification of the distribution of combined trip pro
ductions and attractions (total trip ends) within each TAZ
23
and the allocation of those trip ends to individual segments of zones for execution of mode split and trip assignment, and
3. Execution of modified mode split and trip assignment models for transit in the modified T AZ system.
Each of these parts is treated in detail in the following discussion. The procedure is described sequentially, beginning with the construction of transit zones and ending with the execution of mode split and trip assignment in the modified TAZ system.
Modification of the T AZ System
The T AZ modification procedure has two stages. In the first stage, the service corridor boundaries for every route in the network are simultaneously overlaid. Areas of intersection between corridors are identified and defined as "transit zones." Each transit zone is labeled and a list is made of the transit routes serving that zone.
In the second stage, the transit zone coverage is overlaid on the T AZ boundaries to partition each T AZ into "subzones." A subzone is defined as the area of intersection between a TAZ and a transit zone; each subzone is unique in its access to individual routes or a set of routes in any given T AZ. As a result, each modified TAZ is composed of subzones that represent refined areal units in each T AZ from which to load trips onto the network during mode split and trip assignment.
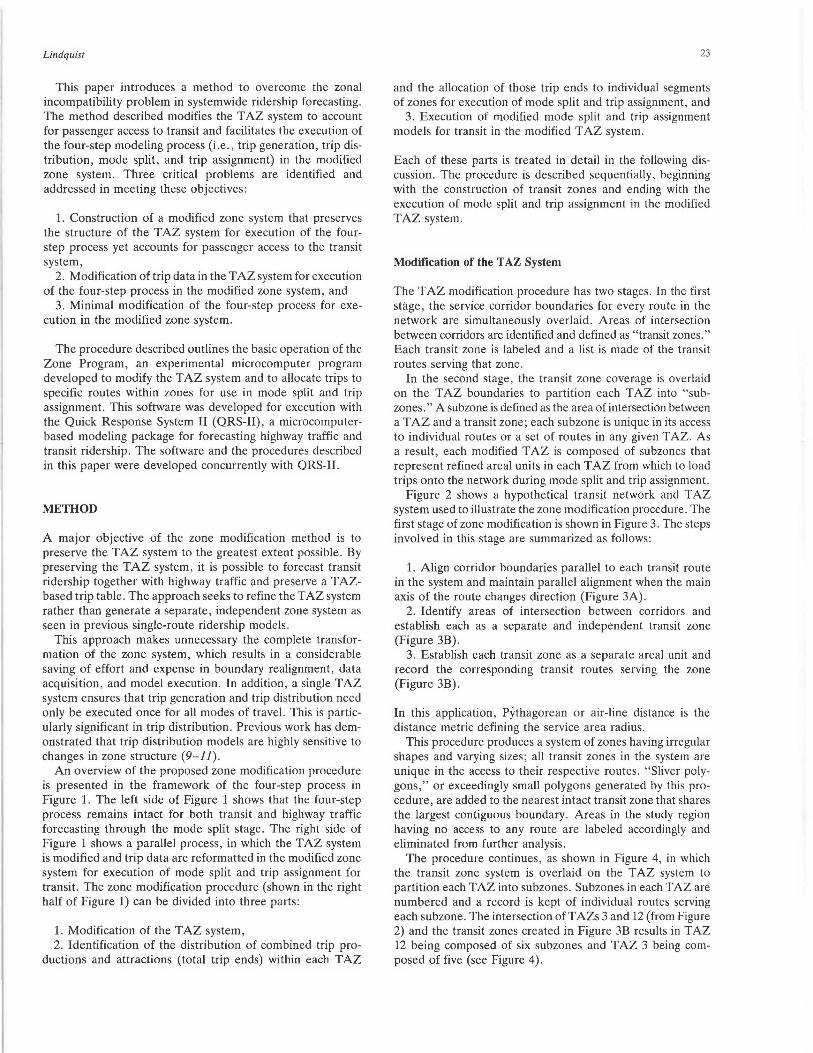
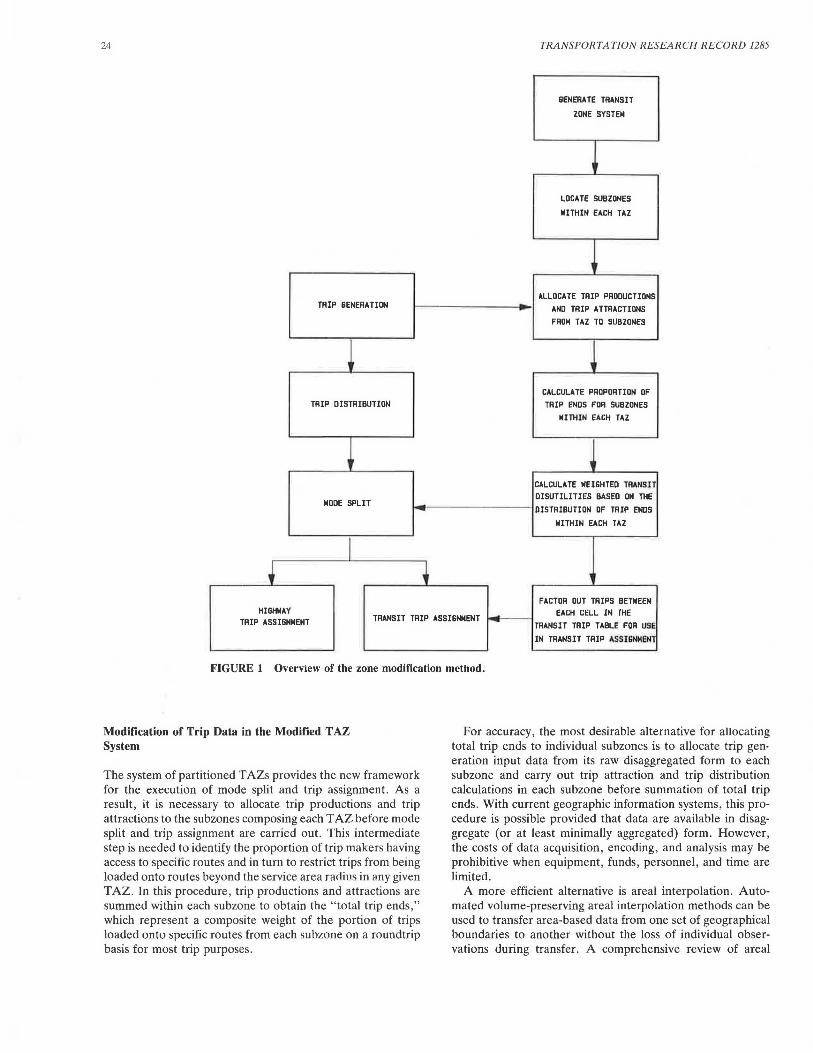
Figure 2 shows a hypothetical transit network and T AZ system used to illustrate the zone modification procedure. The first stage of zone modification is shown in Figure 3. The steps involved in this stage are summarized as follows:
1. Align corridor boundaries parallel to each transit route in the system and maintain parallel alignment when the main axis of the route changes direction (Figure 3A).
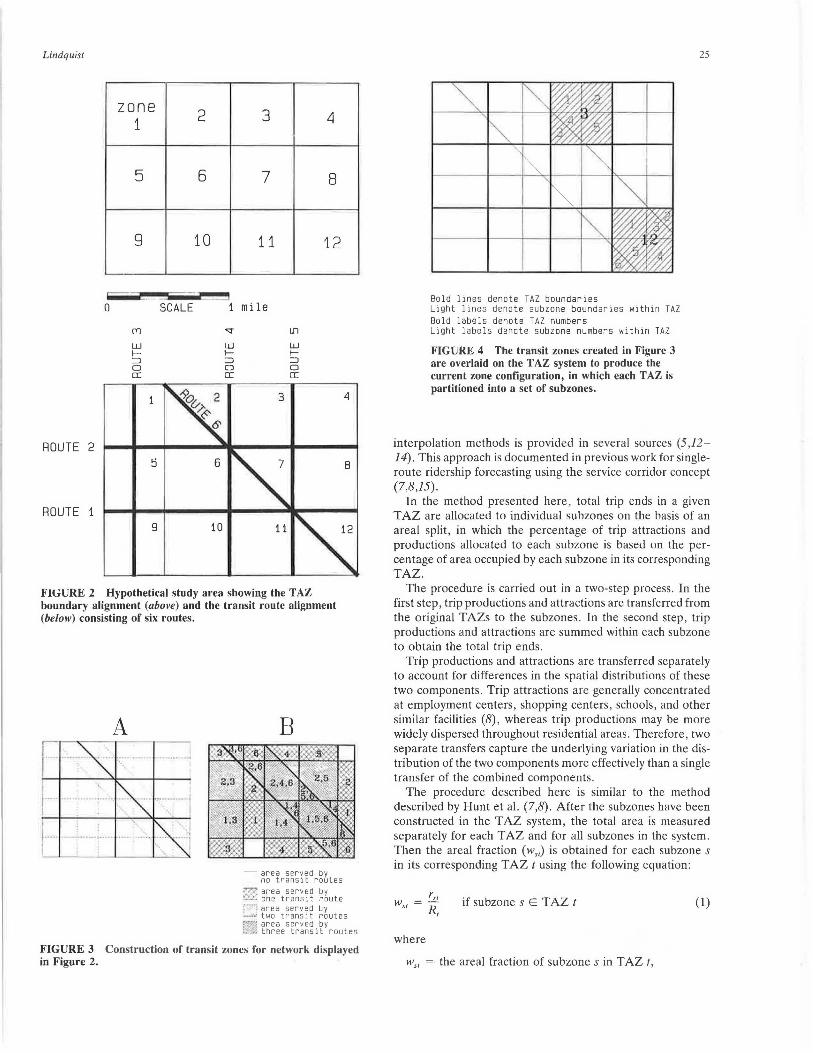
2. Identify areas of intersection between corridors and establish each as a separate and independent transit zone (Figure 3B).
3. Establish each transit zone as a separate areal unit and record the corresponding transit routes serving the zone (Figure 3B).
In this application, Pythagorean or air-line distance is the distance metric defining the service area radius.
This procedure produces a system of zones having irregular shapes and varying sizes; all transit zones in the system are unique in the access to their respective routes. "Sliver polygons," or exceedingly small polygons generated by this procedure, are added to the nearest intact transit zone that shares the largest contiguous boundary. Areas in the study region having no access to any route are labeled accordingly and eliminated from further analysis.
The procedure continues, as shown in Figure 4, in which the transit zone system is overlaid on the TAZ system to partition each TAZ into subzones. Subzones in each TAZ are numbered and a record is kept of individual routes serving each subzone. The intersection ofTAZs 3 and 12 (from Figure 2) and the transit zones created in Figure 3B results in T AZ 12 being composed of six subzones and TAZ 3 being composed of five (see Figure 4).
24 TRANSPORTATION RESEARCH RECORD 1285
SEN ERA TE TRANS IT
ZONE SYSTEM
LOCATE SUBZONES
llITHIN EACH TAZ
I I
ALLOCATE TRIP PRODUCTIONS TRIP SENERA TION • AND TRIP A TTAACTIONS
FROM TAZ TO SUBZONES
~ CALCULATE PROPORTION OF
TRIP DISTRIBUTION TRIP ENDS FOR SUBZONES
llITHIN EACH TAZ
~ CALCULATE llEI6HTED TA4NSll DISUTILITIES BASED ON THE
MODE SPLIT DISTRIBUTION OF TRIP ENDS
llITHIN EACH T"Z
I ~ ~ ,
FACTOR OUT TRIPS BETllEEN HIGHWAY
~ EAGH GRL IN THE
TRANSIT TRIP ASSIGNMENT TA IP ASSIGNMENT - TRANSIT TRIP TABLE FOR USE
IN TRANSIT TRIP ASSIGNMENl
FIGURE I Overview of the zone modification method.
Modification of Trip Data in the Modified T AZ System
The system of partitioned T AZs provides the new framework for the execution of mode split and trip assignment. As a result, it is necessary to allocate trip productions and trip attractions to the subzones composing each T AZ before mode split and trip assignment are carried out. This intermediate step is needed to identify the proportion of trip makers having access to specific routes and in turn to restrict trips from being loaded onto routes beyond the service area radius in any given T AZ. In this procedure, trip productions and attractions are summed within each subzone to obtain the "total trip ends ," which represent a composite weight of the portion of trips loaded onto specific routes from each subzone on a roundtrip basis for most trip purposes.
For accuracy, the most desirable alternative for allocating total trip ends to individual subzones is to allocate trip generation input data from its raw disaggregated form to each subzone and carry out trip attraction and trip distribution calculations in each subzone before summation of total trip ends. With current geographic information systems, this procedure is possible provided that data are available in disaggregate (or at least minimally aggregated) form. However, the costs of data acquisition, encoding, and analysis may be prohibitive when equipment, funds, personnel, and time are limited.
A more efficient alternative is areal interpolation. Automated volume-preserving areal interpolation methods can be used to transfer area-based data from one set of geographical boundaries to another without the loss of individual observations during transfer. A comprehensive review of areal
Lindquist
zone 2 3 4 1
5 6 7 8
9 10 11 12
0 SCALE mi le
(T) "<:!" LI1
UJ UJ UJ I- I- I-:::J :::J :::J 0 0 0 a: a: a:
ROUTE 2 5
ROUTE 1 9
FllJURE 2 Hypothetical study area showing the TAZ boundary alignment (above) and the transit route alignment (below) consisting of six routes.
A
1 ..
' I
B
- area served by no transit routes
~ area served by !.'.:.2. one tr ansi t route :--: area served by _,. two transit routes ~'¥. area served by ~ three transit routes
FIGURE 3 Construction of transit zones for network displayed in Figure 2.
Bold lines denote TAZ boundaries Light lines denot e subzone boundaries within TAZ Bold labels denote TAZ numbers Light labels denote subzone numbers within TAZ
FIGURE 4 The transit zones created in Figure 3 are overlaid on the T AZ system to produce the current zone configuration, in which each TAZ is partitioned into a set of subzones.
25
interpolation methods is provided in several sources (5 ,12-14). This approach is documented in previous work for singleroute ridership forecasting using the service corridor concept (7,8,15).
In the method presented here, total trip ends in a given T AZ are allocated to individual subzones on the basis of an areal split, in which the percentage of trip attractions and productions allocated to each subzone is based on the percentage of area occupied by each subzone in its corresponding TAZ.
The procedure is carried out in a two-step process. In the first step , trip productions and attractions are transferred from the original TAZs to the subzones. In the second step, trip productions and attractions are summed within each subzone to obtain the total trip ends.
Trip productions and attractions are transferred separately to account for differences in the spatial distributions of these two components. Trip attractions are generally concentrated at employment centers, shopping centers, schools, and other similar facilities (8), whereas trip productions may be more widely dispersed throughout residential areas. Therefore, two separate transfers capture the underlying variation in the distribution of the two components more effectively than a single transfer of the combined components.
The procedure described here is similar to the method described by Hunt et al. (7,8). After the subzones have been constructed in the TAZ system, the total area is measured separately for each T AZ and for all subzones in the system. Then the areal fraction (w,,) is obtained for each subzone s in its corresponding T AZ t using the following equation:
where
r,, R,
if subzone s E T AZ t
w,, = the areal fraction of subzone sin TAZ t,
(1)
26
rs1 = the areal measurement of subzone s in T AZ t, and R, = the total areal measurement of TAZ t.
Trip productions and attractions are then allocated to each subzone using the areal fractions obtained in Equation 1. At this point, the number of trip productions and attractions allocated to each subzone is a function of the area occupied by subzone s in TAZ t. First, trip productions are allocated to each subzone using the following equation:
Ps1 = p, ws, if subzone s E T AZ t (2)
where p,, is the number of trip productions allocated to subzone sin TAZ t and p, is the total number of trip productions in TAZ t.
The same procedure is carried out for trip attractions allocated to subzone s in T AZ t:
as, = A, Wsr if sub zone s E T AZ t (3)
where as, is the number of trip attractions allocated to subzone s in T AZ t and A, is the total number of trip attractions in TAZt.
Trip productions and attractions allocated to subzone s from Equations 2 and 3 are summed to obtain the total trip ends in subzone s. The sum is divided by the total number of productions and attractions in its corresponding T AZ t in order to obtain the weighted fraction of total trip ends ifs,) gaining access to the network through the subzone:
if subzone s E T AZ t (4)
The fraction fs, is then used as a weight to allocate the proportion of trips loaded onto the accessible routes serving subzone s.
The method described is limited in its sensitivity to the internal distribution of productions and attractions in any given T AZ. Implicit in the procedure is an assumption that the data are distributed evenly throughout any given T AZ. This is rarely true, particularly for trip attractions. Thus, little information is available concerning the internal distribution of total trip ends within a T AZ, and the probability is high that total trip ends may be misallocated from the T AZ to its corresponding subzones (5).
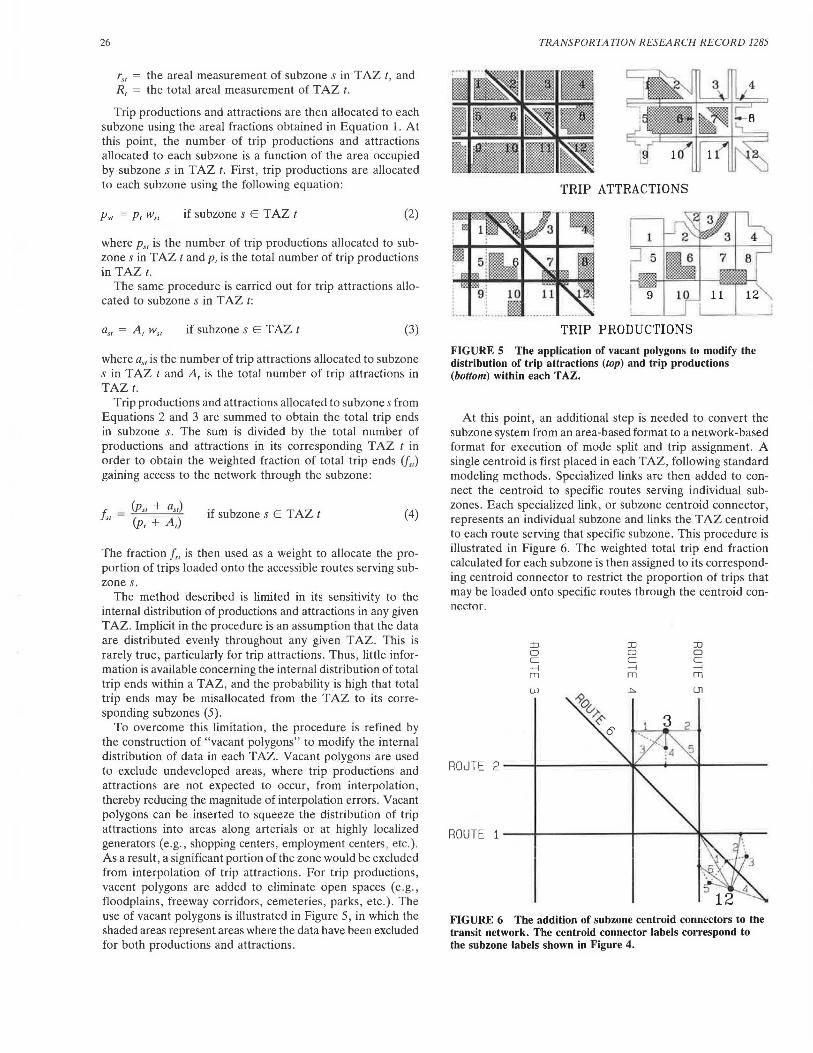
To overcome this limitation, the procedure is refined by the construction of "vacant polygons" to modify the internal distribution of data in each TAZ. Vacant polygons are used to exclude undeveloped areas, where trip productions and attractions are not expected to occur, from interpolation , thereby reducing the magnitude of interpolation errors. Vacant polygons can be inserted to squeeze the distribution of trip attractions into areas along arterials or at highly localized generators (e .g., shopping centers, employment centers, etc.). As a result, a significant portion of the zone would be excluded from interpolation of trip attractions. For trip productions, vacent polygons are added to eliminate open spaces (e.g., floodplains, freeway corridors, cemeteries, parks, etc.). The use of vacant polygons is illustrated in Figure 5, in which the shaded areas represent areas where the data have been excluded for both productions and attractions.
TRANSPORTATION RESEARCH RECORD 1285
TRIP ATTRACTIONS
TRIP PRODUCTIONS
FIGURE 5 The application of vacant polygons lo modify the distribution of trip attractions (top) and trip productions (bottom) within each TAZ.
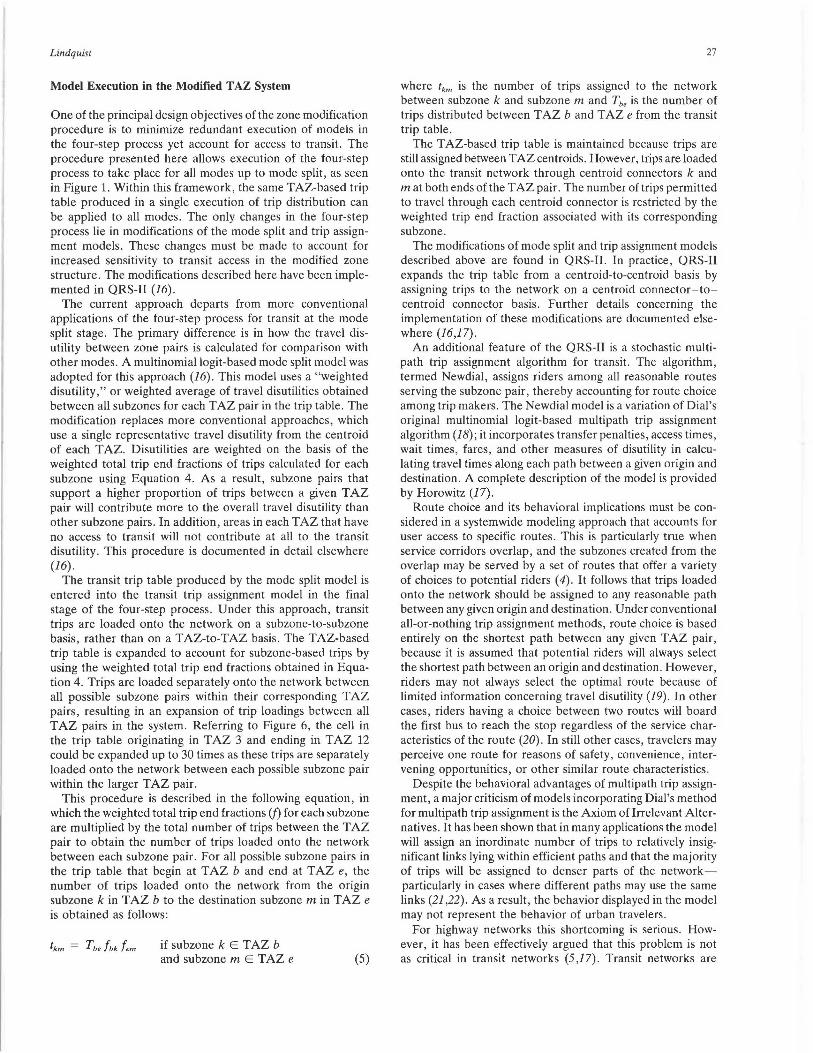
At this point, an additional step is needed to convert the subzone system from an area-based format to a network-based format for execution of mode split and trip assignment. A single centroid is first placed in each T AZ, following standard modeling methods. Specialized links are then added to connect the centroid to specific routes serving individual subzones. Each specialized link, or subzone centroid connector, represents an individual subzone and links the T AZ centroid to each route serving that specific subzone. This procedure is illustrated in Figure 6. The weighted total trip end fraction calculated for each subzone is then assigned to its corresponding centroid connector to restrict the proportion of trips that may be loaded onto specific routes through the centroid connector.
IJ D c -I rn
w
IJ D c -I rn
.C>.
IJ D c -I rn (.Jl
FIGURE 6 The addition of subzone centroid connectors to the transit network. The centroid connector labels correspond to the subzone labels shown in Figure 4.
Lindquist
Model Execution in the Modified T AZ System
One of the principal design objectives of the zone modification procedure is to minimize redundant execution of models in the four-step process yet account for access to transit. The procedure presented here allows execution of the four-step process to take place for all modes up to mode split, as seen in Figure 1. Within this framework , the same TAZ-based trip table produced in a single execution of trip distribution can be applied to all modes. The only changes in the four-step process lie in modifications of the mode split and trip assignment models. These changes must be made to account for increased sensitivity to transit access in the modified zone structure . The modifications described here have been implemented in QRS-11 (16).
The current approach departs from more conventional applications of the four-step process for transit at the mode split stage. The primary difference is in how the travel disutility between zone pairs is calculated for comparison with other modes . A multinomial logit-based mode split model was adopted for this approach (16). This model uses a "weighted disutility," or weighted average of travel disutilities obtained between all subzones for each T AZ pair in the trip table. The modification replaces more conventional approaches , which use a single representative travel disutility from the centroid of each T AZ. Disutilities are weighted on the basis of the weighted total trip end fractions of trips calculated for each subzone using Equation 4. As a result, subzone pairs that support a higher proportion of trips between a given T AZ pair will contribute more to the overall travel disutility than other subzone pairs. In addition, areas in each TAZ that have no access to transit will not contribute at all to the transit disutility. This procedure is documented in detail elsewhere (16) .
The transit trip table produced by the mode split model is entered into the transit trip assignment model in the final stage of the four-step process. Under this approach, transit trips are loaded onto the network on a subzone-to-subzone basis, rather than on a TAZ-to-TAZ basis. The TAZ-based trip table is expanded to account for subzone-based trips by using the weighted total trip end fractions obtained in Equation 4. Trips are loaded separately onto the network between all possible subzone pairs within their corresponding T AZ pairs, resulting in an expansion of trip loadings between all T AZ pairs in the system. Referring to Figure 6, the cell in the trip table originating in T AZ 3 and ending in T AZ 12 could be expanded up to 30 times as these trips are separately loaded onto the network between each possible subzone pair within the larger T AZ pair.
This procedure is described in the following equation, in which the weighted total trip end fractions (f) for each subzone are multiplied by the total number of trips between the T AZ pair to obtain the number of trips loaded onto the network between each subzone pair. For all possible subzone pairs in the trip table that begin at TAZ b and end at TAZ e, the number of trips loaded onto the network from the origin subzone k in T AZ b to the destination subzone m in T AZ e is obtained as follows:
if subzone k E T AZ b and subzone m E T AZ e (5)
27
where tk,.. is the number of trips assigned to the network between subzone k and subzone m and Tb. is the number of trips distributed between T AZ b and T AZ e from the transit trip table.
The TAZ-based trip table is maintained because trips are still assigned between T AZ centroids. However, trips are loaded onto the transit network through centroid connectors k and mat both ends of the T AZ pair. The number of trips permitted to travel through each centroid connector is restricted by the weighted trip end fraction associated with its corresponding subzone.
The modifications of mode split and trip assignment models described above are found in QRS-II. In practice, QRS-11 expands the trip table from a centroid-to-centroid basis by assigning trips to the network on a centroid connector-tocentroid connector basis. Further details concerning the implementation of these modifications are documented elsewhere (16,17).
An additional feature of the QRS-11 is a stochastic multipath trip assignment algorithm for transit. The algorithm, termed Newdial, assigns riders among all reasonable routes serving the subzone pair, thereby accounting for route choice among trip makers. The Newdial model is a variation of Dial's original multinomial logit-based multipath trip assignment algorithm (18); it incorporates transfer penalties, access times , wait times, fares, and other measures of disutility in calculating travel times along each path between a given origin and destination. A complete description of the model is provided by Horowitz (17).
Route choice and its behavioral implications must be considered in a systemwide modeling approach that accounts for user access to specific routes . This is particularly true when service corridors overlap, and the subzones created from the overlap may be served by a set of routes that offer a variety of choices to potential riders ( 4) . It follows that trips loaded onto the network should be assigned to any reasonable path between any given origin and destination. Under conventional all-or-nothing trip assignment methods, route choice is based entirely on the shortest path between any given TAZ pair, because it is assumed that potential riders will always select the shortest path between an origin and destination. However, riders may not always select the optimal route because of limited information concerning travel disutility (19). In other cases, riders having a choice between two routes will board the first bus to reach the stop regardless of the service characteristics of the route (20). In still other cases , travelers may perceive one route for reasons of safety, convenience, intervening opportunities, or other similar route characteristics.
Despite the behavioral advantages of multipath trip assignment, a major criticism of models incorporating Dial's method for multipath trip assignment is the Axiom of Irrelevant Alternatives. It has been shown that in many applications the model will assign an inordinate number of trips to relatively insignificant links lying within efficient paths and that the majority of trips will be assigned to denser parts of the networkparticularly in cases where different paths may use the same links (21 ,22). As a result , the behavior displayed in the model may not represent the behavior of urban travelers.
For highway networks this shortcoming is serious. However, it has been effectively argued that this problem is not as critical in transit networks (5 ,17). Transit networks are
28
rarely as dense or as interconnected as street networks, and the reluctance of passengers to transfer between routes will place limits on the number of available efficient path choices.
The refinements in zone definition enable access to individual routes to be the most important criterion in trip assignment. In addition, multipath trip assignment allows route choice to be considered in the loading of trips between zones having access to more than one route. With travel alternatives more clearly defined, behavior is accounted for in a more realistic manner than in conventional methods. Individual choice between routes may now be based on route service characteristics such as headways, travel times, and transfers, rather than on the simple assumption that riders will always choose the shortest path (17).
IMPLEMENTATION AND EXECUTION OF THE ZONE MODIFICATION METHOD
The zone modification method described in this paper was developed for execution with QRS-11, a microcomputer-based travel demand model that forecasts both highway traffic and systemwide mass transit ridership.
The zone modification method was originally executed using the Zone Program, a highly specialized experimental microcomputer package that calculates area-based weighted trip end fractions for T AZs. The program specifications and descriptions of algorithms in the program are detailed in a separate report (5). Input to the program consists of an encoded QRS-11 transit network, the coordinates of the TAZ boundaries (registered to the coordinates of the transit network), and the corridor width specification for construction of transit zones. The Zone Program carries out the zone modification procedures, allocates trip productions and attractions to subzones within TAZs, and calculates the weighted trip end fractions, which are output to a report file. The weighted trip end fractions are input into the QRS-11 transit network as "weighted area splits" (16).
Additional work has shown that the use of geographic information systems (GISs) may be a feasible alternative to the Zone Program for TAZ modification. A vector-based GIS can carry out T AZ modification with line buffer polygon generation and polygon overlay procedures. With some additional effort, trip productions and attractions can be allocated among subzones within partitioned TAZs, and in turn the weighted trip end fractions can be calculated and output to a report file to be used for encoding the weighted area splits in the QRS-11 transit network.
Preliminary tests using these procedures on the Wausau Area Transit System, a small urban bus network in Wisconsin, indicated a significant decrease in transit ridership estimation errors compared with conventional methods that use intact TAZ systems and all-or-nothing trip assignment. With minimal modifications to model parameters, Lindquist (5) reported systemwide root-mean-square (RMS) error rates of 12 percent using the zone modification system compared with systemwide RMS error rates exceeding 43 percent using conventional methods over a wide range of parameter settings. Test results also indicated that multipath trip assignment is more effective in reducing ridership estimation errors than is all-or-nothing assignment in a modified zone system. However, multipath
TRANSPORTATION RESEARCH RECORD 1285
trip assignment errors increased drastically when the T AZ system was left intact. In contrast, zone modification did little to improve ridership estimates for all-or-nothing assignment (5).
CONCLUSIONS
The zone modification method presented in this paper can be described as a way to refine the T AZ system to both remove potential trip makers located outside of transit service areas and more clearly identify the portion of trip makers who truly have access to specific routes serving each T AZ. The preservation of the T AZ-based trip table to minimize redundant execution of the four-step process differentiates this approach from previous approaches.
The zone system's improved sensitivity to passenger access permits modifications of mode split and trip assignment models that were not possible before. Under this approach, mode split estimates are refined by removing potential passengers who do not have access to the transit network. Mode split estimates are further refined by incorporating a weighted disutility calculated for all intersubzone trips between a given TAZ pair.
Trip assignment is refined by restricting the proportion of trip makers in a TAZ that may be loaded onto specific routes serving that TAZ; trip makers outside individual route service corridors are prevented from being loaded onto those routes. Route choice in overlapping service corridors is addressed by using multipath trip assignment.
Three major problems were overcome in the development of this procedure: (a) modification of the TAZ system to account for passenger access to the network, (b) identification of the distribution of total trip ends in each T AZ and allocation of total trip ends to individual subzones in each T AZ, and (c) modification of the four-step modeling process in the modified zone system.
The problem of TAZ modification is addressed by refining the T AZ system without radically realigning the zonal boundaries. A TAZ-based trip table can be maintained throughout the four-step process without losing sensitivity to passenger access. As a result, redundant model execution among modes as seen in previous single-route approaches can be avoided. Modifications of the four-step process lie in modification of mode split and trip assignment models-not in the separate execution of the four-step process among modes.
The success of initial tests suggests that further study in the application of the zone modification procedure to systemwide mass transit ridership forecasting is warranted. First, tests of the method over a wide range of urban bus networks are needed to provide insight into the reliability of the method for a wide range of applications. This is particularly important in large urban systems with a high proportion of crosstown routes that would produce a complex web of overlapping service corridors.
Modes other than local bus service should also be investigated for adaptability to the service area concept. Such analyses would be more complex because the service area is not simply defined through walking distance. Access to modes such as express bus or rail can be gained through other modes of travel. Service areas would necessarily include the networks
Lindquist
of these other modes. Such an approach introduces a number of problems not considered in previous studies using this method.
An alternative to areal interpolation should also be explored for allocation of total trip ends among subzones. Although areal interpolation has been an efficient technique in the allocation of total trip ends to individual subzones of each T AZ, previous studies have indicated that accuracy may be a major issue in its implementation. However, areal interpolation can be an acceptable technique to allocate total trip ends to subzones, particularly in sketch planning applications where efficiency is desired.
An alternative to this technique may be to incorporate GISs into transportation planning. As geographic data sources become more readily available for a wider variety of applications, raw trip generation data may be stored in a GIS at a relatively low level of aggregation; when necessary, the data can be conveniently assembled in subzones for calculation of total trip ends in the modified zone system.
Initial tests have shown that the T AZ modification procedure is an effective method for reducing errors in systemwide ridership forecasting on urban bus networks. The zone modification method presented in this paper thus provides an effective alternative to conventional methods in systemwide mass transit ridership forecasting. It provides a strong argument for discarding more-conventional approaches to transit ridership forecasting. The transit planner should not be required to settle for a suboptimal zone system when alternative methods are available that can quickly generate a zone system that considers passenger access.
ACKNOWLEDGMENTS
This project was funded through a UMTA University Research and Training Grant. Several people contributed significantly to the development of this method through their criticism and comments. They include Alan Horowitz and Edward Beimborn, both of the Center for Urban Transportation Studies at the University of Wisconsin-Milwaukee, and Frank Stetzer of the Department of Geography at the University of Wisconsin-Milwaukee.
REFERENCES
1. W. Lam and J. Morrall. Bus Passenger Walking Distances and Waiting Times: A Summer-Winter Comparison. Transportation Quarterly, Vol. 36, No. 3, 1982, pp. 407-421.
2. H. S. Levinson and 0. Brown-West. Estimating Bus Ridership. In Transportation Research Record 994, TRB, National Research Council, Washington, D.C., 1984, pp. 8-12.
3. Canadian Transit Handbook, 2nd ed. Canadian Urban Transit Association and Roads and Transportation Association of Canada, 1985, Chapter 4.
4. A. J. Horowitz and D. N. Metzger. Implementation of ServiceArea Concepts in Single-Route Ridership Forecasting. In Trans-
29
portation Research Record 1037, TRB, National Research Council, Washington, D.C., 1985, pp. 31-39.
5. P. S. Lindquist. Traffic Zones Reconsidered: A Geographical Examination of Zonal Restructuring for System-Wise Mass Transit Forecasting. Report WI-11-0011-1. U.S. Department of Transportation, 1988.
6. D. B. Roden. Modeling Multipath Transit Networks. In Transportation Research Record 1064, TRB, National Research Council, Washington, D.C., 1986, pp. 35-41.
7. D. T. Hunt, A. B. Bailey, C. Adidjaja, and J. D. Carroll. Using the 1980 Census to Evaluate the Equity of Transit Service in Northern New Jersey. In Transportation Research Record 992, TRB, National Research Council, Washington, D.C., 1984, pp. 67-73.
8. D. T. Hunt, S. E. Still, J. D. Carroll, and A. 0. Kruse. A Geodemographic Model for Bus Service Planning and Marketing. In Transportation Research Record 1051, TRB, National Research Council, Washington, D.C., 1986, pp. 1-12.
9. B. R. Wildermuth, D. J. Delaney, and K. E. Thompson. Effect of Zone Size on Traffic Assignment and Trip Distribution. In Highway Research Record 392, HRB, National Research Council, Washington, D.C., 1972, pp. 58-75.
10. S. Openshaw. Optimal Zoning Systems for Spatial Interaction Models. Environment and Planning A, Vol. 9, 1977, pp. 169-184.
11. R. Sammons. Zone Definition in Spatial Modelling. In Resources and Planning (B. Goodall and A. Kirby, eds.), Pergamon Press, Oxford, England, 1979, pp. 77-100.
12. M. F. Goodchlid and N. S. Lam. Areal Interpolation: A Variant of the Traditional Spatial Problem. Geoprocessing, Vol. 1, 1980, pp. 297-312.
13. N. S. Lam. Methods and Problems of Areal Interpolation. Ph.D. dissertation. University of Western Ontario, London, Ontario, Canada, 1980.
14. N. S. Lam. Spatial Interpolation Methods: A Review. The American Cartographer, Volume 10, No. 2, 1983, pp. 129-149.
15. P. S. Lindquist. Histospline Interpolation for Data Input into the Transit Ridership Forecasting Model. !TE Journal, Vol. 56, No. 11, 1986, pp. 31-36.
16. A. J. Horowitz. Quick Response System II Reference Manual, Version 2.0. Center for Urban Transportation Studies, University of Wisconsin-Milwaukee, 1987.
17. A. J. Horowitz. Extensions of Stochastic Multipath Trip Assignment to Transit Networks. In Transportation Research Record 1108, TRB, National Research Council, Washington, D.C., 1987, pp. 66-72.
18. R. B. Dial. A Probabalistic Multipath Traffic Assignment Model Which Obviates Path Enumeration. Transportation Research, Vol. 5, 1971, pp. 83-111.
19. R. W. Hall. Traveler Route Choice: Travel Time Implications of Improved Information and Adaptive Decisions. Transportation Research, Vol. 17A, 1983, pp. 201-214.
20. H. Spiess. On Optimal Route Choice Strategies in Transit Networks. Publication 286. Centre de recherche sur Jes transports, University of Montreal, Montreal, Canada, 1983.
21. M. Florian and B. Fox. On the Probabilistic Origin of Dial's Multipath Traffic Assignment Model. Transportation Research, Vol. 10, 1976, pp. 339-341.
22. C. F. Daganzo and Y. Sheffi. On Stochastic Models of Traffic Assignment. Transportation Science, Vol. 11, No. 3, 1977, pp. 253-274.
Publication of this paper sponsored by Commillee on Passenger Travel Demand Forecasting.