zonal and vertical structure of the madden–julian oscillation · zonal and vertical structure of...
TRANSCRIPT

Zonal and Vertical Structure of the Madden–Julian Oscillation
GEORGE N. KILADIS
NOAA/Aeronomy Laboratory, Boulder, Colorado
KATHERINE H. STRAUB
Department of Geological and Environmental Sciences, Susquehanna University, Selinsgrove, Pennsylvania
PATRICK T. HAERTEL
Department of Atmospheric Sciences, University of North Dakota, Grand Forks, North Dakota
(Manuscript received 23 September 2004, in final form 4 February 2005)
ABSTRACT
A statistical study of the three-dimensional structure of the Madden–Julian oscillation (MJO) is carriedout by projecting dynamical fields from reanalysis and radiosonde data onto space–time filtered outgoinglongwave radiation (OLR) data. MJO convection is generally preceded by low-level convergence andupward motion in the lower troposphere, while subsidence, cooling, and drying prevail aloft. This leads tomoistening of the boundary layer and the development of shallow convection, followed by a gradual andthen more rapid lofting of moisture into the middle troposphere at the onset of deep convection. After thepassage of the heaviest rainfall, a westerly wind burst region is accompanied by stratiform precipitation,where lower tropospheric subsidence and drying coincide with continuing upper tropospheric upwardmotion. The evolution of the heating field leads to a temperature structure that favors the growth of theMJO. The analysis also reveals distinct differences in the vertical structure of the MJO as it evolves,presumably reflecting changes in its vertical heating profile, phase speed, or the basic-state circulation thatthe MJO propagates through.
The dynamical structure and the evolution of cloud morphology within the MJO compares favorably inmany respects with other propagating convectively coupled equatorial waves. One implication is that thelarger convective envelopes within the Tropics tend to be composed of more shallow convection along theirleading edges, a combination of deep convection and stratiform rainfall in their centers, and then a pre-ponderance of stratiform rainfall along their trailing edges, regardless of scale or propagation direction.While this may ultimately be the factor that governs the dynamical similarities across the various wavetypes, it raises questions about how the smaller-scale, higher-frequency disturbances making up the MJOconspire to produce its heating and dynamical structures. This suggests that the observed cloud morphologyis dictated by fundamental interactions with the large-scale circulation.
1. Introduction
The Madden–Julian oscillation (MJO) has been thetopic of numerous studies over the past three decades(see Madden and Julian 2005; Wang 2005; Zhang 2005for detailed summaries). Despite such intensive scru-tiny, a comprehensive theory for the MJO, one thataccounts for its genesis, structure, and propagation
characteristics, has proven elusive. Such a theory wouldbe required to explain, among other aspects, themechanism for the eastward propagation of the distur-bance, its spatial scale and phase speed, and the natureof the interactions with higher-frequency disturbancesthat make up its convective envelope. Nevertheless,much progress has been made in documenting the ob-served structure of the disturbance (e.g., Madden andJulian 1972; Weickmann 1983; Rui and Wang 1990;Hendon and Salby 1994; Chen et al. 1996; Lin andJohnson 1996; Houze et al. 2000; Yanai et al. 2000).General circulation model (GCM) simulations of theMJO have also shown steady improvements over the
Corresponding author address: George N. Kiladis, NOAA/Aeronomy Laboratory, R/AL3, 325 Broadway, Boulder, CO80305-3328.E-mail: [email protected]
2790 J O U R N A L O F T H E A T M O S P H E R I C S C I E N C E S VOLUME 62
© 2005 American Meteorological Society
JAS3520

years (Hayashi and Golder 1993; Sperber et al. 1997;Wang and Schlesinger 1999; Inness and Slingo 2003)and mesoscale models are currently improving the re-gional aspects of MJO simulations (Gustafson andWeare 2004).
Diagnosis of the dynamical mechanisms at work inGCMs is still formidable, even if the models realisti-cally simulate the MJO. One very useful alternativeavenue has been provided by simple dynamical models,where many of the complexities of GCMs are strippedaway by using fewer vertical levels and/or simplifiedphysics (e.g., Lau and Peng 1987; Chao 1987; Hendon1988; Chang and Lim 1988; Wang and Chen 1989;Bladé and Hartmann 1993; Salby et al. 1994; Neelin andYu 1994; Lin et al. 2000; Lindzen 2003). Such studieshave attempted to identify mechanisms responsible forthe coupling of convection to the large-scale MJO cir-culation, while other simulations have provided insightinto the potential roles of air–sea interaction (e.g.,Emanuel 1987; Neelin et al. 1987) and cloud-radiationfeedback (Hu and Randall 1994; Raymond 2001) in theMJO.
Despite the progress made in understanding some ofthe fundamental mechanisms key to MJO dynamics,few theoretical or modeling studies thus far have at-tempted to account for the effects of scale interactionsbetween the MJO and other disturbances (Meehl et al.2001). It is now well known that the MJO convectiveenvelope is composed of a host of higher-frequencymodes propagating both eastward and westward (e.g.,Nakazawa 1988; Mapes and Houze 1993; Hendon andLiebmann 1994; Dunkerton and Crum 1995). Althoughmuch of this activity is organized on the mesoscale,many of these disturbances can be identified as synop-tic-scale convectively coupled equatorial waves, havingthe dispersion characteristics and structures of the nor-mal modes of the linearized shallow water equations onan equatorial beta plane (Takayabu 1994; Wheeler andKiladis 1999, hereafter WK99; Wheeler et al. 2000).These modes include Kelvin, equatorial Rossby (ER),mixed Rossby–gravity (MRG), and westward inertio-gravity (WIG) waves.
Straub and Kiladis (2003a) showed that the numberof westward propagating MRG and easterly waves,along with tropical depressions, is increased within theMJO convective region over the western Pacific. TheMJO also modulates Kelvin wave activity (eastwardpropagating superclusters) within its envelope over theIndian Ocean, but well to the east of its location onceit propagates into the western Pacific. In addition,Roundy and Frank (2004a,b) have shown that the MJOcooperatively interacts with westward propagating ERmodes, which may be important for MJO amplification
or genesis. There is also evidence that Kelvin waves areat times implicated in the initiation of a northwardpropagating MJO associated with monsoon onset overIndia (Flatau et al. 2003). These observations suggestthat successful modeling of the MJO will ultimately de-pend on the simulation of interactions between theMJO and these higher-frequency, smaller-scale distur-bances (Krishnamurti et al. 2003). Recent efforts torepresent such scale interactions in simple models (e.g.,Moncrieff 2004; Majda and Biello 2004; Biello andMajda 2005), and in numerical superparameterizationsettings with cloud-resolving simulations embeddedwithin larger scale models (e.g., Grabowski 2003; Ran-dall et al. 2003), have shown encouragingly realistic re-sults.
Several recent studies have examined the large-scalevertical structure of the MJO using various statisticalapproaches (Kemball-Cook and Weare 2001; Sperber2003; Lin et al. 2004). These results have revealed thatthe MJO displays some features in common with othersynoptic-scale convective disturbances in the Tropics.The present study examines the temporal evolution andzonal/vertical structure of the MJO, focusing in particu-lar on differences in its properties as it propagates fromthe western Indian Ocean to the central Pacific. Thisstructure is compared with that of other equatorialwaves described by Wheeler et al. (2000). One goal is toprovide targets for the simulation of the MJO in GCMsand simpler dynamical models. We also aim to providesome observational basis for the relationship betweenthe MJO and the higher-frequency disturbances com-posing, which ultimately will have to be assessed andaccounted for through theory and modeling.
2. Data and methodology
The primary index used here to identify MJO con-vection is based on the interpolated outgoing longwaveradiation (OLR) dataset (Liebmann and Smith 1996).Both European Centre for Medium-Range WeatherForecasts (ECMWF) 15-yr Re-analysis (ERA-15) andNational Centers for Environmental Prediction (NCEP)reanalysis data were used as sources for the dynamicalfields in this study. These data are supplemented byquality-controlled radiosonde observations of wind,temperature, geopotential height, and humidity fromseveral tropical stations in the comprehensive aerologi-cal reference dataset (CARDS), obtained from theNational Oceanic and Atmospheric Administration(NOAA)/National Climatic Data Center (NCDC). Thevertical resolution varies, but the radiosonde data areusually stored at 15 mandatory pressure levels from1000 to 10 hPa, and in some cases as many as 29 levelswith 50-hPa vertical resolution are available. While the
AUGUST 2005 K I L A D I S E T A L . 2791

reanalysis data effectively capture the large-scale fea-tures of the MJO, the use of radiosonde data is crucialfor isolating more subtle details that may be importantto the dynamics.
There have been many efforts to derive indices of theMJO in the literature. Temporal filtering (e.g., Weick-mann et al. 1985; Kiladis and Weickmann 1992), EOFanalyses of wind or OLR (Weickmann 1983; Hendon etal. 1999; Kessler 2001; Matthews 2000; Wheeler andHendon 2004), and singular value decomposition (e.g.,Weare 2003) are typical approaches. For our purposesan index is obtained as in WK99 by space–time filteringOLR to retain only eastward propagating signals ofwavenumbers 0–9 with periods between 30 and 96 days.This filter differs from that of WK99 in that they onlyconsidered eastward waves 1–5 in their analysis,whereas zonal mean signals of the MJO are substantial(e.g., Weickmann et al. 1997) and the higher wavenum-ber components that are now included stand above thebackground in WK99. Our results were checked againsta variety of other MJO indices. Results using any rea-sonable index differ only in details that do not changeany conclusions drawn in this paper. The space–timefiltering approach used here is particularly suitable forexamining lagged signals in station data at a particularlocation, where the use of one number as an index isconvenient. Figure 1 shows the daily standard deviationof the MJO index for the period 1979–2004. As noted inmany previous studies, the MJO is most active over thewarm pool regions of high mean sea surface tempera-ture (SST) of the tropical Indian and west PacificOceans.
The MJO index is correlated and regressed againstdynamical fields or OLR to obtain a composite pictureof MJO evolution, using the technique outlined byWheeler et al. (2000). For all of the plots in this paper,the perturbations are scaled to a –40 W m�2 OLRanomaly, a typical minimum value seen during the pas-
sage of a moderately strong MJO. We initially stratifiedour analysis seasonally, and found that some differ-ences in structure do exist, especially during the solsticeseasons (e.g., Kemball-Cook and Wang 2001; Zhangand Dong 2004). In this paper, we focus primarily onsignals when MJO convective activity is near the equa-tor, where seasonal differences were found to be mini-mal (as was also found by Lin et al. 2005), so for thisstudy statistics were derived using data from all sea-sons. The reanalysis results shown here are representa-tive of a point near the center of the Tropical OceanGlobal Atmosphere Coupled Ocean–Atmosphere Re-sponse Experiment (TOGA COARE) intensive fluxarray (equator, 155°E, denoted C in Fig. 1), for com-parison with results from that field experiment. For ra-diosonde data, the basis is MJO-filtered OLR at thegrid point closest to the station. Out of more than 25high quality radiosonde records examined, we choseto present the results from the locations shown inFig. 1, since they are representative of the regional dif-ferences emphasized in this study. Features discussed inthis paper are all statistically significant at better thanthe 95% level, after taking into account temporal au-tocorrelation, and every figure shown is field significantaccording to the criteria outlined in Livezey and Chen(1983).
We first describe the observational results. This willbe followed by an interpretation and comparison withother convectively coupled equatorial waves, and a dis-cussion of some remaining unresolved issues.
3. Observational results
a. Horizontal circulation
Figure 2 illustrates the regressed day 0 OLR and flowfields at 200 and 850 hPa using the MJO-filtered OLRat the COARE base point, and provides a large-scale
FIG. 1. Daily standard deviation of MJO-filtered OLR (see text) for the period 1979–2004. Contourinterval is 1 W m�2. Shading denotes standard deviations greater than 10 W m�2. Also shown are thelocations of the TOGA COARE base point used in the analysis (denoted C, at equator, 155°E) andradiosonde stations Seychelles (“S,” 4.7°S, 55.5°E), Diego Garcia (“D,” 7.7°S, 72.4°E), Medan (“M,”3.6°N, 98.7°E), Honiara (“H,” 9.4°S, 160.0°E), Truk (“Tr,” 7.5°N, 151.9°E), and Tarawa (“T,” 1.4°N,172.9°E).
2792 J O U R N A L O F T H E A T M O S P H E R I C S C I E N C E S VOLUME 62

context for the results to follow. Figure 2 is quite similarto patterns obtained by Weickmann (1983), Hendonand Salby (1994), and many subsequent studies usingvarious methods. At 850 hPa (Fig. 2a), a familiar pat-tern of cyclonic Rossby gyres flanks the convective re-gion, with a broad fetch of equatorial easterlies presentover the Pacific. These easterlies connect all the wayaround to the western Indian Ocean, as shown below.Westerly flow extends through and to the east of theOLR minimum, and reaches maximum amplitude tothe west of the OLR minimum over Indonesia. Thedetails of this westerly wind burst (WWB) feature havebeen discussed extensively in many previous studies(e.g., Rui and Wang 1990; Hendon and Salby 1994;Kiladis et al. 1994). Little change in the circulation isseen at levels below 850 hPa (not shown), apart from alower amplitude and a slight eastward displacement.The entire pattern is generally interpreted as a forcedRossby–Kelvin response to the convective heating (e.g.,
Lau and Peng 1987; Salby et al. 1994; Houze et al. 2000;Matthews et al. 2004).
The corresponding pattern at 200 hPa (Fig. 2b) dis-plays significant divergent (cross streamfunction) out-flow surrounding the convection, with subtropical anti-cyclonic flow anomalies over the Indian sector andPacific cyclones completing a quadrupole rotational cir-culation. Overall the 200-hPa flow features are of largerscale than the lower tropospheric flow in Fig. 2a, withthe equatorial Pacific westerlies more clearly tied toRossby gyres in the subtropics.
The planetary extent of the MJO circulation on day0 is evident in an equatorial cross section of zonalwind anomalies (u�; Fig. 3). The WWB is present in adeep layer from the eastern Indian Ocean to the dateline, with a 700-hPa maximum centered at 140°E,15° west of the minimum OLR perturbation. Thesewesterlies extend up to around 300 hPa within andto the west of the vicinity of the convection, lying
FIG. 2. Anomalous OLR and circulation from ERA-15 reanalysis on day 0 associated with a �40 Wm�2 perturbation in MJO-filtered OLR at the equator, 155°E for the period 1979–93, all seasonsincluded; (a) 850 and (b) 200 hPa. Dark (light) shading denotes OLR anomalies less than �32 W m�2
(�16 W m�2). Streamfunction contour interval is (a) 4 � 105 m2 s�1 and (b) 10 � 105 m2 s�1. Locallystatistically significant wind vectors at the 95% level are shown. The largest vectors are about 2 m s�1 in(a) and around 5 m s�1 in (b).
AUGUST 2005 K I L A D I S E T A L . 2793

below easterly perturbations tilting upward and east-ward into the stratosphere. The westward tilt withheight of the WWB is in accord with observationsof individual cases, where westerlies are seen firstnear the surface as MJO convection develops, pro-pagating upward over time (Gutzler et al. 1994;Tung and Yanai 2002). East of the date line, strongupper tropospheric westerlies peak at 150 hPa around100°W, extending around the globe until they tilt up-ward and eastward into the lower stratosphere abovethe convection. Beneath the upper westerlies lieweaker low-level easterlies that wrap around into theIndian Ocean.
The relationships between surface wind stress, radia-tion, and MJO convection are crucial elements of thepotential ocean–atmosphere interactions associatedwith the oscillation. Zhang and McPhaden (2000) andZhang and Anderson (2003) review the range of pos-sible phasings, and conclude from observational evi-dence that surface westerlies generally lie within theMJO convective region (their Model II) although insome cases, as over the Indian Ocean, convection isfound closer to the boundary between westerlies andeasterlies (Model I). This transition was also confirmed
by Sperber (2003). This geographical dependence ofMJO zonal wind behavior is also seen in radiosondeobservations in Fig. 4. In all radiosonde plots, time isplotted from right to left for easier comparison withzonal cross sections, and the corresponding OLRperturbation values at the grid point nearest to the sta-tion are also given for each lag. Figure 4a from DiegoGarcia represents the typical signal over the IndianOcean and is very similar to other open ocean loca-tions west of Australasia (e.g., Seychelles and CocosIsland at 12.2°S, 96.8°E; not shown). At Diego Garcia,MJO convection is preceded by low-level easterly andupper tropospheric westerly anomalies, giving wayover time to opposite-signed signals just prior to theOLR minimum. In the lower troposphere, these showlittle vertical tilt, with u� building vertically nearlysimultaneously, and lower (upper) tropospheric east-erlies (westerlies) peaking at 850 hPa around day �14and somewhat stronger opposite signed signals atday �10. Here anomalous surface westerlies are dis-placed only slightly into the region of peak convection.Similar results were obtained using both NCEP andERA-15 reanalyses by Sperber (2003) and Lin et al.(2005).
FIG. 3. Zonal/height cross section of anomalous zonal wind along the equator associated with thepattern in Fig. 2. Contour interval is 0.5 m s�1; negative contours dashed. Dark (light) shading denotesanomalies greater than (less than) �0.5 m s�1. The associated OLR anomaly along the equator is shownat the top in W m�2.
2794 J O U R N A L O F T H E A T M O S P H E R I C S C I E N C E S VOLUME 62

Contrasting behavior over Indonesia and the westernPacific is illustrated by Fig. 4b at Medan, and at Honi-ara, south of the COARE region (Fig. 4c). At theselocations the low-level zonal wind moves upward overtime, rather than being a more discreet two-signed ver-tical structure as at Diego Garcia. Also, the westerliesshow a maximum at either 600 or 700 hPa instead of 850hPa, and are about 50% stronger for a given OLR per-turbation at Medan. Based on the full sample of radio-sonde results, this higher amplitude signal does not ap-pear to be the result of distance from the equator, butis also present at other Indonesian locations (notshown). It is, however, not well reproduced in reanaly-sis, and may be due to a greater intensity of land-basedconvection. Just west of the date line at Tarawa
(Fig. 4d) there are strong easterlies within the boundarylayer ahead of the MJO, a signal that is not capturedwell in the set of lagged ERA-15 plots such as Figs. 2aand 3 (not shown). Here the westerlies extend slightlyfarther into the region of convection than at sites overthe Indian Ocean, although the phasing is still not asextreme as Model II of Zhang and McPhaden (2000),which would have maximum surface westerlies coinci-dent with deepest convection. The Tarawa zonal windprofile also begins to tilt upward and eastward above400 hPa, much lower than at the stations farther westand a feature common to other stations east of 160°E(not shown). The origin of this difference is not imme-diately clear, although we note that the easterly shear ofthe basic state with height begins to decrease east of the
FIG. 4. Time–height cross section of the zonal wind anomaly at (a) Diego Garcia, (b) Medan, (c) Honiara, and (d) Tarawa, scaledto a –40 W m�2 perturbation in MJO-filtered OLR at the nearest grid point to each station. Contour interval is 0.5 m s�1; negativecontours dashed. Dark (light) shading denotes anomalies greater than (less than) �0.5 m s�1. The associated OLR anomaly is shownat the top in W m�2.
AUGUST 2005 K I L A D I S E T A L . 2795

warm pool, which may favor the trapping of equatorialwave kinetic energy in the upper troposphere (Wangand Xie 1996).
b. Divergence
Rui and Wang (1990), Hendon and Salby (1994),Zhang (1996), Jones and Weare (1996), Maloney andHartmann (1998), and Hsu et al. (2004), among others,found evidence of low-level convergence leading MJOconvection as it propagated eastward, and pronouncedvertical tilts in divergence. Figure 5 is a zonal crosssection of the anomalous mass divergence (�� • V)�computed using centered differences. This field has alsobeen partitioned into zonal (�u/x)� and meridional(�v/y)� components (not shown), and they arebroadly representative of the vertical mass divergencefield at various other locations during the MJO lifecycle. We note that these patterns are quite similar us-ing NCEP reanalysis, so any dependence on first-guessmodel parameterizations are at least consistent be-tween the two reanalyses.
In Fig. 5, a broad region of near-surface convergenceextends far to the east of the date line, and is weakestand most shallow at 120°W. This convergence is domi-
nated by the meridional flux as would be expected fromthe cross-isobaric flow due to frictional effects in theKelvin response region (see Wang 1988; Salby et al.1994; Maloney and Hartmann 1998; Moskowitz andBretherton 2000; Seo and Kim 2003). Above this sur-face convergence lies a layer of anomalous divergence,consistent with a signal of detrainment by anomalousshallow convection, roughly paralleling the meanheight of the trade inversion across the Pacific. To thewest, the low-level convergence gradually deepens thentilts sharply upward at 170°E to fill the entire layerbelow 400 hPa in the convective region. Here the mainconvergence peak is at around 600 hPa, just below themelting level and collocated with the minimum OLR(at 155°E). This is produced almost exclusively bystrong zonal convergence within the WWB region,characteristic of the midlevel inflow observed within avariety of mesoscale systems over the warm pool(Houze et al. 2000) and consistent with a top-heavyheating profile as shown by Lin et al. (2004). Diver-gence is aligned with the location of minimum OLRabove 300 hPa, peaking at around 200 hPa. Throughoutthe life cycle of the MJO, this upper tropospheric di-vergence signal closely tracks the location of the OLRminimum (Rui and Wang 1990), and is dominated by
FIG. 5. As in Fig. 3, except for mass divergence (�� • V)� along the equator from 40°E to 80°W.Contour interval is 2 � 10�7 kg m�3 s�1.
2796 J O U R N A L O F T H E A T M O S P H E R I C S C I E N C E S VOLUME 62

the meridional component of the wind (as seen, e.g.,in Fig. 2b). Overall the vertical profile of divergenceat 155°E in Fig. 5 is a good match to that observedwithin deep convection during COARE, whereas tothe west the higher mode profile at 110°–140°E,with low-level divergence and elevated convergence inthe midtroposphere, is more typical of stratiform re-gimes (Mapes and Houze 1995). In this region, the di-vergence within the lowest levels is due almost entirelyto zonal acceleration of the westerlies into the WWB tothe east.
Maps and time–longitude sections of divergence atvarious levels (not show) reveal that, as in Fig. 5,convergence is in phase with the minimum OLR ina deep layer from around 850 hPa up to 400 hPa,but leads by around 40°–50° longitude (roughly 8–10days) at the surface over the Indian and west Pa-cific sectors (e.g., Rui and Wang 1990). Once con-vection decreases over the west Pacific warm poolthe divergence signal weakens considerably at alllevels and propagates rapidly eastward across the Pa-cific (see Hendon and Salby 1994, and discussion be-low).
c. Temperature and vertical circulation
Figure 6 shows the regressed temperature (t�) and thezonal mass flux (�u)� combined with the vertical massflux (�w)� along the equator. The convective region isaccompanied by broad upward motion extending overroughly 60° of longitude, with downward motion of asimilar scale over the eastern Indian Ocean. The up-ward mass flux peaks at 400 hPa and coincides with thesame grid point as the minimum in OLR, as would theinferred latent heating and precipitation. At 140°–150°E there is evidence of midlevel inflow peaking at600 hPa, as was observed in mesoscale cloud clusters byHouze et al. (2000) during COARE.
Locally around the region of minimum OLR the ver-tical temperature structure matches well with that ob-served across a wide variety of convective disturbances,with cold perturbations near the surface, between 700and 600 hPa, and at 100 hPa, and a warm signal at300–400 hPa (e.g., Reed et al. 1977; Gamache andHouze 1985; Sherwood and Warhlich 1999; Wheeler etal. 2000; Sherwood et al. 2003). In Fig. 6, vertically in-tegrated tropospheric warmth occurs to the east of the
FIG. 6. As in Fig. 3, except for zonal-vertical mass flux (�u, �w)� and temperature along the equatorfrom 40°E to 80°W. Contour interval is 0.1 K. The flux �w� has been multiplied by 1200 to account forthe aspect ratio of the plot. The largest zonal flux vector is around 1 � 10�3 kg m�2 s�1, and the largestvertical flux vector around 2 � 10�6 kg m�2 s�1.
AUGUST 2005 K I L A D I S E T A L . 2797

MJO, as was also documented by Salby and Hendon(1994). The largest positive t� in the midtroposphere iswithin and to the east of the longitude of maximumupward motion. This matches well with the signal ob-tained by Lin et al. (2005), although these authorsfound a large discrepancy between ERA-15 and NCEPreanalyses with peak t� in NCEP occurring substantiallyfarther to the east. We have also confirmed this dis-crepancy using our methodology. As shown below, wefind that radiosonde data are more consistent with theERA-15 results, although the phasing between tem-perature and vertical motion still varies substantiallywith location.
Peak lower troposphere t� occurs to the east of thedate line in Fig. 6. On the west side of the envelope inthe midlevel inflow region there is a cold layer at 700hPa sandwiched between warmth above and below.This signal may be partly due to evaporation withinmesoscale downdrafts (e.g., Gamache and Houze 1985)as well as large-scale uplift below the level of substan-tial latent heating. In the region of general subsidencebehind the MJO over the Indian Ocean, the lowestlayers are cold. This signature is in phase with the nega-tive SST anomaly that results from the shortwave ra-diation and eddy heat flux anomalies behind the MJO(Zhang 1996; Flatau et al. 1997; Shinoda et al. 1998;
Waliser et al. 1999; Woolnough et al. 2000; Maloneyand Sobel 2004; Zhang 2005).
The global scale equatorial t� signal of the MJO isshown in Fig. 7. The tilted upper tropospheric t� struc-tures of Fig. 6 are seen to be part of the large amplitudet� signals extending into the lower stratosphere, whichare well-documented features of the MJO (Kiladis et al.2001). A cold signal at tropopause level near the centerof the convective envelope appears to be due in part toadiabatic lofting caused by convective heating below(Sherwood et al. 2003). This is overlain by a warm layerin the lower stratosphere. The vertical tilt of these fea-tures is consistent with the upward group velocity of aforced gravity wave response to the eastward movingMJO heat source. This interpretation is supported bythe fact that the upper portion of the t� signal in west-ward moving equatorial waves tilts in the opposite di-rection (Wheeler et al. 2000; Haertel and Kiladis 2004).
As with zonal wind, there are substantial differencesin the vertical structure of t� between the Indian andIndo/Pacific. Figure 8 shows the evolution of tempera-ture during the passage of the MJO at Seychelles, Di-ego Garcia, Medan, and Tarawa. At all stations t� ispositive on day 0 at 250 and 850 hPa, and weakly nega-tive at the surface. There is a strong cold t� signal cen-tered on 100 or 150 hPa and a warm signal above in the
FIG. 7. As in Fig. 3, except for anomalous temperature along the equator. Contour interval is 0.1 K.
2798 J O U R N A L O F T H E A T M O S P H E R I C S C I E N C E S VOLUME 62

lower stratosphere. Another cold perturbation appearsbetween 700 and 500 hPa at Seychelles (Fig. 8a) andDiego Garcia (Fig. 8b). This higher vertical mode struc-ture of t� is present to varying degrees at all stations,although it is manifested as only a weak negative t� or asignificant local weakening of a positive perturbation at700 hPa at sites in the Pacific and Indonesia, as in Figs.8c and 8d.
Another feature common to the majority of espe-cially open ocean sites is a warm signal that appearsfirst at the surface ahead of the convection, then worksits way up to the 850-hPa level. This is followed by astrengthening cold signal within the boundary layer,which may initially be due to mesoscale downdrafts asthe deepest convection develops. High surface t� aheadof the MJO with low surface t� following are well-known features of the disturbance (e.g., Zhang 1996;
Sperber 2003). However, the spreading of these signalsupward into the boundary layer is less well documentedand will be discussed further below.
d. Specific humidity
The zonal structure of specific humidity anomalies(q�) associated with the MJO from reanalysis is shownin Fig. 9. This plot only extends to the 300-hPa level,which is considered to be the maximum height of usefulhumidity data from reanalysis and radiosondes. Satel-lite observations reveal that the MJO transports mois-ture into the upper troposphere and lower stratosphere,nearly in phase with the upper tropospheric q� signalsshown here (e.g., Mote et al. 2000; Sassi et al. 2002).Plots of q� can also be treated as close proxies for per-turbation moist static energy, which look quite similar.
To the east of the MJO convective center, over the
FIG. 8. As in Fig. 4, except for anomalous temperature at (a) Seychelles, (b) Diego Garcia, (c) Medan, and (d) Tarawa. Contourinterval is 0.1 K.
AUGUST 2005 K I L A D I S E T A L . 2799

entire Pacific, the lower troposphere is anomalouslymoist. This moist layer extends up to 500 hPa to the eastof about 130°W, then tilts westward with height backtoward the west Pacific, with a peak q� seen at 600 hPawithin the convective envelope. Over the Indian sectorthe entire column is dry in the wake of the disturbance,with a moist upper troposphere and dry lower tropo-sphere over Indonesia.
The divergence and q� patterns of Figs. 5 and 9 implylarge-scale moisture convergence in the lower tropo-sphere ahead of the MJO, followed by rapid moisteningin the vertical as deep convection develops. Low-leveldrying initially precedes a more rapid drying of the tro-posphere to the west of the MJO, a signal in agreementwith that found by Kemball-Cook and Weare (2001)using station data and by Seo and Kim (2003) and Sper-ber (2003) in NCEP reanalysis. This drying would ini-tially occur in convective downdrafts of the stratiformregion, with large-scale Rossby gyres behind the MJObringing subsiding subtropical air into low latitudesthrough a deep layer. Myers and Waliser (2003) usedTelevision Infrared Observation Satellite (TIROS) Op-erational Vertical Sounder (TOVS) moisture estimatesto examine the structure of q� associated with the MJOand found that low-level humidity leads MJO convec-
tion, but that in general ERA-15 reanalysis as well asTOVS appeared to underestimate the actual value ofhumidity fluctuations somewhat. Nevertheless both ofthese studies found evidence that moistening over thePacific occurred more gradually ahead of the propagat-ing MJO convection than it did within developing MJOconvection over the Indian Ocean, where rapid moist-ening occurred.
These differences are confirmed by a comparison ofradiosonde data. At Diego Garcia (Fig. 10a), Medan(Fig. 10b), and Honiara (Fig. 10c), moistening preced-ing and drying following MJO convection is observedfirst at 850 hPa, but the vertical propagation of thesignal proceeds more rapidly at Diego Garcia, and thisalso occurs at other stations over the limited sample inthe Indian Ocean (Seychelles and Cocos Island; notshown). At stations with higher vertical resolution, suchas Truk (Fig. 10d), this initial moistening and dryingfollowing is seen to actually be maximized at the 950-hPa level, and this signal is consistent throughout otherstations with 50-hPa resolution (not shown), althoughunfortunately none of these sites are in the Indian orIndonesian sectors for comparison. At Truk, a distinctmoist wedge is seen starting at around day �25 at the950-hPa level sandwiched between still dry air near the
FIG. 9. As in Fig. 3, except for anomalous specific humidity along the equator from 40°E to 80°W.Contour interval is 1 � 10�1 g kg�1.
2800 J O U R N A L O F T H E A T M O S P H E R I C S C I E N C E S VOLUME 62

surface and above. Over several days, this moisturegradually builds vertically, until around day �13 whenrapid moistening is seen throughout the column. Thisprogression, along with the drying of the lower tropo-sphere following the deepest convection, is similar tothe evolution within tropical mesoscale convectivecomplexes (MCS; e.g., Gamache and Houze 1985),Kelvin waves (Straub and Kiladis 2003b), and two-daywaves (Haertel and Kiladis 2004).
As with other fields described above, the phasingbetween low-level moisture and the convective enve-lope of the MJO depends substantially on location. Fig-ure 11 plots the near equatorial time–longitude evolu-tion of moisture at 850 hPa, near the level of maximumq� perturbations, from day �35 to �35. This field is alsoa good proxy for the surface equivalent potential tem-perature, convective available potential energy (CAPE;
see Emanuel 1994), and moist static energy, all of whichdisplay very similar phase relationships to OLR. Priorto the development of the MJO in the western IndianOcean (around day �30 and �20) moisture builds insitu to the east of 40°E before it begins eastward propa-gation ahead of the MJO negative OLR signal. Overthe Indian and Indonesian sectors maximum low-levelq� remains around 1/8 of a cycle ahead of the convec-tion, with a phase speed of around 5 m s�1. Once con-vection reaches the western Pacific on around day �10,the positive q� signal decouples from the attenuatingOLR signal and spreads rapidly eastward across theentire Pacific at around 33 m s�1. This signal is initiallyblocked by the Andes Mountains at 80°W, followed bya rapid but weaker increase of q� across the Atlantic,which then propagates more slowly across Africa andback into the Indian Ocean at a more typical phase
FIG. 10. As in Fig. 4, except for anomalous specific humidity at (a) Diego Garcia, (b) Medan, (c) Tarawa, and (d) Truk. Contourinterval is 1 � 10�1 g kg�1.
AUGUST 2005 K I L A D I S E T A L . 2801

speed of 5 m s�1. Rapid eastward propagation of MJO-related signals over the Pacific was observed in theoriginal study of Madden and Julian (1972) and in manystudies since (e.g., Hendon and Salby 1994; Bantzer andWallace 1996; Weickmann et al. 1997; Milliff et al. 1998;Matthews 2000; Sperber 2003). This rapid phase speedis ascribed to a free first baroclinic Kelvin mode ema-nating from evolving MJO convection over the warmpool (Milliff and Madden 1996; Hendon and Salby1996), and it has been argued that the continuation ofthis signal around the globe is a mechanism for theinitiation of the next MJO cycle (Matthews 2000; Seoand Kim 2003).
Maps (not shown) and time–longitude plots of q� anddivergence (Sperber 2003) reveal a strong local rela-tionship between convergence and anomalously high q�at all lower tropospheric levels over Indian Ocean, buta much weaker relationship over the Pacific. This sug-gests that moisture flux convergence is crucial formoistening the lower troposphere over the Indian sec-
tor ahead of the MJO, but that local evaporation maybe more important over the Pacific (see Weare 2003),where the lower troposphere moistens rapidly but itremains dry above the boundary layer for a longer pe-riod prior to convection. This moistening likely occursas a result of combined weak surface convergence andstrong evaporation in the enhanced low-level easterliesthat rapidly develop over the Pacific when convectionreaches the west Pacific (Fig. 2b), in response to thefree Kelvin mode.
e. Diabatic heating
Over a wide range of scales, the heating in convec-tively coupled equatorial disturbances can be realisti-cally approximated by a two-mode vertical structure(e.g., Mapes and Houze 1995; Mapes 2000; Majda andShefter 2001; Majda et al. 2004; Haertel and Kiladis2004). The first mode represents deep convection, witha latent heating maximum in the middle troposphere.
FIG. 11. Time–longitude diagram of anomalous 850-hPa specific humidity (contours, interval is 1 �10�1 g kg�1, negative dashed) and OLR [shading, dark (darkest) shading denotes OLR anomalies lessthan –16 W m�2 (�18 W m�2), and light shading anomalies greater than �16 W m�2] from day �35through day �35 averaged from 10°S to 10°N, associated with a –40 W m�2 perturbation in MJO-filteredOLR at the 0°, 155°E on day 0.
2802 J O U R N A L O F T H E A T M O S P H E R I C S C I E N C E S VOLUME 62
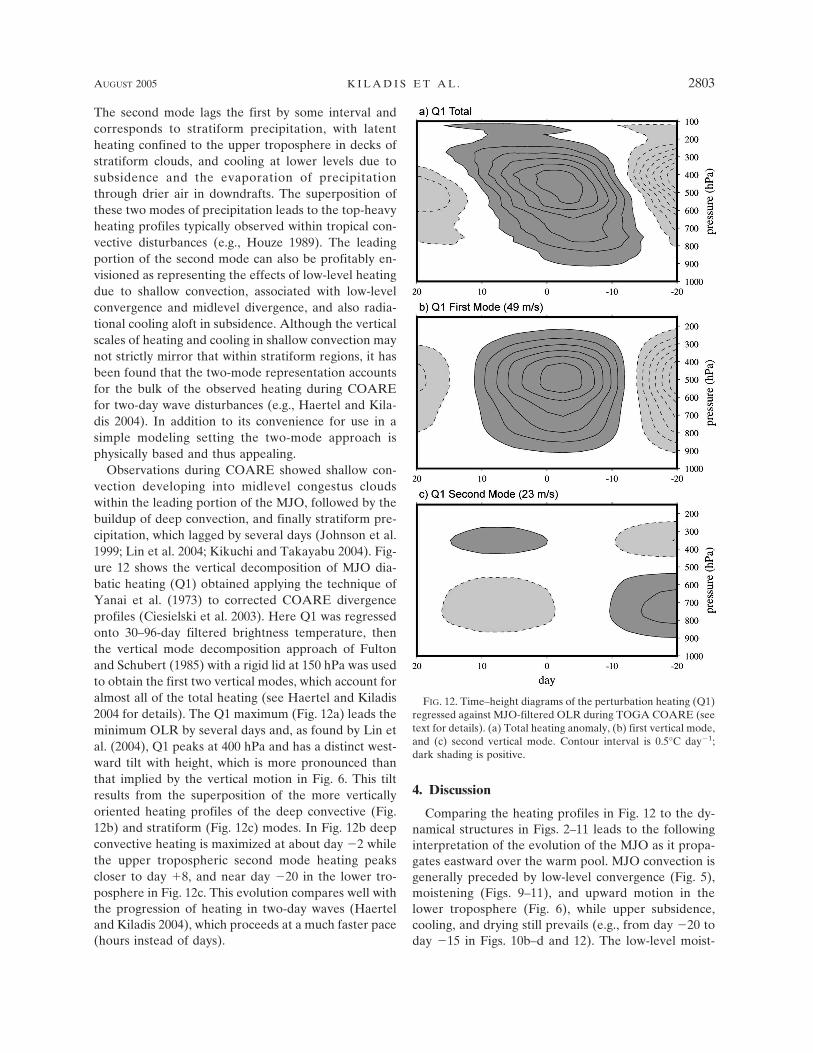
The second mode lags the first by some interval andcorresponds to stratiform precipitation, with latentheating confined to the upper troposphere in decks ofstratiform clouds, and cooling at lower levels due tosubsidence and the evaporation of precipitationthrough drier air in downdrafts. The superposition ofthese two modes of precipitation leads to the top-heavyheating profiles typically observed within tropical con-vective disturbances (e.g., Houze 1989). The leadingportion of the second mode can also be profitably en-visioned as representing the effects of low-level heatingdue to shallow convection, associated with low-levelconvergence and midlevel divergence, and also radia-tional cooling aloft in subsidence. Although the verticalscales of heating and cooling in shallow convection maynot strictly mirror that within stratiform regions, it hasbeen found that the two-mode representation accountsfor the bulk of the observed heating during COAREfor two-day wave disturbances (e.g., Haertel and Kila-dis 2004). In addition to its convenience for use in asimple modeling setting the two-mode approach isphysically based and thus appealing.
Observations during COARE showed shallow con-vection developing into midlevel congestus cloudswithin the leading portion of the MJO, followed by thebuildup of deep convection, and finally stratiform pre-cipitation, which lagged by several days (Johnson et al.1999; Lin et al. 2004; Kikuchi and Takayabu 2004). Fig-ure 12 shows the vertical decomposition of MJO dia-batic heating (Q1) obtained applying the technique ofYanai et al. (1973) to corrected COARE divergenceprofiles (Ciesielski et al. 2003). Here Q1 was regressedonto 30–96-day filtered brightness temperature, thenthe vertical mode decomposition approach of Fultonand Schubert (1985) with a rigid lid at 150 hPa was usedto obtain the first two vertical modes, which account foralmost all of the total heating (see Haertel and Kiladis2004 for details). The Q1 maximum (Fig. 12a) leads theminimum OLR by several days and, as found by Lin etal. (2004), Q1 peaks at 400 hPa and has a distinct west-ward tilt with height, which is more pronounced thanthat implied by the vertical motion in Fig. 6. This tiltresults from the superposition of the more verticallyoriented heating profiles of the deep convective (Fig.12b) and stratiform (Fig. 12c) modes. In Fig. 12b deepconvective heating is maximized at about day �2 whilethe upper tropospheric second mode heating peakscloser to day �8, and near day �20 in the lower tro-posphere in Fig. 12c. This evolution compares well withthe progression of heating in two-day waves (Haerteland Kiladis 2004), which proceeds at a much faster pace(hours instead of days).
4. Discussion
Comparing the heating profiles in Fig. 12 to the dy-namical structures in Figs. 2–11 leads to the followinginterpretation of the evolution of the MJO as it propa-gates eastward over the warm pool. MJO convection isgenerally preceded by low-level convergence (Fig. 5),moistening (Figs. 9–11), and upward motion in thelower troposphere (Fig. 6), while upper subsidence,cooling, and drying still prevails (e.g., from day �20 today �15 in Figs. 10b–d and 12). The low-level moist-
FIG. 12. Time–height diagrams of the perturbation heating (Q1)regressed against MJO-filtered OLR during TOGA COARE (seetext for details). (a) Total heating anomaly, (b) first vertical mode,and (c) second vertical mode. Contour interval is 0.5°C day�1;dark shading is positive.
AUGUST 2005 K I L A D I S E T A L . 2803
ening and accompanying warming due to shortwave ra-diation and surface fluxes initially result in the destabi-lization of the boundary layer and the development ofshallow convection. This is followed by a gradual loft-ing of moisture into the middle troposphere by conges-tus clouds, then a sharp intensification of upward mo-tion and latent heating in the upper tropospheric regionof deep convection. After the passage of the heaviestrainfall, the WWB region is accompanied by stratiformprecipitation in a region where lower tropospheric sub-sidence and drying coincide with continuing upper tro-pospheric moisture and upward motion. This latter sig-nal would occur at around 140°E in Fig. 6, althoughbased on a comparison with COARE data it is likelythat ERA-15 does not capture the full extent of thewestward tilt of the vertical w� profile implied by Fig.12, perhaps due in part to the misrepresentation of thestratiform component in model convective parameter-izations used to obtain the first-guess analysis (Lin et al.2004).
Analysis of the statistical evolution of the MJO hasrevealed distinct differences in the mean structure ofthe disturbance over the Indian Ocean versus Indonesiaand the Pacific. Although not displayed here, these dif-ferences are maintained robustly throughout the sea-sonal cycle, and provide evidence that the nature of thecoupling between convection and dynamics within theMJO varies throughout its life cycle. The evolution ofthese signals presumably reflects changes in verticalheating profiles, phase speed, and/or the basic state thatthe MJO propagates through.
In particular, higher vertical mode tropospheric tem-perature structures appear over the Indian sector (Figs.8a,b), where there is more pronounced mean easterlyvertical shear in the basic-state zonal wind. Varioustheoretical and modeling results support the notion thathorizontal and vertical shear should significantly alterthe structure of equatorial waves (e.g., Holton 1970,1971; Lindzen 1971; Boyd 1978; Zhang and Webster1989; Wang and Xie 1996; Xie and Wang 1996). Wangand Xie (1996) found that stronger easterly shear withheight favors higher amplitude baroclinic modal struc-tures in the lower troposphere in equatorial Rossby andMRG modes, with much less pronounced effects onKelvin waves. Vertical tilts of equatorial waves are alsosensitive to boundary layer friction (e.g., Wang andChen 1989), along with the scale selection, growthrates, and stability of MJO analogs in simple models(Wang 1988, 2005; Wang and Rui 1990; Moskowitz andBretherton 2000). These potential effects on the MJOneed to be investigated more thoroughly.
Despite regional differences, the coincidence be-tween upper tropospheric warmth and upward motion
is seen throughout the life cycle of the MJO, indicativeof a disturbance converting available potential energyto kinetic energy (Yanai et al. 2000). More generally, ina dry propagating wave, or in a moist wave that is nearstatistical equilibrium, that is, where diabatic heatingnearly cancels the adiabatic cooling because of ascent(Emanuel et al. 1994), the temperature due to verticaladvection would be in quadrature with the heatingfield, and warm ahead of the region of upward motion.In a linear vertical mode decomposition, this relation-ship still roughly holds for each mode, so that the ob-served upward and westward vertical tilt in the midtro-pospheric temperature signal of convectively coupledwaves would result from the superposition of stratiformlagging deep convective heating (Mapes 2000; Majda etal. 2004). This configuration also causes vertical motionand its associated heating field to be in phase with thestrong upper tropospheric positive temperature pertur-bation from the second (stratiform) mode (see Fig. 10of Haertel and Kiladis 2004).
Vertical tilts of the zonal wind in Figs. 3, 4b, and 4cindicate substantial vertical fluxes of zonal momentumwithin the MJO (e.g., Moncrieff 2004). Lin et al. (2005)have shown that, over the west Pacific, the advection ofperturbation vertical wind shear by the time mean ver-tical motion and advection of the time mean zonal windgradient by the perturbation zonal wind are leadingterms in balancing the zonal pressure gradient in thezonal momentum budget of the MJO. At lower levels,advection of the meridional zonal wind gradient by theperturbation meridional wind, and subgrid-scale fluxes,become important. These subgrid-scale terms are gen-erally ascribed to convective momentum transports,which partly account for the westerly acceleration ofthe WWB region following the peak in convection(Houze et al. 2000; Tung and Yanai 2002). The lack ofsuch strong vertical tilts over the Indian Ocean impliesa fundamentally different interaction between the ba-sic-state flow and vertical motion within the MJO overthat sector.
Interestingly, the vertical structure of the MJO com-pares favorably in many respects with other propagat-ing convectively coupled equatorial waves studied byWheeler et al. (2000). In Kelvin waves (Straub andKiladis 2002), shallow cumulus heating is observed toprecede deep convection and then evolve into strati-form rainfall, but this evolution occurs locally at a muchmore rapid pace than in the MJO, consistent with itsfaster eastward phase speed of around 15 m s�1. In ra-diosonde data, westward tilted structures in t�, u�, andq� show similar phasing to the OLR minimum as in theMJO, with a warm, moist boundary layer within east-erlies ahead of the wave, followed by a lower tropo-
2804 J O U R N A L O F T H E A T M O S P H E R I C S C I E N C E S VOLUME 62

spheric cooling and drying in westerlies following (seeFig. 5 of Straub and Kiladis 2003b). In the Kelvin wave,upper tropospheric warmth is also coincident with theOLR minimum and implied latent heating.
A westward propagating analogy to the Kelvin wave,with a comparable phase speed, is provided by two-dayWIG disturbances during COARE (Haertel and John-son 1998; Haertel and Kiladis 2004), which have a simi-lar evolution in cloud morphology (Takayabu et al.1996; Chen et al. 1996). The temperature structure inthese disturbances and in Kelvin waves is most like thatof the MJO at the Seychelles and Diego Garcia, withdeep convection accompanied by a cooling boundarylayer, strongest cold t� centers at 600–700 and 100 hPa,and warm t� at 250 hPa [cf. Figs. 8a and 8b with Fig. 10of Straub and Kiladis (2002); Fig. 5 of Straub and Kila-dis (2003b); Fig. 4 of Haertel and Kiladis (2004); andwith cross sections in Wheeler et al. (2000)]. In all cases,positive t� in the upper troposphere is in phase with orleading slightly the deepest convection, and is generallyskewed such that it is warmer for a longer period aheadof the wave than behind it. The zonal wind fields inthese other waves also have much in common with theMJO evolution once differences in spatial scale are ac-counted for. In addition, initial low-level moistening,followed by rapid moistening of the entire troposphereand then low-level drying in the cool boundary layerare common features. The combined effect of theboundary layer temperature and moisture signalswould be to favor the development of convection aheadof the waves and suppress instability behind themthrough their effect on the moist static energy budget(e.g., Haertel and Kiladis 2004; Hsu et al. 2004).
The fact that the MJO always propagates eastwardhas led to a number of theoretical models that utilizeKelvin wave dynamics (e.g., Chang 1977; Lau and Peng1987; Wang 1988, 2005; Neelin and Yu 1994). Despitesome common features, one fundamental differencebetween the MJO and Kelvin waves relates to the re-lationship between zonal wind and pressure. In ob-served convectively coupled Kelvin waves, the zonalwind in both the lower and upper troposphere is veryclose to being in phase with the pressure perturbation(Straub and Kiladis 2002, 2003b), as predicted by lineartheory. This relationship also holds for the MJO overthe central and eastern Pacific, where its characteristicsresemble a free Kelvin mode (Milliff and Madden1996). However, Lin et al. (2005) point out that wherethe MJO is strongly coupled to convection, it is a highlyviscous disturbance, in that pressure lags the zonal windby several days, implying the existence of other impor-tant terms in the zonal momentum budget, such aslarge-scale advection and convective momentum trans-
port. As discussed by Emanuel et al. (1994), under theinfluence of a basic state such damping terms can shiftthe relationship between pressure (and thus tempera-ture), and vertical motion in a large-scale convectivelycoupled wave. In the case of the MJO, this shift favorsthe collocation of latent heating and positive tempera-ture perturbation, leading to wave amplification(Straub and Kiladis 2003b; Lin et al. 2005).
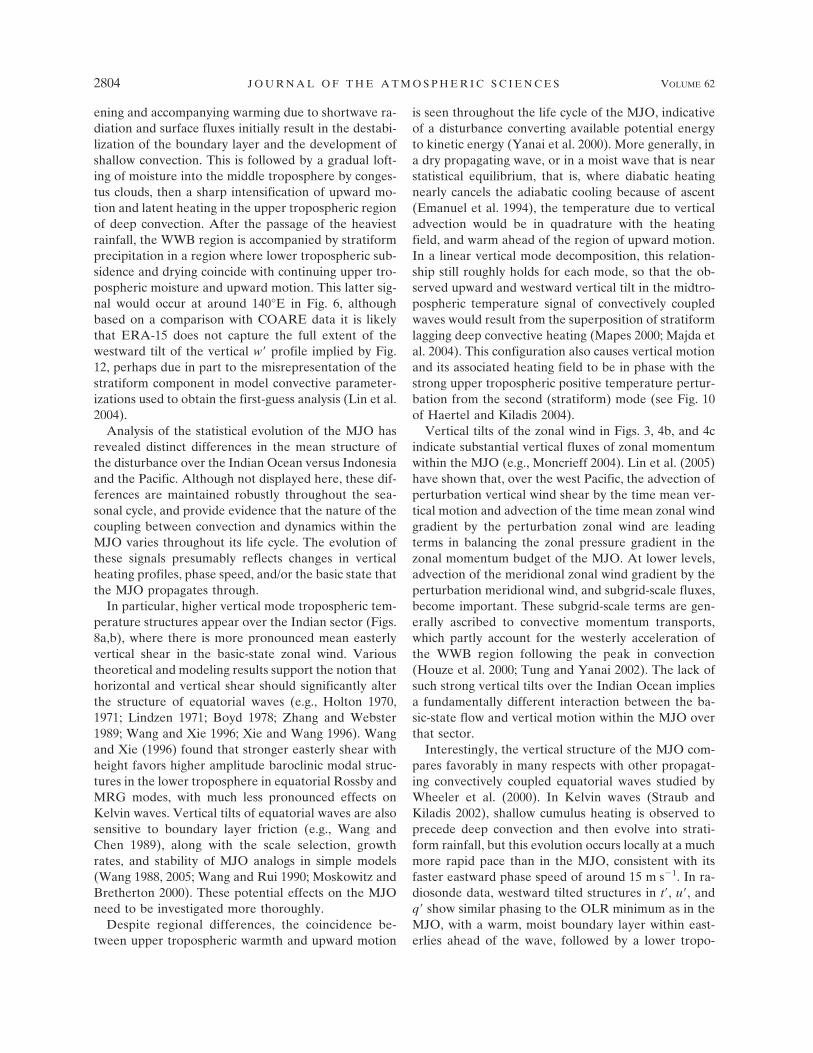
The ubiquity of many salient dynamical features andcloud structures across a broad range of scales in equa-torial waves is perhaps surprising, especially in the caseof the MJO that has dispersion characteristics that donot correspond to a normal mode of the shallow waterequations (Wheeler and Kiladis 1999). This dispersionrelationship describes an isolated wave packet witheastward phase but zero group velocity, once again incontrast to the Kelvin wave where phase and groupspeeds are identical. It is well documented that theMJO envelope is composed of a variety of smaller-scale, higher-frequency disturbances with eastward orwestward phase speeds, (e.g., Nakazawa 1988; Hendonand Liebmann 1994; Straub and Kiladis 2003a). Yetthese higher-frequency waves themselves are also com-posed of individual convective disturbances organizeddown to the MCS scale [see Straub and Kiladis (2002)on Kelvin waves; Chen et al. (1996) and Takayabu et al.(1996) for two-day WIG examples]. One implication isthat the larger convective envelopes tend to be com-posed of more shallow convection along their leadingedges, a preponderance of deep convection in their cen-ters, and then stratiform rainfall along their trailingedges, regardless of scale or propagation direction. Thisis supported statistically by using Tropical RainfallMeasuring Mission (TRMM) Microwave Imager (TMI)data, which estimate convective–stratiform precipita-tion area coverage (Olson et al. 2001). Figure 13 showsthe result of regressing TMI convective fraction againstMJO, Kelvin, and MRG-filtered OLR. In the case ofthe MJO and Kelvin wave, there is a clear bias for theconvective fraction to be higher on the eastern side ofthe OLR envelope, while for the westward propagatingMRG wave, this bias is shifted to the west side. Thelatter shift occurs despite the westward advection ofhigh cloudiness (and thus low OLR) by the basic statethat would presumably occur over the warm pool. Wenote that the displacement of deep convection with re-spect to the wavelength of the disturbance appears tobe less for the MJO and MRG wave than for the Kelvinwave, so it is clear that the degree of skewness is notstrictly tied to the scale of the waves.
Figure 13 suggests some level of self-similar organi-zation in convection over a wide range of scales withinequatorial waves. While this scale invariance may ulti-
AUGUST 2005 K I L A D I S E T A L . 2805
mately be the factor that governs the dynamical simi-larities across the various wave types, it does raise thequestion of how the smaller, higher-frequency distur-bances that make up the MJO conspire to produce thelarge-scale heating profile in Fig. 12. It is likely thatthese individual disturbances all have similar Q1 pro-files based on their temperature structures (Wheeler etal. 2000; Straub and Kiladis 2003b), implying that theprogression of cloud morphology and heating in thesewaves is dictated by fundamental interactions with thelarge-scale circulation (Houze 1989). Whereas a micro-physically based argument for the development ofstratiform precipitation would lead to a prediction ofthe development of top-heavy heating within a fewhours (e.g., Mapes and Houze 1995), it is remarkablethat such a progression is also tied to the scale of indi-vidual waves. As a potentially complicating factor tothis picture, Mapes and Lin (2005) have found evidencefor large geographical differences in inferred heating
profiles in tropical oceanic MCSs. Further progress onunderstanding the scale interactions between the MJOand other convective disturbances will certainly requiremore detailed statistical comparisons of their kinematicand thermodynamical structures along with cloud mor-phology, in conjunction with theoretical and simplemodeling studies.
Acknowledgments. We thank Joseph Biello, AndyMajda, Rol Madden, Brian Mapes, Paul Roundy, Masa-hiro Sugiyama, Baijun Tian, and Bin Wang for stimu-lating conversations on the MJO and equatorial waves.Insightful comments by Jialin Lin, Charles Warner,Chidong Zhang, and an anonymous reviewer greatlyhelped to improve the discussion and presentation ofthe manuscript. This research was supported byNOAA’s Office of Global Programs under GrantGC01-351. The CARDS dataset was obtained fromNOAA’s National Climate Data Center.
FIG. 13. Percentage of deep convective precipitation regressed against (a) MJO-filtered OLR, (b)Kelvin-filtered OLR, and (c) mixed Rossby–gravity wave filtered OLR. The analysis uses 5 yr of TMIdata (see text). OLR contour interval is 10 W m�2, with negative contours dashed. Shaded regionscorrespond to positive perturbations in deep convection, where the two levels of shading representanomalies of 2% and 5%. All shaded pixels are significant at the 95% level.
2806 J O U R N A L O F T H E A T M O S P H E R I C S C I E N C E S VOLUME 62
REFERENCES
Bantzer, C. H., and J. M. Wallace, 1996: Intraseasonal variabilityin tropical mean temperature and precipitation and their re-lation to the tropical 40–50 day oscillation. J. Atmos. Sci., 53,3032–3045.
Biello, J. A., and A. J. Majda, 2005: A new multiscale model forthe Madden–Julian oscillation. J. Atmos. Sci., 62, 1694–1721.
Bladé, I., and D. L. Hartmann, 1993: Tropical intraseasonal oscil-lations in a simple nonlinear model. J. Atmos. Sci., 50, 2922–2939.
Boyd, J. P., 1978: The effects of latitudinal shear on equatorialwaves. Part I: Theory and methods. J. Atmos. Sci., 35, 2236–2258.
Chang, C.-P., 1977: Viscous internal gravity waves and low-frequency oscillations in the Tropics. J. Atmos. Sci., 34, 901–910.
——, and H. Lim, 1988: Kelvin wave-CISK: A possible mecha-nism for the 30–50-day oscillation. J. Atmos. Sci., 45, 1709–1720.
Chao, W. C., 1987: On the origin of the tropical intraseasonaloscillation. J. Atmos. Sci., 44, 1940–1949.
Chen, S. S., R. A. Houze, and B. E. Mapes, 1996: Multiscale vari-ability of deep convection in relation to large-scale circula-tion in TOGA COARE. J. Atmos. Sci., 53, 1380–1409.
Ciesielski, P. E., R. H. Johnson, P. T. Haertel, and J. Wang, 2003:Corrected TOGA COARE sounding humidity data: Impacton diagnosed properties of convection and climate over thewarm pool. J. Climate, 16, 2370–2384.
Dunkerton, T. J., and F. X. Crum, 1995: Eastward propagating2- to 15-day equatorial convection and its relation to thetropical intraseasonal oscillation. J. Geophys. Res., 100,25 781–25 790.
Emanuel, K. A., 1987: An air–sea interaction model of intrasea-sonal oscillations in the Tropics. J. Atmos. Sci., 44, 2324–2340.
——, 1994: Atmospheric Convection. Oxford University Press, 580pp.
——, J. D. Neelin, and C. S. Bretherton, 1994: On large-scale cir-culations in convecting atmospheres. Quart. J. Roy. Meteor.Soc., 120, 1111–1143.
Flatau, M., P. J. Flatau, P. Phoebus, and P. P. Niiler, 1997: Thefeedback between equatorial convection and local radiativeand evaporative processes: The implications for intraseasonaloscillations. J. Atmos. Sci., 54, 2373–2386.
——, ——, J. Schmidt, and G. N. Kiladis, 2003: Delayed onset ofthe 2002 Indian monsoon. Geophys. Res. Lett., 30, 1768,doi:10.1029/2003GL017434.
Fulton, S. R., and W. H. Schubert, 1985: Vertical normal modetransforms: Theory and application. Mon. Wea. Rev., 113,647–658.
Gamache, J. F., and R. A. Houze, 1985: Further analysis of thecomposite wind and thermodynamic structure of the 12 Sep-tember GATE squall line. Mon. Wea. Rev., 113, 1241–1259.
Grabowski, W. W., 2003: MJO-like coherent structures: Sensitiv-ity simulations using the cloud-resolving convection param-eterization (CRCP). J. Atmos. Sci., 60, 847–864.
Gustafson, W. I., and B. C. Weare, 2004: MM5 modeling of theMadden–Julian oscillation in the Indian and west PacificOceans: Model description and control run results. J. Climate,17, 1320–1337.
Gutzler, D. S., G. N. Kiladis, G. A. Meehl, K. M. Weickmann, andM. Wheeler, 1994: The global climate of December 1992–February 1993. Part II: Large-scale variability across the
tropical western Pacific during TOGA COARE. J. Climate,7, 1606–1622.
Haertel, P. T., and R. H. Johnson, 1998: Two-day disturbances inthe equatorial western Pacific. Quart. J. Roy. Meteor. Soc.,124, 615–636.
——, and G. N. Kiladis, 2004: On the dynamics of two-day equa-torial disturbances. J. Atmos. Sci., 61, 2707–2721.
Hayashi, Y., and D. G. Golder, 1993: Tropical 40–50- and 25–30-day oscillations appearing in realistic and idealized GFDLclimate models and the ECMWF dataset. J. Atmos. Sci., 50,464–494.
Hendon, H. H., 1988: A simple model of the 40–50 day oscillation.J. Atmos. Sci., 45, 569–584.
——, and B. Liebmann, 1994: Organization of convection withinthe Madden–Julian oscillation. J. Geophys. Res., 99, 8073–8083.
——, and M. L. Salby, 1994: The life cycle of the Madden–Julianoscillation. J. Atmos. Sci., 51, 2225–2237.
——, and ——, 1996: Planetary-scale circulations forced by in-traseasonal variations of observed convection. J. Atmos. Sci.,53, 1751–1758.
——, C. Zhang, and J. D. Glick, 1999: Interannual variation of theMadden–Julian oscillation during austral summer. J. Climate,12, 2538–2550.
Holton, J. R., 1970: The influence of mean wind shear on thepropagation of Kelvin waves. Tellus, 22, 186–193.
——, 1971: A diagnostic model for equatorial wave disturbances:The role of vertical shear of the mean zonal wind. J. Atmos.Sci., 28, 55–64.
Houze, R. A., 1989: Observed structure of mesoscale convectivesystems and implications for large-scale heating. Quart. J.Roy. Meteor. Soc., 115, 425–461.
——, S. S. Chen, and D. E. Kingsmill, 2000: Convection over thePacific warm pool in relation to the atmospheric Kelvin–Rossby wave. J. Atmos. Sci., 57, 3058–3089.
Hsu, H.-H., C.-H. Weng, and C.-H. Wu, 2004: Contrasting char-acteristics between the northward and eastward propagationof the intraseasonal oscillation during the boreal summer. J.Climate, 17, 727–743.
Hu, Q., and D. A. Randall, 1994: Low-frequency oscillations inradiative–convective systems. J. Atmos. Sci., 51, 1089–1099.
Inness, P. M., and J. M. Slingo, 2003: Simulation of the Madden–Julian oscillation in a coupled general circulation model. PartI: Comparison with observations and an atmosphere-onlyGCM. J. Climate, 16, 345–364.
Johnson, R. H., T. M. Rickenbach, S. A. Rutledge, P. E. Ciesiel-ski, and W. H. Schubert, 1999: Trimodal characteristics oftropical convection. J. Climate, 12, 2397–2418.
Jones, C., and B. C. Weare, 1996: The role of low-level moistureconvergence and ocean latent heat fluxes in the Madden–Julian oscillation: An observational analysis using ISCCPdata and ECMWF analyses. J. Climate, 9, 3086–3140.
Kemball-Cook, S. R., and B. Wang, 2001: Equatorial waves andair–sea interaction in the boreal summer intraseasonal oscil-lation. J. Climate, 14, 2923–2942.
——, and B. C. Weare, 2001: The onset of convection in the Mad-den–Julian oscillation. J. Climate, 14, 780–793.
Kessler, W. S., 2001: EOF representations of the Madden–JulianOscillation and its connection with ENSO. J. Climate, 14,3055–3061.
Kikuchi, K., and Y. N. Takayabu, 2004: The development of or-ganized convection associated with the MJO during TOGACOARE IOP: Trimodal characteristics. Geophys. Res. Lett.,31, L10101, doi:10.1029/2004GL019601.
AUGUST 2005 K I L A D I S E T A L . 2807

Kiladis, G. N., and K. M. Weickmann, 1992: Circulation anoma-lies associated with tropical convection during northern win-ter. Mon. Wea. Rev., 120, 1900–1923.
——, G. A. Meehl, and K. M. Weickmann, 1994: Large-scale cir-culation associated with westerly wind bursts and deep con-vection over the western equatorial Pacific. J. Geophys. Res.,99, 18 527–18 544.
——, K. H. Straub, G. C. Reid, and K. S. Gage, 2001: Aspects ofinterannual and intraseasonal variability of the tropopauseand lower stratosphere. Quart. J. Roy. Meteor. Soc., 127,1961–1984.
Krishnamurti, T. N., D. R. Chakraborty, N. Cubukcu, S. Ste-fanova, and T. S. V. Vijaya Kumar, 2003: A mechanism of theMadden–Julian oscillation based on interactions in the fre-quency domain. Quart. J. Roy. Meteor. Soc., 129, 2559–2590.
Lau, K.-M., and L. Peng, 1987: Origin of low frequency (intrasea-sonal) oscillations in the tropical atmosphere. Part I: Thebasic theory. J. Atmos. Sci., 44, 950–972.
Liebmann, B., and C. A. Smith, 1996: Description of a complete(interpolated) OLR dataset. Bull. Amer. Meteor. Soc., 77,1275–1277.
Lin, J., B. E. Mapes, M. Zhang, and M. Newman, 2004: Stratiformprecipitation, vertical heating profiles, and the Madden–Julian oscillation. J. Atmos. Sci., 61, 296–309.
——, M. Zhang, and B. E. Mapes, 2005: Zonal momentum budgetof the Madden–Julian oscillation: The source and strength ofequivalent linear damping. J. Atmos. Sci., 62, 2172–2188.
Lin, J. W.-B., J. D. Neelin, and N. Zeng, 2000: Maintenance oftropical intraseasonal variability: Impact of evaporation–wind feedback and midlatitude storms. J. Atmos. Sci., 57,2793–2823.
Lin, X., and R. H. Johnson, 1996: Heating, moistening, and rain-fall over the western Pacific warm pool during TOGACOARE. J. Atmos. Sci., 53, 3367–3383.
Lindzen, R. S., 1971: Equatorial planetary-scale waves in shear:Part I. J. Atmos. Sci., 28, 609–622.
——, 2003: The interaction of waves and convection in the Trop-ics. J. Atmos. Sci., 60, 3009–3020.
Livezey, R. E., and W. Y. Chen, 1983: Statistical field significanceand its determination by Monte Carlo techniques. Mon. Wea.Rev., 111, 46–59.
Madden, R., and P. Julian, 1972: Description of global scale cir-culation cells in the Tropics with a 40–50 day period. J. At-mos. Sci., 29, 1109–1123.
——, and ——, 2005: Historical perspective. Intraseasonal Vari-ability in the Atmosphere–Ocean Climate System, W. K.-M.Lau and D. Waliser, Eds., Springer-Praxis, 1–16.
Majda, A. J., and M. G. Shefter, 2001: Models for stratiform in-stability and convectively coupled waves. J. Atmos. Sci., 58,1567–1584.
——, and J. A. Biello, 2004: A multiscale model for tropical in-traseasonal oscillations. Proc. Natl. Acad. Sci., 101, 4736–4741.
——, B. Khouider, G. N. Kiladis, K. H. Straub, and M. G. Shefter,2004: A model for convectively coupled tropical waves: Non-linearity, rotation, and comparison with observations. J. At-mos. Sci., 61, 2188–2205.
Maloney, E. D., and D. L. Hartmann, 1998: Frictional moistureconvergence in a composite life cycle of the Madden–Julianoscillation. J. Climate, 11, 2387–2403.
——, and A. H. Sobel, 2004: Surface fluxes and ocean coupling inthe tropical intraseasonal oscillation. J. Climate, 17, 4368–4386.
Mapes, B. E., 2000: Convective inhibition, subgrid-scale triggeringenergy, and stratiform instability in a toy tropical wavemodel. J. Atmos. Sci., 57, 1515–1535.
——, and R. A. Houze, 1993: Cloud clusters and superclustersover the oceanic warm pool. Mon. Wea. Rev., 121, 1398–1415.
——, and ——, 1995: Diabatic divergence profiles in western Pa-cific mesoscale convective systems. J. Atmos. Sci., 52, 1807–1828.
——, and J. Lin, 2005: Doppler radar observations of mesoscalewind divergences in regions of tropical convection. Mon.Wea. Rev., 133, 1808–1824.
Matthews, A. J., 2000: Propagation mechanisms for the Madden–Julian oscillation. Quart. J. Roy. Meteor. Soc., 126, 2637–2651.
——, B. J. Hoskins, and M. Masutani, 2004: The global responseto tropical heating in the Madden–Julian oscillation duringnorthern winter. Quart. J. Roy. Meteor. Soc., 130, 1991–2012.
Meehl, G. A., R. Lukas, G. N. Kiladis, K. M. Weickmann, A. J.Matthews, and M. Wheeler, 2001: A conceptual frameworkfor time and space scale interactions in the climate system.Climate Dyn., 17, 753–775.
Milliff, R. F., and R. A. Madden, 1996: The existence and verticalstructure of fast, eastward-moving disturbances in the equa-torial troposphere. J. Atmos. Sci., 53, 586–597.
——, T. J. Hoar, and R. A. Madden, 1998: Fast, eastward-movingdisturbances in the surface winds of the equatorial Pacific.Tellus, 50A, 26–41.
Moncrieff, M. W., 2004: Analytic representation of the large-scaleorganization of tropical convection. J. Atmos. Sci., 61, 1521–1538.
Moskowitz, B. M., and C. S. Bretherton, 2000: An analysis of fric-tional feedback on a moist equatorial Kelvin mode. J. Atmos.Sci., 57, 2188–2206.
Mote, P. W., H. L. Clark, T. J. Dunkerton, R. S. Harwood, andH. C. Pumphrey, 2000: Intraseasonal variations of water va-por in the tropical upper troposphere and tropopause region.J. Geophys. Res., 105, 17 457–17 470.
Myers, D. S., and D. E. Waliser, 2003: Three-dimensional watervapor and cloud variations associated with the Madden–Julian oscillation during Northern Hemisphere winter. J. Cli-mate, 16, 929–950.
Nakazawa, T., 1988: Tropical super clusters within intraseasonalvariations over the western Pacific. J. Meteor. Soc. Japan, 66,823–839.
Neelin, J. D., and J.-Y. Yu, 1994: Modes of tropical variabilityunder convective adjustment and the Madden–Julian oscilla-tion. Part I: Analytical theory. J. Atmos. Sci., 51, 1876–1894.
——, I. M. Held, and K. H. Cook, 1987: Evaporation-wind feed-back and low-frequency variability in the tropical atmo-sphere. J. Atmos. Sci., 44, 2341–2348.
Olson, W. S., Y. Hong, C. D. Kummerow, and J. Turk, 2001: Atexture-polarization method for estimating convective–stratiform precipitation are a coverage from passive micro-wave radiometer data. J. Appl. Meteor., 40, 1577–1591.
Randall, D., M. Khairoutdinov, A. Arakawa, and W. Grabowski,2003: Breaking the cloud parameterization deadlock. Bull.Amer. Meteor. Soc., 84, 1547–1564.
Raymond, D. J., 2001: A new model of the Madden–Julian oscil-lation. J. Atmos. Sci., 58, 2807–2819.
Reed, R. J., D. C. Norquist, and E. E. Recker, 1977: The structureand properties of African wave disturbances as observed dur-ing Phase III of GATE. Mon. Wea. Rev., 105, 317–333.
Roundy, P. E., and W. M. Frank, 2004a: Effects of low-frequency
2808 J O U R N A L O F T H E A T M O S P H E R I C S C I E N C E S VOLUME 62

wave interactions on intraseasonal oscillations. J. Atmos. Sci.,61, 3025–3040.
——, and ——, 2004b: Applications of a multiple linear regressionmodel to the analysis of relationships between eastward- andwestward-moving intraseasonal modes. J. Atmos. Sci., 61,3041–3048.
Rui, H., and B. Wang, 1990: Development characteristics anddynamic structure of tropical intraseasonal convectionanomalies. J. Atmos. Sci., 47, 357–379.
Salby, M. L., and H. H. Hendon, 1994: Intraseasonal behavior ofclouds, winds, and temperature in the Tropics. J. Atmos. Sci.,51, 2207–2224.
——, R. Garcia, and H. H. Hendon, 1994: Planetary-scale circu-lations in the presence of climatological and wave-inducedheating. J. Atmos. Sci., 51, 2344–2367.
Sassi, F., M. Salby, H. C. Pumphrey, and W. G. Read, 2002: In-fluence of the Madden–Julian oscillation on upper tropo-spheric humidity. J. Geophys. Res., 107, 4681, doi:10.1029/2001JD001331.
Seo, K.-H., and K.-Y. Kim, 2003: Propagation and initiationmechanisms of the Madden–Julian oscillation. J. Geophys.Res., 108, 4384, doi:10.1029/2002JD002876.
Sherwood, S. C., and R. Wahrlich, 1999: Observed evolution oftropical deep convective events and their environment. Mon.Wea. Rev., 127, 1777–1795.
——, T. Horinouchi, and H. A. Zeleznik, 2003: Convective impacton temperatures observed near the tropical tropopause. J.Atmos. Sci., 60, 1847–1856.
Shinoda, T., H. H. Hendon, and J. Glick, 1998: Intraseasonal vari-ability of surface fluxes and sea surface temperature in thetropical western Pacific and Indian Oceans. J. Climate, 11,1685–1702.
Sperber, K. R., 2003: Propagation and the vertical structure of theMadden–Julian oscillation. Mon. Wea. Rev., 131, 3018–3037.
——, J. M. Slingo, P. M. Inness, and W. K.-M. Lau, 1997: On themaintenance and initiation of the intraseasonal oscillation inthe NCEP/NCAR reanalysis and in the GLA and UKMOAMIP simulations. Climate Dyn., 13, 769–795.
Straub, K. H., and G. N. Kiladis, 2002: Observations of a convec-tively coupled Kelvin wave in the eastern Pacific ITCZ. J.Atmos. Sci., 59, 30–53.
——, and ——, 2003a: Interactions between the boreal summerintraseasonal oscillation and higher frequency tropical waveactivity. Mon. Wea. Rev., 131, 945–960.
——, and ——, 2003b: The observed structure of convectivelycoupled Kelvin waves: Comparison with simple models ofcoupled wave instability. J. Atmos. Sci., 60, 1655–1668.
Takayabu, Y. N., 1994: Large-scale cloud disturbances associatedwith equatorial waves. Part II: Westward propagating inertio-gravity waves. J. Meteor. Soc. Japan, 72, 451–465.
——, K.-M. Lau, and C.-H. Sui, 1996: Observation of a quasi-2-day wave during TOGA COARE. Mon. Wea. Rev., 124,1892–1913.
Tung, W.-W., and M. Yanai, 2002: Convective momentum trans-port observed during the TOGA COARE IOP. Part I: Gen-eral features. J. Atmos. Sci., 59, 1857–1871.
Waliser, D. E., C. Jones, J.-K. Schemm, and N. E. Graham, 1999:A statistical extended-range tropical forecast model based onthe slow evolution of the Madden–Julian oscillation. J. Cli-mate, 12, 1918–1939.
Wang, B., 1988: Dynamics of tropical low-frequency waves: Ananalysis of the moist Kelvin wave. J. Atmos. Sci., 45, 2051–2065.
——, 2005: Theory. Intraseasonal Variability in the Atmosphere–Ocean Climate System, W. K.-M. Lau and D. Waliser, Eds.,Springer-Praxis, 307–351.
——, and J. Chen, 1989: On the zonal-scale selection and verticalstructure of equatorial intraseasonal waves. Quart. J. Roy.Meteor. Soc., 115, 1301–1323.
——, and H. Rui, 1990: Dynamics of the moist Kelvin–Rossbywave on an equatorial �-plane. J. Atmos. Sci., 47, 397–413.
——, and X. Xie, 1996: Low-frequency equatorial waves in verti-cally sheared zonal flow. Part I: Stable waves. J. Atmos. Sci.,53, 449–467.
Wang, W., and M. E. Schlesinger, 1999: The dependence on con-vection parameterization of the tropical intraseasonal oscil-lation simulated by the UIUC 11-layer atmospheric GCM. J.Climate, 12, 1423–1457.
Weare, B. C., 2003: Composite singular value decompositionanalysis of moisture variations associated with the Madden–Julian oscillation. J. Climate, 16, 3779–3792.
Weickmann, K. M., 1983: Intraseasonal circulation and outgoinglongwave radiation modes during Northern Hemisphere win-ter. Mon. Wea. Rev., 111, 1838–1858.
——, G. R. Lussky, and J. E. Kutzbach, 1985: Intraseasonal (30–60 day) fluctuations of outgoing longwave radiation and 250mb streamfunction during northern winter. Mon. Wea. Rev.,113, 941–961.
——, G. N. Kiladis, and P. D. Sardeshmukh, 1997: The dynamicsof intraseasonal atmospheric angular momentum oscillations.J. Atmos. Sci., 54, 1445–1461.
Wheeler, M. C., and H. H. Hendon, 2004: An all-season real-timemultivariate MJO index: Development of an index for moni-toring and prediction. Mon. Wea. Rev., 132, 1917–1932.
——, and G. N. Kiladis, 1999: Convectively coupled equatorialwaves: Analysis of clouds in the wavenumber–frequency do-main. J. Atmos. Sci., 56, 374–399.
——, ——, and P. J. Webster, 2000: Large-scale dynamical fieldsassociated with convectively coupled equatorial waves. J. At-mos. Sci., 57, 613–640.
Woolnough, S. J., J. M. Slingo, and B. J. Hoskins, 2000: The rela-tionship between convection and sea surface temperature onintraseasonal time scales. J. Climate, 13, 2086–2104.
Xie, X., and B. Wang, 1996: Low-frequency equatorial waves invertically sheared zonal flow. Part II: Unstable waves. J. At-mos. Sci., 53, 3589–3605.
Yanai, M., S. Esbensen, and J. Chu, 1973: Determination of bulkproperties of tropical cloud clusters from large-scale heat andmoisture budgets. J. Atmos. Sci., 30, 611–627.
——, B. Chen, and W.-W. Tung, 2000: The Madden–Julian oscil-lation observed during the TOGA COARE IOP: Globalview. J. Atmos. Sci., 57, 2374–2396.
Zhang, C., 1996: Atmospheric intraseasonal variability at the sur-face in the tropical western Pacific Ocean. J. Atmos. Sci., 53,739–758.
——, 2005: The Madden–Julian oscillation. Rev. Geophys., inpress.
——, and P. J. Webster, 1989: Effects of zonal flows on equato-rially trapped waves. J. Atmos. Sci., 46, 3632–3652.
——, and M. J. McPhaden, 2000: Intraseasonal surface cooling inthe equatorial western Pacific. J. Climate, 13, 2261–2276.
——, and S. P. Anderson, 2003: Sensitivity of intraseasonal per-turbation in SST to the structure of the MJO. J. Atmos. Sci.,60, 2196–2207.
——, and M. Dong, 2004: Seasonality in the Madden–Julian os-cillation. J. Climate, 17, 3169–3180.
AUGUST 2005 K I L A D I S E T A L . 2809