zn 670 sm-7 - uniwersytet szczeciński · from monopoly to the liberalization of postal services 11...
TRANSCRIPT

U N I V E R S I T Y O F S Z C Z E C I N
SCIENTIFIC JOURNAL
No. 670
SERVICE MANAGEMENT
Vol. 7
S Z C Z E C I N 2011
Board of EditorsUrszula Chęcińska, Inga Iwasiów, Danuta Kopycińska, Izabela Kowalska-Paszt
Piotr Niedzielski, Ewa Szuszkiewicz, Dariusz WysockiEdward Włodarczyk – Chair
Aleksander Panasiuk – Chair of the Senat Commision for Periodicals and PublishingEdyta Łongiewska-Wijas – Executive Editor of the Szczecin University Press
RefereesDorota Korenik (Wrocław University of Economics)
Stanisław Korenik (Wrocław University of Economics)Barbara Kos (University of Economics in Katowice)
Bernard F. Kubiak (University of Gdańsk)Elżbieta Marciszewska (Warsaw School of Economics)
Beata Meyer (University of Szczecin)Mirosława Pluta-Olearnik (University of Business and Commerce in Wrocław)
Kazimierz Rogoziński (Poznań University of Economics)
Scientific BoardMarianna Daszkowska (Gdańsk University of Technology)
Kazimierz Kłosiński (John Paul II Catholic University of Lublin)Jolanta Mazur (Warsaw School of Economics)
Piotr Niedzielski (University of Szczecin) – ChairAleksander Panasiuk (University of Szczecin)
Mirosława Pluta-Olearnik (University of Business and Commerce in Wrocław)Kazimierz Rogoziński (Poznań University of Economics)
Aniela Styś (Wrocław University of Economics)
Scientific EditorAleksander Panasiuk
Editorial ManagerAgnieszka Sawińska, Adam Pawlicz
Text designWiesława Mazurkiewicz
ProofreadingRenata Bacik
The full version of publication is on the website www.wzieu.pl
© Copyright by the University of Szczecin, Szczecin 2011
ISSN 1640-6818ISSN 1898-0511
SZCZECIN UNIVERSITY PRESS
Edition I. Publishing sheet size 10.0. Printing sheet size 12.4. Format B5.
Printed 50 copies
TABLE OF CONTENT
CHAPTER 1. SOCIO-ECONOMIC POLICY IN SERVICES
ROMAN CZAPLEWSKI, JACEK BUKO – From monopoly
to the liberalization of Postal Services.................................................. 7
MATYLDA GWOŹDZICKA-PIOTROWSKA – European travel regulation
overview – legal perspective ................................................................ 19
BARBARA KOS, KAROLINA LUBIENIECKA-KOCOŃ – The chosen
areas of transport system integration in Europe ................................... 29
BEATA LUBOS – Towards policy supporting innovation in service sector
in the EU ............................................................................................... 41
PAWEŁ NIEDZIÓŁKA – Post-crisis international co-operation within
banking regulations and its implications for Poland............................. 53
OLGA NOSOVA – The economic convergence or divergence processes
in the Ukrainian regions........................................................................ 63
GRAŻYNA WĘGRZYN – The influence of the world crisis
on the employment in service sector in European Union ..................... 77
CHAPTER 2. STRATEGIC MANAGEMENT
AGNIESZKA BRETYN – Global tendencies and strategic changes
of cooperative banks in Poland ............................................................. 91
KATARZYNA JASIŃSKA – Growth of ICT services in the context
of developing competition strategy on the market
of telecommunication ........................................................................... 99
CHAPTER 3. FINANCIAL MANAGEMENT
EWA CHRZANOWSKA – Offshore pensions as an alternative way
of saving for british emigrants. A lesson for Poland? ........................... 113
AGNIESZKA CZAJKOWSKA – The technology credit as a method
of financing innovative technology of micro, small
and medium-sized enterprises............................................................... 127
4 Table of content
ANDRZEJ GRZEBIENIAK – Changes in Polish reinsurance market
in the insurance sector in 1991–2009 ................................................... 141
GABRIELA GURGUL – Market structure analysis of electronic payment
instruments in 1998–2010 .................................................................... 153
IZABELA KIDACKA – Evolution of financing and financial
intermediaries function on securities market ........................................ 163
CHAPTER 4. MARKETING MANAGEMENT
MAŁGORZATA GRZEGORCZYK, GRZEGORZ MAZUREK – Customer
engagement in on-line services and companies’ marketing responses
towards the concept .............................................................................. 177
IZABELA SOWA – Segmentation on the service market as an expression
of differentiation of Polish households ................................................. 187

Chapter I
SOCIO-ECONOMIC POLICY
IN SERVICES


SCIENTIFIC JOURNAL
NR 670 SERVICE MANAGEMENT Vol. 7 2011
ROMAN CZAPLEWSKI
JACEK BUKO
University of Szczecin
FROM MONOPOLY TO THE LIBERALIZATION OF POSTAL SERVICES
Assuming that competition is propitious for business and the economy,
monopoly markets should only be created in special situations. Government-sup-
ported monopoly markets can by categorized as follows:
‒ markets with fundamentally unreliable competition,
‒ markets with noticeably unreliable competition, but which can be
im proved.1
According to the literature, there are three causes of fundamentally unre-
liable competition which make competition difficult, if not impossible:
‒ functional consolidated market structures which allow for the use of econ-
omies of scale and benefits of range activity,
‒ functional markets with inconstant equilibrium which can lead to critical
situations (for example high unemployment),
‒ services pertaining to the public good.
Economies of scale occur when increases in production cause the unit prices
of production to decline. Benefits of range occur when declines in unit prices
result from increases in product assortment. In markets which do not fully utilize
economies of scale and benefits of range, new enterprises have a unique oppor-
1 C. Christmann, Liberalisierung von Monopolmärkten, Peter Lang, Frankfurt am Main, Berlin,
Bern, Bruxelles, New York, Oxford, Wien 2004, p. 6.
8 Roman Czaplewski, Jacek Buko
tunity to increase their production and assortment of goods, thereby lowering their
unit prices and gaining an advantage over the competition.2 In extreme situations,
this process can lead to a minimization of unit costs according to the capacity of
the market, such that functionality becomes profitable for one enterprise alone.
Such situations are typical for natural monopolies, in which the achievement
of low unit prices protects the market against (or becomes a significant barrier
against) competition.
Situations of markets with inconstant equilibrium lead to an unstable market
economy. This instability should be understood not only as a failure to approach
stability, but also as the possibility of developing in a more or less inefficient
manner.
Public good are necessarily provided equally to all consumers. Use of them
by one consumer cannot limit the use of them by others. They must be provided
for society as a whole. The classic example is national security, the same level
of which is provided for all citizens in the country. “Every citizen can evaluate
it differently-one can want it more, others less-but everybody has it in the same
degree.”3
Public good has political roots. It is difficult to find a common formula for the
determination of public duties. Almost every generation shows some distinctness
in its philosophy of life, according to which they determine the type, dimension,
and quality of public duties. The most important are free (or affordable), unlimited,
reliable, and constant services in education, culture, infrastructure, and basic pro-
visions, including access to information.4
Monopolies may be preferable for reasons other than the previously men-
tioned causes of fundamentally unreliable competition. Two situations are par-
ticularly noteworthy:
‒ it is determined that a monopoly can have a multi-segmented market struc-
ture only when some of its segments are similar to a natural monopoly;
2 H. Bartling, F. Luzius, Grundzüge der Volkswirtschaftslehre, 15 Auflage, Verlag Vahlen, Mün-
chen 2004, pp. 112–113.
3 J.R. Varian, Mikroekonomia, Wydawnictwo Naukowe PWN, Warszawa 1997, p. 599. [„Jeśli
dobro publiczne może być dostarczane w zmiennych ilościach, to warunkiem koniecznym, aby dana
ilość była efektywna w rozumieniu Pareta, jest wymaganie, by suma krańcowych skłonności do
płacenia (krańcowych stóp substytucji) równała się kosztowi krańcowemu”, p. 621].
4 P. Eichhorn, Neue Organisationsmodelle auf dem Prüfstand – Leistungsanreize um jeden
Preis?, [in:] Reformmodell Verwaltung, DBB Verlag GmbH, Bad Kissingen 1995, pp. 59–60.

9From monopoly to the liberalization of Postal Services
‒ political decisions acknowledge some markets as monopolies based on
public interests.
The Postal Service market is an interesting example of a structure which was
initially converted from a competition market to a monopoly, then liberalized to
gradually demonopolize and exist on an open postal market.
In what follows, the present paper discusses potential causes:
‒ of monopolies being introduced in areas of the postal service market while
it was in its early stages of development;
‒ of gradually liberalizing the postal service market as a contemporary way
of progressively limiting monopolies.
In the beginning, messages were sent by independent curriers who carried
singular mail. As the demand for this kind of service gradually grew, some countries
created postal systems. Postal services began in Europe between the end of the
fifteenth and eighteenth centuries. “Next to money and the army, the post was
a well-kept aspect of sovereignty in newly established countries.”5 The important
role of the postal service was such that “in the mid-eighteenth century, there was
established a national monopoly for the postal service.”6
For a variety of reasons, the initially free postal service became a monopoly.
Following R. Harris, Queen Elizabeth I can be regarded as a creator of a postal
monopoly. She wanted to know about private messages which where sent abroad,
particularly to France. Thus, the first reason for a postal service monopoly may
have been the desire to reveal private correspondence. Of course, while this may
explain the origin of the postal monopoly in Great Britain, it does not explain the
persistence of the monopoly or its introduction in other countries.7
There were different reasons for introducing and keeping a postal monopoly
in other countries, such as:
‒ good source of income for national budgets;
‒ political and social role of information and mail;
‒ the postal service was thought of as a natural monopoly.
5 A. Mielcarek, Poczta i telekomunikacja w prowincji pomorskiej na tle rozwoju łączności w Prusach i Niemczech w latach 1815–1914, Wydawnictwo Naukowe Uniwersytetu Szczecińskie-
go, Szczecin 2004, p. 38.
6 W. Behringer, Thurn und Taxis. Die Geschichte ihrer Post und ihrer Unternehmen, München–
Zürich 1990, p. 138.
7 M. Jojarth, Die Qualität der Versorgung auf dem offenen Postmarkt und die Gewährleistung einer Grundversorgung: Ein Konzept zur Reform des Postmarktes in der Schweiz, Difo-Druck
GmbH, Bamberg 2003, Dissertation der Universität St. Galen Nr. 2812, p. 137.

10 Roman Czaplewski, Jacek Buko
In the past, supporters of the postal monopoly often emphasized the need
to keep it as a source of national income. For example, R. Harris says that in the
eighteenth century, “the British postal service made a profit which covered the
costs of wars with France up to the time of the battle of Waterloo.”8 For another
example, M. Bladh points out that in seventeenth-century Sweden there were
services which utilized civil servants or which were temporarily transferred to
the private sector for profit.9 In Germany, keeping the postal monopoly was also
connected to the financial situation.10
The high value placed on information was another important cause of keeping
the postal market monopoly. Countries wanted to ensure the safety and privacy
of communications. In addition, postal services were important for the efficient
communication of governmental decisions.11
The importance placed on secure information transmission explains the strict
organization of the postal system. Functions were established by:
‒ directly involving the government in the production process of the postal
service,
‒ legislating functions in other postal areas.
The direct involvement of government in the production process of the postal
service lies in:
‒ governmental control of postal units to trigger needed economic develop-
ment or, occasionally, because they are unprofitable;
‒ governmental creation of new postal units necessary for economic struc-
ture;
‒ governmental subsidies for segments of the postal market which cannot
produce enough profits but which are necessary for the economy.
8 R. Harris, Regulacje prawne Unii Europejskiej dla telekomunikacji [European Union legal
regulations in telecommunications], presented at the seminar Deregulacja monopoli naturalnych na przykładzie rynku telekomunikacyjnego [Deregulation of natural monopolies: The example of
telecommunications], Warszawa 1999, p. 60.
9 M. Bladh, The Political Economy and the Natura Monopoly of the Postal Service: the Swedish case, “The Journal of Interdisciplinary Economics” 2001, vol. 12, p. 232.
10 E. Hermann, Die Deutsche Bundespost, Schriften zur öffentlichen Verwaltung und Öffentlichen Wirtschaft, Baden-Baden 1986, Bd. 99, cited by K. Mueller, Die Postdienste aus der Sicht der Insti-tutionenökonomik, Peter Lang, Frankfurt am Main 1997, p. 452.
11 K. Duell, D. Sauer, I. Schneller, N. Altmann, Öffentliche Dienstleistungen und technischer Fortschritt, Forschungsberichte aus dem Institut für Sozialwissenschaftliche Forschung, Aspekte
Verlag, München 1976, Band I, p. 4.

11From monopoly to the liberalization of Postal Services
The relevant power of government lies in its legislative functions, in which
mandatory laws are established. For example, these functions have been used to
regulate:
‒ the size and mutual independence of postal economy units,
‒ the specialization of postal economy units by defining basic ranges of
functional units,
‒ cooperation by describing procedures for postal economy units.
It should be emphasized that governmental management was (and sometimes
still is) mainly concerned with the sending of information, as opposed to:
‒ the sending of materials goods,
‒ money transfers,
‒ eventually, passenger travel.
The post office’s accomplishment in satisfying these three duties is the result
of social and economic factors, and not politics. This situation was favorable for
the creation of open markets which allowed different economic units to function
competitively.
Given the government’s unique focus on the sending of information, only
that segment of the postal market concerned with the sending of information was
given:
‒ specialized administrative regulations regarding access to this segment of
the market;
‒ specialized administrative regulations regarding the rules for the function-
ing of this segment of the market.
These regulations were meant to explain not only the social, political and
economic importance of the mail segment of the postal market, but also special
factors which were sometimes barriers to accessing the mail information market.
Among the special features were:
‒ the need to invest significant capital,
‒ profits due to economies of large-scale and benefits of range,
‒ the importance of large economic units which provide service for large
geographic areas.
It should be remembered that these three factors do not require a monopoly
structure. Ultimately, monopolies should be the result of economic situations, so
that markets are not closed to competition without economic and social analyses.
Until the seventies, twentieth-century political theory had established that,
due to the necessity of the postal service for citizens, this service should be

12 Roman Czaplewski, Jacek Buko
evaluated according to social criteria. This led to thoughts about the necessity
of a postal monopoly and the need to keep it organized, as well as economic and
legal considerations.12
Political reasons for keeping the postal service a monopoly:
‒ to legislate postal duties, strongly emphasizing the need to observe social
duties and policy;
‒ to maintain direct governmental commitment to the postal service market,
such as the creation of large, national enterprises intended primarily for
public use, without economic restrictions, and with special tax policies to
help their financial situation.
This can be interpreted in different ways. From an economic point of view,
for example, it can be considered as a possibility:
‒ of stopping the tendency to maximize profits,
‒ of using low prices to guarantee all citizens access to postal products.
From a legal point of view, however, it demonstrates a government’s obli-
gation to guarantee proper services to its citizens.13
According to analyses of the legislation of postal duties in German postal law,
postal service duties were catered to individuals, as evidenced by the emphasis
placed on social duties.
The fact that written mail was dominated by personal correspondence
confirms the hypothesis that the postal service was primarily for private indi-
viduals. In this situation:
‒ the social obligation of postal service was first to improve access to postal
services for individual citizens,
‒ different regulations for businesses were possible, but this kind of mail and
the potential high costs of introducing the service could make it unprofit-
able.
Over the years, private correspondence was less plentiful, and business
mailings became dominant. Postal regulations which had once made it more
accessible for private people, and which had social importance, started to be used
by businesses which were functioning on markets rules, directed towards making
profits. This situation was not a goal of the creators of the postal service, which
12 K. Mueller, op.cit., p. 453.
13 J. Plagemann, Gemeinwirtschaftliche Auflagen der Deutschen Bundespost in Monopol- und Wettbewerbsbereichen, Wissenschaftliches Institut für Kommunikationsdienste, Diskussionsbeiträ-
ge zur Telekommunikationsforschung Nr. 35, Bad Honnef 1988, p. 3.
13From monopoly to the liberalization of Postal Services
was intended to be a tool for social policy. Given the new direction of thinking in
this new situation, new ways of treating the postal service for private people and
enterprises needed to be found.
The important role politics played in the creation of the postal service market
shows how countries were directly involved in the postal service. For example,
even countries with traditional market economies created national postal organi-
zations which were given the status of public utilities.
In the service of political aims, public utilities can be obligated to perform
tasks which conflict with economic requirements. For example:
‒ executing investments which are not profitable from certain organizational
points of view,
‒ employing more people than production requires,
‒ lowering prices for some groups for social reasons,
‒ keeping services which are not profitable.
The imposition of social and political aims on public utilities was comfortable
for authorities who made economic policy, because:
‒ policy-maker commands were sufficient to produce certain actions,
‒ usually parliament did not need to approve decisions, even though they
influence the public budget,
‒ using this tool was very easy, and economical factors were not always
considered; more effective solutions were not sought after.
Connected to the functionality of postal service operators as a public utility,
two important duties for those organizations were established:
‒ duties of providing certain service,
‒ duties of tariff.
The first requirement is connected to offering service for all clients: The postal
service has an obligation to provide service to everybody who is interested and
who meets certain conditions. Realizing this requirement involves many tasks,
such as keeping postal equipment in good condition and the development and
modernization of production potential. It also means providing postal service in
all areas, even where doing so is not profitable.
One requirement of providing service is connected with the fee for the service:
demand for the postal service obviously depends partially on prices. That is why
the post office must provide some needed services with zero tariff, and others
with higher monopoly prices. This demonstrates the importance of the second
requirement – duties of tariff.
14 Roman Czaplewski, Jacek Buko
The implementation of national postal service tariff duties meant using the
same tariff for the whole territory (area uniformity) at all times (time uniformity)
and publishing them, guaranteeing equal use for all customers.
The unification of tariffs for national postal services requires a single price
for a particular service regardless of where mail is sent or where it is received.
A good example of this unification is the single fee for sending letters within the
country.
Estimating the consequences of tariff unification is not a simple task.
According to some authors, unification is convenient for peripheral areas. Other
authors believe that tariff unification does not encourage a suitable organization
for post offices in such areas, and that as a consequence peripheral areas are dif-
ficult to connect with.14
Time uniformity entails using the same fees for certain services regardless
of the time when the order was taken. Considering that demand fluctuates over
time, this solution is not good for controlling peak periods in demand. The postal
service needs to have a reserve of production potential. To comply with the post
office’s legal obligation to provide service to all clients, production potential must
be maintained to satisfy the demand in peak times.
Time uniformity (which applies to letter fees and package fees) has sup-
porters as well as opponents. Supporters argue:
‒ no client discrimination,
‒ the importance of pursuing social policy.
Opponents of time uniformity may discuss the last point, at least. While social
policy may be necessary, controls on postal service prices may not be a good way
of pursuing it. Against the first point, raising the rate for all clients during peak
periods does not entail discrimination. As for the second point, even in cases where
there is no possibility of changing the fluctuation of demand, introducing higher
fees during this time is reasonable, because the costs of postal service are higher.
The statutory requirement to provide service and the tariff requirement work
together, supplementing and supporting each other. Without tariff limitations to
create fees for the postal service, the post could not comply with its duties to
provide service. For example, it could not serve clients who were economically
unprofitable. If it were not for the obligation to provide universal service, tariff
14 D. Schmidtchen, Gebührenpolitik der DBP und Ordnungspolitik, [in:] Die Deutsche Bunds-post im Spannungsfeld der Wirtschaftspolitik, R. v. Decker’s Verlag, G. Schenk, Heidelberg 1987,
p. 245.
15From monopoly to the liberalization of Postal Services
obligations could have been eliminated by stopping or limiting service to unprof-
itable areas.
Without the obligation of universal service, tariff obligations could be elim-
inated by limiting or stopping service in unprofitable areas.
It should be mentioned that, in addition to the two previously mentioned
basic obligations, national postal operators often have different duties with social
dimensions. For example, postal operators are obligated to offer free mail service
for the blind. The obligations of national postal operators in the way of providing
service are results of legislation and traditional ways of understanding duties of
the post service.
The final argument supporting a postal monopoly is treating postal service
as a natural monopoly. If the postal service were a natural monopoly, it should be
possible to observe economies of scale and benefits of range. However, empirical
analysis has not confirmed those occurrences in the postal market.
Attempts to verify that the postal service is a natural monopoly are con-
nected with American analyses involving economic estimations of the cost of
postal production which took place in the sixties. Research done in 200 American
offices showed that the optimal size of postal structures, from an economic point
of view, are organizations with 1,400 employees.15 In the eighties, more research
was carried out, more precisely about establishing economies of scale in the postal
service process.16 The results showed that economies of scale appeared only in
mail delivery and depended on building density and population size in researched
areas. In others areas of the postal process, economies of scale were not detected.
In economic assessments of natural monopolies, constancy is important.
In terms of the effectiveness of production and allocation, market access is unde-
sirable if a monopoly is efficient. However, the subadditivity cost function makes
it impossible to describe this constancy. This is why, without the whole picture of
the provider’s cost function and demand function, it cannot be determined whether
or not a productive natural monopoly is constant. As a consequence of subsidies,
every natural monopoly loses importance and can exist only with governmental
support. Analysis of most European postal organizations confirms that transport
15 L. Merewitz, Costs and Returns to Scale in U.S. Post Offices, “Journal of the American Statis-
tical Association” 1971, vol. 66, no. 335, pp. 504–509.
16 G. Knieps, Dienstleistungspolitik der DBP und Ordnungspolitik, [in:] Die Deutsche Bundes-post im Spannungsfeld der Wirtschaftspolitik, R. v. Decker’s Verlag, G. Schenck, Heidelberg 1987,
p. 158.

16 Roman Czaplewski, Jacek Buko
services, curirers, bank services, and telecomunication services are all compe-
tition for a postal service monopoly.17
The current social and economic sitation shows that jutifications for a postal
monopoly are getting weaker; for example, because:
‒ progressive development of competition on postal market, also in the mail
letters segment, which was traditionally central to the monopolistic direc-
tion;
‒ growth of competition for government subsidies.
Various interactions are responsible for the development of competition in
the strongly monopolized mail letter segment, such as:
‒ gradual limitation of legislated monopoly as a result of consumer require-
ments for better postal service and increased pressure on enterprises inter-
ested in the postal market
‒ the opening of the market in some countries where governments acknowl-
edge economic and social reasons for this solution.
The direction of development makes it difficult to find economic reasons to
keep a postal monopoly. However, some obstacles and issues remain, such as:
‒ the meaning of the postal service for society and the economy
‒ the unique organization of postal service production, as well as the neces-
sity of having a postal network.
This is partly political decision, because:
‒ there are political dimensions to information and the institutions which
send it,
‒ some politicians manipulate public impressions of the nature and impor-
tance of the postal service;
‒ there can be a strong influence of monopoly operators on politicians to
maintain the current situation or to impede changes.
Some factors are often overlooked:
‒ business clients interested in a higher quality postal service for social and
economic needs,
‒ private enterprises interested in postal market which had been closed to
them as a result of political decisions,
17 See: U. Stumpf, Is there a place for reserved services?, [in:] Mail and Express Services: Meet-ing European User Needs, IBC Technical Services Ltd in Association with Mail and Express Ser-
vices Users’ Association (MESUA), Amsterdam 1990.
17From monopoly to the liberalization of Postal Services
‒ technological developments which increased the possibilities and eco-
nomic profitability of the postal market.
Nevertheless, a postal monopoly brings benefits for:
‒ postal operators which maintain a strong position on the monopoly mar-
ket,
‒ politicians who can manipulate postal operator activity.
This is a comfortable situation for postal operators and politicians, because
even in a limited monopoly where economic and political interests are connected,
neither the operator nor the politician is responsible for economic results.
The opening of the postal market has been observably impeded by a lack of
pro-active operators and politicians, which shows that thinking about the postal
service is still conservative.
OD MONOPOLU DO LIBERALIZACJI
ŚWIADCZENIA USŁUG POCZTOWYCH
Streszczenie
Rynek usług pocztowych jest interesującym przykładem struktury, która wpierw
została przekształcona z rynku konkurencyjnego w monopol, a następnie poddana została
procesom liberalizacji, prowadzącym do stopniowego odchodzenia od rozwiązań mono-
polistycznych i przechodzenia do w pełni otwartego rynku pocztowego. Obserwowane
procesy, dowodzące również współcześnie aktywnego angażowania się operatorów zasie-
działych i polityków w działania spowalniające pełne otwarcie rynku usług pocztowych,
wskazują na ciągłą znaczącą rolę sił konserwatywnie podchodzących do działalności
pocztowej. Dowodzą one zarazem, że konkretne rozstrzygnięcia polityczne ukierunko-
wane są przede wszystkim na osiąganie tego, co społecznie możliwe, a nie tego, co eko-
nomicznie właściwe.

SCIENTIFIC JOURNAL
NR 670 SERVICE MANAGEMENT Vol. 7 2011
MATYLDA GWOŹDZICKA-PIOTROWSKAPoznan School of Banking
EUROPEAN TRAVEL REGULATION OVERVIEW– LEGAL PERSPECTIVE
Introduction
Travelling today is one of the most important branches of European economy.
Some EC members even depend on tourism as their main source of prosperity and
income. It was necessary to adopt common European legal provisions regulating
the most important travel aspects – on the general level (treaties) and more detailed
(directive, judiciary). What is more, travelling is one of the popular consumers’
activity that provides a need for a good and protective consumer law in the field
of travelling.
1. General European Community Law Provisions concerning Travel
1.1. The European Community Treaty
The free movement of persons between Member States raises the question
of its importance to the Community and its economy. Tourism represents one of
the Community’s main sources of income; it provides a huge job market as well
as generates major investment. It also affirms European identity among tourists
and local populations.

20 Matylda Gwoździcka-Piotrowska
According to provisions of the EC Treaty1 (art. 21 p. 1) any national of
a Member State has a right to move and stay freely within the territory of another
Member State other than the state of his residence. He “simply has to present an
identity card or passport whenever it is required.”2
1.1.1. Article 26 of the EC Treaty – no frontiers
Article 26 p. 2 of the EC Treaty (former article 14) ensures that “the
internal market shall comprise an area without internal frontiers in which the free
movement of goods, persons, services and capital is ensured in accordance with
the provisions of this treaty”. As it is said, there must be no control at the frontiers
between Member States. The internal market should operate as a national one,
with no barriers between regions within a state.
1.1.2. Former Article K.1 of the Maastricht Treaty on European Union – border
crossings as an area with special regard
Former Article K.1 of the Maastricht Treaty3 stated that there were certain
areas of special regard in the Community. Member States must consult one another
within the European Council in order to co-ordinate their actions within these
fields.
Among these special areas referred to in Article K.1 (1) to (6) we found those
relating to travel issues:
“(2) rules governing the crossing by persons of the external borders of the
Member States and the exercise of control thereon;
(3) immigration policy regarding nationals of third countries:
(a) conditions of entry and movement by nationals of third countries on the
territory of Member States;
(b) conditions of residence by nationals of third countries on the territory of
Member States, including family reunion and access to employment;
(c) combating unauthorised immigration, residence and work by nationals
of third countries on the territory of member States”.
1 Official Journal C 325/5 of 24.12.2002.
2 Z. Yaqub, European Travel Law, West Sussex, England 1997, p. 10. Also F. Van Kraay, Tour-
ism and the hotel Catering Industries in the EC, Athlone Press, London 1993, p. 21.
3 “Official Journal” C 191 of 29.7.1992.

21European travel regulation overview...
These provisions do not bind anymore, although similar regulation is covered
by Chapter 2 of the EC treaty, Articles 77–88 (immigration policy, asylum and
borders control).
1.1.3. Common visa policy
Former Article 100c of the EC Treaty brought visa policy within the Com-
munity’s sphere of action.
There was a rule that third countries shall require visas for their nationals but
they “must be in possession of a visa when crossing the external borders of the
Member States”. Today the Amsterdam Treaty repealed this provision in Article
73 j according to which the Council, within a period of five years after entry into
force of the Treaty, shall adopt:
“(b) rules on visas for intended stays of no more than three months,
including:
(i) the list of third countries whose nationals must be in possession of visas
when crossing the external borders and those whose nationals are exempt
from that requirement.
(3) measures setting out the conditions under which nationals of third
countries shall have the freedom to travel within the territory of the
Member States during a period of no more than three months.”
These provisions (current article 77) have been slightly amended by the regu-
lation of the Treaty of Lisbon4 and so: the fulfilment of the border control, asylum
and immigration policy are in the scope of both the European Parliament and the
Council and these bodies will proceed according to regular resolution procedure
(previously, only the Council was authorised to decide on the basis of the special
procedure of article 67 of EC Treaty).
1.1.4. The question of the right of establishment and freedom to provide services
by travel agencies
Council Directive 82/470/EEC, of June 29 June 19825 on measures to
facilitate the effective exercise of freedom of establishment and freedom to provide
services in respect of activities of self-employed persons in certain services inci-
4 Signed on 13th December 2007,OJC 306, 12.12.2007.
5 “Official Journal” 1982 L213/01.
22 Matylda Gwoździcka-Piotrowska
dental to transport and travel agencies and in storage and warehousing refers to
the freedom of establishment of travel agencies. According to Article 1(2) of the
Directive, its provisions will apply to the nationals or Member States, as provided
in Regulation EEC no. 1612/68,6 which pursue activities as employed person’s
activities within Article 2 of the Directive. Article 3 lists the usual titles for such
activities, recurrent in the Member States. Article 2 (Group B) provides the fol-
lowing activities:
(i) the organising, offering for sale and selling, outright or on commis-sion, of single or collective items (transport, board, lodging, excur-sions etc) for a journey or stay, whatever the reason for travelling;
and
(ii) arranging, negotiating and concluding contracts for the transportation of
immigrants.
Case law related to the implementation of the Directive 82/470
In Case C-306/89 Commission v Greece,7 the Court held that the Greek
Government had failed to transpose the Directive and thus had not fulfilled its
obligations under the EC Treaty. Article 8 of the Directive provides that Member
States were supposed to adopt the measures necessary to comply with the Directive
within 18 months of notification. The implementation period expired on 2 January
1984.
Case 283/86 Commission v Belgium8 also concerned the failure of the
Belgian Government to implement the Directive. Since the Commission received
no communication from the Belgian Government within the prescribed period
concerning implementation measures and since it had no information from which
it could be drawn out that the Kingdom of Belgium had fulfilled its obligation to
adopt the necessary provisions, by letter of 16 April 1985 the Commission found
that there was an infringement and gave the Belgian Government notice to submit its observations on the infringement within a period of two months.
By letter dated respectively 2 August and 28 August 1985 the Permanent Repre-
sentation of Belgium submits its observations.
6 “Official Journal” 1968 L257/02.
7 Unreported: Z. Jaqub, op.cit., p. 25.
8 ECR (European Court Review) [1988], 3271.
23European travel regulation overview...
The first letter stated that since the implementation of the Directive in
Belgian law in relation to services incidental to the transport of goods required an
amendment to the Law of 26 June 1967 laying down the rules governing persons
engaged in services incidental to transport and such an amendment required the
intervention of the Belgian Parliament, no solution was possible in the short term.
The second letter informed the Commission that the only amendment needed to the Belgian national legislation concerning travel agents related to the duration of the validity of the certificate of good conduct and it stated that the amandment would be the subject of a Royal Decree. Draft had been sub-mitted for the opinion of Belgian Conseil d’Ètat on 10 June 1985. Since it
considered that the reply from the Belgian Government was unsatisfactory and
that the measures needed to implement the Directive had not been adopted, the
Commission delivered a reasoned opinion on 11 April 1986 under the second
paragraph of Article 169 of the EEC Treaty, giving the Belgian Government a period of two months from its notification to comply with the Directive’s provision.
By letter of 4 September 1986 the Permanent Representation of Belgium
informed the Commission that as regards travel agents the question of the definition of the respective responsibilities of the national and com-munity (regional) authorities on the subject had been put to the Belgian cour d’arbitrage and that appropriate measures could be adopted as soon as a decision had been reached. At that time, as regards services incidental to
transport, a draft law that intended to bring the Belgian legislation into line with
the Directive was under negotiation with the industry. On completion of those
negotiations it would be possible to initiate the procedure for submitting the draft
for parliamentary approval.
The Commission found that the Kingdom of Belgium had not adopted the
provisions needed to comply with the Directive; it therefore brought action for
failure to fulfil obligations before the European Court of Justice.
The Court decided that a Member State could not rely on provisions, practices or situations in its internal legal system to justify a failure to fulfil the obligations and comply with the time limits laid down by Directives. The Court held that because the necessary provisions to comply with the Directive had not been adopted in a prescribed period of time the Belgian Government had not fulfilled its obligations under the EC Treaty.
24 Matylda Gwoździcka-Piotrowska
1.1.4.1. Free movement of tourists in the Community law
Tourists are not covered by Articles 45 (former 48), 59 (former 52),
66 (former 59) of the EC Treaty, which deal with workers, right of establishment
and the right to provide services.
However, in Joined Cases 286/82/83 Luisi and Carbone9, the Court held that the movement of recipients of services (such as tourists) might not be obstructed to such an extent that the freedom to provide services within the Community is affected.
In case 286/82 Mrs Graziana Luigi, an Italian national residing in Italy, had
used means of payment abroad to an exchange value of LIT 24 906 393 in 1975
and LIT 8 464 440 in 1976. At this time she sought and obtained sums from various
Italian banks in different foreign currencies, in particular United States dollars,
Swiss and French francs and German marks. Under the Italian legislation then
applicable, the export of foreign currency was authorised up to an exchange value
of LIT 500 000 per year. The Ministerio del Tesoro imposed on the plaintiff for the
legislation’s infringement two separate fines equal to the difference between the
amount of currency exported and the maximum permitted limit.
Mrs Lugi went before the court in Genoa to claim the illegality of such orders
and stated there that she had exported the currency in question for the purpose
of various periods she spent as a tourist in Germany and France. She had also
undergone a medical treatment of various kinds in Germany. She claimed that the
Italian provisions limiting exportation of means of payment in foreign currency
for the purposes of tourism were incompatible with the provisions of Community
law relating to the movement of capital and current payments.
In case 26/83 Mr Giuseppe Carbone, an Italian national residing in Italy, had
used means of payment abroad to an exchange value of LIT 13 801 310. During
November 1975 he purchased from about 20 Italian banks American dollars, Swiss
francs and German marks together amounting to the above-mentioned sum. Since
he had exceeded the maximum exchange value of LIT 500 000 per year, a fine of
LIT 13 301 310 was imposed. The plaintiff brought an action before the Tribunale
di Genova against the order of the Minister of the Treasury. He had stated that he
had used the currency for a period of three months, which he spent as a tourist in
Germany and claimed that the relevant Italian provisions were incompatible with
the Community law and in particular with the former article 3(c))now art. 26 p. 2,
9 ECR [1984], 377.

25European travel regulation overview...
and former articles: 5, 67, 68, 71 and 106 of the EEC Treaty that do not bind any
more.
The Court held that “tourists, persons receiving medical treatment and
persons travelling for the purpose of education or business are to be regarded as recipients of services”. The freedom to provide services therefore includes the
freedom for the recipients of those services there, without being obstructed by any
restrictions. Tourists, among others, must be regarded as recipients of services.
In Case 186/87 Cowan v Tresor Public10 a British resident in Britain and
a tourist in France he was mugged outside a Paris metro station and was refused
compensation from the French Criminal Injuries Compensation Board. He was not
compensated because he was not French nor a resident in France nor the national
of a country with which France had a reciprocal agreement. He was a recipient
of tourist services within the context of the Community freedom that provides
services: that the freedom included the right to non-discriminatory treatment and
was not limited to a prohibition on restrictions on freedom of movement, that
bodily safety of an EEC tourist was covered by the non-discrimination rule, that
compensation for bodily harm suffered notwithstanding was likewise covered, that
the non-discrimination rule could not be limited by requirements of reciprocity,
that although criminal law and procedure normally lay within the reserved powers
of the Member States it also was the subject to the non-discrimination rule under
Community law, and that therefore the refusal to grant compensation infringed
Article 7.11 The Court held that the: “prohibition on discrimination laid down in
particular Article 7b of the EEC Treaty, must be interpreted as meaning: that in
respect of persons whose freedom to travel to a Member State, in particular as
recipients of services, is guaranteed by Community Law; that the state may not
make the award of state compensation for harm caused in that state to the victim
of an assault resulting in physical injury, subject to the condition that he had a res-
idence permit, or was a national of a country which had entered into a reciprocal
10 2 Common Market Law Review 1990, no. 613.
11 Ibidem, p. 614. Article 7 of the EEC Treaty by providing “any discrimination on grounds
of nationality” requires that persons in a situation covered by the Community law be placed on
a completely equal footing with nationals of the Member State. Insofar as the principle is applicab-
le, therefore, it precludes a Member Sate from subjecting the grant of a right to such a foreigner to
the condition that they are the resident in that state, such condition not applying to the state’s own
nationals.
26 Matylda Gwoździcka-Piotrowska
agreement with that Member State”.12 The French compensation law was thus
discriminatory against the British citizen.
1.1.5. The External Frontiers Convention
The European Commission has published a “Convention of controls on
persons crossing external frontiers” (“the External Frontiers Convention”).13 The
Convention sets out a list of countries whose nationals require visas when crossing
the external frontiers of the Community.
It seems that the Commission should complete the harmonisation of this
matter giving an exhaustive and binding list of countries whose nationals are not
to be covered by visa requirement. Pending this full harmonisation Member States
are free either require or not a visa from nationals of non-community Members
which are not on the list.
1.1.6. The Schengen Convention
One of the major aims of the Schengen Convention14 was the establishment
of a common visa policy. There may be different ways and approaches of the
policy’s implementation as there is no supranational judicial control. A binding
Convention was signed in 1990 and implemented in 1995.
1.2. The Package Travel – general
In the European Community the interests of consumers protection in relation
to travel – package holidays were first shown in 1982 when the European Com-
mission forwarded a communication to the European Council laying down initial
guidelines for an EC policy referring to tourism. In 1984 the Council adopted
a resolution on a policy in these matters.
Before that, there were only: the 1970 International Convention on Travel Contracts (hereafter CCV)15 and the 1979 OECD Council’s recommendation on
Package Holidays by Air dealt with the consumer protection concerning package
holidays at the international level.
12 On the basis of Z. Yaqub, op.cit., pp. 41–43.
13 COM (93) 684, 10.12.1993; OJ 1994 C 11.
14 “Official Journal” L 239, 22.09.2000, pp. 0019–0062.
15 Convention Internationale relative au contract de voyages (CCV).
27European travel regulation overview...
Since Member States had very different regulations referring to package
holidays issues, there was a need to create a common regulation, which would set
a minimum standard of consumer protection in the sector of tourist services.16
In 1988 the Commission submitted to the European Council a proposal for
a Package Travel Directive.17 The Directive on package travel, including package
holidays and package tours was adopted on June 13 1990 and its preamble
quotes former Article 100a of the EC Treaty as its legal basis.18 The European Directive on package travel, package holidays and package tours19 (hereafter the Directive) was adopted on June 13 1990 under former Article 100a of the
EC Treaty. The Directive’s provisions provide an incomplete minimum level of
consumers protection in the general field of travelling that determine: the content
of a package travel contract, the way of advertising of the package, the content of
holiday brochures and other duties of the organiser as well as the general scope
of rights and duties lying of both sides of the package contract. The Directive’s
provisions provide a minimum level of consumers’ protection in the general field
of travelling, that determine: the content of a package travel contract and the holiday brochures as well as other organiser’s information duties, insolvency protection duty and the organiser’s liability issue, namely the general scope of rights and duties of both sides of the package travel agreement.
The Directive, as a consumer directive, is not a complete harmonisation
directive. Article 8 allows Member States to adopt (or retain) more protective
provisions in the field of package travel. Member States may use Article 8 to
provide an even higher standard of consumer protection than the one suggested
by the Directive’s provisions.
16 Legal provisions description of Member States at the time the Commission submitted its first
proposal of the directive is provided in the explanatory memorandum accompanying the draft Di-
rective (COM/88/41 final). Denmark, Great Britain and Luxembourg had no specific legislation
referring to the package travel contract; Belgium and Italy adopted in 1970 International Convention
on Travel Contracts; France, Germany, Greece, Ireland, the Netherlands, Portugal and Spain had
specific legislation, which differed in their substantial content.
17 COM/88/41 final; “Official Journal” 1988, 96/5.
18 “Official Journal” L 158, 23.06.1990, pp. 0059–0064. Article 100a of the EC Treaty provides
for “the adoption of measures for the approximation of the provisions laid down by law, regulation
or administrative action in the Member States which have as their object the establishment and fun-
ctioning of the internal market.”
19 The full title of the Package Travel Directive is E.C. Council Directive 90/314 on package
travel, package holidays and package tours.

28 Matylda Gwoździcka-Piotrowska
EUROPEJSKA REGULACJA TURYSTYCZNA – KONTEKST PRAWNY
Streszczenie
Konieczność regulacji kwestii podróży i ochrony konsumenta korzystającego z usług
turystycznych została poruszona na szczeblu Unii Europejskiej w latach osiemdziesią-
tych poprzedniego stulecia, kiedy Komisja Europejska przedstawiła Radzie Europejskiej
wstępne założenia wspólnej polityki w sektorze turystycznym. Kwestie związane z sze-
roko pojętą turystyką i podróżowaniem uregulowano na poziomie prawa wspólnotowego
pierwotnego (tj. w podstawowych aktach prawnych Unii Europejskiej, m.in. traktatach
założycielskich, traktacie z Maastricht czy traktacie lizbońskim). Pojawiła się też potrzeba
uszczegółowienia tych regulacji aktami prawa wtórnego. Najistotniejsze postanowienia
zawiera dyrektywa 90/314 o podróżach i wycieczkach turystycznych świadczonych w for-
mie pakietu usług, przyjęta przez Radę 13 czerwca 1990 r. Dyrektywa turystyczna stanowi
integralną część zarówno wspólnotowej polityki rynku wewnętrznego, jak i ochrony kon-
sumenta. Bariery prawne, spowodowane brakiem jednolitych rozwiązań prawnych w kra-
jach członkowskich UE, stwarzające przeszkody handlowe i powodujące zróżnicowanie
kosztów, muszą zostać zlikwidowane. Przyczynić się do tego miała implementacja przez
państwa członkowskie UE dyrektywy turystycznej i tym samym wprowadzenie do ich
ustawodawstw minimalnego standardu ochrony prawnej klientów biur podróży.
SCIENTIFIC JOURNAL
NR 670 SERVICE MANAGEMENT Vol. 7 2011
BARBARA KOSKAROLINA LUBIENIECKA-KOCOŃUniversity of Economics in Katowice
THE CHOSEN AREAS OF TRANSPORT SYSTEM INTEGRATION IN EUROPE
Introduction
Transport is a key element of the modern economy functioning. It is expected
the transport will measure the expectations as far as the increasing mobility, on-
time execution and the service level are concerned. Due to the constantly rising
expectations, the transport system requires optimization in order to fulfill the
expectations of the enlarging number of EU countries (from 6 countries up to
present 27) and of the balanced development. The modern transport system needs
to be economically, socially and environmentally balanced.
The integration, as a meaningful term, includes binding several elements
into one integrity. The base of creating the integrated transport system of the
EU member countries is the common transport policy, the settings of which are
included in the EEC Treaty of Rome1.
Later on, the transport also became the important element of the regional
development, which is proved by its funds in the European Regional Development
Fund, as well as by the elements of pro-ecological policy.
1 The treaty for creating European Economic Community and European Atomic Energy Com-
munity was signed on 25th of March, 1957 in Rome by six ECSC countries. The EEC treaty came
into existence on the 1st of January, 1958 after it was ratified by house of parlament of the signing
countries.

30 Barbara Kos, Karolina Lubieniecka-Kocoń
The EEC transport policy has always been based upon three assumptions:2
‒ the investment in transport infrastructure will profit in economic develop-
ment;
‒ encouraging the competition and freeing the carriers from many regula-
tions that restrict their activities, which will increase the productivity,
therefore the postulate of deregulation;
‒ time management, shortening the delivery time means improving service
providing, therefore the logistics management postulates.
The EU transport policy is focused on those goals, which favor the Union
integration, the internal transport service market liberalization, environment pro-
tection, ensuring road and traffic safety and guaranteeing equal treatment to its
own carriers in relation to the third countries. Such goals restrict the regulatory
role of a country within the transport and favor the competition mechanisms.
1. Transport infrastructure as an integration area
European transport infrastructure is not a homogenous net; its built is not
related to the directions of the international cooperation, there are various exploi-
tation parameters for different transport branches; various countries have various
priorities, due to the routes structure.
The European infrastructure unification process is slow. United Nations
Economic Commission for Europe, European Conference of Ministers of
Transport (ECMT) and the governments of the countries paid great attention to the
idea of creating coherent European transport network. The conferences, organized
in Prague (1991), on Crete (1994) and in Helsinki (1997) brought into effect the
concept of nine transport corridors. Such concept is based on long-term actions
which are to execute the ideas included in ratified conventions concerning the
main road routes (European Agreement on Main International Traffic Arteries
– AGR), rail routes (European Agreement on Main International Traffic Arteries
– AGC), of multimodal transport (International Combined Transport Lines and
Related Installations – AGTC) and of inland waters (ADN).
2 L. Ciamaga, E. Latoszek, K. Michałowska-Gorywoda, L. Oręziak, E. Teichman, Unia Europe-
jska, Wydawnictwo Naukowe PWN, Warszawa 2000, p. 192.

31The chosen areas of transport system integration...
On the 1st Pan European Conference in Prague in 1991, when formulating
the common goals for European transport policy, the following notions were,
among others, claimed to be of the greatest importance:
‒ the effective development of the transport system, taking into considera-
tion the rules of market economy and of honest competition, with the help
of the issue of the integrated European transport, fulfilling the social, envi-
ronmental, energy protections, and safety goals, free from any unneces-
sary restrictions;
‒ setting proper standards to the plans of European transport infrastruc-
ture network, taking into consideration European agreements, as well as
national concepts, taking into account economic effectiveness, energy
saving, safety, environment protection and Urban interests;
‒ restricting the increased vehicle traffic, together with its effects: traffic
congestion and pollution on heavy traffic junctions, through the strategy
of multimodal transport development;
‒ reaching the aims of environment protection, national energy use, and
transport safety through prioritizing infrastructure development of envi-
ronment pollution.
On the 2nd Pan European Convention on Crete in 1994 there was described
the list of priority transport corridors for Central-Eastern Europe, called the Crete
corridors. A transport corridor is understood as a communication route of inter-
national meaning, where at least two different transport roads, having proper
technical parameters, with transport junctions (e.g. logistic centers) are present.
When transport corridors were set, the following principles were taken into
consideration:3
‒ at least one corridor runs through each of the Western and Central Euro-
pean countries;
‒ including the corridor into Pan European network is conditioned with
a positive economic forecast and with a real perspective of acquiring the
means for financing the necessary investments;
‒ apart from its individual meaning, a corridor should be a part of the whole
Pan European network concept;
3 Korytarze transportowe, „Nowe Sygnały” 2000, nr 13.

32 Barbara Kos, Karolina Lubieniecka-Kocoń
‒ taking into account intermodality, a corridor is to include a rail, road and
intermodal transport; the only exception is the corridor no VII, along Dan-
ube.
There were prioritized nine routes of an international meaning, especially
for East- West trade development. The list of the corridors, set on Crete, was not
closed. On the III Pan European Conference in Helsinki in 1997, the corridors net
was broadened by the corridor number 10, running through Germany – Austria –
Hungary – Slovenia – Croatia – Serbia – Macedonia and up to Greece. Moreover,
there were accepted the modification plans for the previously set corridors.
The conference in Helsinki did not take into consideration many other infra-
structural propositions, creating corridors around seas included. For those, there
was set a name of Pan European Transport Area (PETRA) which is understood as:
1. Euro-Arctic area of the Barents Sea,
2. The Black Sea area,
3. The Mediterranean Sea area,
4. The Adriatic – Ionian area.
Because of the predicted increase of the interest and of the importance of
the connections between Europe and Asia, the Conference reported the need to
broaden the European contracts: AGR, AGC, AGTC and AGN over Caucasus and
the countries of Central Asia.
The actions concerning transport infrastructure development planning in
Europe has created the Pan European network, consisting of four basic elements:
Trans European Network – TEN, Pan European transport corridors in Central-
Eastern Europe, Pan European Transport Areas – PETRA and the Europe – Asia
connections, such as TRACECA.
The international Transport Corridor Europe-Caucasus-Asia (TRACECA),
described as a Great Silk Road of the 21st century, is to develop the economic
and trade relations, as well as the transport connections among countries. There
are 13 countries in the program: five European, three South – African and five
from Central Asia. The program supports the development of trade relations and
economic integration of the countries taking part in the global changes process.
Such countries have real chances to strengthen their roles as so called transit
countries. Since 2009 Lithuania takes part in the TRACECA and has the observer
status within TRACECA International Conference.4
4 http://www.traceca-programme.eu/en/home/the-silk-road-of-the-21st-century/.
33The chosen areas of transport system integration...
The EU countries were heading to create the common transport policy and
the common transport networks (TEN – Trans European Networks), which is the
base for the common internal market efficient functioning. EU Trans European
network was designed in such a way so as it is coherent with the Basic transport
routes of the future Union members and their neighbours.
In 1960s, due to the Council decision5 from 13th of May 1965, there were
introduced the harmonization of certain conditions from fiscal, national inter-
vention and social areas. The decision concerned only the inland public transport
branches. Also, in 1968–1970, there were important decisions made, concerning
the rules of honest competition in inland transport, providing the first common set
of permissions in international vehicle transport and introducing obligatory in that
kind of transport, tariff scales.
In 1970s the air and sea transport were included into the common policy;
during this time there were offered the first loans for infrastructure investment,
important for the whole Union.
In the 1980s, the particular attention was directed upon adapting the infra-
structure to the new needs and on elimination of so called „bottlenecks”. The White
Paper, published by European Commission in November 1985 foresaw creating
unite transport market up to 1993, and setting at the same time the schedule of
actions connected with the issue.
It was in 1990s when the fourth program, called „The Future Common
Transport Policy Development” was announced. During this time the main pri-
orities of Union transport policy were the further creating of unified transport
infrastructure, so that it corresponds to economically integrated are, increasing the
traffic safety and environmental conditions.
On the 6th of April 1992 European Commission presented the Green Paper6
concerning transport influence on the environment: „The Union Strategy in
Realizing the Constant and Environmentally Friendly Mobility”. The Green Paper
is connected with the statement of European Commission, entitled „The Future
Development of Common Transport Policy – the Global Conception of the
Strategy for Long Term and Balanced Mobility” from 2nd December 1992.
In 1992 the was the PACT Program initiated (pilot action for combined
transport) to support the cargo transport operators offering market-oriented and
5 65/271/EEC.
6 92/46/EEC.
34 Barbara Kos, Karolina Lubieniecka-Kocoń
innovative projects concerning the intermodal transport (rail, road, inland and
inshore one). Almost 167 projects were run in all member countries within the
PACT program within 1992–2000.7 The program was finished in 2001; there was
53 millions euro spent for its realization within 1992–2001.
The issues of developing the unified transport, telecommunication and
energy networks (so called TENs) were described in the White Paper „About the
Growth, Competitiveness and Employment” from December 1993. Tran European
networks were claimed to be the general factors for the growth, competitiveness
improvement and new job positions.
The initiatives concerning shaping the transport infrastructure were included,
among others, in the proposal of European Commission entitled „The Directives
to Create Trans European Transport Networks”8 published on 7th of April 1994.
Apart from the main goal there was highlighted the ecological aspect, because the
network integration process was to be finished the moment the „network, optimal
also from the ecological point of view”9 existed. In the initial phase of the TEN-T
program (1996–2003), the priorities for member countries were the projects con-
cerning transport infrastructure.
The fourth program (FMP) run within 1994 up to 1998. 19 realized projects
may be divided into two groups. The first group was dealing with the effectiveness
of transfer points within intermodal networks, using information and commu-
nication techniques. The second one created new instruments, supporting the
decision making process and connecting it with market and administrative bodies
requirements. Both groups reported the innovative use of new technologies, the
development of new services and the productivity improvement to be the basic
development factors.10
In the Green Paper of European Commission from 15th June 199511
„The Citizens’ Network. Fulfilling the potential of public passenger transport in
Europe” the integration issues were considered in three sets:
7 M. Janic, A. Reggiani, Integrated transport systems in the European Union: an overview of
some recent developments, “Transport Reviews” 2001, vol. 21, no. 4.
8 94/106/EEC.
9 Ibidem.
10 M. Janic, A. Reggiani, op.cit.
11 95/60/EEC, The Citizens’ Network, Fulfilling the potential of public passenger transport in
Europe, European Commission Green Paper, http://europa.eu.int/en/record/green/gp9601/ind_cit.
htm.
35The chosen areas of transport system integration...
‒ the integration of individual and mass transport,
‒ the integration of mass transport,
‒ the integration of transport with other political areas.
On 12th October 1995 there was issued the European Commission document
entitled „Common Transport Policy – the program for 1995–2000”,12 where,
quoting the Maastricht Treaty from 1993, which announced new phase of common
transport policy there were enumerated three basic points:
‒ increasing the quality via creating the integrated transport system using
modern technologies;
‒ the improvement of internal market functionality, and supporting effec-
tiveness, the possibility of choice (from different types of transport) and
creating the client’s needs oriented transport service market;
‒ the development of external connections via better contact with the third
countries and the improvement of the access to other transport market for
the EU entrepreneurs.
On 20th December 1995 European Commission presented the Green Paper
entitled „The Honest and Effective Prices in Transport – Political Concepts of
External Transport Costs Internalization in European Union”.13 European Com-
mission opted for the price being more strongly oriented for the „client pays” rule,
as far as traffic congestion, accidents and ecological problems are concerned.
The White Paper of European Commission presented in Cannes (26th–27th
June 1995) „Concerning preparing the member countries of Central and Eastern
Europe to integrate with unified market of European Union” reaches beyond the
EU market. There were discussed 23 areas in which there had to appear the adapting
process for norms and legal regulations up to common market requirements. Such
actions included road, rail, inland, sea and air transport and concerns the following
aspects:
‒ the access to the transport markets,
‒ the technology and traffic safety,
‒ taxes harmonization,
‒ social norms and drivers’ working time harmonization,
‒ natural environment protection.
12 95/302/EEC.
13 95/691/EEC.
36 Barbara Kos, Karolina Lubieniecka-Kocoń
Within the White Paper of European Commission, entitled „The Railway
Revitalization Strategy in European Union”14 from 30th July 1996 there was noted
the necessity to create „new rail enterprises”. The final goal was such shaping of
rail, so as to let it be as attractive as other means of transport. The actions planned
for 1997 and 1998 were directed to support integration of international rail asso-
ciations so that they could coordinate better in market competition.
As far as transport infrastructure is concerned, there was set the list of priority
infrastructure investments according to the following criteria:
‒ the share in creating TransEuropean connections,
‒ bottlenecks elimination,
‒ area or peripheral areas integration,
‒ international exchange facilitation, including transit, in cooperation with
the third countries interested,
‒ inproving sea-land connections,
‒ ensuring the high quality connections among the main means of transport
The 5th, FWP Program, designed for 1998-2002, became a new form of
scientific surveys concerning integrated transport systems. New projects were
built under the slogan „Constant Mobility and Intermodality” (RTD). 10 out of 12
started projects concerned cargo transport, and the other two: passenger transport.
The majority of projects focused on developing and designing new transport
methods and Technologies, and on introducing and checking the influence of IT
technologies on supply chains such as „door-to-door”.15
In August 1998 there was another White Paper issued: „The Justified Payment
for Using the Infrastructure. The Principles for the Common Payment System for
the EU Transport Infrastructure.” Like the Green Paper from 20th December 1995,
„The Honest and Effective Prices in Transport – Political Concepts of External
Transport Costs Internalization in European Union”, this Paper shows the EU
interest in external transport costs and their internalization as a way to reach the
balanced development.
Taking into consideration EU further broadening with 10 new members in
2004, one of the EU most important aims became ensuring the competitiveness
increase of the community as a whole. The realization of those goals required
14 96/421/EEC.
15 M. Janic, A. Reggiani, op.cit.

37The chosen areas of transport system integration...
many economic reforms. The range and the realization mode for those plans was
set in Lisbon Strategy from 2000.16
The Lisbon Strategy constitutes the attempt to describe the place and the role
of European Union within the globalization process. To reach the general goal of
Lisbon Strategy, there were set four following areas of particular economic and
social activity:17
‒ innovation,
‒ markets liberalization,
‒ resourcefulness,
‒ social integrity.
Transport is an important factor for realizing the Lisbon Strategy, condi-
tioning the progress in each of its strategic areas. That is why the contemporary
EU transport integration strategy claims the following issues to be of crucial
importance:
‒ infrastructure development,
‒ transport service market liberalization,
‒ improving the service quality,
‒ restricting the negative effects of transport activity for natural environ-
ment. On 12th September 2001 Commission of the European Communities pre-
sented the White Paper entitled „European Transport Policy for 2010: time to
decide.”18 It set the directions for EU transport policy up to 2010, underlying the
importance of the former EU transport policy: the balanced development. There
was noted the necessity to change the proportions among particular branches of
transport, to eliminate bottlenecks and to reinforce the actions within the users’
rights in all of the transport branches.
The 6th program for the 2002–2006 period was to present the possibilities
to implement those projects which would facilitate the coordination and would
increase the effectiveness of the surveying system within the transport. Those
projects were mainly connected with such notions as combined transport, clean
vehicles, or the use of telematics in transport. The 7th frame program for the
2007–2013 period consists of projects dealing with transport infrastructure, build,
16 Document accepted on European Council meeting in Lisbon in 2000.
17 www.kigm.pl/lisbonska.html (Lisbon Strategy).
18 White Paper, European Transport Policy for 2010: time to decide, Commission of the Euro-
pean Communities, COM(2001)370, Brussels, 12.09.2001.

38 Barbara Kos, Karolina Lubieniecka-Kocoń
exploitation, the safety of transport systems and the transport processes man-
agement systems.
In 2006 European Commission created TEN-T Executing Agency, with
the headquarters in Brussels. The Agency is responsible for all the open TEN-T
projects within the periods: 2000–2006 and 2007–2013 as far as their financing
is concerned. The projects concern all means of transport, logistics and the intel-
ligent transport systems. The work of Agency is to bring profit for the projects
beneficiaries through: simplifying administrative procedures, shortening the
payment delays, enlarging the quantity of the offered services and focusing on the
public private partnership.19
The TEN-T program consists of hundreds of projects – defined as research or
studies – and its final goal is to ensure coherence, internal connection and interop-
erating of Trans European transport network. There are priority 30 projects within
the Program, which are to focus on Pan European integration and development.20
Priority projects were chosen due to their European addend value, their
importance for improving economic effectiveness of European transport system,
and due to ensuring direct benefits for European citizens. Among those 30 priority
projects there are 18 rail ones, 3 road- rail ones, 2 of inland transport and one
concerns sea highways. Some of the mentioned projects have already been
finished:21
‒ Oeresund between Denmark and Sweden,
‒ Malpensa Airport in Milan,
‒ Betuwe rail track, connecting Rotterdam with German border,
‒ Rail axis Cork–Dublin–Belfast–Stranraer in Ireland.
On 4th February 2009 Commission presented Green Paper: „TEN-T: the
Policy Review Heading for Better Integrated Trans European Network for Common
Transport Policy”, concerning the review of its policy towards TEN-T. The Com-
mission noted that the TEN-T policy needs to be adapted through including
economic and environment aspects and focusing on efficient passenger and cargo
transport. During the session on 11th and 12th June 2009 the EU Council of Min-
isters reported that all TEN-T priority projects should be an integral part of priority
19 http://tentea.ec.europa.eu/en/about_us/mission__introduction/mission__introduction.htm.
20 http://tentea.ec.europa.eu/en/ten-t_projects/.
21 http://tentea.ec.europa.eu/en/ten-t_projects/30_priority_projects/30_priority_projects.htm.

39The chosen areas of transport system integration...
network, connecting both the finished and unfinished elements of infrastructure
and the projects which are within the area of common interest.22
Conclusion
There are many publications and rapports concerning the problem of transport
system integration. There might be presented the publication23 where it is said
that the integration of inland transport in Europe is one of the main topic to raise
the discussion in the recent years. The transport markets integration is the basic
condition for goods exchange and for economic activity. The publication devoted
to transport integration present the most actual trends in transport and in transport-
oriented investments. They monitor and describe the Pan European process of
legal harmonization and of transport systems adapting; they analyze the created
transport and trade connections between Europe and Asia. They also monitor the
barriers connected with crossing the borders in international road and rail transport
and describe the crimes and offences connected with transport. Moreover, they
deal with public – private partnership in case of transport infrastructure financing;
they also present the solutions for this problem, used in various countries.
WYBRANE OBSZARY INTEGRACJI SYSTEMÓW TRANSPORTOWYCH
W EUROPIE
Streszczenie
W artykule syntetycznie przedstawiono obszary integracji systemów transporto-
wych w Europie. Scharakteryzowano cele i założenia działań integracyjnych organów
Unii Europejskiej podejmowanych w ostatnim pięćdziesięcioleciu, począwszy od stwo-
rzenia Europejskiej Wspólnoty Gospodarczej w 1957 roku, przez kolejne edycje białych
i zielonych ksiąg, wyznaczenie korytarzy transportowych, skończywszy na TEN i progra-
mach ramowych.
22 http://eur-lex.europa.eu/Notice.do?val=506106:cs&lang=en&list=519958:cs,519907:
cs,510907:cs,506106:cs, 506010:cs,501187:cs,496505:cs,488394:cs,487516:cs,481114:cs,&pos=4
&page=1&nbl=735&pgs=10&hwords=&checktexte=checkbox&visu=#texte.
23 “Integration of European Inland Transport Markets” 2000, vol. 2000, no. 2, pp. 1–157.


SCIENTIFIC JOURNAL
NR 670 SERVICE MANAGEMENT Vol. 7 2011
BEATA LUBOSMinistry of EconomyWarsaw School of Economics
TOWARDS POLICY SUPPORTING INNOVATION IN SERVICE SECTOR IN THE EU
1. Innovation in services – a theoretical approach
The concise definition of innovation states that it is based on “successful
production, assimilation and exploitation of novelty in the economic and
social spheres”, 1 while the broad one describes innovation as “the renewal and
enlargement of the range of products and services and the associated markets; the
establishment of new methods of production, supply and distribution; the intro-
duction of changes in management, work organization, and the working conditions
and skills of the workforce”.2 According to the latest Oslo Manual by OECD, inno-
vation is “the implementation of a new or significantly improved product (good or
service) or a process, a new marketing method, or a new organizational method in
business practices, workplace organization or external relations.”3
Innovation – the very sophisticated phenomenon – has a great influence on
the competitiveness of economies, as well on particular branches – including man-
1 European Commission, Commission Communication, Innovation policy: updating the Union’s approach in the context of the Lisbon strategy, COM (112)2003, Brussels 2003.
2 Commission of the European Communities, Green paper on innovation, COM(1995) 688 fi-
nal, Brussels 1995.
3 OECD, Eurostat, Oslo Manual, Guidelines for collecting and interpreting innovation data,
Paris 2005.
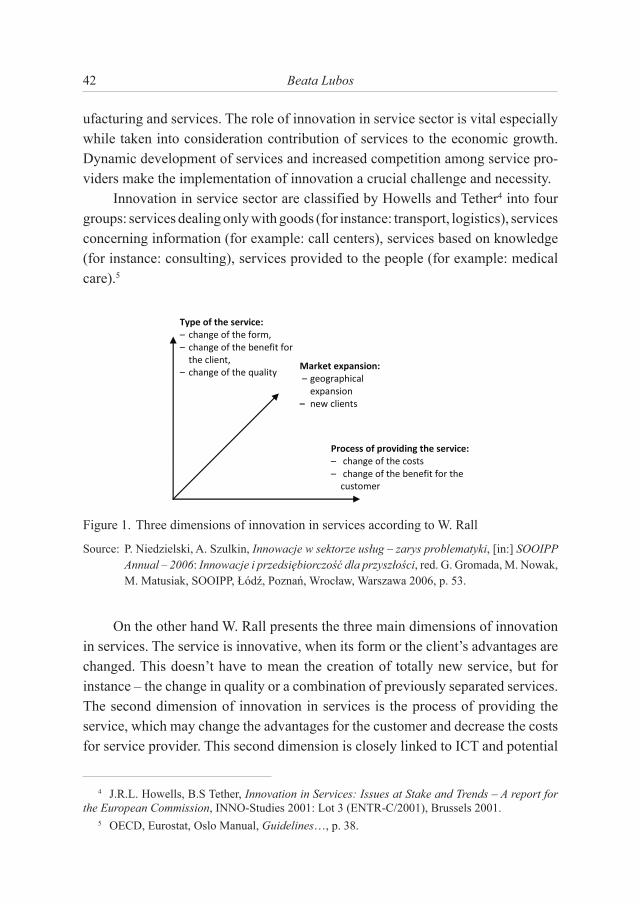
42 Beata Lubos
ufacturing and services. The role of innovation in service sector is vital especially
while taken into consideration contribution of services to the economic growth.
Dynamic development of services and increased competition among service pro-
viders make the implementation of innovation a crucial challenge and necessity.
Innovation in service sector are classified by Howells and Tether4 into four
groups: services dealing only with goods (for instance: transport, logistics), services
concerning information (for example: call centers), services based on knowledge
(for instance: consulting), services provided to the people (for example: medical
care).5
Type of the service:
– change of the form,
– change of the benefit for
the client,
– change of the quality
Process of providing the service:
– change of the costs
– change of the benefit for the
customer
Market expansion:
– geographical
expansion
– new clients
Figure 1. Three dimensions of innovation in services according to W. Rall
Source: P. Niedzielski, A. Szulkin, Innowacje w sektorze usług – zarys problematyki, [in:] SOOIPP Annual – 2006: Innowacje i przedsiębiorczość dla przyszłości, red. G. Gromada, M. Nowak,
M. Matusiak, SOOIPP, Łódź, Poznań, Wrocław, Warszawa 2006, p. 53.
On the other hand W. Rall presents the three main dimensions of innovation
in services. The service is innovative, when its form or the client’s advantages are
changed. This doesn’t have to mean the creation of totally new service, but for
instance – the change in quality or a combination of previously separated services.
The second dimension of innovation in services is the process of providing the
service, which may change the advantages for the customer and decrease the costs
for service provider. This second dimension is closely linked to ICT and potential
4 J.R.L. Howells, B.S Tether, Innovation in Services: Issues at Stake and Trends – A report for the European Commission, INNO-Studies 2001: Lot 3 (ENTR-C/2001), Brussels 2001.
5 OECD, Eurostat, Oslo Manual, Guidelines…, p. 38.
43Towards policy supporting innovation in service sector in the EU
of service providers – especially to their knowledge and creativity. The last
dimension of innovation in services represents the market expansion aimed at
attracting new groups of clients and the geographical expansion of the company.6
Innovation in the service sector is based mainly (opposite to the innovation in
manufacturing) on the 4 pillars: qualifications, creativity, entrepreneurship, access
the various sources (financial one, consulting and advisory services). The whole
process is not independent one – it is influenced by technology, regulations, the
stage of the development of society and the development of other sectors of the
economy.7
2. Innovation in service sector – setting the scene
The European Union sees a potential in the development of innovation in the
service sector, that’s why undertakes a number of activities aimed at increasing
the innovativeness of the service providers and services itself, offered on the EU
market. The first step for the European Commission was to undertake analytical
work on measuring innovative activity in the service sector. The European Trend
Chart on Innovation report entitled “2006 TrendChart report: Can we measure and
compare innovation in services”8 was the first one to present the methodology of
measuring innovation in the service sector and the results of its innovativeness.
The Service Sector Innovation Index (see figure 2) shows the average
country performance for the 24 indicators, which have been assigned to seven
themes: 1) human resources; 2) innovation demand; 3) technological knowledge;
4) non-technological changes – such as organizational innovation; 5) sources
of knowledge; 6) commercialization and 7) intellectual property. Sweden and
Luxembourg perform best on this index, while Bulgaria and Hungary come
last. As noted above, some of Europe’s better performers on the EIS perform
poorly on the SSII, including Denmark, Austria, and the Netherlands. Some of
the new member states perform quite well, especially Latvia, Czech Republic,
and Romania which outperforms many more highly developed countries such as
France, Germany and the UK. The indices for country performance in the four
6 P. Niedzielski, A. Szulkin, op.cit., p. 52.
7 Ibidem, p. 52.
8 European TrendChart on Innovation, 2006 TrendChart report: Can we measure and Compare innovation in services, Brussels 2006.
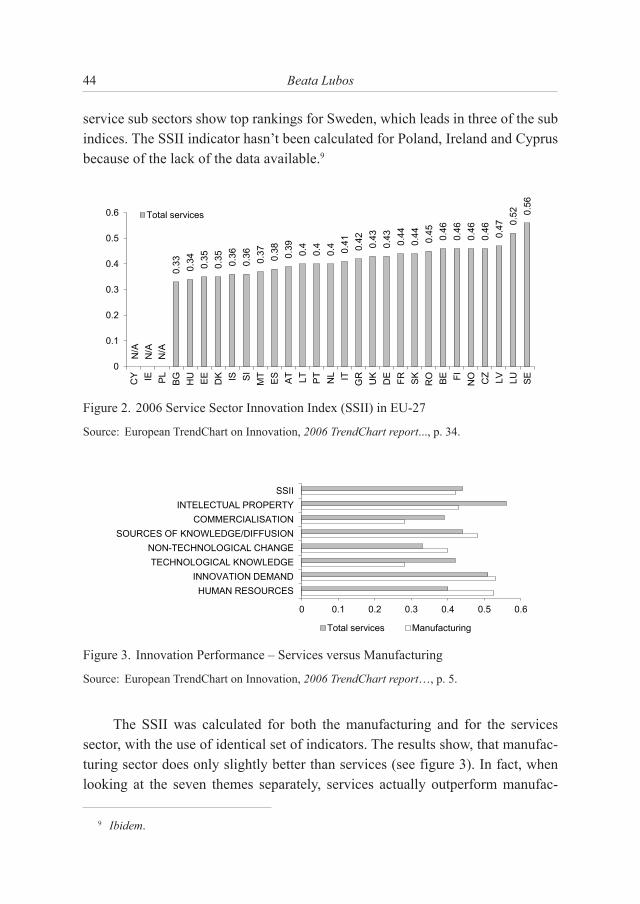
44 Beata Lubos
service sub sectors show top rankings for Sweden, which leads in three of the sub
indices. The SSII indicator hasn’t been calculated for Poland, Ireland and Cyprus
because of the lack of the data available.9
0.3
3
0.3
4
0.3
5
0.3
5
0.3
6
0.3
6
0.3
7
0.3
8
0.3
9
0.4
0.4
0.4
0.4
1
0.4
2
0.4
3
0.4
3
0.4
4
0.4
4
0.4
5
0.4
6
0.4
6
0.4
6
0.4
6
0.4
7
0.5
2
0.5
6
0
0.1
0.2
0.3
0.4
0.5
0.6
CY
IE
PL
BG
HU
EE
DK
IS
SI
MT
ES
AT
LT
PT
NL
IT
GR
UK
DE
FR
SK
RO
BE
FI
NO
CZ
LV
LU
SE
Total services
N/A
N/A
N/A
Figure 2. 2006 Service Sector Innovation Index (SSII) in EU-27
Source: European TrendChart on Innovation, 2006 TrendChart report..., p. 34.
0 0.1 0.2 0.3 0.4 0.5 0.6
HUMAN RESOURCES
INNOVATION DEMAND
TECHNOLOGICAL KNOWLEDGE
NON-TECHNOLOGICAL CHANGE
SOURCES OF KNOWLEDGE/DIFFUSION
COMMERCIALISATION
INTELECTUAL PROPERTY
SSII
Total services Manufacturing
Figure 3. Innovation Performance – Services versus Manufacturing
Source: European TrendChart on Innovation, 2006 TrendChart report…, p. 5.
The SSII was calculated for both the manufacturing and for the services
sector, with the use of identical set of indicators. The results show, that manufac-
turing sector does only slightly better than services (see figure 3). In fact, when
looking at the seven themes separately, services actually outperform manufac-
9 Ibidem.

45Towards policy supporting innovation in service sector in the EU
turing in four of these: Sources of knowledge, Non-technological change, Inno-
vation demand and Human resources. Conversely, the manufacturing sector, not
surprisingly, performs better on two themes that largely measure technical inno-
vation: technological knowledge and intellectual property.10
0
0.1
0.2
0.3
0.4
0.5
0.6
0.7
0.8
0.9
1
BG RO HU PL LT ES IT PT CY CZ NL GR FR BE EE DE LU
Manufacturing All services
Figure 4. 2007 Service Sector Innovation Index (SSII) in EU-27 compared to manufactur-
ing performance across EU Member States11
Source: Commission of the European Communities, Commission Staff Working Document…,
p. 12.
Figure 4 shows the comparison of the innovation performance of Member
States in services, measured by a selected number of service related indicators,
with an index for manufacturing constructed with an identical set of indicators.
On average, the national difference in innovation performance between the two
major sectors is highly correlated, although there are a few differences between
performance in manufacturing and services. For example, Luxembourg and
Estonia perform better on services than on manufacturing, which is explained
by the fact that the economy of these countries mainly relies on services. On the
other hand, Bulgaria, Germany, the Netherlands and Poland perform better in
manufacturing.12
10 Ibidem.
11 The research covered EU-27, till now 10 Member States did not submit the statistical data.
12 Commission of the European Communities, Commission Staff Working Document: Towards a European strategy in support of innovation In services: Challenges and key issues for future ac-tions, Brussels 2007, p. 12.
46 Beata Lubos
ESRC Centre for Research on Innovation and Competition and Institute of
Innovation Research from University of Manchester provided a report13 which
covered the research on innovation in 4 service sectors: Road Transport and Logistics, Information Processing, Design and Related Activities, Care for the Elderly. The research was focused on the extent of change in enterprises, tech-
nology used, human resources management – including the qualifications of the
workforce and the necessity to train. The conclusion from the research carried are
as follows:
‒ there’s a crucial role of organizational and process innovation and all non-
technological related forms of innovation,
‒ there’s an increasing significance of high quality of services provided,
‒ enterprises are reluctant to introduce new services,
‒ implementation of new technologies is not foreseen as a success driving
force,
‒ the key success factor is the high qualifications of staff and good train-
ing.
This facts can be actually very accurate for all services, which are not
knowledge intensive. Opposite to that – KIS (knowledge intensive services) tend
to rely very much on technological change.
3. Barriers to the development of service innovations
Before designing the policy aimed at providing support for innovative service
companies the crucial issue is to define the barriers, which service companies face
when they want to innovate. These main barriers tend to be:
‒ customer’s unwillingness to pay for innovative and therefore more expen-
sive services,
‒ high cost of innovative activity,
‒ high risk connected with implementation of innovation,
‒ lack of sufficiently skilled workforce,
‒ useless and unadequate trainings.14
13 Commission of the European Communities, Innovation in Services: Issues at Stake and Trends,
Brussels 2004.
14 European TrendChart on Innovation, 2006 TrendChart report…, p.18.

47Towards policy supporting innovation in service sector in the EU
The research on conducting innovative activity, both among manufacturing
and service enterprises, carried by European Commission under the „Innoba-
rometer” studies showed a problem with assessing new innovative customers
and markets and with mobilizing human resources. Manufacturing and services
differed significantly in section “Finding or using new technologies”, which
proved once more that service sector innovate usually implementing non-techno-
logical innovation.15
4. The policy for innovation in services at the EU level
The service sector plays an increasingly important role in the economy.
It accounts for about 2/3 of employment and GDP and it is the only sector of
the European economy that has generated jobs in the last two decades. However,
the share of service firms that innovate is still lower when compared with the
level of innovation in the manufacturing sector, with the notable exception of ICT
services, where R & D expenditures seem to be as important as in manufacturing.
The empirical evidence suggests, furthermore, that non-technological innovation
plays a very important role in the service sector. Taking these issues in to con-
sideration the European Commission started to investigate what kind of policy
intervention can be most beneficial to EU service sector.
The analytical work were initiated when The Council of the European Union
obliged the Commission, in the light of the Communication Putting knowledge into practice: A broad based innovation strategy for the EU COM(2006)502, to
prepare by April 2007 an overall assessment on innovation in services evaluating
e.g. the related need for policy adjustments and to take into account the various
forms of non-technological innovation.
As a first step to follow this request, the Commission published in July 2007
a Staff Working Document “Towards a European strategy in support of innovation
in services: Challenges and key issues for future actions”, which analyses the
specific patterns of service innovation and identifies the main challenges to the
support of innovation in services with the view to fully exploiting their innovative
potential and fostering the growth of the service economy in Europe.
15 Commission of the European Communities, Innovation in Services..., p. 109.

48 Beata Lubos
In line with the recommendations drawn from the Communication and
the Staff Working Document the Commission announced the creation of a pan-
European platform to better link universities, entrepreneurship and finance in
order to foster innovative start-ups in the service sector. European Innovation Platform for Knowledge Intensive Services (KIS-IP) has been implemented
under the Europe INNOVA initiative. The aim of KIS-IP is to accelerate the take-
up of services innovations in Europe. The initiative focuses on the innovative
service solutions in technological and industrial fields by developing and testing
new or better innovation support mechanisms for innovative small and medium
sized enterprises (SMEs). The objective of the KIS-IP is to foster technological as
well as non-technological innovation in services, by helping innovative SMEs to
better exploit research results and to facilitate the search for investors and business
partners. The KIS-IP will develop new tools for innovation support, addressing
particularly the needs of innovative service companies with the ambition to grow
and internationalize fast.16
The platform consists of 3 sectoral networks and one horizontal action.
The already mentioned sectoral networks address the specific needs of inno-
vative services companies in ICT services, renewable energy and satellite based
applications and are expected to become the driving engines of the KIS-IP. Each
partnership is supposed to assess the specific research and skills needs of potential
high growth companies active in knowledge intensive services and help them in
establishing links with relevant research, finance and business partners. The part-
nerships will design, test and validate improved support mechanisms to the benefit
of KIS start-ups, with the aim of facilitating access to finance and networking with
described below clusters.
‒ “ACHIEVE MORE” aims to address barriers and challenges to the
development of KIS ventures in the ICT sector (software), by developing
a new, integrated toolkit that will be delivered through a network of 50
business incubators, 15 ICT clusters and 5 finance organizations.
‒ “KIS PIMS” will support services that cover the whole life of new tech-
nologies for renewable energy (solar, wind, hydro, biomass, geothermal),
including the planning of new systems, installation and commissioning,
maintenance/repair and scraping of old systems.
16 http://www.europe-innova.org/index.jsp?type=page&previousContentId=6344&cid=9207&l
g=EN.
49Towards policy supporting innovation in service sector in the EU
‒ “KIS4SAT” will establish an innovation support platform needed to stim-
ulate the launch and development of potentially high growth knowledge
intensive services ventures in the field of satellite downstream applica-
tions, by stimulating cross fertilization of expertise among 25 regional
clusters in this field and encouraging networking and partnership between
various research, finance, space industry and regional organizations.
A horizontal support action is to facilitate the coordination between the three
sectoral partnerships and promote the dissemination of their results. Furthermore,
a European repository on new organizational and business model innovation in
services is created and further promoted through a handbook on the facilitation
of organizational innovation in services. As a new element, a “business club” of
100 young innovative service companies in Europe with high growth potential
is to be established, providing a platform for mutual learning and exchange of
practical experience. Another key element is the organization of a prestigious
annual “European KIS Venture Contests” leading to a European service inno-
vation award.17
Under the EU2020 Strategy published in 201018 the EC strengthened once
more the need to promote and support innovation in services. In the light of the
strategy an open single market for services must be created on the basis of the
Services Directive, whilst at the same time ensuring the quality of services provided
to consumers. The full implementation of the Services Directive could increase
trade in commercial services by 45.0% and Foreign Direct investment by 25.0%,
bringing an increase of between 0.5% and 1.5% increase in GDP. Announced by
EU 2020 “Innovation Union” flagship project is aimed at improving framework
conditions and access to finance for research and innovation so as to ensure that
innovative ideas can be turned into products and services that create growth
and jobs. The flagship project which will largely define the direction of support
schemes under the new financial perspective is to be published on 8th of October
2010.
Additionally, the newly established Expert Panel on services innovation
chaired by Allan Mayo is therefore more specifically looking into the potential
17 http://www.europe-innova.org/index.jsp?type=page&previousContentId=6344&cid=9207&l
g=EN.
18 European Commission, Communication from the Commission, EUROPE 2020 A strategy for smart, sustainable and inclusive growth, Brussels, 3.3.2010 COM(2010) 2020, http://ec.europa.eu/
eu2020/index_en.htm.
50 Beata Lubos
role services innovation can play to further implement the Europe 2020 strategy.
The undertaken – new concept of “transformative” services innovation – helps to
better identify those areas where services innovation has a strong impact on the
economy and on the society.19
Conclusions
Apart from KIBS - driven mainly by technology, other service sectors may
in fact obtain less government and EU support. This case may justify the need for
policy intervention aimed at support for non-technological innovations – actually
both for industry and services – in order to keep the horizontal approach to inno-
vation policy.
Additional issue is to put a huge emphasis on building the crucial compe-
tencies and skills needed to run the innovation process in enterprises. It’s important
for both manufacturing and services, but it seems that this feature has the greatest
influence on the latter, where human factor is the essence of business and a main
driver of change.
On the other hand services innovation might be in some sense a much too
broad concept to be fully politically supported. There is therefore a strong need
to prioritize and make choices. The new Europe 2020 strategy suggests focusing
in particular on “transformative” services innovations that contribute to smart
growth, better environmental solutions and that give more people a better chance
to actively participate in societal life. There is a belief that some services inno-
vation may shape the future – the entirely new markets and industrial sectors.20
19 Mette Koefoed Quinn – a speech “Linking policy to practice: new initiatives in support of
services innovation” during the conference “Services innovation as a catalyst for the Europe 2020
Strategy”, Copenhagen 14–16 June 2010.
20 Ibidem.
51Towards policy supporting innovation in service sector in the EU
KSZTAŁTOWANIE POLITYKI UE
UKIERUNKOWANEJ NA WSPIERANIE INNOWACYJNOŚCI
SEKTORA USŁUG
Streszczenie
Nowoczesna polityka innowacyjna prowadzona przez większość krajów wysoko
rozwiniętych, w tym na szczeblu Unii Europejskiej, jest polityką horyzontalną – co ozna-
cza, że w jej projektowaniu nie uwzględnia się preferencji sektorowych. Znaczenie sektora
usług dla gospodarek powoduje jednak, że UE stale prowadzi prace nad polityką, która
zwiększałaby potencjał sektora usług. Oznacza to m.in. podjęcie działań na rzecz zapew-
nienia, że instrumenty wsparcia są w równym stopniu dostępne dla sektora produkcyjnego
i usługowego. Ze względu na specyfikę sektora usług, UE bierze również pod uwagę
konieczność zaprojektowania instrumentów uwzględniających kluczową rolę innowacji
nietechnologicznych w usługach oraz konieczność rozwoju kapitału ludzkiego, którego
potencjał i otwartość na zmiany stanowią motor rozwoju tego sektora. Jednakże praw-
dziwe wyzwania stojące przed unijną polityką innowacyjności związane są z zapewnie-
niem pełnej implementacji zapisów nowej strategii gospodarczej – Strategii Europa 2020,
która opiera się m.in. na założeniu zwiększania kontrybucji sektora usług do unijnego
PKB. Istnieje przekonanie, iż niektóre rodzaje usług mogą się przyczynić do powstania
nowego ładu gospodarczego – powstania nowych rynków i sektorów przemysłowych.

SCIENTIFIC JOURNAL
NR 670 SERVICE MANAGEMENT Vol. 7 2011
PAWEŁ NIEDZIÓŁKAWarsaw School of Economics
POST-CRISIS INTERNATIONAL CO-OPERATION WITHIN BANKING REGULATIONS
AND ITS IMPLICATIONS FOR POLAND
Introduction
The financial crisis has exposed shortcomings in the construction and
operation of the global financial architecture. After a period of fiscal and monetary
expansion which allowed the relatively rapid beat recession it is time to reflect on
the causes of the crisis and its consequences in a significant increase in public debt
which can become a source of new crisis. Perturbations in the global financial
market in the years 2007–2009 showed the need to build a transnational financial
safety net to strengthen international co-operation of deposit guarantee schemes
and the implementation of new (of a counter-cyclical nature) solutions for capital
adequacy. Low transparency of the eco – financial performance of banks after the
collapse of Lehman Brothers caused a loss of mutual trust and credit crunch in
the interbank market while highlighting the structural weakness of many banks
financing their activity with short-term revolving financing in the interbank
market. Significance has become liquidity which standards have not been defined
at the international level. Diagnosis of the causes of global financial crisis has
led to the conclusion that the response to globalization which is reflected in inter
alia large speculative capital mobility should be coordinated international man-
agement of financial stability. The consequences of this approach are:
54 Paweł Niedziółka
‒ consensus reached on the G-20 summit in Toronto (26–27 June 2010)
followed by the Basel Committee on Banking Supervision (1 September
2010) for strengthening the capital base of banks, improve the quality of
own funds and the intention to implement in the future liquidity standards.
Initiatives described above are intended to increase banks’ capital buffers
absorbing any losses, reducing pro-cyclicality of regulatory capital and to
strengthen the stability of the banking business;
‒ change the formula for European banking supervision by increasing its
competences and introduction of the macro-prudential oversight institu-
tion (European Systemic Risk Council) in accordance with the guidelines
of the de Larosiere High – Level Group;
‒ the proposal presented by the European Commission on 12 July 2010 to
amend Directive 2009/14/EC on deposit guarantee schemes, aiming at
standardization of 2012 principles of operation of these systems, the intro-
duction of supervision over them and implementation of mechanisms for
inter-lending between national deposit guarantee funds;
‒ Swedish initiative presented in January 2010 referring to the international
coordination of the process of introducing bank tax.
This study focuses exclusively on the last of the issues mentioned above. Its
aim is, firstly, to present the diversity of recommended solutions (mostly resulting
from the different use of the expected revenue from the tax), on the other hand, an
analysis of the potential result of introduction of a new levy in Poland.
1. Bank tax or fee? – selected definitional issues
New tribute from the financial sector is commonly referred to bank tax,
though:
‒ not in all countries it is taken only from banks (e.g. in Belgium has also
charged insurance companies and brokerage houses),
‒ in some cases the proceeds are to supply the stabilization fund not the state
budget (e.g. Belgium, Sweden and Germany).
Taking this into account, one should consider 4 possible forms of
contribution:

55Post-crisis international co-operation...
Table 1. Forms of contribution of the financial sector
Destination of levy
Institutional scope of regulations
Solely banksBanks and other financial/
credit institutions
State budget Bank Tax Financial Tax
Stabilization Fund Bank Fee Financial Fee
Source: author’s description.
2. Public support for banking sector as an origin of bank tax
To prevent bank panic and the domino effect in many countries governments
directly involved themselves in rescuing banks in danger of losing liquidity or
even solvency.
Table 2. Public support for banking sector – nationalisation
State Bank
United Kingdom Northern Rock
United Kingdom Lloyds
United Kingdom HBOS
Island Glitnir Bank
Island Straumur Burdars
Island Kaupthing
Latvia Parex
Source: author’s description.
Table 3. Public support for banking sector – increase of capital by use of public funds
[EUR]
State Bank Amount
1 2 3
Switzerland UBS 3.9 Bio
Netherlands ING 10 Bio
France Credit Agricole 3 Bio
France BNP Paribas 5.1 Bio

56 Paweł Niedziółka
1 2 3
France Societe Generale 1.7 Bio
Germany Commerzbank 18.2 Bio
Germany IKB Deutsche Industriebank n.a.
Belgium, Netherlands, Luxembourg Fortis 11.2 Bio
United Kingdom RBS 50 Bio
Source: author’s description based on K. Zdrojewski, Kryzys bankowy a nie spółdzielczy, www.
gb.pl, 23.02.2011.
Table 4. Public support for banking sector – other initiatives
State Bank Form of rescue
Denmark Roskilde Bank Liquidity support by central bank
USA – Buy-out of receivables under Paulson and Geithner Plan
Italy – Use of T-bonds for redemption of impaired receivables
Source: author’s description.
The initiatives listed in tables 2–4 often stood in contradiction with one of
the fundamental approaches of normative way of clarifying the impact of lender
of last resort (LOLR) in the banking sector during the crisis, namely the theory
of W. Bagehot. In this light, the support of the LOLR should be granted only
to entities characterised with creditworthiness with periodic liquidity problems.
Funding should be of a short-term and reversible with interest playing a disci-
plinary function. Doctrine of W. Bagehot corresponds closely to the principle of
constructive ambiguity of E.G. Corrigan, which manifests itself in recognition of
the role of the central bank as an institution, which only in some areas (market
liquidity and efficiency of the payment infrastructure) promotes financial stability.
With the approach of W. Bagehot argues W.Ch. Goodhart who pointed out the
difficulty in distinguishing between a bank which is characterized by liquidity
problems from an insolvent institution which he considered as a condition for
aid to be given also to insolvent banks. W.Ch. Goodhart believes that instead
the question of whether the institution setting interest rates in the economy and
responsible for the liquidity of the banking sector should be responsible for
financial stability you should ask whether the operator of liquidity and financial
stability should set interest rates.

57Post-crisis international co-operation...
Regardless of the discussion outlined above regarding the role of central
bank independence and its rationale, scope and form of public aid for the banking
sector, the fact is that significant expenditures were spent on bailouts. Although in
many cases there is declared the action recommended by N. Roubini, P. Krugman
and K. Rogoff that efforts to privatize the previously nationalized (capitalized)
banks during the post-crisis phase, but the process will be long and complicated.
3. The concept of an additional burden on the financial sector
The idea of an additional burden on the banking sector was born out of the
following reasons:
‒ it is necessary to provide a new source of funding for future aid programs
for the banking sector because the current level of public debt prevents
further fiscal expansion,
‒ it is necessary to introduce the element of co-insurance, i.e. the involve-
ment of private resources in order to meet possible future needs of the
banking sector,
‒ until there is no need to use funds from the bank tax to support the bank-
ing sector in countries that decide to direct revenues from new levy to
their budgets there will be improved performance of the budget deficit and
reduction of public debt.
In connection with the intention of the introduction in many countries bank tax
there are discussed the following issues:
‒ a level of tax/fee and scope of entities covered by the system,
‒ its mode of calculation (there are considered the following concepts of
the basis for calculation: assets, liabilities, minimum capital requirement,
assets adjusted for the most secure positions, the risk-weighted assets and
the managements’ bonus),
‒ destination of the tribute revenues (budget or a special fund).
Especially the last of these dilemmas is the major controversy since the fiscal
approach is identified with the ad-hoc solution, while the long-term objectives
are reflected in the stabilization fund which is dedicated to finance in the future
the restructuring or liquidation of banks. In May 2010 the European Commission
presented a proposal for a mechanism for the charges imposed on banks. These
fees would contribute to the stabilization fund from which funds could be used

58 Paweł Niedziółka
to restructure or liquidate bank but not to recapitalize banks in danger of losing
liquidity or solvency. The proposal of the European Commission resented in May
2010 gained the support of the European Council at its meeting on 17 June 2010.
There was then indicated the need to coordinate the implementation of fees and
taxes and need to be built in the above mentioned tribute mechanism inducing
financial institutions to construct portfolios characterized by reduced systemic
risk. The issue of bank charges and taxes will be discussed in a wider interna-
tional forum which will be the subject of the G-20 summit in Seoul in November
2010.1
Optimum concept from the perspective of the European Commission is
a joint European stabilization fund, although more often there is mentioned the
lack of reality of such a pool. Therefore we should rather think about the network
of national stabilization funds which treats European Commission’s Communi-
cation of May 2010 implying:2
‒ charging fees based on liabilities reduced by own funds and deposits cov-
ered by deposit guarantee fund,
‒ separation of banking fee revenues from the national budget (except for
the case where the proceeds would be used exclusively for the restructur-
ing of banks),
‒ need to reflect in the system a responsibility of an institution for financial
stability and systemic risk – that is why charges should be subject mainly
to the banks.
Table 5. Taxation in selected countries – revenues directed to budget
StateLevel of the
tax/feeThe method of calculation
and the subject scopeStatus
1 2 3 4
USA1 0.15%
Collected from the largest banks (with consolidated total assets exceeding USD 50 billion), takes into consideration risk of bank’s activity, the target amount of the fund – USD 120 billion over 10 years, calculation based on liabilities net of own funds and deposits guaranteed by deposit guarantee scheme
Concept
United Kingdom
50.0%On bank employees bonuses in excess of GBP 25,000
Applied once in 2010
1 Wybrane aspekty dodatkowego opodatkowania banków w kontekście debaty na forum Unii
Europejskiej, Narodowy Bank Polski, Warszawa, 15.10.2010, p. 1.
2 Podatek bankowy identyczny w całej Unii Europejskiej, „Gazeta Prawna”, 14.08.2010.

59Post-crisis international co-operation...
1 2 3 4
United Kingdom
In 2011 – 0.04%, then
0.07%
Calculation based on liabilities net of own funds (Tier 1) and guaranteed deposits, enforced on banks with balance sheet total more than GBP 20 billion, the interbank market for deposits with a term longer than 1 year reduced rate: 0.02% (since 2011) and 0.035% (since 2012)
Concept
France 50.0%Based on bank employees’ bonuses in excess of EUR 27,500 (not applicable to insurance companies)
Applied once in 2010
France 0.25%The system will cover solely banks – it is based on capital requirement
Concept phase, imple-
mentation planned from
1.01.2011
Hungary
Dependent on the type of financial institution
Introduced for the years 2010 – 2012. In the case of credit institutions charged on assets less selec-ted items (0.15% of assets to the HUF 50 billion; for other assets – 0.5%). In the case of insurance companies – 6.2% of the revised income from insurance; for asset management business – 0.028% of net assets
To be applied in 2011
* The introduction of the additional burden of the banking sector in the United States seems increasingly less
likely (or it may be not so severe for banks) because of the numerous voices that government’s bailout was
directed mainly to car producers, while banks have already paid back funds provided under TARP.
Source: author’s description based on: Wybrane aspekty dodatkowego opodatkowania banków...,
p. 10–17.
Table 6. Taxation in selected countries – revenues directed to stabilisation funds
StateLevel of the
tax/feeThe method of calculation and the sub-
ject scopeStatus
Germany Not more than 15% of net income; for banks loss-making – min. 5% of the calcu-lated charge
Calculation based on banks’ liabilities net of own funds and deposits from indi-viduals and on derivatives. The amount depends on the scale of their operations (0.02% for liabilities up to EUR 10 bil-lion, 0.03% in the range from EUR 10 billion to EUR 100 billion and 0.04% for liabilities more than 100 billion; for derivatives – 0.00015%)
Concept phase, but implementation plan-ned from 1.01.2011
Sweden 0.036% Calculation based on banks’ liabilities, excluding equity, bonds guaranteed by the state and subordinated bonds to reach 2.5% of GDP (probably in 2015). Only banks covered by the system.
Tax implemented in 2009. The intention of addiction in future charges against the risks incurred by banks and linking the system to fund the deposit guarantee scheme
Belgium n.a. Levied on bank deposits and the value of life insurance policies. The system com-prises: an entrance fee and annual fee.
Operating from 2010
Source: author’s description based on: Wybrane aspekty dodatkowego opodatkowania banków…
60 Paweł Niedziółka
In addition to bank charges within the European Union there is considered
the concept of taxation of the financial sector – there are taken into account two
types of taxes:3
‒ Financial Transactions Tax (FTT) – turnover tax on financial transactions,
based on Tobin’s idea, however difficult to implement due to the risk of
transfer transactions to other jurisdictions (although cross-border transac-
tions are subject to taxation) and the risk of transfer of operations outside
the banking sector (if subject to tax would be banks’ operations as institu-
tions that generate the highest systemic risk);
‒ Financial Activity Tax (FAT) – levied on profits, wages or profit/payroll
taxes above the specified level or the excessive rate of return on high
risk activities (excessive ROE) – difficulties to implement the above men-
tioned tax due to the problems of defining the activities with excessive
risk.
After numerous discussions in the forum of Ecofin and position taken by the
ECB, the European Commission eventually endorsed the idea of implementation
of the FTT, but only provided it would be introduced on a global level, which in
practice means at least temporarily halt work on the tax. Enjoys wide support the
idea of the FAT, for which the Commission considered that calculation should be
based on the profits of financial sector institutions and wages.4
5. The potential consequences of the implementation of bank charges in Po-land – conclusions
Bank levy can not be treated solely as a tool to reduce the budget deficit
which does not correspond to other measures aimed at reducing expenditures and
increasing revenues. State since collecting an additional tax on the banking sector
involuntarily assumes responsibility for the stability of the banking sector and
should therefore reckon with the need for additional spending in the future means
to rescue the banking sector. The close relationship between the bank tax and
bailout programmes provides an example of the United States, where the expected
tax revenue of approximately USD 100 billion is treated as a repayment of aid.
The introduction of bank tax is not only the improvement of the condition of the
3 Wybrane aspekty dodatkowego opodatkowania banków…, pp. 6–8.
4 Ibidem, p. 6.
61Post-crisis international co-operation...
budget and increase the stability of the banking sector and the entire financial
system, but also with certain negative consequences, including, inter alia:5
‒ violation of the principle of level playing field,
‒ regulatory arbitrage and seeking the most favourable jurisdiction for tax
regulations (among G-20 members there is no consensus as to introduc-
tion of bank tax – the concept is questioned by Canada, China and Italy),
‒ the risk of double charging transnational institutions in view of the absence
of harmonization of implementation of new national regulations (the prob-
lem relates inter alia branches of foreign credit institutions),
‒ increased operating costs of banks, which costs would be then passed on
to customers (costs associated with the introduction of bank charges or
taxes are not the only additional costs, which in future are held by banks
– there should be taken into account the expenses associated with strength-
ening the capital base and increase the coverage rate of deposits under the
Deposit Guarantee Scheme),
‒ an increase of moral hazard faced by far inadequate amount of expected
tax revenues in relation to the resources needed to rescue large banks.
Discussed in Poland an implementation of the concept of bank charges,
revenues from which would support Bank Guarantee Fund (BGF) corresponds to
the conclusions of the report produced in September 2010 by the Nyberg Group
and largely devoid of defects that result in the previously described negative con-
sequences for the Polish economy. The introduction of bank charges would lead
to a correction of the rules for calculating banks’ contributions to the BGF taking
into account the counter-cyclical mechanism for determining their height. The
management of funds by the BGF is so reasonable that this institution has the
most experience in the implementation of bank restructuring programs. Simu-
lation conducted by the National Bank of Poland for the value base of the fee
or tax (liabilities net of own funds and deposits guaranteed by the BGF) at PLN
634 billion indicates revenue of PLN 254 million applying rate of 0.04% or PLN
444 million for 0.07%.6 Cited level of charges would not result in reduction of
capital base of the sector and therefore the stabilization fund should contribute
to increasing confidence in the banking sector and create a new tool for crisis
management. The introduction of a tax or fee in accordance with the model used
5 Much of the threats mentioned above is indicated in the published in September 2010 the so-
called report of Nyberg Group.
6 Wybrane aspekty dodatkowego opodatkowania banków..., p. 12.

62 Paweł Niedziółka
in other European countries, namely the counting of tribute based on the liabilities
net of own funds and guaranteed deposits will probably change the formula for
the operation of many banks in Poland which finance their assets with loans from
their parent companies.7
MIĘDZYNARODOWA WSPÓŁPRACA
W ZAKRESIE REGULACJI BANKOWYCH
W OKRESIE POKRYZYSOWYM
ORAZ JEJ IMPLIKACJE DLA POLSKI
Streszczenie
Diagnoza przyczyn globalnego kryzysu finansowego doprowadziła do wniosku, iż
odpowiedzią na globalizację, której przejawem jest m.in. znaczna mobilność kapitału spe-
kulacyjnego, powinno być skoordynowane zarządzanie stabilnością finansową w wymia-
rze transgranicznym. Konsekwencją takiego podejścia są:
‒ uzgodnienia podczas szczytu G-20 i następnie w ramach Bazylejskiego Komitetu
ds. Nadzoru Bankowego (12.09.2010 r.) w sprawie wzmocnienia bazy kapitało-
wej banków, poprawy jakości funduszy własnych oraz intencji wdrożenia w przy-
szłości norm płynności;
‒ zmiana formuły funkcjonowania europejskiego systemu nadzoru banko-
wego przez zwiększenie jego kompetencji i wprowadzenie instytucji nadzoru
makroostrożnościowego;
‒ przedstawiona przez Komisję Europejską propozycja ujednolicenia od 2012 r.
zasad funkcjonowania systemów gwarantowania depozytów, wprowadzenia
nadzoru nad nimi oraz wdrożenia mechanizmów wzajemnych pożyczek między
systemami;
‒ przedstawiona w styczniu 2010 r. szwedzka inicjatywa międzynarodowej koor-
dynacji procesu wprowadzania podatku bankowego.
Niniejsze opracowanie koncentruje się wyłącznie wokół ostatniej z wymienionych
kwestii. Jego celem jest z jednej strony przedstawienie różnorodności rekomendowanych
rozwiązań (najczęściej wynikającej z odmiennego przeznaczenia oczekiwanych wpływów
z podatku), z drugiej – analiza konsekwencji wprowadzenia nowej daniny w Polsce.
7 Strzelają do banków z trzech stron. Czy nowy podatek ma sens? – interview with W. Kiciński,
„Gazeta Wyborcza”, 11.10.2010.
SCIENTIFIC JOURNAL
NR 670 SERVICE MANAGEMENT Vol. 7 2011
OLGA NOSOVA Kharkov National University of Internal Affairs
THE ECONOMIC CONVERGENCE OR DIVERGENCE PROCESSESIN THE UKRAINIAN REGIONS
Introduction
The international competition intensification brings up the question of the
adaptation for the global financial shocks, and the economic mechanism elabo-
ration, stimulating the economic growth. The globalization and regionalization are
related to contrary tendencies, which are popularized in the contemporary world
economy. The human capital, financial resources, company mobility increase are
interrelated with the following processes. The access to capital, labour technology
and intellectual capital aggravate the fierce competition between foreign com-
panies and domestic firms. The free movement of goods and services, capital
barriers reduction stimulate the international economic relations development, and
create conditions for further gain through economies of scale. The regional com-
petitiveness depends on their capability to maximize the limited resources in the
mobile and changeable environment. The value of regional resources endowment
defines the possibilities of regions to withstand the challenges of global shocks.
The need for regional inequalities levels elimination anticipates income per capita
equalisation.

64 Olga Nosova
Numerous authors emphasize the existence of variety theories in regional
economics. Robson1 argues that the branch of economic analysis that deals
formally with the economics of regional international economic integration is of
quite recent origin. Tondl considers the common macro-economic views, where
regional economics explains regional inequalities.2 Neo-classical approach argues
the supply side of economics. Proponents of regional policy study the demand
factors.
The theory of economic integration strengthens the interaction of national
economies on the basis of cooperation and international division of labour, and
considers it as interrelated processes. The initial integration principle suggests
ensuring sustainable and secure development at the levels of national economy and
the independent economic agents. The classical theory of international economic
integration proves the basic conditions for successful integration: the closeness
of the levels of the economic development. It assumes the economic internation-
alization of the partner-countries, and the availability of highly developed ties
among the integrated countries. The preference of regional integration concludes
in the joint solution of economic and social problems at the level of regions.
Molle underlines the dynamic interpretation of the term “economic integration” as
a process whereby economic frontiers between member states are gradually elim-
inated with the formerly separate national economic entities gradually merging
into a larger whole.3
The general problems of regional development relate to the lack of capital
investments, old capital assets, and high share of unprofitable enterprises, enter-
prise’s indebtedness, and insufficient infrastructure level in the majority of East
European countries. The comparison of regional economic indicators proves the
existence of regional disparities. The estimation of weak and strong regions is
directed to define if the regions are converging or diverging. The regional policy
identification is aimed to correct economic measures for inequality reduction, to
raise regional attractiveness, and to stimulate economic growth.
At present the empirical works are dedicated the significant role in the con-
temporary investigations. Econometric modelling is applied as an instrument of
1 P. Robson, The Economics of International Integration, fourth edition, Routledge 1998,
p. 352.
2 G. Tondl, Convergence after Divergence, Springer Vienna, New York 2001, p. 264.
3 W. Molle, The Economics of European Integration. Theory, Practice, Policy, fourth edition,
Ashgate 2006, p. 4.
65The economic convergence or divergence processes...
economic analysis of development tendencies in regions. Modelling of the effec-
tiveness of the decision making process identifies its consequences at the regional
level. The regional per capita disparities smoothing relates to the key problems of
regional policy. The literature shows the existence of different economic concepts
relating to the achievement of efficient development at regional level.
1. The Theoretical Analysis of the Economic Convergence or Divergence Processes
The analysis of the economic convergence (divergence) relates to the important
question of regional policy peculiarities in different countries. The convergence
theory is considered the economic development as a process, which proves the
rapprochement of the levels of economic development with the subsequent amal-
gamation in future. The premise for this process is country’s industrialization,
which leads to urbanization, and results in per capita income increase, creation
new jobs in industry, trade and commerce and service sector. Scientists determine
two stages of convergence process. Sigma (σ) convergence defines the standard
deviation of per capita income, which is determining the reduction of a gap over
time in the cross-sectional dispersion of per capita income of product. Beta (β)
convergence occurs through a reduction and closing gap of per capita income
between regions over time. It is estimated via constant or rising coefficients of
variation. The divergence concept defines the increase of the quantity and quality
diversity within countries, regions and leads to variety increase, and complexity
in the society.
The convergence (divergence) approaches could be classified in the fol-
lowing types:
‒ study the differences per income determination via σ (Sigma) and β (Beta)
estimation;
‒ analysis of the convergence stages of the European Union and regional
economic divergence;
‒ assessment of the relationship between regional and urban disparities.
Majority empirical works examines the differences per capita income deter-
mination. The well-known in the literature view by Barro and Sala-i-Martin argues
that the capital moves from the region with low per capita income to the high per
capita income until the differences in rates of marginal returns to capital between

66 Olga Nosova
regions is equal zero. As a consequence of it the income per capita is equalized
between regions.4 The standard neoclassical model approach explains the
appearance of disparities per capita from differences in regional capital and labour
ratios diminish over time. Proponents of the opposite opinion give arguments of
the regional productivity differentials and labour market imperfections existence.
Hall and Ludvig argues with Barro ans Sala-i-Martin approach, that convergence
occurs as poorer countries or regions exhibit higher rates of growth over time.
They hold the opposite opinion that the convergence through an equalization of
per capita income between regions is more likely to be found in higher income
countries than in lower income countries. The authors strengthen that the ‘crucial’
neoclassical assumption that capital will face diminishing returns in the higher
income region and consequently move to increase output in the lower income
region – leading to Beta convergence – is indeed spurious for regions of Germany
since the start of reunification.5 Empirical evidence shows the existence of the
discrepancy between economic application and theoretical postulates of the neo-
classical model.
The literature provides the different views for pace and consequences of con-
vergence (divergence) process in different countries. Funke and Strulik examine
the issue of regional convergence across Germany allowing heterogeneity over
cross-sections and over time. The authors apply Bayesian panel data techniques to
estimate different convergence rates and steady states for each cross-section unit.
The results show that growth in the West Germany Lands consistent with tradi-
tional conditional β-convergence hypothesis. The 11 states do not share a common
steady state.6 de la Fuente adheres the opinion that instead of slow but absolute con-
vergence to common income level across Spanish regions leads to extremely rapid
convergence but to very different steady states, and, therefore, to the indefinite
persistence of large regional disparities. Accounting for factor stocks and flows
and for technological diffusion reduces the unexplained long-term dispersion of
productivity levels by somewhere between one-third and one-half.7
4 R. Barro, X. Sala-i- Martin, Convergence, “Journal of Political Economy” 2006, vol. 100,
no. 21, p. 223.
5 J. Hall, U. Ludvig, Economic Convergence Across German Regions in Light of Empirical Findings, “Journal of Economics” 2006, no. 30, p. 951.
6 M. Funke, H. Strulik, Regional Growth in West Germany: Convergence or Divergence?, “Eco-
nomic Modelling” 2000, vol. 16, issue 4, pp. 489–502.
7 A. de la Fuente, On the Sources of Convergence: A Close Look at the Spanish Regions, “Euro-
pean Economic Review” 2002, no. 46, p. 591.
67The economic convergence or divergence processes...
The investigation of some empirical works demonstrates the absence of
constant tendency for convergence in the world. Estrin argues that transition has
been less successful in convergence terms in other CIS countries, where starting
from a very low base the situation deteriorated between 1994 and 2001, though
the gap has closed a little since then.8
The literature on the regional convergence (divergence) shows that the
majority of works are applied the cross-sectional averages or starting values for
time-series data. The use of this approach does not provide the estimation of unob-
served region specific differences, and does not account the important changes
during the period of time. de la Fuente, Vives define income convergence (or di-
vergence) as the composition of different convergence processes in labour produc-
tivity and in the participation and unemployment rates, which, in turn, reflect the
evolution of factor endowments and sociodemographic factors.9 Higher education
is important for technology transfer. Technological catch-up, the equalization of
educational levels, and the redistribution of employment across regions account
for most of the observed reduction of regional disparities.
Austin, Schmidt considers total per capita incomes across the region, the
Great Plains. It shows a Beta convergence speed over the past quarter century
roughly equal to that found for activity measures in previous analyses of nation
groups, continental regions, and states of the U.S. A dispersion of total per capita
incomes in the region – a Sigma convergence is stabilized during the past decade.10
Carrington11 receives similar to the above mentioned results. He suggests a quan-
titative evaluation of the role of location in regional convergence, using the
argument that growth in each region depends not only on its own characteristics,
but also on those of the regions that form the neighbourhood to which it belongs.
The results emphasize that EU regions did converge at a rate close to 2 per cent
mark, neighbourhoods of regions diverged at an almost equal rate, leaving a net
effect of convergence considerably smaller than the one previously reported in
literature. The above listed theoretical and empirical works demonstrate the dis-
8 S. Estrin, Transition After the Crisis, “Development & Transition” July 2009, issue 13, p. 8.
9 A. de la Fuente, X. Vives, Infrastructure and Education as Instruments of Regional Policy: Evidence from Spain, Regional Policy and Spain 2008, p. 28.
10 J.S. Austin, J.R. Schmidt, Convergence And Divergence in a Region, “Growth and Change”
Winter 1998, Blackwell Publishing, vol. 29, no. 1, pp. 67–88.
11 A. Carrington, A Divided Europe? Regional Convergence and Neighbourhood Spillover Ef-fects, “Kyklos” August 2003, vol. 56, pp. 381–393.
68 Olga Nosova
crepant results, which prove the existence of inconsistency between theoretical
approach and its application at the regional level. The need for further thorough
research in the sphere of the convergence (divergence) theory application would
be directed to explain the existing unsolved questions.
The other group of scientists focuses their attention on the analysis of the
convergence stages of the European Union (EU) countries. One could mention
that European integration takes place in a world in which national systems become
more and more interwoven. Some researchers point out the necessity of the EU
strengthening in the framework of competitiveness aggravation among countries
within the European region and within the Triad countries. The rest takes part in
the debates over the impact of enlarging European economic and monetary inte-
gration on the regions of the EU.
The widely discussed question among scientists is whether the European
Monetary Union (EMU) leading to regional economic convergence or regional
economic divergence. Christodoulakis (2009) points out the consequences of
EMU for the countries of the Euro Area. The asymmetric shocks have been
subsided after creation of the single currency. He argues in favor of the emergence
of unprecedented current account deficits in the southern Euro Area countries,
while the northern ones enjoy substantial surplus. New policy priorities are sug-
gested to admit in the Euro Area that put more emphasis on convergence and
competitiveness.
Martin (2001) presents the analysis of patterns of regional productivity trends
and employment growth over the period 1975–1998. The worker productivity
shows only very weak convergence across the EU regions, regional employment
growth has been sharply divergent. Carluer considers that the choice facing the
European Commission reflects the crucial dilemma between size and integration
and between equity and growth. He suggests four main scenarios of European
development: the strengthening of concentration, the diffused metropolization,
the increase of regional inequalities and the polycentrism. The empirical results
confirm the role of agglomeration economies (density, regional capitals) and coex-
istence national convergence and regional divergence for the Western countries
and the converse for the Eastern one.12
The study of relationship between regional and urban disparities is related
to another direction of convergence (divergence) investigation. Granahan (2002)
12 F. Carluer, Managing Conflict in Economic Convergence of Regions in Greater Europe, Else-
vier Science Publishing Company 2007.
69The economic convergence or divergence processes...
emphasizes the rural-urban differences, differences according to labour market
size, and differences by education as the basic factors for regional disparities in per
capita income in the US in 1969–1998. The author considers the rural-urban dif-
ferences are a major component of overall regional inequality, accounting for about
half of all interregional disparities in the US. Rural –urban differences increased
in all European countries in 1980th–1990th.13 One could mention that educational
differences should be taken into account besides other factors of rural-urban dif-
ferences. Tondle, Vuksic (2003) provide empirical analysis for East European
regions for the period 1995–2000 and find out that foreign direct investment
was a paramount for growth in that period. EU border regions and capital areas
outperformed others. The high level of secondary education played no role. de
la Fuente, Vives (2008) finds out that the equalization of schooling levels and
effective stocks of public capital would reduce the dispersion of regional incomes
in Spain by around one-third in the long run, with infrastructure accounting for
a bit less than half this total.14
The theoretical analysis of the basic economic convergence (divergence)
concepts brings to the conclusion of the importance efficient regional policy
adoption. The study of empirical works on convergence (divergence) shows that
they are not adequately explained by the neoclassical model. The neoclassical
model does not take into account the most significant differences between regions,
and does not examine the specific factors. The reduction of the differences in
regional capital/labour ratios and proportional income distribution between
regions will lead to regional inequalities smoothing.
2. The Economic Performance and the Regional Peculiarities in the Ukraine
The process of regionalisation defines a utility maximization of regional
rights widening in the resources’ disposable. The territorial division of labour,
regional specialization and cooperation cause the rise of region’s interdependence.
Economic and cultural diversity is explained via different adequate provision of
material and social well-being at the Ukraine’s regional level. The Ukrainian
13 D. Mc Granahan (2002), Regional Convergence and Divergence in the US, 1969–98, http://
www.oecd.org/dataoecd/36/49/1937482.docp.9.
14 A. de la Fuente, X. Vives, op.cit., p. 39.

70 Olga Nosova
regions are distinguished between industrialized east and rural western regions.
The eastern region is specialized on production of basic industry, including met-
allurgy and machine building, engineering, construction of electromechanical
machines, coal extraction and etc. The western region traditionally has agrarian
production orientation. The favourable recreation areas are not completely used
due to the insufficient services sector development.
The current global financial crisis affects East European countries’ devel-
opment. In the period of crisis the economic and social disparities within country
are raised. The number of depressed regions increases, and the regional differences
exacerbate. The global financial crisis forecast drop in GDP is about 4 per cent and
at least Latvia and Ukraine are likely to face double – digit decline.15 The fixed
exchange rate to US dollar evokes the speculative motives for short-term lending
from European banks, and results in increase the balance of payments deficits.
In accordance with the State Statistic Committee in Ukraine the real gross
regional product (GDP) reduces by 7.2 per cent in 2009. The estimation of the
basic economic indicators shows the tendency of industrial production shortage
in heavy industry, including metallurgy and coal extraction industry. The high
production costs, inefficient labour organization, and undeveloped infrastructure
result in asymmetry of regional development. The assessment of Ukrainian com-
petitiveness in 2000–2005 demonstrates the markets concentration at national level
and the high degree between regional markets.16 The competition is still weaker
at regional level. Concentration has a negative and highly significant effect on
labour productivity growth.17
Nevertheless of human capital endowment in Ukraine, one could mention
the low labour productivity level in basic sectors of economy. The relatively low
wage rate in the basic sectors of economy does not create stimulus for work com-
petition for high quality of production and better working conditions. The real
growth of overall productivity makes up 5.97 per cent of real GDP per person
employed in 2006. The labour productivity per person employed per hour is
15 A. Aslund, Implications of the Global Financial Crisis for Eastern Europe, “Development
& Transition” July 2009, issue 13, p. 2.
16 O.V. Nosova, Statistical Analysis of Regional Integration Effects, “Statistische Diskussionsbe-
iträge”, Universität Potsdam 2008, Nr. 32, p. 10.
17 OECD, Economic Assessment of Ukraine 2007: Raising Competitiveness of the Economy,
Policy Brief, p. 2.

71The economic convergence or divergence processes...
equaled to $ US 9.17 at the same period of time.18 These indicators outline the low
labour productivity per capita in the Ukraine comparing to world competitiveness
estimation in 55 countries. Shehovzeva outlines the regional competitiveness use
which defines the regional labour and capital combination. Gross regional product
per capita is the most significant index characterizing the regional potential for
producing goods and services.19
The regional competitiveness estimation of 12 Ukraine’s regions based on the
methodology of Global Competitiveness Index (GCI) in international comparison
in 2005 examines that Kyiv, Dnipropetrovsk, Sumy, Donetsk, Lviv are ranked
on the first tier of regions between Croatia and behind Vietnam. The second tier
of regions includes Poltava, Crimea and Vinnytsya regions, which take positions
below Ukrainian average but ahead of Argentina. The third group Kherson and
Cherkasay occupies a very low position between Uruguay and behind Bosnia
and Herzegovina (table 1).20 The scores of the best and worst performing regions
make up 5 per cent above or below the national average. The estimation results
point out the lower level divergence in terms of GRP per capita. Hanouz, Geiger,
Panov (2008) make a conclusion that the degree of economic divergence between
Ukrainian regions is moderate compared to other countries.21
Table 1. The Competitiveness Positions of the Ukrainian Regions in the World
RankCountry/ Economy/
RegionScore Rank
Country/ Economy/ Region
Score
1 2 3 4 5 6
52 Croatia 4.25 74 Donetsk 4.07
53 Kyiv 4.25 75 Ukraine 4.07
54 Dnipropetrovsk 4.24 76 Botswana 4.07
55 Cyprus 4.23 77 Egypt 4.06
56 Kazakhstan 4.23 78 Poltava 4.02
57 Zkarpattya 4.22 79 Phillipines 4.02
18 IMD World Competitiveness Yearbook 2008, p. 368, http:// www.imd.ch/wcy09.19 L. Shehovzeva, Методология разработки стратегии развития окраинного региона
страны в условиях ОЭЗ. Прогнозирование и стратегии развития особой экономической зоны
России. Межвузовский сборник научных трудов, Калининградский университет, Калининг-
рад 2000, pp. 20–32.
20 M.D. Hanouz, T. Geiger, The Ukrainian Competitiveness Report 2008. Towards Sustained
Growth and Prosperity, World Economic Forum 2008, Geneva, p. 101.
21 Ibidem, p. 104.

72 Olga Nosova
1 2 3 4 5 6
58 EL Salvador 4.20 80 Romania 4.00
62 Russian Federation 4.14 81 Crimea 3.99
63 Lviv 4.14 82 Vinnytsya 3.98
64 Jamaica 4.14 83 Argentina 3.98
68 Costa Rica 4.10 90 Uruguay 3.91
69 Khmelnytsky 4.10 91 Kherson 3.90
70 Brazil 4.10 92Bosnia and Herzegovina
3.86
72 Vietnam 4.08 93 Cherkasy 3.85
73 Sumy 4.07 94 Armenia 3.82
Source: M.D. Hanouz, T. Geiger, op.cit., p. 101.
The Ukrainian regions obtain diverse innovation potential and capacities.
The financial shortage causes the reduction of the quantity of enterprises applied
the innovations. The specific gravity of such enterprises decreases in the total
volume of sold industrial production from 18 per cent in 2000 to 13 per cent in
2008. The lack of sufficient financing in innovations in regions causes the need
for close links between business and R & D application.
The global financial crisis has significant impact on the deterioration of
domestic and external demand. The production output decrease in basic sectors of
Ukrainian economy. The volume of industrial production, fixed capital investment,
exports and imports of goods and services decreases in the first quarter in 2009.
The consumer price index and inflation increase. To highlight the inflation rise
estimates the available data. Inflation accelerates to 16.6% in December 2007 that
the highest level in seven years. The rise in food prices in international markets
and energy price shocks cause to cost-push inflation. The current account and
financial account deficit is covered by the interventions of the National Bank of
Ukraine.
The challenge of global downturn provides the rise of number of unde-
veloped regions and the interregional disparities aggravation. The basic task of
regional policy is aimed to study the causes of regional differences, suggest the
scenarios for smoothing regional inequalities, and create adequate mechanism for
low economic potential regions development. Scientists apply the following types
of econometric models for studying regional integration in the Ukraine:
1. Empirical model.
2. Cluster analysis model.

73The economic convergence or divergence processes...
Reutov (2006) estimates the competitiveness of international regional
economic systems on the basis of parameters, technique of calculation, and
suggests the uniform integrated parameter of competitiveness of region.22
Shportyuk, Movchan (2007) explore some economic assessment of regional inte-
gration options for Ukraine, and suggest the scenario of the continuation of the
mixed strategy of regional integration, the establishment of Free Trade Area with
EU and the different options of regional integration within the CIS.23
Demchuk, Zelenuk (2009) find no significant differences in distributions and
aggregate efficiencies between the agricultural and industrial regions in Ukraine.
Theу mention a rapidly increasing gap between the capital (Kyiv) and all the
regions since 2001. The authors find robust evidence that the efficiency of regions
is positively related to alcohol and tobacco consumption, and inversely related
to criminality in the region. The amount of capital in the region and its wealth is
positively associated with efficiency level of this region.24
Polyakova, Babez (2006) examine the main tendencies of regional inno-
vation systems formation and conduct the cluster analysis of Ukrainian regions in
2003. They use the total volume of innovation costs per one thousand employed,
internal current R&D costs, the number of applied patents, the number of people
involved in R&D, the number of enterprises used innovations in their model.25
The authors classify regions in 4 groups, where 1. the highest innovation activity;
2. the high innovation activity; 3. the average innovation activity; 4. the low inno-
vation activity. 15 regions are estimated as backward areas with low potential for
innovations. This research describes the uneven and insufficient development in
Ukrainian regions.
The Ukrainian economic performance shows the dependence on world con-
juncture. The coefficient export covering import makes up 0.87 for the period
from January to June 2009 in comparison to 0.74 for the same period in 2008.
The regional imbalances cause the need for redistribution mechanism foundation
22 V. Reutov, Міжнародна конкурентоздатність регіону: сутність, методи оцінювання,
Економіка та держава no. 4, pp. 52–54.
23 V. Shportyuk, V. Movchan, Regional Integration Choice for Ukraine: Between the EU and
Russia. Paper presented for the Ninth Annual Conference of the European Trade Study Group, Con-
ference Proceedings, Athens September 2007, p. 18.
24 P. Demchuk, V. Zelenuk, Testing Differences in Efficiency of Regions Within a Country: the
Case of Ukraine, “Journal of Productivity Analysis” 2009. Springer Science Media, LLC, p. 11.
25 U. Polyakovа, I. Babez, Перспективи участі регіонів України у формуванні національної
інноваційної системи в умовах глобалізації, Регіональна економіка 2006, no. 3, p. 102.
74 Olga Nosova
into financing the development of depressed regions with low income per capita.
The fiscal equalization could be provided until these regions could reach the
level of average income per capita in Ukrainian regions. The determination of the
regions, which are oriented on diversification of industrial structure, priority inno-
vation development, will stimulate economic growth and will affect the growth in
backward regions.
Conclusions
The analysis of empirical works on convergence (divergence) depicts that they
are not adequately explained by the neoclassical model. The neoclassical model
does not take into account the most significant differences between regions, and
does not examine the specific factors. The research strengthens the dependence
of regional cluster classification on the input factors of production combination in
Ukrainian regions.
Our results suggest that the special regional policy measures may be the
effective for regional inequalities reduction, and the economic growth stimulation.
Efficient allocation of resources aims t provide the adoption of micro and macro
economic measures for labour productivity per capita increase, concentration
of production growth, entrepreneurship development; and the regions’ competi-
tiveness positions improvement. The spillover effect, reduction of regional pro-
ductivity differentials, and labour efficiency rise are stimulated by foreign capital
inflow and labor force education and training. Lasting a long time regional growth
could be achieved on the basis of elaboration and application of innovations in all
sectors of production in regions.
PROCESY KONWERGENCJI I DYWERGENCJI NA UKRAINIE
Streszczenie
Analiza empirycznych wyników badań w zakresie konwergencji wykazała, że te
procesy nie są wystarczająco dobrze wyjaśniane przy wykorzystaniu modelu neoklasycz-
nego. Wyniki badań przeprowadzonych na potrzeby pracy świadczą o tym, że efektyw-
nym rozwiązaniem dla zmniejszenia nierówności w rozwoju gospodarczym pomiędzy

75The economic convergence or divergence processes...
regionami byłoby przyjęcie specjalnych polityk regionalnych, uwzględniających pro-
duktywność pracy i kapitału zarówno na poziomie mikro, jak i makroekonomicznym.
W artykule wskazano ponadto na istotę innowacji oraz inwestycji zagranicznych w roz-
woju regionalnym.

SCIENTIFIC JOURNAL
NR 670 SERVICE MANAGEMENT Vol. 7 2011
GRAŻYNA WĘGRZYN
Wroclaw University of Economics
THE INFLUENCE OF THE WORLD CRISIS ON THE EMPLOYMENT IN SERVICE SECTOR IN EUROPEAN UNION
Introduction
Services sector is dominant in modern highly-developed market economies
in the respect of producing value added as well as the number of workplaces.
In highly-developed market economies service sector generates about 70% of
gross value added and employs over 70% the whole of the employed. Services can
be taken to be the core of economic growth in the last thirty years of all developed
market economies. Crowding out of modern economies is a continuing process
and can constitute one of the most synthetic measures of the social-economic
progress. A dynamic economy is exemplified by a great deal of “job churning”,
meaning that jobs are created and destroyed on a continuous basis. This process
takes place both within (intra) and between (inter) sectors.1 Many service activities
have become independent activities, outsourced from agriculture and, to an even
larger extent, the manufacturing and industrial sectors in which they were once
embedded.
Such a great significance of services in social-economic development jus-
tifies the need of their monitoring, especially in the period of world crisis. It is
1 World Employment Report 2004-05, Employment, productivity and poverty reduction, ILO,
Geneva 2005, p. 110.

78 Grażyna Węgrzyn
necessary to pay attention to how service sector and its separate subsections feel
the influence of the world crisis.
The aim of this study is to identify the following changes: number and
structure of workplaces. The analysis covers European Union countries in the
period of 2000 to 2008.
1. Employment in the European Union
In reaction to the economic downturn, the labour market in the EU had
started to weaken considerably in the spring/summer of last year, as employment
growth moderated from the high rates of 2006 and 2007. In the latter half of 2008,
in response of the financial crisis, employment growth subsequently deteriorated
even more strongly, turning negative from the quarter of 2008 on. Employment
in the EU had declined to 223 million by mid-2009, down by 4.3 million (1.9%)
compared with the level a year earlier, and mainly reflecting falls in employment
for men.2
The deterioration has been driven by labour reductions across all sectors
apart from public-sector-based services, but has been particularly marked in
the construction and industry sectors. Mostly reflecting significant drops of
1.3 million in construction and 1.9 million in non-construction-related industry.
Indeed, these two sectors combined account for more than 60% of all sectoral
employment declines over this period. Contraction in other sectors has been more
moderate, with employment declining by 0.8% in agriculture and by 0.6% in
services (1 million).
2. Services sector – basic characterization
At present a certain universal trend of development having some objective
factors is being observed. The process of crowding out economy occurs as a result
of a shift of consumerist demand together with the increase of incomes, towards
services. Also the increase of a demand for high-quality and more expensive
products which value added are often services. A crucial effect of this process is
2 Employment in Europe 2009, European Commission, Publications Office of the European
Union, Luxembourg 2009, p. 26.

79The influence of the world crisis...
Table 1. Employment of Services in the EU-27, 2008
Description Employment [%]
EU-27 69.4
Austria 70.1
Belgium 78.3
Bulgaria 52.5
Cyprus 75.5
Denmark 76.3
Estonia 61.4
Finland 69.6
France* 76.5
Greece 69.1
Spain 68.5
Ireland 68.6
Lithuania 51.7
Luxembourg 76.7
Latvia 64.1
Netherlands 80.3
Germany 72.5
Poland* 54.4
Portugal 60.5
Czech Republic 58.6
Romania* 38.7
Slovakia 62.0
Slovenia 56.8
Sweden 75.1
Hungary* 62.8
United Kingdom 80.7
Italy 67.9
* Data from 2007.
Source: Labour market statistics, European Commission, Publications Office of the European
Union, Luxembourg 2009, p. 28.
the increase of level in the standard of living and the societies’ quality of living.
Services make up a diversified subsection of economy which includes both gov-
ernment departments activities and non-profit institutions and first of all every
private enterprise having an attitude to gain profit (such as: banks, other financial
80 Grażyna Węgrzyn
institutions, forwarding companies, hotels and restaurants etc.). This heterogeneity
of services activities causes specific problems with classification of services.
Undoubtedly the evolution of the economies towards the service economies using
information techniques caused the abandonment from C. Clarks’ old paradigm
based on distinguishing the first, second and third sector. Such a division con-
stitutes epistemological barrier for understanding contemporary societies.3
The term services itself is not clearly defined in literature and evokes a lot
of controversy and developing revolution in information technology additionally
complicates it. The analysis of service sector is a very difficult assignment,
because the available statistics considerably limit empirical verification, not
coping with the changes which occur in economies. The significance of the sector
increases among others because of dynamic development of new fields of services.
The sector of Information Communications Technology in the last years is getting
more important, in the respect of the number of workplaces as well as producing
value added.4 The employed in the service sector in 2008 in The EU (27) made up
69.4% the whole of the employed (table 1). In separate countries this index was
clearly diversified. The highest one was in Great Britain (80.7%), the Netherlands
(80.3%) and in Belgium (78.3%). In Romania (38.7%), Poland (54.4%), Slovenia
(56.8%) and Portugal (60.5%) characterized by the lowest contribution in service
sector.
3. Changes in the employment in service sector
Employment in service sector comprises the dual sides of the decent work
spectrum: both high-skilled, high wage jobs and low-skilled, low wage com-
ponents. Additionally, the service sector is important for a policy focus because
it represents an overwhelming majority of output and labor in most developed
economies. In the developing economies the growth of services is expanding
rapidly in terms of output, employment and in some cases productivity.5
3 M. Castells, Społeczeństwo sieci, Wydawnictwo Naukowe PWN, Warszawa 2007, pp. 207–
208.
4 G. Rosa, Struktura i przeobrażenia współczesnego sektora usług, [in:] Współczesna ekonomi-
ka usług, Wydawnictwo Naukowe PWN, Warszawa 2005, p. 65.
5 World Employment Report…, p. 114.
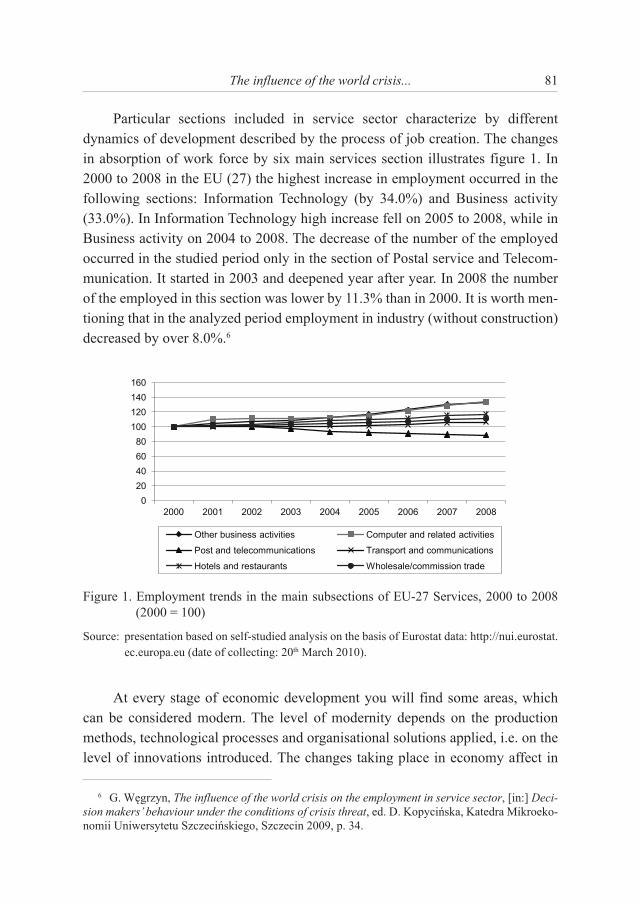
81The influence of the world crisis...
Particular sections included in service sector characterize by different
dynamics of development described by the process of job creation. The changes
in absorption of work force by six main services section illustrates figure 1. In
2000 to 2008 in the EU (27) the highest increase in employment occurred in the
following sections: Information Technology (by 34.0%) and Business activity
(33.0%). In Information Technology high increase fell on 2005 to 2008, while in
Business activity on 2004 to 2008. The decrease of the number of the employed
occurred in the studied period only in the section of Postal service and Telecom-
munication. It started in 2003 and deepened year after year. In 2008 the number
of the employed in this section was lower by 11.3% than in 2000. It is worth men-
tioning that in the analyzed period employment in industry (without construction)
decreased by over 8.0%.6
0
20
40
60
80
100
120
140
160
2000 2001 2002 2003 2004 2005 2006 2007 2008
Other business activities Computer and related activities
Post and telecommunications Transport and communications
Hotels and restaurants Wholesale/commission trade
Figure 1. Employment trends in the main subsections of EU-27 Services, 2000 to 2008
(2000 = 100)
Source: presentation based on self-studied analysis on the basis of Eurostat data: http://nui.eurostat.
ec.europa.eu (date of collecting: 20th March 2010).
At every stage of economic development you will find some areas, which
can be considered modern. The level of modernity depends on the production
methods, technological processes and organisational solutions applied, i.e. on the
level of innovations introduced. The changes taking place in economy affect in
6 G. Węgrzyn, The influence of the world crisis on the employment in service sector, [in:] Deci-sion makers’ behaviour under the conditions of crisis threat, ed. D. Kopycińska, Katedra Mikroeko-
nomii Uniwersytetu Szczecińskiego, Szczecin 2009, p. 34.
82 Grażyna Węgrzyn
turn the employment structure, where adjustments facilitate work productivity.
The demand for arduous manual labour requiring no qualifications whatsoever
decreases, with a simultaneous increase in demand for knowledgeable and expe-
rienced workers. These developments are accompanied by a change in job quality.7
Job quality is perceived as the sum total of job stability, pay level, working con-
ditions and the employee prospects for skills upgrading (training).
The economic downturn after the first quarter of 2008 was also noted among
the EU-27 service activities although most clearly in terms of turnover. In contrast
to the majority of industrial activities, the indices of persons employed by the
majority of service activities held relatively firm until the third quarter of 2008
before declining through until the end of the first quarter of 2009. However, there
were overall declines in the indies of persons employed in professional, scientific
and technical services (–0.8%), wholesale and retail trade (–1.0%), transport and
services (–2.0%), accommodation and food services (–2.1%) and particularly
administrative and support activities (–4.1%) in the year to the end of the first
quarter of 2009.8
The major change in job market is an increased employment in services,
related to a departure from the traditional employment forms. The forms of
employment in services are less rigid. This is visible in the growing popularity of
self-employment.9 The experience of developed countries proves that new tech-
nologies on the one hand coerce, and on the other facilitate the development of
new, non-standard forms of employment. Employment contracts are more and
more often short-term or project-related, while the proportion of long-term, full-
time job contract diminishes.
The service jobs characteristics are distinct from those typical of the
non-financial business economy (NACE sections C to I and K). This basically
refers to the proportion of women in employment, part-time employment and
self-employment. The European 2006 data on employment show that women
employed in services made 44% of the total service workforce, while in the non-
7 G. Węgrzyn, Działalność innowacyjna przedsiębiorstw a jakość miejsc pracy, ed. M. Noga,
M. Stawicka, Prace Naukowe Akademii Ekonomicznej we Wrocławiu, Wrocław 2008, p. 703.
8 S. Visocka, Economic downturn In the EU: the impact on employment in the business econo-my, “Statistics in Focus” 2009, no. 60, p. 4.
9 J. Hausner, Pętle rozwoju. O polityce gospodarczej lat 2001–2005, Wydawnictwo Naukowe
Scholar, Warszawa 2007, p. 157.
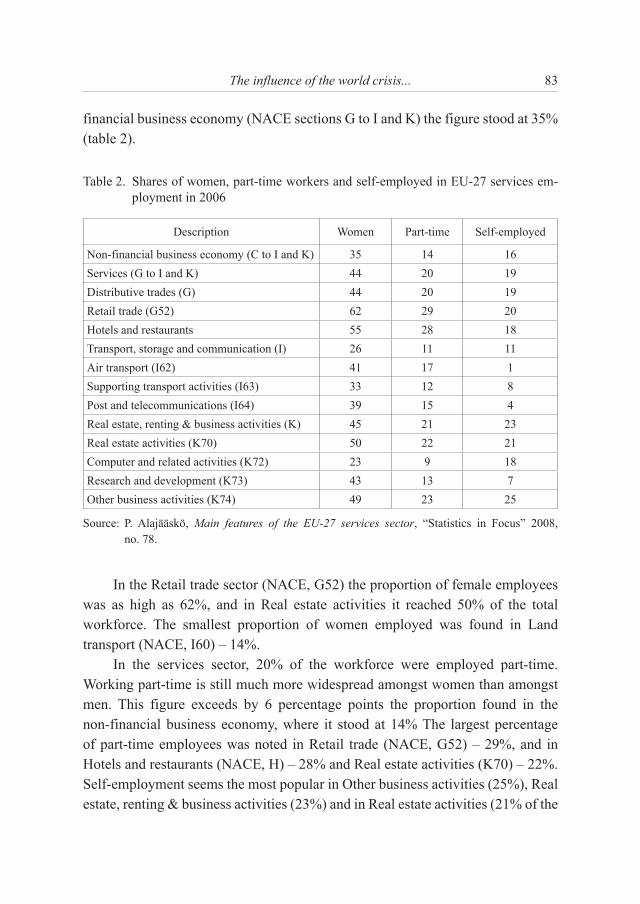
83The influence of the world crisis...
financial business economy (NACE sections G to I and K) the figure stood at 35%
(table 2).
Table 2. Shares of women, part-time workers and self-employed in EU-27 services em-
ployment in 2006
Description Women Part-time Self-employed
Non-financial business economy (C to I and K) 35 14 16
Services (G to I and K) 44 20 19
Distributive trades (G) 44 20 19
Retail trade (G52) 62 29 20
Hotels and restaurants 55 28 18
Transport, storage and communication (I) 26 11 11
Air transport (I62) 41 17 1
Supporting transport activities (I63) 33 12 8
Post and telecommunications (I64) 39 15 4
Real estate, renting & business activities (K) 45 21 23
Real estate activities (K70) 50 22 21
Computer and related activities (K72) 23 9 18
Research and development (K73) 43 13 7
Other business activities (K74) 49 23 25
Source: P. Alajääskö, Main features of the EU-27 services sector, “Statistics in Focus” 2008,
no. 78.
In the Retail trade sector (NACE, G52) the proportion of female employees
was as high as 62%, and in Real estate activities it reached 50% of the total
workforce. The smallest proportion of women employed was found in Land
transport (NACE, I60) – 14%.
In the services sector, 20% of the workforce were employed part-time.
Working part-time is still much more widespread amongst women than amongst
men. This figure exceeds by 6 percentage points the proportion found in the
non-financial business economy, where it stood at 14% The largest percentage
of part-time employees was noted in Retail trade (NACE, G52) – 29%, and in
Hotels and restaurants (NACE, H) – 28% and Real estate activities (K70) – 22%.
Self-employment seems the most popular in Other business activities (25%), Real
estate, renting & business activities (23%) and in Real estate activities (21% of the
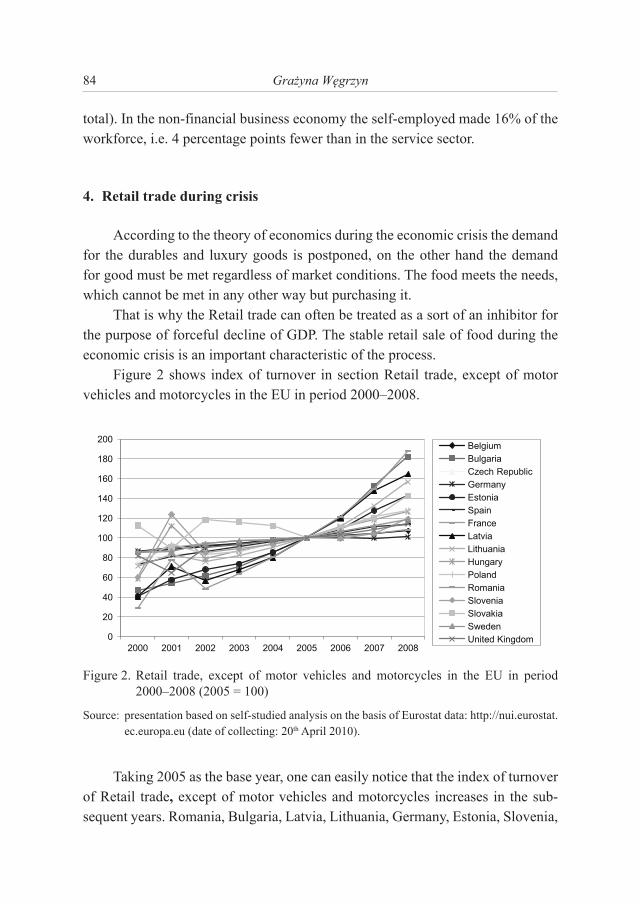
84 Grażyna Węgrzyn
total). In the non-financial business economy the self-employed made 16% of the
workforce, i.e. 4 percentage points fewer than in the service sector.
4. Retail trade during crisis
According to the theory of economics during the economic crisis the demand
for the durables and luxury goods is postponed, on the other hand the demand
for good must be met regardless of market conditions. The food meets the needs,
which cannot be met in any other way but purchasing it.
That is why the Retail trade can often be treated as a sort of an inhibitor for
the purpose of forceful decline of GDP. The stable retail sale of food during the
economic crisis is an important characteristic of the process.
Figure 2 shows index of turnover in section Retail trade, except of motor
vehicles and motorcycles in the EU in period 2000–2008.
0
20
40
60
80
100
120
140
160
180
200
2000 2001 2002 2003 2004 2005 2006 2007 2008
Belgium
Bulgaria
Czech Republic
Germany
Estonia
Spain
France
Latvia
Lithuania
Hungary
Poland
Romania
Slovenia
Slovakia
Sweden
United Kingdom
Figure 2. Retail trade, except of motor vehicles and motorcycles in the EU in period
2000–2008 (2005 = 100)
Source: presentation based on self-studied analysis on the basis of Eurostat data: http://nui.eurostat.
ec.europa.eu (date of collecting: 20th April 2010).
Taking 2005 as the base year, one can easily notice that the index of turnover
of Retail trade, except of motor vehicles and motorcycles increases in the sub-
sequent years. Romania, Bulgaria, Latvia, Lithuania, Germany, Estonia, Slovenia,

85The influence of the world crisis...
Slovakia and Poland are the countries of the highest values of index (ranging
from 194.2% in Romania to 134.4% in Poland). In 2000 Romania, Lithuania and
Bulgaria noted the lowest value of index of turnover – Retail trade, except of
motor vehicles and motorcycles.
Taking the 2005 as a 100% year can notice that 2008 as the year of the biggest
growth value Retail sale of food, beverages and tobacco occurred in Romania,
Bulgaria and Lithuania (Eurostat).
Table 3. Retail sale of audio and video equipment; hardware, paints and glass; electrical
household – index of turnover in EU (annual data, 2005 = 100)
Description 2006 2007 2008
Austria 102.6 106.1 108.7
Belgium 105.6 112.1 118.6
Bulgaria 127.6 180.5 195.3
Denmark 107.9 111.4 105.4
Estonia 159.7 183.9 161.1
Finland 108.5 118.3 120.2
France 105.3 112.6 114.9
Greece 116.9 126.3 122.1
Spain 106.3 107.4 91.5
Lithuania 101.7 120.2 130.0
Latvia 136.4 191.3 171.6
Germany 104.0 100.8 103.0
Poland 119.9 146.5 167.9
Portugal 101.4 105.1 105.3
Czech Republic 112.0 124.6 128.2
Romania 121.6 164.1 200.6
Sweden 110.4 120.8 116.9
Hungary 101.4 97.6 92.0
United Kingdom 100,7 104.3 101.4
Italy 102.0 104.0 104.3
No available: Ireland, Cyprus, Luxembourg, Malta, Netherlands, Slovenia, Slovakia.
Source: Eurostat, http://nui.eurostat.ec.europa.eu (date of collecting: 20th September 2009).
Maintaining the high rate of growth of retail sale during the economic crisis
takes place mainly in “new” member countries of EU. It was caused mainly by
86 Grażyna Węgrzyn
the increase of sales of Retail sale of audio and video equipment; hardware, paints
and glass; electrical household (table 3). The most spectacular increase of retail
sale was observed in Romania (200.6%). The decrease of the indicator mentioned
above was first noted in 2007 in Spain (–8.5%) and Hungary (–2.4%).
During the recession retail sales continued to grow. This was particularly the
case for sales in non-specialised stores, via mail order and the Internet. Increase
in sales of food products and textiles and sales of textiles, clothing, as well as
pharmaceuticals, medical supplies, cosmetics and toiletries must be regarded as
something normal – to survive, to clothe and to care for one’s health. While the
continued growth in Internet sales may, in part, reflect consumers deciding to stay
at home, rather than spend their free time in shops or consumers hoping to find
lower prices through on-line shopping.10
As already mentioned, one retail sector which appeared relatively resistant
to the effects of the recession was that of retail sales via mail order or the Internet.
Among the Member States the evolution in the volume of these sales varied con-
siderably between countries. There has been rapid growth in the United Kingdom.
Significant extension in the volume of retail sales via mail order or Internet there
were also in Romania, Poland, the Czech Republic and Bulgaria.11
Conclusion
The current economic crisis has grown from a meltdown in the financial and
housing sectors in the United States to a downturn with global reach and a deep
impact on the real economy, particularly on the labour market. As evident from
previous crises, labour markets tend to recover slowly after such an economic
contraction and usually lag behind economic growth, with unemployment per-
sisting at above pre-crisis levels.
Services sector in the last few years played an important role of driving
force of economic increase in all European Union countries. They created the
biggest number of new, of high-quality workplaces. The structure of the economy
evolves thought time as certain sectors become more important and others decline.
European countries with relatively poorly developed service sector registered in
10 B. Newson, Recession in the EU: its impact on retail trade, “Statistics in Focus” 2009, no. 88,
p. 4.
11 Ibidem, p. 6.

87The influence of the world crisis...
2000 to 2008 much more growth in the number of workplaces than the countries
with highly-developed service sector. It bear witness to catch a developmental gap
up in a service sector.
In the period of world crisis service sector copes absolutely better than
industry and construction. However separate service sections feel the crisis in
different ways. In the fourth quarter of 2008 the production in Trade, Transport,
Communication services (–1.6%), Financial services and Business activities
(–0.5%) clearly decreased. Other services remain in a relatively good situation
(there has been an increase by 0.2%).
At European Union level, the increased participation of women in the labour
market accounts for the majority of the net increase in employment in services
since 2000. The sectors that have witnessed the greatest expansion in female
employment are Health and social work, Education and Real estate, renting and
business activities sectors.
It seems that services sector – in fact – in a lower level than industry and with
a certain delay – but will feel the influence of crisis. On the one hand the reduction
of GDP will influence on the decrease of some services and on the other will
generate demand for services of different kind (repairs of domestic appliances,
services connected with job searching, information). Services will be a kind of
a stabilizing factor of economic situation.
During a recession, it is likely that consumers will change, to some degree,
their shopping habits. There are likely to be fewer major purchases, and when pur-
chasing necessities such as food, consumers may choose, among others, to visit
discount stores instead of supermarkets, take advantage of in-store promotions,
purchase own label goods instead of branded items, substitute one cut of meat/
type of fish for another that is less expensive. However, a range of activities where
European Union retail sales continued to grow despite the crisis.

88 Grażyna Węgrzyn
WPŁYW ŚWIATOWEGO KRYZYSU NA ZATRUDNIENIE
W SEKTORZE USŁUG W UNII EUROPEJSKIEJ
Streszczenie
Celem opracowania jest przedstawienie zmian na rynku pracy w wyniku kryzysu
światowego, ze szczególnym uwzględnieniem sektora usług. Analiza obejmuje 27 państw
Unii Europejskiej i dotyczy okresu 2000–2008.
Sektor usług w ostatnich latach odgrywał rolę motoru wzrostu gospodarczego we
wszystkich krajach Unii Europejskiej. Tworzył najwięcej nowych, wysokiej jakości
miejsc pracy. W dobie kryzysu światowego sektor ten radzi sobie zdecydowanie lepiej niż
przemysł czy budownictwo. Jednak poszczególne sekcje usług w różnym stopniu odczu-
wają kryzys.

Chapter II
STRATEGIC MANAGEMENT

SCIENTIFIC JOURNAL
NR 670 SERVICE MANAGEMENT Vol. 7 2011
AGNIESZKA BRETYN
University of Szczecin
GLOBAL TENDENCIES AND STRATEGIC CHANGES OF COOPERATIVE BANKS IN POLAND
Introduction
Intensive transformations in world’s economy cause important changes in
banking, dynamically influencing the shape of contemporary banking systems and
banking structures. The changes in banking sector are the result of the interaction
of many factors existing in the environment where the banks operate, these factors
are varied and at the same time they are connected with each other. The modern
shape of banking is influenced greatly by liberalization processes, deregulation
of laws, fast technical development, growing competition, growing customers’
expectations with the simultaneous decrease in customers’ loyalty, and last but not
least, global financial crisis of the past years and its aftermath.
The transformations on financial markets of Europe and of other parts of the
world influence the sector of cooperative banking in Poland. The new situation is
determined by the circumstances which make banks change their operating mode
and open new possibilities bringing new opportunities but also many threats.
1. Sector of cooperative banks in Poland
For the past several years cooperative banks in Poland has undergone many
changes. Consolidation processes have led to the drastic decrease in the number

92 Agnieszka Bretyn
of cooperative banks in Poland. Nevertheless, cooperative banks still constitute
the most numerous group of banks. At the end of the year 1993 there were 1653
cooperative banks,1 in 2000 – 580 banks and in 2009 – 576, which constituted
92.2% of all banks. The change in the number of cooperative banks between 2000
and 2009 is illustrated by fig. 1 below.
The phenomenon of the decrease in the number of banks that could be
observed until 2005 did not effect cooperative banks. As opposed to the whole
banking sector between 2000 and 2009 cooperative banking sector in Poland
was still growing and developing the network of branches. It was the result of
restructurization and consolidation processes influencing the participation of this
sector on banking services market. At the end of 2009 cooperative banks had 4416
branches,2 which constituted 30.2% of all banking branches in Poland (see fig.2).
As it can be noticed cooperative bank’s branch network was growing system-
atically. Treating the year 2000 as the base year the number of branches of coop-
erative banks grew by over 63.0% in 2009, where comercial banks had 10.0% less
entities than in 2000.
680 642 605 600 596 588 584 581 579 576
73 69
59 58 54 54 51 50 52 49
0
100
200
300
400
500
600
700
800
2000 2001 2002 2003 2004 2005 2006 2007 2008 2009
cooperative banks commercial banks
Figure 1. The number of cooperative banks in comparison to commercial banks in Poland
2000–2009
Source: own elaboration of NBP and KNF data.
1 Sytuacja finansowa banków 2000 r. Synteza, Generalny Inspektorat Nadzoru Bankowego,
NBP, Warszawa 2001.
2 Raport o sytuacji banków w 2009 r., Urząd Komisji Nadzoru Finansowego, Warszawa 2010.

93Global tendencies and strategic changes...
0
2 000
4 000
6 000
8 000
10 000
12 000
14 000
0
20
40
60
80
100
120
140
160
2000 2001 2002 2003 2004 2005 2006 2007 2008 2009
bra
nches
em
plo
yment
in 1
000
eployment in commercial banks
employment in cooperative banks
numbers of branches – commercial banks
numbers of branches – cooperative banks
Figure 2. Employment and the number of branches of cooperative banks in comparison to
the banking sector 2000–2009
Source: own elaboration of NBP and KNF data.
The employment in cooperative banks did not follow the overall tendencies
observable in banking sector. Despite the decrease in the number of entities the
number of people employed in this sector was growing gradually. At the end of
2009 the number of people employed in cooperative banking sector constituted
18.7% of the employment in banking sector (15.0% in 2000).
The importance of the cooperative banking sector has been increasing for
the several years, the banks have been exceeding their activity on financial-
banking services market, very often faster than the commercial banks. Between
2000 and 2009 the participation of the total assets and equities of cooperative
banks was growing systematically in banking sector. Simultaneously their partici-
pation in depository-loan activity, measured by the participation of deposits and
loans in non-financial sector in total deposits and loans banking sector, grew (see
table 1).
Between 2007 and 2009 the decrease in participation of cooperative banks
in loan market could be noticed which was caused by global financial crisis. It is
worth noticing that the quality of the credit portfolio in cooperative banking sector
was and is much higher than that of commercial banks – between 2000 and 2009

94 Agnieszka Bretyn
the share of non-performing loans in total receivables from non-financial sector
in cooperative banks was systematically decreasing (see table 2).
Table 1. Participation of cooperative banks in the market 2000–2009
Years Total assetsLoans to non-financial
sectorNon-financial sector’s
depositsOwn funds
2000 4.2 5.4 5.2 4.5
2001 4.6 5.8 5.6 4.6
2002 5.0 6.5 6.2 4.8
2003 5.2 7.1 6.6 5.4
2004 5.3 7.8 7.0 5.6
2005 5.8 7.6 7.7 6.1
2006 6.2 7.3 8.6 6.4
2007 6.2 6.5 8.8 7.2
2008 5.4 5.4 8.4 6.7
2009 5.8 5.7 8.2 6.8
Source: own elaboration of NBP and KNF data.
Table 2. Share of non-performing loans in total receivables from non-financial sector
in cooperative banks in comparison to commercial banks 2000–2009
Years Commercial banks Cooperative banks
2001 18.6 6.2
2002 22.0 7.3
2003 22.2 7.2
2004 15.6 5.5
2005 11.0 4.9
2006 7.4 4.0
2007 5.2 3.0
2008 4.5 2.8
2009 7.6 3.4
Source: own elaboration of NBP and KNF data.
95Global tendencies and strategic changes...
2. Expected strategic changes in cooperative banks
Global financial crisis lead to redefining those spheres where banks should
concentrate their activities in order to improve their image, rebuild or reinforce
customers trust and in order to be competitive. According to the specialists from
Deloitte, banks should come back to their past, to their traditions – come back to
the cores of their activities.3 The expected reaction of the banks should be concen-
tration on their role as the financial intermediary that is traditional supplier of the
funds. Banks should concentrate mainly on good quality of assets, deposits and
the network of their branches.4
Banks should more intrinsically control the area of assets that they generate.
In this sense the key issue is possesing apropriate information about their clients.5
The low percentage of non-performing loans in cooperative banks resulting
mainly from low participation of non-performing loans in the debt of farmers and
individual customers, being the main borrowers of these entities, may indicate
that they have a good knowledge about their customers. The limitation of the
area where the cooperative banks function influence the better knowledge about
the customers. This can be supported by the results of the research conducted by
the author of this paper, conducted among cooperative banks in the second half
of 2007. Banks being asked to indicate three the most important aspects of their
activities, considered the knowledge of the market where they were operating as
the most important (for 73.8% of the surveyed cooperative banks).
Banks as the answer to the changes taking place on the market should do
their best to gain deposits from the society and increase their participation in the
local markets. According to BCG consultants the key factor can be the network
of branches.6 The local branches are perceived as the most important in creating
stable and permanent deposits. What is more, direct contact with clients enables
knowing them better and creating strong relationships which leads to building
loyalty and is important as far as acquiring high quality assets. It is worth pointing
out that cooperative banks due to their organization structure and geographic
3 The new financial Services Marketplace. Restoring broken markets, Deloitte, June 2009, p. 3.
4 R. Dayal, J. Garabedian, L.U. Luther, D. Rhodes, T. Tang, Leaving with new realities. Creating value in banking 2009, BCG, February 2009, pp. 15–16.
5 Ibidem.
6 Report Retail Banking: Facing the Future, The Boston Consulting Group 2008; The changing face of retail, “The Banker”, 4.02.2008.

96 Agnieszka Bretyn
localization (close to the borrowers) are better prepared to solve problems with
information asymmetry.7 Small banking entities operating on local markets are
better motivated to invest in relations with borrowers as there is a smaller threat of
customers’ shift to the competition.
Wide network of entities in villages, small towns and cities is an advantage
of cooperative banks. According to the research of NBP considering banking pen-
etration ratio the most important factor determining the choice of the particular
bank is the localization of the branch.8
Depending on the customers’ preferences apart from branches of banks other
channels of rendering services are crucial. According to analysts from BCG appro-
priate strategy of multichannel distribution of services may lead to the increase
in the number of new accounts by 10% to 15% and decreasing the cost-to-service
by 10% to 20%.9 Next to multichannel distribution another important factor is the
innovative and personalized offer.10 Cooperative banks in Poland apart from tra-
ditional varied depository-credit services are looking for new ways of gaining the
interest of their customers. Some banks offer individual retirement accounts others
are intermediaries selling investment funds TFI, offer insurance or cooperate with
leasing companies. Despite the above mentioned facts, 34% cooperative banks
in the research mentioned, indicated small innovativeness as the third obstacle in
keeping or strengthening their position.
According to the BCG analiststs, banks will be made to limit their costs,
which taking into consideration the key role of the branches of traditional banks,
may happen to be difficult. According to own research, for 48.8% of the surveyed
banks high costs of operating are the most important factor limiting the devel-
opment of cooperative banks in Poland.
It is foreseen that banks should verify their way of thinking and should drop
the product-driven strategy and move towards customer-centric startegy. For the
past 5–10 years banks have shifted towards the customer but according to BCG
experts this movement has been to slow. As the support for the new approach,
7 D.A. Carter, J.E. MacNulty, J.A. Varbrugee, Do small banks have an advantage in lending? An examination of risk-adjusted yields on small business lending at large and small banks, “Journal
of Financial Services Research” April 2004, vol. 25, no. 2 & 3, p. 237.
8 Porównanie wyników badań ubankowienia Polaków przeprowadzonych przez NBP w 2006 r. i 2009 r., NBP, Warszawa 2009, p. 17.
9 R. Dayal, J. Garabedian, L.U. Luther, D. Rhodes, T. Tang, op.cit., p. 17.
10 Retail banking trends 2009. Escaping the crisis, Ronald Berger Strategy Consultants, Paris
2009, p. 25.
97Global tendencies and strategic changes...
apart from well developed network of branches, skillful price-strategy will be
needed. It will help not only improve effectiveness but also it will be a step
towards customers’ expectations. It is worth mentioning that according to own
research the prices of the services are second important factor (for 47.6% of the
surveyed cooperative banks), after the knowledge of the market, being the banks
adventage.
Conclusion
Sector of cooperative banking in Poland has undergone crucial changes
thanks to which its economic and financial situation has improved, the activity on
the market of banking and finances has improved as well and as a result its position
on the market is stronger. Cooperative banks have a lot of potential and plans
for the future aiming at increasing their participation in the market. Noticeable,
systematic and appreciated by customers, the development of cooperative banks
seem optimistic. The advantages of cooperative banks are the ability to satisfy
financial needs of the environments they function in, an individual treatment of
the customers and the ability of being flexible and react quickly.
TENDENCJE GLOBALNE
A ZMIANY STRATEGICZNE BANKÓW SPÓŁDZIELCZYCH W POLSCE
Streszczenie
Występujące na rynku usług finansowych w Europie i innych częściach świata prze-
obrażenia wpływają na obraz sektora banków spółdzielczych w Polsce. Nowe okolicz-
ności determinują ich ogólną sytuację, zmieniają sposób ich działania, otwierając przed
nimi nowe możliwości, niosące za sobą wiele szans, a jednocześnie zagrożeń. W artykule
zaprezentowano zmiany, jakie dokonały się w sektorze banków spółdzielczych w Polsce,
omówiono oczekiwane i pożądane reakcje banków na zmiany zachodzące w otoczeniu,
wskazując przy tym ich atuty i słabości.


SCIENTIFIC JOURNAL
NR 670 SERVICE MANAGEMENT Vol. 7 2011
KATARZYNA JASIŃSKAWarsaw School of Economics
GROWTH OF ICT SERVICES IN THE CONTEXTOF DEVELOPING COMPETITION STRATEGY
ON THE MARKET OF TELECOMMUNICATION
Introduction
From the economic point of view, in the last 20 years the growth of the sector
has experienced an ever growing importance. In the European Union member
states the contribution of this sector to GDP equals over 70% and is constantly
growing.1 This is the reason why changes in this sector have a considerable impact
on the whole economy.
The sector of services is also characterized by high dynamics both in terms of
changes institutional and in terms of the scope of their operations. Together with
the general environment uncertainty, information chaos and changing technology,
this variability provokes dynamic changes of strategies of companies operating
on the market of services. Determining an appropriate strategy for competition in
a changing environment can constitute not only an indicator of success, but also
a condition to survive on the market.
Taking into consideration the fact that “access to services facilitating per-
formance of economies, societies and households, adjusted to contemporary
requirements is a condition of economic growth”2 you can risk the thesis that there
1 A. Dąbrowska, Rozwój rynku usług w Polsce – uwarunkowania i perspektywy, SGH, Warsza-
wa 2008, p. 5.
2 Ibidem.

100 Katarzyna Jasińska
are such service sectors whose growth leads in particular to economic growth.
The degree of these sectors growth can constitute an indicator of the economic
growth of a given country or region. Meanwhile, observing trends developed in
these sectors can deliver useful conclusions for other sectors.
One of particularly important service sectors is the sector of telecommu-
nication. Its important role in achieving economic growth has been noticed by
the European Commission, which has undertaken a range of initiatives linked to
popularization of modern information and telecommunication technologies.
Telecommunication services are defined as a key factor of knowledge based
economy.3 An important feature characterizing this type of services is their par-
ticular contribution to supporting and stimulating business and other economic
fields. An excellent example can be the application of services of virtual private
networks based on the MPLS technology to corporate networks. It allowed for
e-banking growth in the area of banking. It is worth noticing that the applied tech-
nology was known already before, but only its application in the service model has
brought measurable market benefits and the growth of the banking sector. It was
linked to the fact that using the MPLS technology by banks was difficult because
of the necessity to invest heavily, as well as the necessity to develop special com-
petences. A telecommunication officer in turn could use this network for many
customers by means of appropriate separation technologies, complementing it
with additional options. At present, networks based on MPLS earned the name of
corporate networks and are used in most companies supporting external processes
related to their competitiveness on the market as far as cost reduction or diversi-
fication is concerned.
This example shows that observing strategies for competition in the sector
of the telecommunication can deliver conclusions which are typical of the entire
market. And trends in this sector can influence the growth of other sectors.
The aim of the article is to make an attempt to find a way to induce the
growth of telecommunication service sector in Poland. The article makes an
overview of selected classical strategies for competition and indicates new ones,
which are related to enlargement of the area of activity and the direction of ICT
services. The article is composed of 3 parts. The first one presents the current sit-
uation on the market of telecommunication. The second one makes an overview of
strategies for competition pursued out in this sector. The last, third part, includes
3 Ibidem, p. 261.
101Growth of ICT services in the context of developing competition strategy...
presentations of the ICT sector as a potentially new area of the so-called blue
ocean services.
1. Situation on the Polish market of telecommunication services
The Polish market of telecommunication services has gone through diverse
stages of growth from monopoly to liberalization. Earlier transformations have
had no considerable impact on the present competitive situation on the market and
they will not be discussed.
The structure of the Polish telecommunication market is composed of four
groups of services:4 fixed phones, constituting 21.2% worth PLN 10.3 bn; mobile
phones, constituting 48.3%, worth PLN 23.5 bn; data transmission, constituting
9.7% PLN, worth 4.7 bn and Other services constituting, 20% , worth 10.1 bn.
In the segment of fixed phones services one observes decreases related to
frequent withdrawals in households and companies from fixed phones to mobile
phones or VoIP5. The decrease amounted to about 8% annually until 2008. It will
intensify because of the gradual decrease in license and connection fees as well as
developing packages, in which voice connections are supplementary. An analysis
of the UKE6 also shows, that the average fee for voice services decreased by
roughly PLN100 between 2008 and 2009.
Another segment of the telecommunication market is the market of mobile
phones. The penetration value of this market amounted at the end of 2009 to 117.4%.7
This situation shows a high degree of market saturation. Most of the population
already has a mobile phone, so increase in sales is limited. Therefore, it is expected
to observe a slowdown in the dynamics growth of the mobile phone market, which
will annually equal 4% on average8. That is also confirmed by the UKE in their report
on the standing of the telecommunication market for 2009:9 “The market for mobile
telecommunication reached maturity. In spite of the fact that all indicators [...] were
higher than a year before, their increases were not as violent as in former years.”
4 Rynek telekomunikacyjny w Polsce 2008, PMR, Kraków 2008.
5 Voip is a voice transmission service using networks of data transmission.
6 UKE, Raport o stanie rynku telekomunikacyjnego w Polsce za rok 2009, www.uke.gov.pl.
7 Rynek telkomunikacyjny…
8 Ibidem.
9 UKE, Raport…

102 Katarzyna Jasińska
Compared to other segments, the market of data transmission is the most
dynamically developing segment. It is composed of: data transmission services,
access to the Internet, fee for connection rental. According to forecasts,10 until
2012 the market of data transmission in Poland will experience an average annual
growth dynamics of 8.8%. The main cause for growth will be increasing access to
the Internet. However, a further growth of the access can be decelerated because
of the demand barrier from households which are not interested in the service at
all. It is also forecast that the market of data transmission will be growing three
times faster than the whole telecommunication market.11 That follows from the
fact that data transmission services facilitate development of other services, e.g.
convergence ones. However, one should note decreasing growth dynamics of this
segment, which amounted to roughly 2% per year.12
Also worth taking into consodiration is the fourth market segment i.e. services
related to developing telecommunication networks as well as device integration,
production and maintenance. Due to the general stagnation in the former groups, it
can be presumed that new trends will be related exactly to this market segment.
Summing up, in any of the discussed service groups there are decreases or
slowdowns in the growth dynamics. It is even more often heard that the market
of telecommunication passes to its phase of maturity.13 The pace of growth in
telecommunication operators’ profits is much lower than a couple of years ago.
There is, therefore, a high emphasis on retaining customers and on a service
quality increase – as a result ever more is offered for the same price.14 Competing
becomes difficult and depends on the value offered to customers. Such a situation
causes a still greater importance of choosing the right strategy for competition.
2. Strategies for competition in the telecommunication sector
In this part of the article strategies used in the telecommunication sector
will be analyzed on the classical competition strategy model of M. Porter (cost
10 Rynek telekomunikacyjny…
11 Ibidem.
12 Ibidem.
13 http://www.wnp.pl/artykuly/telekomunikacja-w-fazie-stabilizacji,4979.html.
14 http://www.pmrpublications.com/press_room/pl_stagnacja-przychod_w-z-us_ug-telekomuni-
kacyjnych-w-Polsce.shtml.

103Growth of ICT services in the context of developing competition strategy...
and differentiation strategy) as well as technology changes influencing their
shape.
Developing a competition strategy consists in choosing a competitive
advantage and applying it in the selected market area in order to get the desired
competitive position.15 Competitive advantage is understood as a set of assets
appreciated by the market, which the company possesses and which allow it to
maintain a high effectiveness over a long period of time and a harmonic growth.16
Sources of advantage, most generally speaking, are company resources and the
capability of using them.17
Until 2000, competitors on the market of telecommunication were competing
mainly with access to unique resources as well as creating new services around
them. An example of that can be competing for the customer on the market of
mobile phones, which was concentrated around earning a license for band and
creating an advantage in the form of the biggest possible coverage in the country.
It was also important to develop a network of the highest possible quality related to
high capacity and access to additional services. Such a behavior was additionally
supported by using various promotions aimed at attracting customers thanks to
the price. None of the operators was over a longer time period capable of building
a sustainable competitive advantage possessing neither unique resources nor a key
competence. The situation on the market of data transmission and fixed phones was
in the meantime fairly stable and grounded by the dominant position of TP S.A.
After 2000, when the growth of new technologies based on the IP protocol18
was observed, the market situation started to change. It was necessary to offer
something more than a resource wrapped in appropriate “packaging” in the form
of a service supported by promotions.
The impact of the technology on competitive advantage was noticed by
M. Porter, who distinguished two competition strategies varying in the source of
competitive advantage:19
15 M. Romanowska, Planowanie strategiczne w przedsiębiorstwie, PWE, Warszawa 2004, after:
Leksykon zarządzania, Difin, Warszawa 2004, pp. 533–534.
16 Strategor, Zarządzanie firmą. Strategie, struktury, decyzje, tożsamość, PWE, Warszawa 1999,
p. 56.
17 Leksykon zarządzania…, p. 468.
18 IP is an Internet protocol facilitating communication between devices in the network.
19 Strategor, op.cit., p. 27.

104 Katarzyna Jasińska
‒ Cost strategy, which – when used – aims at earning a competitive advan-
tage thanks to acquiring the lowest production costs by a large production
volume,
‒ Differentiation strategy, which consists in offering specific products dis-
tinct from competing products, thus the company does not have to com-
pete on the level of costs and prices.
Porter claimed that technology had an impact on the competitive advantage
when it played an important role in determining a relative cost or differentiation
position.20
Technology based on the IP protocol meets these criteria. First, voice trans-
mission using this protocol is based on a network of data transmission without
generating additional costs related to the maintenance of core dedicated infra-
structure. Thanks to that, IP voice services are cheaper and those created based on
the Internet in settlements have practically speaking no cost.
Secondly, using the IP technology in connection with MPLS permits creation
of specific products, because networks using this protocol allow separation of
voice traffic from data transmission, and have mechanisms ensuring quality,
which influence a decrease in delays in networks. That in turn allows launching
applications and their remote work with the use of the network.
Development of the IP and MPLS technologies was a breakthrough on the
market of telecommunication, because based on that many services were built, such
as the already mentioned VoIP, IP, VPN, APN and IP-TV. New service markets
were built around them – convergence services, television services or services
connected to integration of systems and applications. These services started to be
offered in the model of a cost strategy for mass customers, which is reflected in
the examples of services such as Livebox TP and in the model of a differentiation
strategy for business customers, e.g. a service connected to delivery of dedicated
corporate systems, i.e. networks and IP Telephony. In the second mentioned segment
it became increasingly important whether the service was prepared according to the
expectations of the given customer and whether its performance contributed to his
or her business profits. The reputation of the telecommunication operator was also
became important considering its capability of performing a complex system, and
not just delivering connections for transmission.
20 M.E. Porter, Competitive advantage. Achieving and maintaining better results, Helion, Warsza-
wa 2006, p. 217.

105Growth of ICT services in the context of developing competition strategy...
It is worth to notice that next to the main segments of the telecommunication
market: fixed phones, mobile phones and data transmission, there is also an addi-
tional segment, which is comprised of companies specializing in diverse activities
related to telecommunication, who occupy a niche created by the main operators.
That is possible thanks to developing by these companies unique key competences,
extraordinarily valuable for the market. An example of a company, which has
based its activity on distinguishing competences can be Comarch while acquiring
data transmission connections from operators – adds its maintenance services,
as well as consulting services, and complements the networks functionality with
application solutions. It can compete on the market of telecommunication, first
– thanks to differentiation and second – through development of distinguishing
competences. These competences result from the fact that the company possesses
qualified engineers, whose skills are confirmed with certificates in the area of
equipment supplier technologies, e.g. Cisco CCIE. Having numerous qualified
engineering staff translates into e.g. an opportunity to make many complex instal-
lations more quickly than competitors.
Another example of a company which bases its activity on the unique compe-
tences is ATM Software. The company focuses its activity on delivering services
related to image transmission. The company decomposes systems of equipment
suppliers and ascribes software for them giving them a different functionality
inscribed into the needs of the given customer.
The already mentioned classic strategies of cost competition and differen-
tiation are, according to H. Mruk,21 determined as a direct competitive fight. Ana-
lyzing the situation of the telecommunication market, which indicates its maturity
and a general stability, applying a strategy of this type leads to a situation described
as a “zero sum game”. If one operator wins – another must lose. Therefore, com-
petition becomes ever tougher, which leads to the value loss of the whole market.
An example can be a decrease in fees by one operator in order to gain customers.
But this gain is provisory, because other operators will decrease their fees to the
indicated level or lower, also taking over a certain group of customers. That is
why such a move leads to the general loss of the entire market. Ultimately, all
operators have the same market share, weighted with a lower value of revenues.
In such a model no growth in sales and no increase in the market value can take
place, which makes players search for new strategies.
21 H. Mruk, Strategie marketingowe, Wydawnictwo AE, Poznań 2002, p. 59; after: Z. Pierścio-
nek, Strategie rozwoju firmy, Wydawnictwo Naukowe PWN, Warszawa 1998.

106 Katarzyna Jasińska
It is worth to notice that next to the classic strategies, literature mentions also
the blue ocean strategy,22 consisting in creating a new market space, demand and
opportunity for a profitable growth. Under the term of red oceans Kim Chan and
Mauborgne understand industries existing today, whose borders are defined and
rules of the competition games known.23 If the market space in these industries
diminishes and the prospects for growth and profit become limited, products
become standard and competition tougher. That is why companies have to go
beyond the frames of the classic competition and create blue oceans. Most of
them are born from the already existing red oceans through widening borders of
existing industries.24 An example of such a blue ocean on the market of telecom-
munication is the growth in ICT services.
3. Characteristics of the market of ICT services
According to NACE,25 the ICT (Information and Communication Tech-
nology) sector is based on delivering services connected to information and com-
munication technologies. According to NACE, ICT services are all services which
facilitate data processing and electronic communication.26 Under the term of ICT
technology application M. Laska understands all technologies linked to gathering,
storage, processing and transmission of information.27
In Poland the sector of ICT is quite weak compared to other members states of
the UE and it can be summarized as IT, telecommunication and additional services.
Therefore, there is a question: why would this sector constitute a prospect for
growth in the telecommunication market? The answer lies in the characteristics
of the ICT sector. Compared to telecommunication services, they have not only
22 W. Kim Chan, R. Mauborgne, Blue ocean strategy, MT Biznes, Warszawa 2005, p. 19.
23 Ibidem, after: H.C. White, Where Do Markets Come From?, “American Journal of Sociology”
87, pp. 517–547 and J. Porac, J.A. Rosa, Rivalry, Industry Models and the Cognitive Embeddedness
in the Comparable Firm, “Advances in Strategic Management” 1996, vol. 13, pp. 363–388.
24 Comp. W. Kim Chan, R. Mauborgne, op.cit., p. 19.
25 NACE – Nomenclature statistique des Activités économiques dans la Communauté Européen-
ne. Rev. 1.1.
26 Ibidem.
27 M. Lasek, Ogólne tendencje rozwoju informatyzacji w Polsce i na świecie, [in:] W kierunku
rozszerzonego przedsiębiorstwa. Analiza sektorowa rozwoju ICT w Polsce, red. T. Kasprzak, Difin,
Warszawa 2006, p. 23.
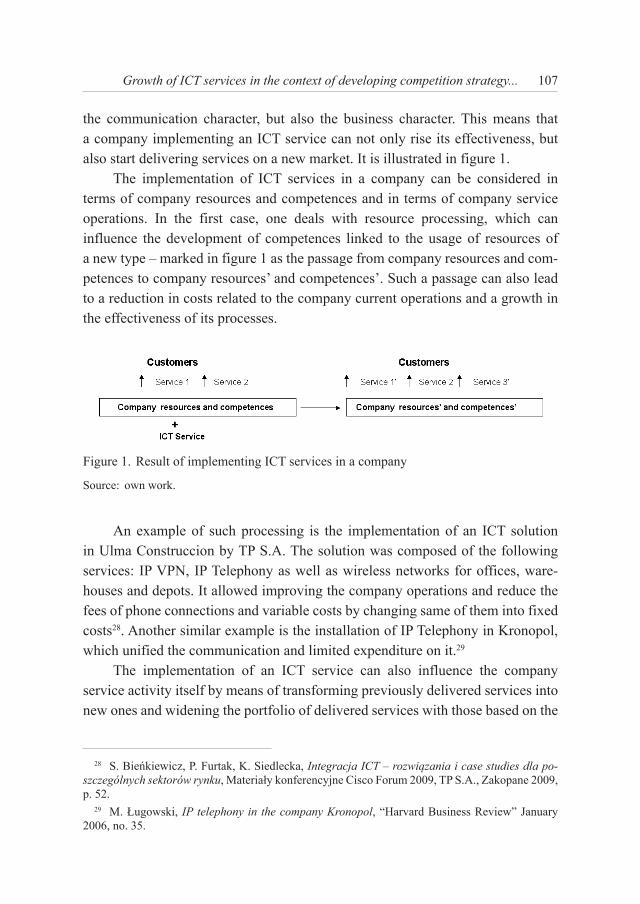
107Growth of ICT services in the context of developing competition strategy...
the communication character, but also the business character. This means that
a company implementing an ICT service can not only rise its effectiveness, but
also start delivering services on a new market. It is illustrated in figure 1.
The implementation of ICT services in a company can be considered in
terms of company resources and competences and in terms of company service
operations. In the first case, one deals with resource processing, which can
influence the development of competences linked to the usage of resources of
a new type – marked in figure 1 as the passage from company resources and com-
petences to company resources’ and competences’. Such a passage can also lead
to a reduction in costs related to the company current operations and a growth in
the effectiveness of its processes.
Fig. 1. Result of implementing ICT services in a company Figure 1. Result of implementing ICT services in a company
Source: own work.
An example of such processing is the implementation of an ICT solution
in Ulma Construccion by TP S.A. The solution was composed of the following
services: IP VPN, IP Telephony as well as wireless networks for offices, ware-
houses and depots. It allowed improving the company operations and reduce the
fees of phone connections and variable costs by changing same of them into fixed
costs28. Another similar example is the installation of IP Telephony in Kronopol,
which unified the communication and limited expenditure on it.29
The implementation of an ICT service can also influence the company
service activity itself by means of transforming previously delivered services into
new ones and widening the portfolio of delivered services with those based on the
28 S. Bieńkiewicz, P. Furtak, K. Siedlecka, Integracja ICT – rozwiązania i case studies dla po-
szczególnych sektorów rynku, Materiały konferencyjne Cisco Forum 2009, TP S.A., Zakopane 2009,
p. 52.
29 M. Ługowski, IP telephony in the company Kronopol, “Harvard Business Review” January
2006, no. 35.

108 Katarzyna Jasińska
ICT technology. These are marked in figure 2 as the transformation of services 1
and 2 into services 1’ and 2’ and adding service 3.
The above mentioned transformation of services can consist, for instance,
in changing the shape of the service, reduction of its costs or widening it by an
additional way of access. Delivering new types of services based on the trans-
formed company resources can consists in renting company resources, which
can be accessible remotely. An example of this can be: hosting services, mass
print or Call Center rental services. In each of the above mentioned examples the
company used the ICT offer available on the market for internal optimization and
development of own resources, which after the transformation were used for the
company’s own benefit, but also became an element of a new company service.
Such a transformation is called an “unbundled production”.30 This phenomenon is
placed on the list of trends linked to technologies influencing businesses, which is
published every two years by McKinseyQuartery. Another trend from the above
mentioned list inscribed in the logics of resource transformation is XaaS (Eve-
rything as a Service), which means transforming previously sold products into
services. “Business-to-business (B2B) customers like these service offerings
because they allow companies to purchase units of a service and to account for
them as a variable cost rather than undertake large capital investments. Clients
also like this ‘paying only for what you use’ model, which helps them avoid
large expenditures, as well as the hassles of buying and maintaining a product”.31
An example of such services is cloud computing,32 which includes e.g. SaaS33
(Software as a Service), delivered by Salesforce.com34 or IaaS35 (Infrastructure as
a Service) delivered by France Telecom.
The above mentioned examples show how ICT services penetrate the com-
pany’s operations. Noticing this feature of ICT services constitutes an important
30 https://www.mckinseyquarterly.com/Clouds_big_data_and_smart_assets_Ten_tech-enabled_
business_trsends_to_watch_2647.
31 Ibidem.
32 Cloud computing is a general term for anything that involves delivering hosted services over
the Internet, http://searchcloudcomputing.techtarget.com/sDefinition/0,,sid201_gci1287881,00.
html.
33 SaaS consists in purchasing a service giving a remote access to infrastructure instead of its
physical purchase.
34 http://www.salesforce.com.
35 IaaS consists in purchasing a service giving a remote access to infrastructure instead of its
physical purchase.
109Growth of ICT services in the context of developing competition strategy...
reason for considering this sector as a direction of future growth. T. Kasprzak
defines the phenomenon of penetrating industries by ICT as “IT absorption by the
economy” and underlines that “companies, which will not be able to adopt valid
information standards will not be able to participate in the competitive game”.36
Based on that, it can be presumed that customers will more often reach for ICT
solutions, because of the possibility of developing their activities. That is the reason
why ICT is a blue ocean for the market of telecommunication services. Thanks to
using available technologies, the sector of e-business is born. T. Kasprzak includes
here electronic finance, commerce and services.37
Another trend indicating the necessity of widening the offer in the direction
of ICT solutions is the growing demand for integration of IT services and tel-
ecommunication services. It is shown in McKinsey’s survey from 2006, con-
ducted on a sample of more than 50 European CIOs and industry experts.38 They
were asked if decisions to purchase telecommunication solutions are taken within
one department and whether they would purchase an IT solution and telecom-
munication services from one provider. The survey showed that about 30% of
CIOs would prefer to buy from providers offering a combination of IT and tel-
ecommunication services rather than separately because of a consistent service
level agreement. Decisions about IT and CIO purchases are also taken in a single
department – about 60% of respondents “strongly agreed” or “agreed” with this
statement.39
Conclusions
The market of telecommunication services can be thought of as a sector
in the phase of maturity. Units operating on this market should therefore strive
for working out competition strategies, which would facilitate maintenance and
stimulation of growth. However, it seems that in order to do so it is necessary to go
beyond the previous system of competitors and drive towards new areas.
36 Towards an extended enterprise…, p. 16.
37 Ibidem, p. 12.
38 http://www.mckinseyquarterly.com/Telecommunications/Equipment_Services/A_rising_de-
mand_for_integrated_IT_and_telecom_services_1783.
39 Ibidem.
110 Katarzyna Jasińska
The article presents the situation in the sector of telecommunication in
Poland. Based on surveys available, its current stage of growth is shown as well
as the impact of changing technology on the analyzed sector. Decreasing oppor-
tunities for growth in the sector of telecommunication are presented based on
previously applied competition strategies and opportunities are signaled related to
growth within the ICT sector. A thesis is put that, for the telecommunication sector
the ICT sector can become a blue ocean. An attempt is made to confirm this thesis
based on examples of ICT services applications.
However it is worth to remember that formulating the blue ocean strategy
and the ICT sector itself have both their limitations. First, these are e.g. diffi-
culties with the identification of technological trends, which could contribute to
the generation of new business opportunities as well as to the recognition of the
potential demand for services. Another group of factors are those connected to the
ICT sector itself, i.e. a high risk of conducted projects, or e.g. the need for high
investments. In spite of the indicated existing limitations, the growth in the ICT
sector seems to be an interesting option for stimulating growth of the telecom-
munication sector in Poland.
ROZWÓJ USŁUG ICT W KONTEKŚCIE KSZTAŁTOWANIA STRATEGII
KONKURENCJI NA RYNKU USŁUG TELEKOMUNIKACYJNYCH
Streszczenie
W artykule przedstawiono sytuację w sektorze usług telekomunikacyjnych w Polsce.
Na podstawie dostępnych badań pokazano fazę jego rozwoju oraz wpływ zmieniającej się
technologii na analizowany sektor. Wykazano kurczące się możliwości rozwoju w sek-
torze telekomunikacyjnym opartego na dotychczas stosowanych strategiach konkurencji
i zasygnalizowano możliwości związane z rozwojem w obrębie sektora ICT. Postawiono
tezę, że dla sektora telekomunikacyjnego sektor ICT może się stać swoistym „błękitnym
oceanem”. Tezę tę starano się potwierdzić na podstawie przykładów zastosowań usług
ICT.

Chapter III
FINANCIAL MANAGEMENT

SCIENTIFIC JOURNAL
NR 670 SERVICE MANAGEMENT Vol. 7 2011
EWA CHRZANOWSKA
Wrocław University of Economics
OFFSHORE PENSIONS AS AN ALTERNATIVE WAY OF SAVING FOR BRITISH EMIGRANTS
A LESSON FOR POLAND?
Introduction
International migration plays increasingly important role in majority of the
European Union Member States (EU-27) and it concerns also Poland. Two main
categories of immigrant population can be singled out: Member States citizens and
citizens from beyond the EU-27. According to the Eurostat estimation, in 2006
around 3.5 million people settled in one of the EU-27 country and around 14% of
them were the Member States citizens. In order to take up employment majority
of expatriates moves to European Union countries such as Spain, Germany or
England.1
Frequently, for an individual starting life in a foreign country it is a priority
to find a new job and to adjust to life in new conditions, while deciding about
building the portfolio becomes less important. Meanwhile, for expatriates working
in the country different than the one you come from creates numerous opportu-
nities of saving and investing of the amassed capital, especially when it comes to
saving for retirement.
1 A. Herm, Recent migration trends: citizens of EU-27 Member States become ever more mobile
while EU remains attractive to non-EU citizens, Population and social conditions, Eurostat – “Statis-
tics in Focus” 98/2008, epp.eurostat.ec.europa.eu/cache/ITY_OFFPUB/KS-SF-08-098/EN/KS-SF-
08-098-EN.PDF.
114 Ewa Chrzanowska
Along with the development of international financial transactions, the
demand for regions where there are low taxes, stable economy, a safe place to
invest money, where managing the finances and tax planning at the international
level is relatively easy.2 The offshore countries offer very flexible saving plans
with attractive tax rates and possibility to lay by irregular amounts of money at
irregular intervals. Moreover, they ensure an easy access to the amassed amount of
money as well as the possibility to create a private plan in which the contributions
can be transferred from the investor’s account every month. The offshore pensions
contributions can be put aside independently of the country of residence and the
benefits can be derived independently of the one’s retirement location. Depending
on the pension scheme, the insured person can benefit from the amassed capital,
even before reaching the retirement age and the pension is adjusted to the insured
person’s risk profile. Living in the country with potentially lower overall and
maintenance expenses or higher salaries, lower tenancy prices or a favourable
employment contract, enables you to allocate a higher amount of money to savings
and investments and ensures a decent retirement income.
The term offshore refers to any region, nation or financial centre that lies
beyond the investor’s habitual residence. Usually the concept offshore refers to
areas where in a considerable degree there are no internal limits which are typical
of onshore countries. The term offshore refers to the topic of the occurrence of
tax relieves for a range of interconnected financial services. Individuals who
leave their country for a longer period of time, international companies, foreign
investors, travelers, international advisers as well as informal investors can enter
into advantageous financial transactions thanks to the policy and legal regulations
that are in force in the offshore centre. Along with the development of economy
new terms such as offshore capital, offshore strategies, offshore funds and offshore
pensions started to be introduced.3
The cognitive aim of the article is to present available instruments and financial
products offered by the institutions localized in the offshore countries, providing
British emigrants with the assurance of a pension. What is more, the article is also
an attempt to provide the answer to the following questions: what investing and
2 K.M. Lewis, International Banking and Offshore Finance: London and the Major Centres,
[in:] Offshore finance centres and tax havens: the rise of global capital, Macmillan Press ltd, Bas-
ingstoke 1999, p. 84.
3 M. Wotava, Raje podatkowe, Małopolska Oficyna Wydawnicza Korona, Kraków 2000,
pp. 6–7; J. Karwowski, Centra offshore na globalnych rynkach finansowych, Wydawnictwo PWE,
Warszawa 2010, pp. 17–18.
115Offshore pensions as an alternative way of saving...
pension saving possibilities in the offshore countries have British expatriates and
whether the existing private pension schemes offered by the offshore countries are
an effective method supporting emigrants’ pension savings?
Since the introduction of the QROPS system, it has been estimated that
approximately £432 million was transferred from British pension systems to
pension schemes localized in offshore.4 In relation to an increasing popularity
of individual pension plans made beyond Great Britain, and it is worth to make
a hypothesis whether conclusions from the presented material can be drawn for
Poland.
1. Saving and investing in the offshore countries
Offshore savings and investments refer to locating money on the accounts
in country different than the country of residence, and they are usually liable to
lower taxes. In order to benefit from particular offshore savings one of the fol-
lowing conditions has to be fulfilled:
‒ the investor has to be the offshore country resident
‒ in the investor’s country of residence,5 where capital gain taxation is high,
there has to be a system in which profits made in the offshore country are
not liable to tax in the country of residence.
Apart of the tax relieves, the offshore investments can increase the income
by using a wider range of assets. The existing limits and regulations referring
to the way of locating money in Great Britain are very strict in order to protect
mainly the interests of the individuals who are particularly liable to investment
risk. These restrictions do not apply to accounts localized in offshore countries,
therefore it is possible to use financial instruments unavailable in traditional
saving conditions. The differentiated investment portfolio can ensure balance and
decrease the unstable character of investments. However, it should be noticed
that some of the financial institutions functioning at the offshore market are not
included in the Financial Services Compensation Scheme. At the same time,
4 https://www.devere-group.com/news/deVere-hits-record-figures-and-becomes-QROPS-mar-
ket-leader.aspx.
5 Country of residence is a country in which a visitor established his/her legal permanent resi-
dence. It may be different from the visitor’s country of birth. The country of residence is the home
jurisdiction for tax purposes of the foreign partner.
116 Ewa Chrzanowska
although many banks offering offshore savings products are subsidiaries of Big
High Street Banks localized onshore, main departments of these onshore banks
are not responsible for their subsidiaries functioning in the offshore countries that
are unable to meet their obligations on their own.6
The institutions localized in the offshore countries serve expatriates who
reside in countries of the continental Europe, therefore they are particularly
threatened by European Union’s strict directives referring to savings taxation and
related to them information exchange contracts. They also ensure an effective
and safe way of managing all the savings with the aid of one product. These
products include: offshore savings bond also known as offshore portfolio bond. This product is particularly designed for emigrants who own the amassed capital
to the amount of at least £50,000 and can allocate it to investments. The in-
strument contains the insurance contract and bank account, creating a possibility
for the investor who in this way can invest and manage the capital. Moreover such
structure does not subject to UE directive concerning Taxation of Savings Income
in the form of Interests Payments.7 This bond limits the managing and adminis-
trating of investments to the minimum. The investor can change the way and place
of capital investments simply by sending an instruction to the product supplier.
It means that making investments is not time-consuming or complicated and the
tax savings achieved by joining many investments into one enables the investor to
counterbalance the costs and to maintain the product.
Seemingly easy possibilities of using favourable interest rates requiring
resource transfer from one bank account to another can cause numerous adminis-
trative problems and entail the necessity to bear transfer charges. The time required
for the operation can cause a loss of the possibility to earn on the favourable
interest rates. In the case of offshore savings bond such problem does not exist. By
means of the sent order money is immediately sent to the chosen place, according
to the investor’s will.
6 www.investmentinternational.com/magazine/savings/guide-to-offshore-savings.html.
7 The aim of The European Union Council Directive of 3 June 2003 on taxation of savings
income in the form of interest payments (2003/48/EC) is to enable savings income in the form of
interest payments made in one Member State to beneficial owners who are individuals resident for
tax purposes in another Member State to be made subject to effective taxation in accordance with the
laws of the latter Member State. The ultimate aim of the Savings Directive is to ensure exchange of
information between member states and such exchange is in force in EU member states, Council Di-
rective 2003/48/EC of 3 June 2003 on taxation of savings income in the form of interest payments,
“Official Journal of European Union” L157, vol. 46, June 2003, p. 38.
117Offshore pensions as an alternative way of saving...
Offshore portfolio bond is a structure comprising of numerous assets, bank
accounts, funds or even shares. Therefore, it is possible to invest in deposit
accounts, shares, bond funds or offshore funds and at the same time to keep the
investments safe and confidential.8
The offshore fund is a set of investments schemes located in the Offshore
Financial Centers9 and is liable to offshore funds regulations defined in the Income
and Corporation Taxes Act 198810. The offshore funds offer their investors consid-
erable tax benefits in comparison to countries where taxes are relatively high, e.g.
Great Britain. Supervisory regulations in tax havens are clear, therefore offshore
areas can be described as financially safe and investor – friendly. Many offshore
jurisdictions (e.g. British Virgin Islands) offer a zero-rating tax for investment
funds located in their regions, in this way reinvesting this part of profit that would
have been spent on tax is possible. However, when the capital is moved to high
taxation country it is liable to the standard regulations concerning abroad income
taxation.
Offshore funds offer their investors an access to a wide range of profes-
sionally managed investments and the investment strategy usually includes the
investment product described in following part of the article.
Offshore Investments Bonds are frequently used by the investors living
in the onshore countries as well as in the offshore countries, who seek a way to
maximize their pension savings. They are an alternative for the domestic pension
system for the British who plan to spend their retirement age in a country different
than their native country. Offshore investments bonds seem to be more flexible
than the traditional pension products. A good example of such flexibility is the
access to the funds before reaching the age of 55 and the amassed capital can be
paid out either at once or in the form of a monthly income, or both of these forms
can be combined. The investor has got a more considerable influence on particular
aspects of bond investments. Nevertheless, the offshore bonds can be expensive
8 www.shelteroffshore.com/index.php/offshore/more/offshore-savings-bonds-advantages-
10509.
9 Offshore Financial Centre is an area in which the activity relates to the financial sector in
a large part carried out with non-residents; banks are exempt from many regulations in force in other
areas, and also there are no exchange restrictions or rate limits. Offshore Financial Centre include
inter alia Luxembourg, the Isle of Man or Dublin. For more information look at: „Offshore Financial
Centers. IMF Background Paper”, Prepared by the Monetary and Exchange Affairs Department,
www.imf.org/external/np/mae/oshore/2000/eng/back.htm, June 2000.
10 Income and Corporation Taxes Act 1988, part XVII, chapter V, www.opsi.gov.uk/acts/acts1988/
ukpga_19880001_en_1.
118 Ewa Chrzanowska
and relatively not flexible when resigning from the investment before it reaches
its maturity.11
Offshore Insurance Bonds are designed for investing capital in the
offshore countries. Their popularity to a considerable extent comes from the fact
that investors can own and manage the diversified offshore funds portfolio as
a one financial product that pays off and ensures significant tax benefits. The
main advantage of purchasing insurance bonds by the investor is possessing an
insurance policy providing a lifetime annuity payments with a total value equal to
the value of funds raised in the form of bonds. The funds located in this product
technically belong to the bond supplier who does not pay any capital gains tax
within the fund. Consequently the investor can accumulate the capital tax-free
(apart from the tax deducted at source, before making offshore investment).12
Offshore Investment Funds are constructed in the same way as their
equivalent in onshore, but they are located in offshore countries or beyond countries
where capital gains taxes are high. The advantage of the investment fund localized
in offshore countries over their equivalents in the onshore countries usually boils
down to the applied regulations and supervision rules. In onshore countries these
funds are usually liable to strict regulations and numerous restrictions concerning
investment possibilities in order to protect investor’s interests, and the capital can
be located only in the least volatile sectors of a given market. Offshore investment
funds are excluded from the heavy regulations and limitations, therefore it is
possible to use diversification and investing in various sections, securities and
assets types. As a result it is possible to achieve a potentially higher rate of return,
better stability of investment portfolio as well as investment adjustment to the
investor’s risk profile, his requirements and investing inclinations.
The offshore fund is a centralized pool of money located under the juris-
diction of offshore that is financed by a range of individual or corporate investors
who want to increase their purchasing power and profits value by combining their
resources. In this way they gain access to a far broader investment portfolio, than
in the case of a single investment involvement. The funds also derive considerable
taxation benefits, i.a. they can grow tax free, income or profits can be realised
11 www.shelteroffshore.com/index.php/offshore/more/offshore_investment_bonds.
12 www.touchstoneoffshore.com/tax-free-investments/offshore-investments.html.

119Offshore pensions as an alternative way of saving...
without the deduction of tax at source and also tax incentives are offered to the
investors who use fund investments.13
2. Benefits related to the offshore pension investments
Planning our own pension on the basis of services and financial instruments
from offshore centres can be essentially beneficial for population living and
working outside their native country. In the case of British population living on the
emigration there are three significant advantages of offshore pension saving:14
I. Tax benefits and personal allowance. Offshore investments funds apply tax shelters providing the investor to take
advantage of collective gross profit and making investments before taxation within
the framework of the investment strategy.
Moreover, in Great Britain, so far available tax relieves concerning pension
schemes become more and more limited. The government intents to limit the tax
relieves from the April 6, 2011 for those whose income comes to over £150,000,
and to those whose overall pension savings exceeded £20,000. It will cause the
loss of taxation benefits by those who want to increase their superannuation to the
amount that exceeds its threshold value.15 Superannuation schemes created in the
offshore centers do not have any of these restrictions.
In Great Britain pension scheme there are two main regulations that influence
the amount of the amassed capital within the framework of the pension fund, such
as annual allowance and lifetime allowance.
The annual allowance defines the maximum, overall amount of annual
pension contributions that are not liable to taxation. In tax year 2010/2011, the
annual allowance comes to £255,000. If the amount of superannuation exceeds the
value of the agreed limit, there will be necessary to pay 40% tax whether they are
amassed by the employee or by the employer.
Insured person retires before reaching the age of 75 can collect at once
only 25% of the total amassed capital and this amount is tax-free. The amounts
13 www.shelteroffshore.com/index.php/offshore/more/about_offshore_investment_funds.
14 www.whichoffshore.com/offshore-retirement-planning/benefits-planning-offshore.
15 Pension Schemes: Limiting Tax Relief for High Income Individuals. Guidance for Pensions
Industry 22 April 2009. HM Revene & Customs, www.hmrc.gov.uk/budget2009/pensions-industry-
1550.pdf, p. 4.
120 Ewa Chrzanowska
that are collected at once from the pension savings and they exceed the agreed
limit, are liable to income taxation. At the same time the total pension taxation
cannot exceed the lifetime allowance which in the tax year 2010/2011 comes to
£1,8 million. The capital accumulated in the form of pension savings that exceeds
the agreed limit will be charged regardless of the income tax paid on the pension
income, which exceeds the annual allowance.16
In the offshore centre, the pension fund of any value can be created. Capital
collected by the insured is wholly exempt from tax, regardless of whether the
insured person has reached retirement age or not.
II. Law of property and effectiveness. Being the owner of the offshore pension scheme a policyholder retains a total
control over the accumulating capital and can form an individual strategy of the
investment portfolio depending on his own preferences and opportunities arising
from the market. Pension plan operates as any other investment product and its
owner may affect the way capital is invested, as well as withdraw the total amassed
amount at any time before the date of investment maturity.17 The pension accu-
mulated in the offshore centre gives an opportunity to amass a considerable capital
that can secure a high retirement income. Moreover, the capital can be transferred
to inheritors as well as can create a trust fund that would ensure a constant income
for the insured persons’ relatives.
III. The currency. There are many people who make investments without making a final
decision about their place of living after the retirement. Therefore it is important
to make sure that the law regulations of the country where you invest will not
impede the future income flow. The international tax standards that are in force in
a given country can influence the investment value, e.g. for investments based on
dividend income coming from countries where there are high tax rates, the choice
of jurisdiction should be based on the accessibility of regulations concerning the
avoidance of double taxation.
When choosing a pension scheme created in the offshore centre, the insured
is able to invest the accumulated capital in any currency. He has also the ability to
16 www.direct.gov.uk/en/Pensionsandretirementplanning/BeginnersGuideToPensions/DG_
10027106; www.hmrc.gov.uk/pensionschemes/newsletter1.htm.
17 In the offshore system there is usually no typical minimum retirement age, but if it exists then
it is often less than 50 years to withdrawal.
121Offshore pensions as an alternative way of saving...
protect themselves in multiple currencies, thereby reduce or eliminate the currency
exchange risk.18
3. Pension saving scheme qrops
Working in a country different than the country of residence for more than
one year does not have to influence the continuation of the pension contribution
payments in the domestic pension system, especially when the individual works in
one of the EU Member States. However, the emigrants who spend a longer period
of time abroad may have a significant problem with the pension. There are many
who plan to spend their retiring age abroad, but majority of them eventually comes
back to their native country, therefore their savings strategies should be arranged
in a way that the double taxation can be avoid.19 Expatriates who work and save in
a country where there is low taxation or zero-rating taxation, can plan their foreign
pension by using more effective and flexible saving systems, therefore amassing
the capital much faster.
In 2006, the British government decided to support the idea of foreign
pension for British expatriates and introduced a Qualifying Recognized Overseas
Pension Scheme (QROPS), which is a private pension scheme created in a country
different that Great Britain, available for those who save in a private as well as
in a public section. QROPS system gives an opportunity to transfer a retirement
plan set up onshore to a country other than Great Britain, offering significant
tax savings.20 The system is designed for emigrants who plan to work abroad for
a longer period of time and before the emigration they have been saving by tra-
ditional pension scheme. The system is also suitable for those who plan to spend
their retiring age abroad.21 The QROPS is created outside the territory of Great
Britain and is subject to the regulations concerning pension and taxation schemes
18 www.investorsoffshore.com/html/kb/pensinv.html.
19 L. Gough, Going offshore. How to boost your capital and protect your wealth, Pitman Publish-
ing, London 1998, pp. 57–59.
20 Before introducing QROPS, every expatriate moving to another coutry had to leave his ac-
cumulated pension fund in the country of origin.
21 www.shelteroffshore.com/index.php/offshore/more/qrops-offshore-pensions-retirement-expa-
triates-10586.
122 Ewa Chrzanowska
of the country in which it has been set up.22 The individual who is no longer liable
to taxation of Great Britain, loses his right to receive any tax relieves associated
with British superannuation. Nevertheless, the QROPS system provides many
other advantages:23
− an emigrant who lives abroad for a longer period of time than 5 years can
transfer the capital amassed in the form of onshore pension and purchase
its offshore equivalent, however, the QROPS provider is not required to
provide any information about the savers to HMRC;24
− allows for making flexible and potentially more effective investments;
− the accumulated amount can be allocated to pension income which is
available for the insured person before reaching the age of 50;
− there is no obligation to purchase the annuity (unlike in the traditional
plan);
− the aggregated capital within the QROPS belongs to the insured person’s
assets and can be passed on to the inheritors accordingly to the regula-
tions of Inheritance and Donation Tax that are in force in the country of
residence.
It is recommended to use a professional and individual advice concerning
the suitability of the system for particular emigrants. The QROPS profitability
depends on the value of the amassed capital by the emigrant within the framework
of onshore pension system, that is supposed to be moved to the offshore country.
It also depends on the country where the emigrant is going to retire. It results from
the fact that the pension contributions would be liable to the taxation system of
the country where the emigrant stays. Currently the QROPS system is noticeably
expensive,25 however along with the market development, product supply will
22 QROPS will not have to report to HMRC a payment if the member is not tax resident in the
UK when the payment is made and has neither been UK resident in that tax year nor in any of the
previous five tax years. But a QROPS will need to check on the position when a payment is made as
the member could have become UK resident again after a period of non-residence, www.hmrc.gov.
uk/pensionschemes/faqs.htm#32.
23 www.shelteroffshore.com/index.php/offshore/more/costs-benefits-associated-qrops-offshore-
pensions-10453.
24 Her Majesty’s Revenue and Customs (HMRC) is a British government department responsible
primarily for collecting and managing taxes, as well as for the payment of certain forms of state aid.
HMRC was formed on the 18 April 2005, following the merger of Inland Revenue and HM Customs
and Excise Departments.
25 Formation fee, Annual Management Charge, Advisory fee, www.shelteroffshore.com/index.
php/offshore/more/costs-benefits-associated-qrops-offshore-pensions-10453.

123Offshore pensions as an alternative way of saving...
increase and consequently the competition concerning funds will increase as well,
what would lead to the reduction of charge that is imposed to the consumers.
Conclusion
The offshore investments ifs frequently considered as “tax avoidance”,26
whereas tax haven is usually associated with the harmful tax competition of the
well-developed countries applying high tax rates. In order to prevent the losses
resulting in the movement of capital to tax havens, Organization for Economical
Cooperation and Development (OECD) is introducing numerous regulations against
tax havens, referring to supervision rules of the foreign companies, restrictions of
the exemption from tax and the regulations of the information exchange between
countries. The report „Harmful Tax Competition: An Emerging Global Issue” was
the first one accepted by the OECD Council, published on the April 9, 1998. Its
aim was to create a common way of cooperation of the member countries and the
commencement of proceedings to oppose and eliminate the harmful competition.
On the June 26, 2000, another OECD Council report „Towards Global Tax Co-
operation, Progress In Identifying and Eliminating Harmful Tax Practices” was
published. This report helped the member countries to reach the agreement con-
cerning the elimination of harmful tax practices. The report established joint legis-
lative solutions and obliged the OECD member countries to the elimination of any
harmful regulation until 2003. Poland, as the OECD member, in order to adjust to
the agreement requirements also introduced changes to Polish tax legislation.27
The assumption that offshore investments and savings are more risky than
in onshore countries, due to the uninhibited law regulations, is incorrect. The law
regulations in tax havens are frequently more restrictive than in other countries
and the innovative financial products created in offshore centres became the
motive force of world economy development, as many of them were adapted to
the conditions in onshore countries.28
26 For more information look at: T. Lipowski, Raje podatkowe a unikanie opodatkowania, Wy-
dawnictwo C.H. Beck, Warszawa 2004, pp. 87–97.
27 For more information look at: ibidem, pp. 269–286.
28 Ch.M. Le Marchant, Financial regulation and supervision offshore: Guernsey, a case study,
[in:] Offshore finance centres and tax havens: the rise of global capital, Macmillan Press Ltd, Bas-
ingstoke 1999, pp. 213–215.

124 Ewa Chrzanowska
Poland’s entrance to the European Union and the increasing access to
labour-markets caused a considerable migration of labour force from the country.
The factors influencing the migration movements include economy conditions,
demographic pressure, high unemployment in the native country as well as the
encouragements from the immigration country, such as the employment oppor-
tunities and higher salaries.29 In relation to the increase of migration movements
including temporal as well as permanent residence, the problem of ensuring emi-
grants with the possibility of pension saving should be noticed. In many countries
including Poland, there are not enough solutions helping to amass the pension
funds for those who move to another country. The opportunity of locating the
capital in effective tax systems regions would enable the emigrant to provide
themselves an adequate income after the retirement, especially by those who do
not plan to come back to their native country or by those who have not yet made
the decision about the place of spending their retirement.30
The emigrant who works and lives abroad can use the financial possibilities
of offshore countries in order to invest and save the money earned. Obviously, the
management of the investment portfolio created in the offshore centre requires
more involvement, skills and taking a higher investment risk than in case of tradi-
tional pension system. Usually a higher risk is taken by the young people who have
just started with their pension plans. Basically it is caused by a longer investment
deadline which allows to gain higher rate of return31 and regaining of any possible
rapid drops of the fund value. The investor reaching the retiring age should try to
limit the risk and choose instruments of low mutability of rate of return.
The adjustment of the investment portfolio to the insured individual needs
is essential to ensure safety, increase of the wealth and maximise the expatriates
benefits. The situation of the emigrant is influenced by numerous factors, such as
the country of residence, marital status or the country in which he intend to retire.
The investor has to also make sure that the jurisdiction he prefers has got high
standard of regulations, provides appropriate supervision, security, political and
economic stability as well as the access to the services regardless of the investor’s
country of residence.
29 Wpływ emigracji zarobkowej na gospodarkę Polski, Ministerstwo Gospodarki, Departament
Analiz i Prognoz, Warszawa 2007, p. 7.
30 For more information look at: ibidem, p. 21.
31 Although variation coefficients of the fund value will be higher.
125Offshore pensions as an alternative way of saving...
EMERYTURY OFFSHORE JAKO ALTERNATYWNA FORMA
OSZCZĘDZANIA DLA BRYTYJSKICH EMIGRANTÓW
LEKCJA DLA POLSKI?
Summary
Migracja międzynarodowa odgrywa coraz większą rolę w większości państw człon-
kowskich Unii Europejskiej i dotyczy także Polski. Praca w kraju innym niż kraj pocho-
dzenia stwarza emigrantom wiele możliwości oszczędzania i inwestowania gromadzonego
kapitału. Wiele rozwiązań dostarczanych jest przez kraje offshore oferujące atrakcyjne
plany oszczędnościowe, które zapewniają inwestorom korzyści podatkowe i dostęp do
szerokiej gamy profesjonalnie zarządzanych funduszy inwestycyjnych. Planowanie eme-
rytur na bazie usług oraz narzędzi finansowych pochodzących z krajów offshore może
przynieść znaczące korzyści dla ludności mieszkającej i pracującej poza krajem pocho-
dzenia. W roku 2006 rząd brytyjski postanowił wesprzeć koncepcję emerytur zagranicz-
nych dla brytyjskich emigrantów i wprowadził nowy program oszczędzania emerytalnego
QROPS, który jest prywatnym programem emerytalnym utworzonym w kraju innym niż
Wielka Brytania. W związku z rosnącą jego popularnością warto pokusić się o określenie,
czy z doświadczeń brytyjskich może wynikać lekcja dla Polski.

SCIENTIFIC JOURNAL
NR 670 SERVICE MANAGEMENT Vol. 7 2011
AGNIESZKA CZAJKOWSKA
University of Lodz
THE TECHNOLOGY CREDIT AS A METHOD OF FINANCING INNOVATIVE TECHNOLOGY
OF MICRO, SMALL AND MEDIUM-SIZED ENTERPRISES
Introduction
Innovative micro, small and medium-sized enterprises (MSME) face serious
problems to meet their capital needs. The preferential technology credit is the state
financial instrument which is granted from commercial banks’ means, whereas the
National Possessions Bank (NPB)1 pays off a part of an incurred credit in a form
of the technological bonus from the Technology Credit Fund. The technology
credit allows entrepreneurs to finance investments implementing new technology
(both their own and purchased), and to start up – the production of new goods.
Entrepreneurs have the possibility of gaining a remission – a maximum of 50%
of the credit value.2
The aim of the article is to evaluate the preferential technology credit as
a national financial instrument in a range of stimulating the technology innovation
among Polish enterprises. The paper shows the hitherto existing effects of using
the technology credit by domestic entrepreneurs and points to potential advantages
1 The National Possessions Bank (NPB) means Bank Gospodarstwa Krajowego (BGK).
2 Strategy for Increasing the Innovativeness of the Economy in the years 2007–2013, Ministry
of Economy, Economy Development Department, Warszawa 2006, p. 46.
128 Agnieszka Czajkowska
for firms and economy resulting from applying this form of stimulating inno-
vation of MSME’s to Poland.
One of the way to provide financial support to the innovative and development
activity in Poland is the Technology Credit Fund. The article presents a basis of
the technology credit, the funding mechanism and the forms of grants. Moreover,
the paper focuses on possible advantages and disadvantages for Polish economy
as a consequence of using the technology credit as the method of financing inno-
vative MSME.
1. The essence and importance of technological innovation
The Central Statistical Office assumes that an innovative activity means
scientific, technical, organizational, financial and commercial activities taken as
a whole, which actually lead to (or are intended to lead to) innovation. Some of
these actions by themselves are innovative, while others are not – but they all are
necessary for innovation to be implemented. The innovative activity also includes
a research and development (R&D), which is not directly related to the creation
of a specific innovation.3 According to The Act of Some Forms of Support for
Innovation Activities – an innovative activity is defined as an activity related to
the preparation and starting production of new or improved materials, products,
facilities, services, processes or methods used for marketing or for the other use
in practice.”4 A concise definition of innovation refers to: successful production,
assimilation and exploitation of novelty in the economic and social spheres,5
while a more complex definition describes: the renewal and enlargement of the
range of products and services and associated markets, the establishment of new
methods of production, supply and distribution, the introduction of changes in
3 Działalność innowacyjna przedsiębiorstw w latach 2006–2008, Główny Urząd Statystyczny,
Departament Przemysłu, Warszawa 2009, p. 1.
4 Ustawa z dnia 29 lipca 2005 roku o niektórych formach wspierania działalności innowacyjnej,
DzU 2005, nr 179, poz. 1484; 2006, nr 107, poz. 723, art. 2 pkt 6.
5 The original definition: successful production, assimilation and exploitation of novelty in the
economic and social spheres – is from the Commission Announcement, Innovation policy: updating the Union’s approach in the context of the Lisbon Strategy, COM (112) 2003.
129The technology credit as a method of financing innovative technology...
management, work organisation, and the working conditions and skills of the
workforce.6
Since the subject of the article is crediting the investment in new technologies,
it is necessary to describe some concepts of the technological investment and the
new technology in the light of existing regulations. “The technology investment
consists of: buying the new technology, its implementation and – launching on
its base the production of new or refined products or providing new or upgraded
services, or implementing your own new technology and launching on its base
the production of new or improved products or provision of new or improved
services.”7 In turn, “the new technology means a technological knowledge in the
form of intangible assets, in particular research results and development, which
allows to manufacture new or improved products or services and which has been
practising globally no longer than for 5 years.”8
To better understand the purpose of the technology credit it seems necessary
to clarify the concepts of the technology and technological innovation. The tech-
nology includes the copied material element of practical application, as well as
the expertise that enables its application.9 In other words, technology is a „com-
bination of techniques used to manufacture physical objects, but also to improve
services and shape social behaviour.”10 By contrast, technological innovation is
to introduce the new technology into practice. It concerns a new way in which
products are designed or manufactured or supplied to the market.11
The idea of financial support for innovative technology investments of MSME
is to increase the degree of innovation of Polish economy and to transform enter-
prises into innovative ones. “Innovative enterprises in terms of product and process
innovations are those which have introduced at least one product or process inno-
6 The original definition: the renewal and enlargement of the range of products and services and
the associated markets; the establishment of new methods of production, supply and distribution; the
introduction of changes in management, work organization, and the working conditions and skills of
the workforce is in COM (1995) 688.
7 Ustawa z dnia 29 lipca 2005 roku…, art. 2 pkt 7, lit. a, b.
8 Ibidem, art. 2 pkt 10.
9 M. Dodgson, D. Gann, A. Salter, The Management of Technological Innovation. Strategy and
Practice, Oxford University Press Inc., New York 2008, p. 2.
10 M. Hirszowicz, Spory o przyszłość, Wydawnictwo IFiS PAN, Warszawa 2007, p. 27.
11 M. Bielski, Podstawy teorii organizacji i zarządzania, Wydawnictwo C.H. Beck, Warszawa
2002, p. 84.
130 Agnieszka Czajkowska
vation: a new or significantly improved product or new or significantly improved
process, which is a novelty, at least for the investigated company.”12
2. The idea of the technology credit
The technology credit is a credit that can be partially remitted under the terms
of The Act of Some Forms of Support for Innovation Activities and which is given
to entrepreneurs for technology investment.13 Entrepreneurs who implement inno-
vative solutions will have an opportunity to take advantage of a financial support
provided as a part of the operation the POIG 4.3 “The technology credit” in the
period of 2007–2013.14 The total budget for this period is 409 850 588 EUR.15 The
institution responsible for acceptance and evaluation of project applications of the
technology credit is the National Possessions Bank.16
The money from the technology credit is to be allocated for investments in
innovation and improving competitiveness.17 The purpose is to support investments
in the implementation of new technologies by giving SMEs the technology credit
with the possibility of repaying partially from the Technology Credit Fund in
the form of technology bonuses.18 The technology credit can not be granted for
12 Działalność innowacyjna przedsiębiorstw…, p. 1.
13 Ustawa z dnia 29 lipca 2005 roku…, art. 2 pkt 9.
14 The legal basis: Ustawa z dnia 30 maja 2008 roku o niektórych formach wspierania działal-
ności innowacyjnej, DzU 2008, nr 116, poz. 730; Działanie 4.3 POIG; Rozporządzenie Rady Mini-
strów z dnia 13 października 2006 roku w sprawie ustalenia mapy pomocy regionalnej, DzU 2006,
nr 190, poz. 1402.
15 Instrumenty bezpośredniego wsparcia finansowego przedsiębiorców w zakresie badań i inwe-stycji – kredyt technologiczny, Ministerstwo Gospodarki, http://www.mg.gov.pl, 21.07.2009.
16 The list of co-operating banks: Bank BPH SA – www.bph.pl, BRE Bank SA – www.brebank.pl,
Bank Polska Kasa Opieki SA – www.pekao.com.pl, Bank Polskiej Spółdzielczości SA – www.bankbps.pl, Powszechna Kasa Oszczędności Bank Polski SA – www.pkobp.pl, Raiffeisen Bank Polska SA – www.raiffeisen.pl, ING Bank Śląski SA – www.ingbank.pl, Bank Ochrony Środowiska SA – www.bosbank.pl, Bank Handlowy w Warszawie SA – www.citibank.pl, Gospodarczy Bank Wielkopolski – www.sgb.pl, Mazowiecki Bank Regionalny SA – www.mrbank.com.pl, Bank Mille-nium SA – www.millenet.pl, Alior Bank SA – www.aliorbank.pl.
17 N. Hałabuz, Małe firmy dostaną kredyty inwestycyjne, „Gazeta Wyborcza”, http://wyborcza.biz/biznes, 10.06.2009.
18 Instrumenty bezpośredniego wsparcia…

131The technology credit as a method of financing innovative technology...
purchase, leasing or rental of fixed assets, in which the new technology, which is the object of the technological investment, was implemented.19
In 2009 the budget planned for financing technology investments amounted to 200 million PLN.20 However, entrepreneurs used only a small part of the money.21 The major effects of the crisis are the following. Firstly, the banks have become reluctant to lend as their profits in the first quarter of this year decreased from 4 billion PLN in the same period last year to 2 billion PLN. Subsequently, this has put both private and corporate lending under strain. What business repre-sentatives fear is that credit growth could drop from 30% last year to 10% or less
this year.22
The two direct consequences of problems associated at the design stage are:
delay in launching the technology credit, which means that the initial allocation of
600 million PLN for the year 2009 was unrealistic. According to the most recent
information, the financial allocation has been reduced to 200 million PLN. In the
light of such delay, it is not surprising that there is an attempt to change the current
system under which the premium is paid on the basis of the presented and paid
invoices. The new plan is to pay the premium after the realization of investments,
which is viewed to speed the process of disbursement of the financial allocations
and banks may offer more preference credits.23
3. Beneficiaries and exemplary supported projects
Beneficiaries of the technology credit are micro, small and medium-sized
enterprises. Projects implemented by entities directly using support, i.e. SME
investment consisting of the implementation of a new technology, whether own or
purchased and commencement of sales of products, processes or services created
with usage of this technology, financed with the use of the technology credit.24
19 Measure 4.3 IE OP Technology credit, http://www.paiz.gov.pl, 2010.
20 Kredyt technologiczny – informacje ogólne. Finansowanie z Funduszy Europejskich, Bank
Ochrony Środowiska S.A., http://www.bosbank.pl, 2010.21 N. Hałabuz, Miliardy na inwestycje technologiczne czekają na chętnych, „Wyborcza.biz”,
http://wyborcza.pl, 15.01.2010.22 Special Report Poland: 20 Years of Democracy, “Financial Times” 4 June 2009. 23 INNO-Policy TrendChart – Innovation Policy Progress Report Poland 2009, European Com-
mission Enterprise Directorate-General, Warszawa 2009, p. 23.24 Measure 4.3 IE OP Technology credit…
132 Agnieszka Czajkowska
The technology credit is going to be granted for the realization of the techno-logical investment, which is aimed at purchasing and implementing the new tech-nology used worldwide no longer than 5 years and starting the production of new or significantly improved products, processes or services with the use of applied technology.25
To make funds for implementing new technologies be paid at a very short notice to as many enterprises as possible, the credit can be granted by commercial banks from their own funds, while the NPB repay a part of this credit in the form of the technology bonus. Due to this solution, the maximum credit amount will not be limited to 2 million EUR any more, but will be determined by a commercial bank.26
4. Minimum value of the co-financing and own contribution
The NPB can pay the technology premiums to 31 December 2015, which means that the entrepreneur should submit an application for payment of premiums no later than 2–3 months before the end of that period.27 SME projects are of value no more than 4 million PLN. Minimum 25% of the value of eligible expenditure
are own contribution.28
Expenses, which can be financed, are:29
‒ purchase, on market conditions, new or used fixed assets, excluding means
of transport, acquired by the entrepreneur conducting a business activity
in the transport sector;
‒ rental, lease or leasing of the fixed assets others than the lands, houses
and buildings, if the rental, lease or leasing agreement stipulate the duty
of purchasing by the borrower the property rights of fixed assets, with the
passage of the rental, lease or leasing period;
25 Kredyt technologiczny, Bank Gospodarstwa Krajowego, http://www.bgk.pl, 2010.
26 I. Polok, Banki a finansowanie dotacji unijnych, Management & Consulting Group, http://
www.mcgroup.eu, 2010.
27 Kredyt technologiczny – pytania i odpowiedzi, Konferencja „Innowacja i kredyt technologicz-
ny – szansą na sukces”, 2 października 2009, Bank Gospodarstwa Krajowego, presentation, p. 13.
28 Measure 4.3 IE OP Technology credit…
29 Ibidem.

133The technology credit as a method of financing innovative technology...
‒ rental, lease or leasing of the lands, houses and buildings, if rental, lease
or leasing will last for more than 3 years since the day of technological
investment ending;
‒ extension of existing buildings, houses, machines, devices, constituting
the fixed assets;
‒ installation and starting-up the machines and devices constituting the fixed
assets;
‒ purchase or leasing, if the leasing agreement stipulates the duty of pur-
chasing with the period of leasing, intangible and law values, according to
the Commission Ordinance (EC) nr 1628/2006 from 24 October 2006 in
the case of usage of the art. 87 and 88 of the Treaty with the accordance to
regional investment aid map,30 which:31
‒ are assets in the meaning of Accountancy Act, the entrepreneurs, will be
used by them and they will stay only in workshop, in which the techno-
logical investment was realized, financed by the technology credit, at
least for 3 years since the day of technical investment ending,
‒ were purchased from the third party for the price reflecting the market
value,
‒ are liable to amortization in accordance to the statements of the Account-
ancy Act.
The expenses of the technological investment realization also include
expenses, which were spent on pre-realization works, made by external advisers,
studies, expert’s opinions, conceptions and technical projects, necessary for the
implementation of the new technology in the framework of the National Pos-
sessions Bank.32
The technology premium is paid in accordance with “The regional aid map”
in relation to the value of the credit granted one-time or in portions, in an amount
equivalent to the net value reached from the sale of goods or services produced
due to the investment.33 The intensity of support in regions is showed in table 1.
30 Rozporządzenie Rady Ministrów z dnia 13 października 2006 roku…, poz. 1402.
31 Measure 4.3 IE OP Technology credit…
32 Ibidem.
33 Rozwiń firmę z kredytem technologicznym, www.echodnia.eu; Kredyt technologiczny na roz-wój firmy, http://www.wspolczesna.pl, 8.01.2010.
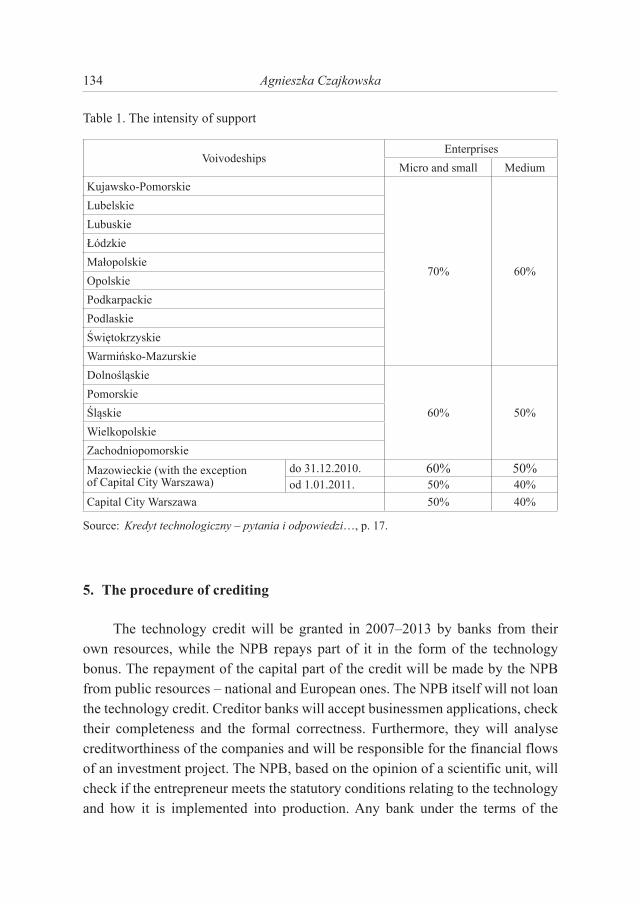
134 Agnieszka Czajkowska
Table 1. The intensity of support
VoivodeshipsEnterprises
Micro and small Medium
Kujawsko-Pomorskie
70% 60%
Lubelskie
Lubuskie
Łódzkie
Małopolskie
Opolskie
Podkarpackie
Podlaskie
Świętokrzyskie
Warmińsko-Mazurskie
Dolnośląskie
60% 50%
Pomorskie
Śląskie
Wielkopolskie
Zachodniopomorskie
Mazowieckie (with the exceptionof Capital City Warszawa)
do 31.12.2010. 60% 50%od 1.01.2011. 50% 40%
Capital City Warszawa 50% 40%
Source: Kredyt technologiczny – pytania i odpowiedzi…, p. 17.
5. The procedure of crediting
The technology credit will be granted in 2007–2013 by banks from their own resources, while the NPB repays part of it in the form of the technology bonus. The repayment of the capital part of the credit will be made by the NPB from public resources – national and European ones. The NPB itself will not loan the technology credit. Creditor banks will accept businessmen applications, check their completeness and the formal correctness. Furthermore, they will analyse creditworthiness of the companies and will be responsible for the financial flows of an investment project. The NPB, based on the opinion of a scientific unit, will check if the entrepreneur meets the statutory conditions relating to the technology and how it is implemented into production. Any bank under the terms of the
135The technology credit as a method of financing innovative technology...
agreement, establishing the principles of cooperation with the NPB, will be able to provide the credit. The inclusion of commercial banks will make the contact of banks with businesses closer, which will be helpful in preparing the required documentation and creditability assessment. Entrepreneurs will have easier access to the professional information about the formal requirements of the technology credit facility, as well as the information about the progress of the procedure. Commercial banks are taking over most duties associated with the technology credit service, because they will bear responsibility for assessing creditability and transferring documentation from the potential borrower to the NPB as well as from the NPB to the borrower. Only an agreement to get the technology premium is signed directly between the entrepreneur and the NPB.34
The bank provides the credit for a period of 72 months. The interest rate on the credit is based on WIBOR rate plus the bank’s profit margin. To apply for the technology credit in the bank, the entrepreneur must submit a credit application and relevant documents, which are required.35 The applications for the technology credit can be submitted from 1st April 2009.36
The procedure of applying for the technology credit starts when the entre-preneur submits an application for the technology credit to the crediting bank. After obtaining the promise of a loan or concluding an initial agreement to the credit, the entrepreneur, through the crediting bank, submits an application for the technology premium to the NPB. When the application is approved, the NPB writes out the promise of the technology premium, on the base of which the entre-preneur signs a credit agreement with a crediting bank. After receiving information about a credit contract from the crediting bank, the NPB concludes an agreement with the company concerning the payment of the technology premium.37 The pro-cedure of giving the technology credit is shown on the schema 1.
34 K. Brzozowska, Kredyt technologiczny jako forma wspomagania rozwoju działalności inno-wacyjnej w Polsce, [in:] Uwarunkowania rynkowe rozwoju mikro i małych przedsiębiorstw – Mi-
krofirma 2009, red. A. Bielawska, Wydawnictwo Naukowe Uniwersytetu Szczecińskiego, Szczecin
2009, p. 176.
35 Kredyt technologiczny, http://www.kredyttechnologiczny.pl, 2010.
36 Kredyty na innowacje dla małych firm, http://www.kredytytechnologiczne.eu, 2010.
37 The elaboration on the basis of the presentation prepared for the conference: Innowacja i kredyt
technologiczny szansą na sukces, B. Skomska, Bank Gospodarstwa Krajowego, Warszawa 2009.
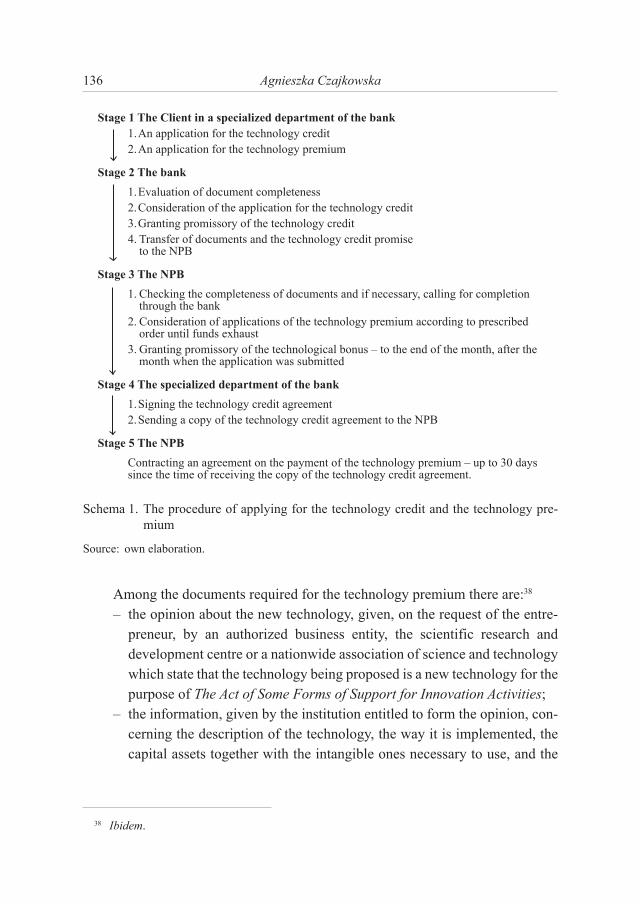
136 Agnieszka Czajkowska
Stage 1 The Client in a specialized department of the bank1. An application for the technology credit2. An application for the technology premium
Stage 2 The bank
1. Evaluation of document completeness2. Consideration of the application for the technology credit3. Granting promissory of the technology credit4. Transfer of documents and the technology credit promise
to the NPB
Stage 3 The NPB
1. Checking the completeness of documents and if necessary, calling for completion through the bank
2. Consideration of applications of the technology premium according to prescribed order until funds exhaust
3. Granting promissory of the technological bonus – to the end of the month, after the month when the application was submitted
Stage 4 The specialized department of the bank
1. Signing the technology credit agreement2. Sending a copy of the technology credit agreement to the NPB
Stage 5 The NPB
Contracting an agreement on the payment of the technology premium – up to 30 days since the time of receiving the copy of the technology credit agreement.
Schema 1. The procedure of applying for the technology credit and the technology pre-mium
Source: own elaboration.
Among the documents required for the technology premium there are:38
‒ the opinion about the new technology, given, on the request of the entre-
preneur, by an authorized business entity, the scientific research and
development centre or a nationwide association of science and technology
which state that the technology being proposed is a new technology for the
purpose of The Act of Some Forms of Support for Innovation Activities;
‒ the information, given by the institution entitled to form the opinion, con-
cerning the description of the technology, the way it is implemented, the
capital assets together with the intangible ones necessary to use, and the
38 Ibidem.
137The technology credit as a method of financing innovative technology...
description of the products or services as a result of technological invest-ments;
‒ the business plan of the technology investment with a material and finan-
cial schedule and the register of the costs.
The most important feature of the technology credit is the fact that there is
a possibility of remission of the part of the amount of the used credit, according
to the conditions defined in the act. The entrepreneur may submit the application
for the technology premium through the crediting commercial bank to the NPB.
A conditional agreement to the technology credit must be enclosed with the appli-
cation. The most crucial condition to be fulfilled is that the total amount of the
remission of the part of the credit can not exceed 50% of the used credit capital and
PLN equivalent of 1 million EUR. The remission is given when the entrepreneur
starts selling goods and services resulting from technological investments, con-
firmed by invoices presenting these sales, up to 20% of the net value shown in
the paid invoices. The remission of the credit part is the public aid provided for
the entrepreneur. The businessman taking advantage of such remission is required
to conduct business related to the credited investment, for a minimum period of
5 years since the investment has been completed.39
6. The Technology Credit Fund
The Technology Credit Fund is the institution aimed at overcoming barriers
to SME sector access to the capital. The Technology Credit Fund is created as the
state target fund in a form of a bank account, from which technological bonuses are
paid out. The authorized disposer is the appropriate sector minister for economy,
whereas the bank service was firstly conducted by NPB. The fund means are
composed of subsidies from the state budget in the amount defined in the budget
act, interest on the fund means deposits in banks, receipts from the fund means
investments in the form of securities issued by the State Treasury or investment
funds on the monetary market, as well as other receipts.40
In spring 2007, the Ministry of Finance proposed to give the Technology
Credit Fund a status of a national direct fund, in order to ensure the transparency
39 Kredyt technologiczny, http://www.kredyttechnologiczny.pl, 2010.
40 Kredyt technologiczny, Bank Gospodarstwa Krajowego, http://www.bgk.com.pl, 2009.

138 Agnieszka Czajkowska
of public finances and consequently, better control over spending public money. The Act of Some Forms of Support for Innovation Activities that came into force in July 2008 recognized the Technology Credit Fund as the national direct fund. Subsequently, it changed the management of the fund. In practice, this meant that the Ministry of Economy has become an institution being in charge of the fund, while in the past the Bank had played such a role. This required additional administrative efforts to adjust the structures and processes to the new legal requirements.41
In January 1st 2009 the rules of granting the technology credit changed. Since then it has been granted by commercial banks from their own means, whereas the NPB pays off a part of an incurred credit in the form of the technological bonus from the Technology Credit Fund. The technology credit is granted to MSME by these commercial banks, which will sign an agreement to cooperate with the NPB. It is possible to use the Fund means only for technological bonuses. The NPB decides on a partial repayment of credits, by granting a thermomoderni-zation bonus.42
7. Intended effects of financing innovation with the technology credit
The main objective of innovation policy is to increase innovation of com-panies, which, in turn, will accelerate the economic development and will create new and better jobs. This can be achieved, primarily, through the use of new technologies in order to enhance the competitiveness of traditional industries and through supporting new businesses based on innovative solutions. It is also important to promote cooperation between companies and institutions from the business area and encourage large companies to do research and implement the results of some. Only by building the competitive advantage based on knowledge and innovation, the sustainable economic growth can be guaranteed.
Prepared by the state a financial instrument in the form of the technology credit can be an effective tool to encourage innovation of Polish MSME. This credit enables them to increase competitiveness on the domestic and international market
41 INNO-Policy TrendChart – Innovation Policy Progress Report Poland 2009..., p. 22.42 Kredyt technologiczny, Bank Gospodarstwa Krajowego, http://www.bgk.com.pl, 2009.
139The technology credit as a method of financing innovative technology...
and contribute to their development.43 For banks, in turn, it means the possibility of crediting action growing and winning new, prospective clients. The public sector, which strengthens the business environment, sharing risks together with the private sector meets the expected needs of entrepreneurs.44 The technology credit is an effective way to make the company develop.
Conclusions
The initiative taken by the government, the NPB and commercial banks can fill the capital gap of enterprises from the MSME sector and therefore, it can contribute to accelerating the growth of the economy with a high degree of inno-vation and competitiveness. The main advantages of the technology credit are firstly, the risk reduction resulting from the possibility of redemption of the part of the credit. Secondly, the increase of the investment profitability in innovation. Thirdly, the speed, ease and clear procedures of applying for that credit and finally, no requirement to increase employment.
As far as disadvantages of the technology credit are concerned, the entre-preneurs enumerate such as the requirement for a relatively large share in financing technology investments (25% of eligible costs), the requirement for the
high growth of sales and the right of access to the credit only for micro, small and
medium-sized enterprises.45 Moreover, the procedure of granting the technology
credit and remitting of it partially in the form of the technology premium is com-
plicated and requires from the entrepreneur to prepare carefully detailed business
documentation and to keep to the consecutive procedure steps.
43 I. Łącka, Kredyt technologiczny jako narzędzie wspierania działalności innowacyjnej, Stowa-
rzyszenie Ekonomistów Rolnictwa i Agrobiznesu, Roczniki Naukowe 2007, t. IX, z. 2, p. 216.
44 I. Polok, op.cit.
45 Innowacja i kredyt technologiczny, Polska Konfederacja Pracodawców Prywatnych „Lewia-
tan”, http://www.pkpplewiatan.pl, 7.10.2009.

140 Agnieszka Czajkowska
KREDYT TECHNOLOGICZNY JAKO SPOSÓB FINANSOWANIA
INNOWACYJNEJ TECHNOLOGII MIKRO, MAŁYCH
I ŚREDNICH PRZEDSIĘBIORSTW
Streszczenie
W artykule zaprezentowano preferencyjny kredyt technologiczny jako instrument finansowy proponowany przez państwo, stymulujący innowacje technologiczne polskich
przedsiębiorców. Głównym celem kredytu jest wsparcie inwestycji w zakresie wdraża-
nia nowych technologii przez udzielanie go mikro, małym i średnim przedsiębiorstwom
z możliwością jego częściowej refundacji ze środków Funduszu Kredytu Technologicz-
nego w formie premii technologicznej. Jest to ważny instrument finansowy, który pomaga
MMSP realizować innowacyjne technologicznie projekty. Na początku w artykule przed-
stawiono warunki, jakie powinny spełniać przedsiębiorstwa innowacyjne finansowane kre-
dytem technologicznym. Ponadto przedstawiono pojęcie i rolę kredytu technologicznego,
jak również warunki i procedury kredytowania inwestycji technologicznych. Na końcu
zostały zaprezentowane zalety i wady kredytu technologicznego.
SCIENTIFIC JOURNAL
NR 670 SERVICE MANAGEMENT Vol. 7 2011
ANDRZEJ GRZEBIENIAK
University of Warmia and Mazury in Olsztyn
CHANGES IN POLISH REINSURANCE MARKET IN THE INSURANCE SECTOR IN 1991–2009
Introduction
Reinsurance is an agreement, by virtue of which a national insurance agency – referred to as assignor – cedes the whole or part of specified risk or a group of insured risks together with an adequate part of premiums to an another national insurance agency referred to as reinsurer which commits itself to pay the assignor appropriate part of benefits paid out to the insurance takers”.1 Reinsurance would not be possible without the insurance. It constitutes a kind of prolongation and extension of insurance. As a consequence reinsurance and insurance relations are based on the same basic assumptions.2 The basic function of reinsurance is the stabilization of financial results of the insurer which means compensation of fluc-tuations in financial results of the insurer; reinsurance increases also its acceptance possibilities in the scope of new risks, enables risk coverage and insurance cover to cover catastrophic risks. An important role of reinsurance is also making easier for the insurers to organise new types and forms of insurance.3
1 E. Montalbetti, Reasekuracja, PWE, Warszawa 1970, p. 13.2 A. Banasiński, Ubezpieczenia gospodarcze, Poltext, Warszawa 1996, p. 163.
3 Z. Dudkowiak, Reasekuracja, jej formy i funkcje, [in:] Ubezpieczenia w gospodarce rynkowej,
red. A. Wąsiewicz, OW Branta, Bydgoszcz 1994, p. 217.

142 Andrzej Grzebieniak
1. The objective of the research work and its methodology
The objective of this study is understanding the method and assessment of the effectiveness of reinsurance management in national insurance agencies operating on Polish market between 1991 and 2009. In the study a documentary method was used as a method of data, which characterize the insurance market, collection in which data provided by insurance supervision, that is The Polish Financial Supervision Authority, and own data connected with yet implemented an original research project entitled „Reinsurance management in national insurance agencies during the socio-economic transformation of Poland between 2004 and 2009” were used. From among methods of information the organization, data processing and statistical methods were used.
2. Characteristics and assessment of reinsurance management method in national insurance agencies between 1991 and 2009
The method and effectiveness of reinsurance management can be charac-terised by assessment of particular ratios of reinsurance activity. One of them is premiums retention ratio (or the retention ratio), which is defined as percentage amount of premium retained on own share to gross premium written. Figure 1 shows the development of this ratio between 1991 and 1999, and figure 2 between 2000 and 2009. In the years: 1991–1999 the lowest premium retention ratio was in 1991 it amounted to 72.34%, the highest was in 1998 and it amounted to 81.48%.
The average ratio for that period reached the level of 75.43%. In European Union
countries between 1991 and 1998 the premiums retention ratio was running at
a level of about 90.0%, and in OECD countries at a level of 87.0%.4 During the
period between 2000 and 2009 this ratio increased in Poland considerably and
reached an average value equal to 90.94%, and at the same time its highest level
was in 2007 – 95.08%, and the lowest in 2000 – 84.06%. In the case of European
Union and OECD countries the average annual premiums retention ratio was
running in 2001 and 2007 at a level of 80.79% and 84.34% respectively. It means
that the national insurance agencies in Poland in the first decade of their activity in
free market economy far differed from highly developed countries in the scope of
4 Przegląd dziesięciolecia. Rozwój ubezpieczeń w Polsce w gospodarce wolnorynkowej, PUNU
2001, p. 67.
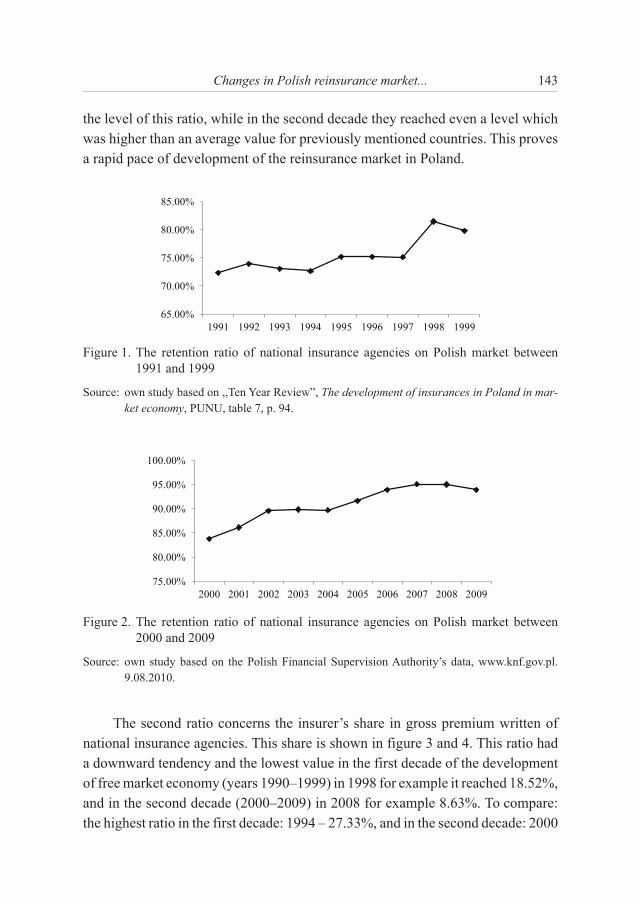
143Changes in Polish reinsurance market...
the level of this ratio, while in the second decade they reached even a level which was higher than an average value for previously mentioned countries. This proves a rapid pace of development of the reinsurance market in Poland.
65.00%
70.00%
75.00%
80.00%
85.00%
1991 1992 1993 1994 1995 1996 1997 1998 1999
Figure 1. The retention ratio of national insurance agencies on Polish market between 1991 and 1999
Source: own study based on ,,Ten Year Review”, The development of insurances in Poland in mar-
ket economy, PUNU, table 7, p. 94.
75.00%
80.00%
85.00%
90.00%
95.00%
100.00%
2000 2001 2002 2003 2004 2005 2006 2007 2008 2009
Figure 2. The retention ratio of national insurance agencies on Polish market between 2000 and 2009
Source: own study based on the Polish Financial Supervision Authority’s data, www.knf.gov.pl. 9.08.2010.
The second ratio concerns the insurer’s share in gross premium written of national insurance agencies. This share is shown in figure 3 and 4. This ratio had a downward tendency and the lowest value in the first decade of the development of free market economy (years 1990–1999) in 1998 for example it reached 18.52%,
and in the second decade (2000–2009) in 2008 for example 8.63%. To compare:
the highest ratio in the first decade: 1994 – 27.33%, and in the second decade: 2000

144 Andrzej Grzebieniak
– 24.22%. In the first decade the biggest drop in assigned premium as compared to
previous year was in 1998 and amounted to 25.5%, whereas in the second decade
was in 2003 and amounted to almost 33.0%.
0.00%
5.00%
10.00%
15.00%
20.00%
25.00%
30.00%
1991 1992 1993 1994 1995 1996 1997 1998 1999
Figure 3. Percentage insurer’s share in gross premium written of national insurance agen-
cies between 1991 and 1999
Source: own study based on the Polish Financial Supervision Authority’s data, www.knf.gov.pl.
9.08.2010.
0.00%
5.00%
10.00%
15.00%
20.00%
25.00%
30.00%
2000 2001 2002 2003 2004 2005 2006 2007 2008 2009
Figure 4. Percentage insurer’s share in gross premium written of national insurance agen-
cies between 2000 and 2009
Source: own study based on the Polish Financial Supervision Authority’s data, www.knf.gov.pl.
9.08.2010.
The third ratio that is the reinsurers’ share in gross claims and fees paid
by national insurance agencies in case of section II (lack of data for section I)
indicated a growth dynamics between 1991 and 1997, and particularly in 1992,
when as compared to 1991 increased by 33.0%, and in 1993, it increased by
27.0% as compared to 1992 (figure 5). Since 1997 up to 2003 this ratio had the
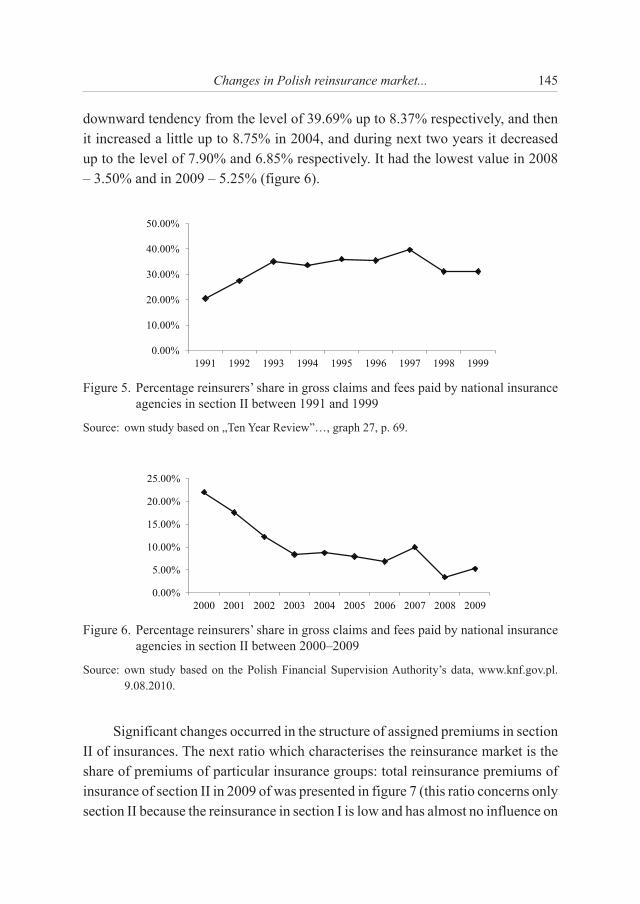
145Changes in Polish reinsurance market...
downward tendency from the level of 39.69% up to 8.37% respectively, and then
it increased a little up to 8.75% in 2004, and during next two years it decreased
up to the level of 7.90% and 6.85% respectively. It had the lowest value in 2008
– 3.50% and in 2009 – 5.25% (figure 6).
0.00%
10.00%
20.00%
30.00%
40.00%
50.00%
1991 1992 1993 1994 1995 1996 1997 1998 1999
Figure 5. Percentage reinsurers’ share in gross claims and fees paid by national insurance
agencies in section II between 1991 and 1999
Source: own study based on „Ten Year Review”…, graph 27, p. 69.
0.00%
5.00%
10.00%
15.00%
20.00%
25.00%
2000 2001 2002 2003 2004 2005 2006 2007 2008 2009
Figure 6. Percentage reinsurers’ share in gross claims and fees paid by national insurance
agencies in section II between 2000–2009
Source: own study based on the Polish Financial Supervision Authority’s data, www.knf.gov.pl.
9.08.2010.
Significant changes occurred in the structure of assigned premiums in section
II of insurances. The next ratio which characterises the reinsurance market is the
share of premiums of particular insurance groups: total reinsurance premiums of
insurance of section II in 2009 of was presented in figure 7 (this ratio concerns only
section II because the reinsurance in section I is low and has almost no influence on

146 Andrzej Grzebieniak
the assessment of the whole reinsurance market, besides, there are no data for the section I for the period between 1991–1998). In 1999 the structure of premiums of particular insurance groups: total assigned premium in section II was as follows: group 10: Third Party Liability (TPL: in Polish OC) – 44.0%, group 8: Calamities
– 9.42%, group 9: Hail and frost – 6.28%, group 13: Other Third Party Liability
– 2.06%, group 14: Loans – 0.65%, group 15: Insurance guarantees – 1.14%,
group 16: Financial risks – 1.46%, group 3: Damage and Theft Policy (in Polish:
AC) – 32.0%, group 1 and 2: Accidents and diseases – 1.0%, other groups – 3.0%.
The biggest change occurred in the third group of insurances (casco insurance of
land vehicles), in which the assigned premium for reinsurance constituted in 1999
almost 32.0% of the total premium value, and in 2009 it decreased to the level of
5.0%. Weaker, but vital decrease was noticed in group 10 (Third Party Liability
which results from having and using land vehicles), in which the premium share
decreased from the level of 44.0% in 1999 to 27.0% in 2009.
Group 10: Third
Party Liability 27%
Group 8: Calamities
18%
Group 9: Hail and
frost 14%
Group 13: Other
Third Party Liability 9%
Group 14: Loans
9%
Group 15: Insurance
guarantees 6%
Group 16: Financial
risks 5%
Group 3: Damage
and Theft Policy 5%
Group 1 and 2:
Accidents and diseases
1%
Remainining groups
6%
Figure 7. Percentage premium share of particular insurance groups and as a whole the
reinsurance premium of section II in 2009
Source: own study based on the Polish Financial Supervision Authority’s data, www.knf.gov.pl.
9.08.2010.

147Changes in Polish reinsurance market...
Probably this change is caused by departure from proportional reinsurance of Third Party Liability portfolio for the benefit of non-proportional reinsurance, what results particularly from the necessity to buy non-proportional security for the Third Party Liability damage risks caused abroad by Polish vehicle users.5 Noteworthy is also a significant increase – from 9.42% to 18.0% – of the share of
assigned premiums from group 8 (Calamity insurance), increase in the premiums’
share from 6.28% to 14% of group 9 (Other insurance related to things, caused by
hail and frost) increase in the premiums’ share from 2.06% to 9.0% of group 13
(Professional Liability). Furthermore, the importance of credit insurance portfolio
increased (group 14) – from 0.65% to 9.0%, as well as insurance guarantee
portfolio (group 15) – from 1.14% to 6.0%.
0.00%
20.00%
40.00%
60.00%
80.00%
100.00%
120.00%
Gro
up
1
Gro
up
3
Gro
up
5
Gro
up
7
Gro
up
9
Gro
up
11
Gro
up
13
Gro
up
15
Gro
up
17
2000 2009
Figure 8. Percentage value of retained premium according to statutory groups of section II
in 2000 and 2009
Source: own study based on the Polish Financial Supervision Authority’s data, www.knf.gov.pl.
9.08.2010.
How important is the reassurance for a given statutory group and its change
in time is especially emphasized by next ratio, that is premiums retention ratio
divided into particular groups. It is shown in figure 8. Almost in all statutory
groups a decrease in the importance of reinsurance occurred. The smallest changes
occurred in the first group in which the percentage amount of retained premium
increased from the level of 98.7% in 2000 to 98.9% in 2009. The biggest changes
5 R. Micyk, Dekady w liczbach, “Miesięcznik Ubezpieczeniowy” 2010, nr 7/8, p. 8.
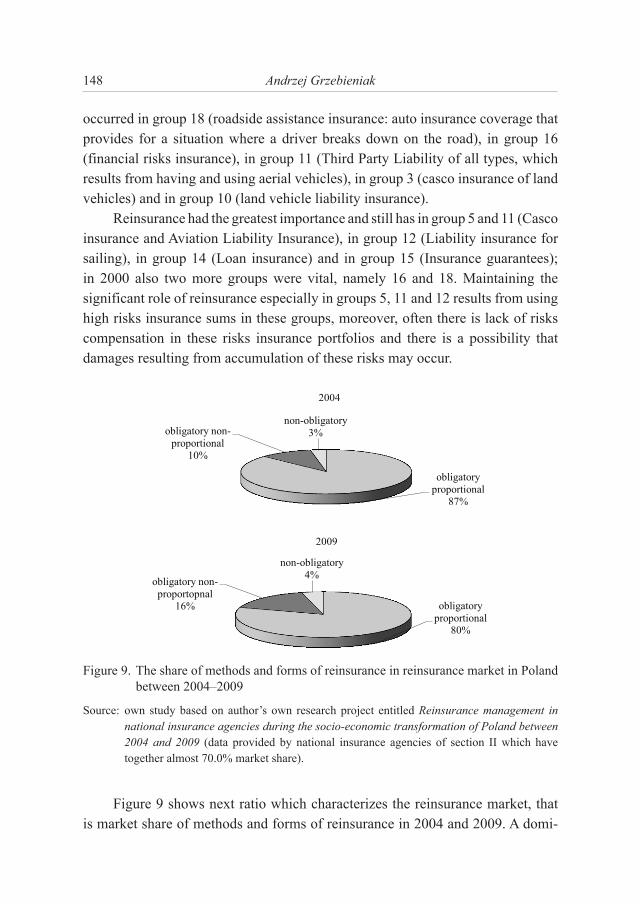
148 Andrzej Grzebieniak
occurred in group 18 (roadside assistance insurance: auto insurance coverage that provides for a situation where a driver breaks down on the road), in group 16 (financial risks insurance), in group 11 (Third Party Liability of all types, which results from having and using aerial vehicles), in group 3 (casco insurance of land vehicles) and in group 10 (land vehicle liability insurance).
Reinsurance had the greatest importance and still has in group 5 and 11 (Casco insurance and Aviation Liability Insurance), in group 12 (Liability insurance for sailing), in group 14 (Loan insurance) and in group 15 (Insurance guarantees); in 2000 also two more groups were vital, namely 16 and 18. Maintaining the significant role of reinsurance especially in groups 5, 11 and 12 results from using high risks insurance sums in these groups, moreover, often there is lack of risks compensation in these risks insurance portfolios and there is a possibility that damages resulting from accumulation of these risks may occur.
obligatory
proportional 87%
obligatory non-
proportional 10%
non-obligatory
3%
2004
obligatory
proportional 80%
obligatory non-
proportopnal 16%
non-obligatory
4%
2009
Figure 9. The share of methods and forms of reinsurance in reinsurance market in Poland between 2004–2009
Source: own study based on author’s own research project entitled Reinsurance management in
national insurance agencies during the socio-economic transformation of Poland between
2004 and 2009 (data provided by national insurance agencies of section II which have together almost 70.0% market share).
Figure 9 shows next ratio which characterizes the reinsurance market, that
is market share of methods and forms of reinsurance in 2004 and 2009. A domi-

149Changes in Polish reinsurance market...
nating meaning had and still has proportional obligatory insurance, but its share gradually decreases: from the level of 87% in 2004 to 80% in 2009. Slowly,
however, non-proportional obligatory reinsurance’s share increases: its share in
2004 amounted to 10%, and in 2009 it amounted to 16%. The increase in share
of non-proportional obligatory reinsurance results first of all from a lower cost of
its using by insurance agencies, moreover, it is a result of capital strengthening of
these agencies and the character of risks taken including disaster risks which are
always reinsured by non-proportional reinsurance.
The share of non-obligatory reinsurance is running at the level of 2–4%.
It is a reinsurance method which is used for single risks of significantly high
insurance amounts, or for risks which are characterised by a high degree of prob-
ability of damage occurrence. It is worth to mention the financial reinsurance on
Polish market, mainly because of some objections raised by The Polish Financial
Supervision Authority and Polish Inland Revenues in connection with difficulties
and doubts concerning expressing the financial reinsurance in accordance with
accounting rules.
0.00%
10.00%
20.00%
30.00%
40.00%
1991 1992 1993 1994 1995 1996 1997 1998 1999
Figure 10. Reinsurance commission percentage share together with profit share of rein-
surers’ in reinsurance premium of section II of insurances between 1991 and
1999
Source: own study based on the Polish Financial Supervision Authority’s data, www.knf.gov.pl.
9.08.2010.
An important ratio which characterises the reinsurance market is also a ratio
of reinsurance commission share together with profit share of reinsurers’ in rein-
surance premium. For insurances from insurance groups of section II it is shown
in figure 10 and 11. There is lack of clear tendency of the development of changes
of the amount of this ratio, nonetheless it can be indicated that between 1991 and

150 Andrzej Grzebieniak
2009 it has a gentle downward trend. One can therefore assume, that it is a result of increasingly higher share of non-proportional reinsurance in the reinsurance market. At present the average level of this ratio is amounted to 25.0% of the
assigned premium.
Summary
Reinsurance still fulfils major role on Polish insurance market. However, its
scope as well as structure of methods and forms of reinsurances changes. To most
important changes on Polish reinsurance market between 1991 and 2009 one may
include:
1) systematic lowering of the scope of reinsurances which reached the level
of highly developed European Union countries by insurance agencies;
2) constant increase in the non-proportional reinsurance share at cost of pro-
portional reinsurance, with the same level of non-obligatory reinsurance;
3) greater meaning of reinsurance of the portfolio of Fire insurances (group 8),
and Professional Third Liability insurances (group 13), Loan insurances
(group 14), as well as decrease in meaning of the third group insurances
portfolio (Casco insurance) and group 10 (Third Liability Insurance),
although group 10 still has the biggest share in the whole of reinsurance
premium of section II (27% in 2009, 44% in 1999);
0.00%
10.00%
20.00%
30.00%
2000 2001 2002 2003 2004 2005 2006 2007 2008 2009
Figure 11. Reinsurance commission percentage share together with profit share of reinsu-
rers’ in reinsurance premium of section II of insurances between 2000–2009
Source: own study based on the Polish Financial Supervision Authority’s data, www.knf.gov.pl.
9.08.2010.
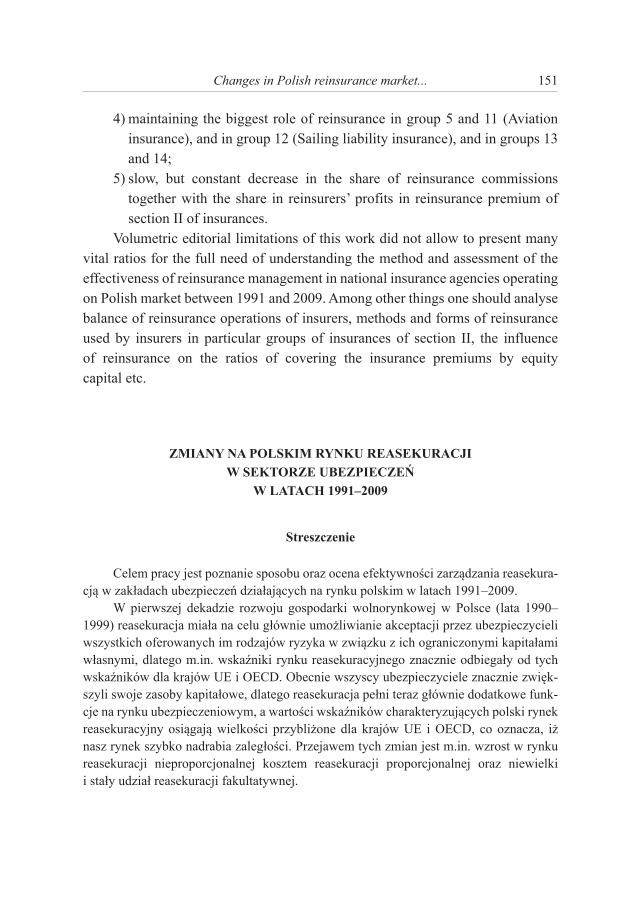
151Changes in Polish reinsurance market...
4) maintaining the biggest role of reinsurance in group 5 and 11 (Aviation insurance), and in group 12 (Sailing liability insurance), and in groups 13 and 14;
5) slow, but constant decrease in the share of reinsurance commissions together with the share in reinsurers’ profits in reinsurance premium of section II of insurances.
Volumetric editorial limitations of this work did not allow to present many vital ratios for the full need of understanding the method and assessment of the effectiveness of reinsurance management in national insurance agencies operating on Polish market between 1991 and 2009. Among other things one should analyse balance of reinsurance operations of insurers, methods and forms of reinsurance used by insurers in particular groups of insurances of section II, the influence of reinsurance on the ratios of covering the insurance premiums by equity capital etc.
ZMIANY NA POLSKIM RYNKU REASEKURACJI
W SEKTORZE UBEZPIECZEŃ
W LATACH 1991–2009
Streszczenie
Celem pracy jest poznanie sposobu oraz ocena efektywności zarządzania reasekura-
cją w zakładach ubezpieczeń działających na rynku polskim w latach 1991–2009.
W pierwszej dekadzie rozwoju gospodarki wolnorynkowej w Polsce (lata 1990–
1999) reasekuracja miała na celu głównie umożliwianie akceptacji przez ubezpieczycieli
wszystkich oferowanych im rodzajów ryzyka w związku z ich ograniczonymi kapitałami
własnymi, dlatego m.in. wskaźniki rynku reasekuracyjnego znacznie odbiegały od tych
wskaźników dla krajów UE i OECD. Obecnie wszyscy ubezpieczyciele znacznie zwięk-
szyli swoje zasoby kapitałowe, dlatego reasekuracja pełni teraz głównie dodatkowe funk-
cje na rynku ubezpieczeniowym, a wartości wskaźników charakteryzujących polski rynek
reasekuracyjny osiągają wielkości przybliżone dla krajów UE i OECD, co oznacza, iż
nasz rynek szybko nadrabia zaległości. Przejawem tych zmian jest m.in. wzrost w rynku
reasekuracji nieproporcjonalnej kosztem reasekuracji proporcjonalnej oraz niewielki
i stały udział reasekuracji fakultatywnej.


SCIENTIFIC JOURNAL
NR 670 SERVICE MANAGEMENT Vol. 7 2011
GABRIELA GURGUL
University of Szczecin
MARKET STRUCTURE ANALYSIS OF ELECTRONIC PAYMENT INSTRUMENTS IN 1998–2010
Introduction
At the turn of the twentieth and twenty-first century the world saw a revo-lution in the cash market, and societies nearly throughout the whole world begun to carry out their payment transactions via electronic payment market, where payment cards are one of the most popular forms of it.
Payment cards are instruments that may be issued by banks and other insti-tutions legally empowered to grant credit and entitling the holder to withdraw cash, pay for goods and services at the point of acceptance such as airports, shops, hotels, etc. Credit cards, like electronic money, according to the Act are included in the electronic payment instruments and have become an increasingly popular form of non-cash settlements, both in Poland and abroad. Electronic payment instruments are any instruments of payment, including access to cash at a distance, enabling the owner to make transactions using electronic media or electronic iden-tification of the holder, necessary to carry out the operation.1
This article aims to show a dynamically changing market for electronic payment instruments in the process of several years, its quantitative analysis and examining the future perspectives of the phenomenon in question.
1 Ustawa z dnia 12 września 2002 r.o elektronicznych instrumentach płatniczych, DzU 2002, nr 169, pos. 1385.

154 Gabriela Gurgul
1. The definition of a payment/credit card
Payment card – a plate of laminated PVC with standard size of 54 × 86 × 0,76 mm, made in accordance with ISO standards. Its characteristic feature is: print associated with the bank – the issuer and the emblem of a system in which it was issued. It contains a magnetic stripe on which data of the card and its holder are to be affixed, and the bar, where the cardholder places his sig-nature pattern. Card also has several features such as scheduling, UV printing and microprint.2 In turn, M. Smaga defines the payment card as a piece of plastic with a magnetic stripe or microprocessor, which entitles the holder to a non-cash purchase of goods and services.3 By contrast for J. Masiota credit card is a document of a set design and content, enabling the holder to make cashless payments for goods and services under the terms of the contract for a card.4
Payment card is a facility for making payments without using cash. The payments made by it shall be made by means of transfer of funds from the cardholder’s account to that of a creditor.5 In turn, the Banking Law Article. 4 defines the payment card as a banking product, and defines it as an issuer iden-tification card, and entitles the holder to withdraw cash and make payment, and in the case of cards issued by a bank or institution legally authorized to grant credit or make payments or withdraw cash and pay using credit.6
The above-mentioned definitions, describing the appearance of the cards are technical and imperfect definitions. Therefore, it should be noted that the payment card is also a document with fixed appearance and content, which enables its holder to make cashless payments for goods and services under the terms of the agreement for a card and on the basis of rules strictly defined therein.7
2 J. Kukulski, I. Pluta, Karty płatnicze – teoria i praktyka, Dom Wydawniczy ABC, Warszawa 1998, p. 25.
3 M. Smaga, Karty płatnicze, Kantor Wydawniczy Zakamycze, Kraków 1998, p. 10.4 Cf. J. Masiota, Elektroniczne instrumenty płatnicze, OW Branta, Bydgoszcz–Poznań 2003,
p. 20.
5 Usługi i procedury bankowe, red. E. Bogacka-Kisiel, Wydawnictwo Akademii Ekonomicznej
im. Oskara Langego, Wrocław 2000, p. 581.
6 Ustawa z dnia 27 sierpnia 1997 r. Prawo bankowe, DzU nr 140, poz. 939, art. 4.
7 Comp. M. Smaga, op.cit., p. 15.

155Market structure analysis...
2. Analysis of the structure of the electronic payment market in Poland
Non-cash transactions in today’s life play an important role by enabling payments between contractors without physical cash, thereby increasing the safety of operations performed. Also in the everyday life of ordinary citizens, they play a significant role, because the predominance of retail points of service accepts payment by the payment cards, so that their customers do not have to turn the cash. In addition, electronic solutions are very useful because you can have access to funds in your account at any time, or simply when customers only want to. The popularity and convenience of such transaction, results in more and more customers use this type of transaction, thus contributing to the dynamic growth in the circulation of non-cash payment instruments.
The increase in the number of transactions using electronic payment instruments, was also the result of growth in the number of cards issued by banks. Polish payment cards are issued by four international organizations, which include: Visa, MasterCard, Diners Club and American Express. The changes that occurred in the number and structure of payment cards in Poland in 1998–2009 are shown in figure 1.
3875.6
8290
11291.1
14388.8
16916.4
15130.1
16911.4
20370.3
23848
26496.2
30275.5
0
5000
10000
15000
20000
25000
30000
35000
1999 2000 2001 2002 2003 2004 2005 2006 2007 2008 2009
mln
Figure 1. Number of payment cards issued in the years 1998–2010
Source: own calculations based on data from the NBP.
Since 1998, we have observed the growing number of payment cards, at the end of 2003–2004 there was a minimal decrease in the number of issued payment instruments, and the trend changed in 2005, causing an even greater rate of growth, primarily due to favourable conditions of issued credit cards and enjoying a growing popularity of electronic transactions. Taking into account dif-
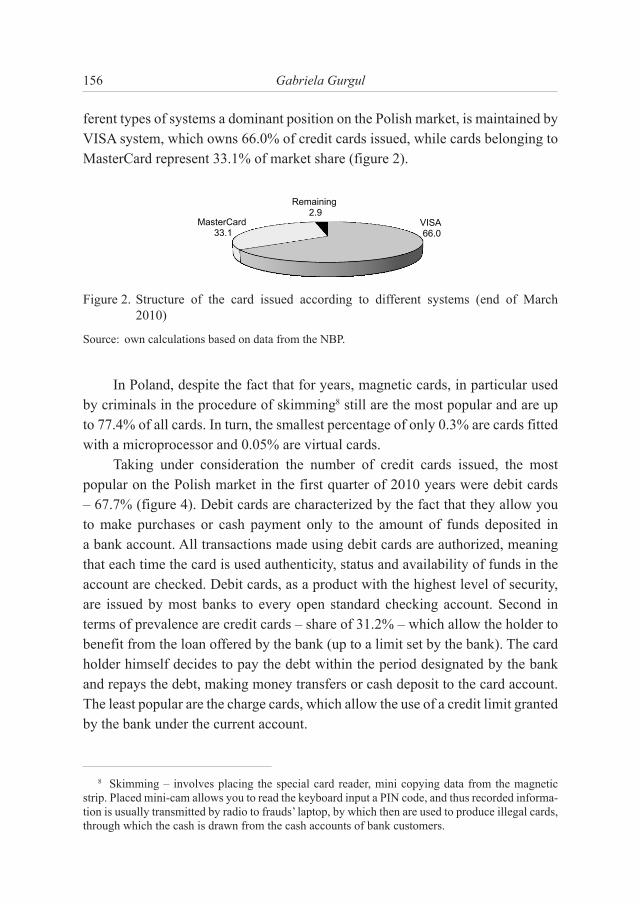
156 Gabriela Gurgul
ferent types of systems a dominant position on the Polish market, is maintained by VISA system, which owns 66.0% of credit cards issued, while cards belonging to
MasterCard represent 33.1% of market share (figure 2).
VISA 66.0
MasterCard 33.1
Remaining 2.9
Figure 2. Structure of the card issued according to different systems (end of March
2010)
Source: own calculations based on data from the NBP.
In Poland, despite the fact that for years, magnetic cards, in particular used
by criminals in the procedure of skimming8 still are the most popular and are up
to 77.4% of all cards. In turn, the smallest percentage of only 0.3% are cards fitted
with a microprocessor and 0.05% are virtual cards.
Taking under consideration the number of credit cards issued, the most
popular on the Polish market in the first quarter of 2010 years were debit cards
– 67.7% (figure 4). Debit cards are characterized by the fact that they allow you
to make purchases or cash payment only to the amount of funds deposited in
a bank account. All transactions made using debit cards are authorized, meaning
that each time the card is used authenticity, status and availability of funds in the
account are checked. Debit cards, as a product with the highest level of security,
are issued by most banks to every open standard checking account. Second in
terms of prevalence are credit cards – share of 31.2% – which allow the holder to
benefit from the loan offered by the bank (up to a limit set by the bank). The card
holder himself decides to pay the debt within the period designated by the bank
and repays the debt, making money transfers or cash deposit to the card account.
The least popular are the charge cards, which allow the use of a credit limit granted
by the bank under the current account.
8 Skimming – involves placing the special card reader, mini copying data from the magnetic
strip. Placed mini-cam allows you to read the keyboard input a PIN code, and thus recorded informa-
tion is usually transmitted by radio to frauds’ laptop, by which then are used to produce illegal cards,
through which the cash is drawn from the cash accounts of bank customers.
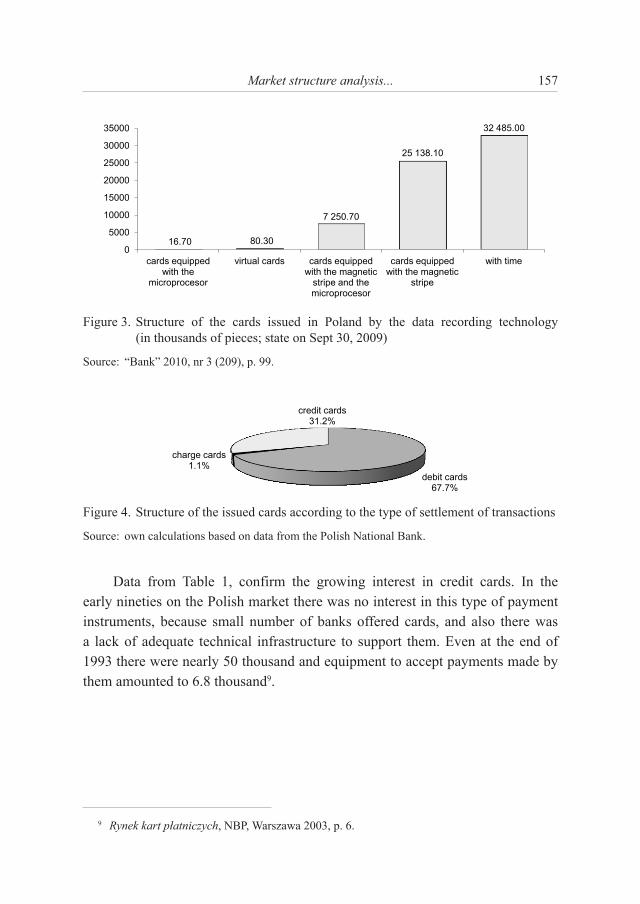
157Market structure analysis...
16.70 80.30
7 250.70
25 138.10
32 485.00
0
5000
10000
15000
20000
25000
30000
35000
cards equipped with the
microprocesor
virtual cards cards equipped with the magnetic
stripe and the microprocesor
cards equipped with the magnetic
stripe
with time
Figure 3. Structure of the cards issued in Poland by the data recording technology (in thousands of pieces; state on Sept 30, 2009)
Source: “Bank” 2010, nr 3 (209), p. 99.
debit cards 67.7%
charge cards 1.1%
credit cards 31.2%
Figure 4. Structure of the issued cards according to the type of settlement of transactions
Source: own calculations based on data from the Polish National Bank.
Data from Table 1, confirm the growing interest in credit cards. In the early nineties on the Polish market there was no interest in this type of payment instruments, because small number of banks offered cards, and also there was a lack of adequate technical infrastructure to support them. Even at the end of 1993 there were nearly 50 thousand and equipment to accept payments made by them amounted to 6.8 thousand9.
9 Rynek kart płatniczych, NBP, Warszawa 2003, p. 6.

158 Gabriela Gurgul
3. Analysis of the credit card market
The first credit card – Partner appeared in 1995, issued by Bank Pekao S.A.10 Then in 1997 a credit card for individual customers in Poland, which was honoured throughout the world, was emitted by Citibank Poland (now Citi Bank Handlowy).11 In the beginning the share of credit cards in Poland was low and amounted to only 2.4% at the end of 1998. This situation has changed, however,
the number of issued credit cards has increased due to the increasing competition
between banks, which contributed to the enrichment and diversification of offers
of banks in Poland in order to gain a potential customer. Detailed breakdown of
the credit card market by suppliers is illustrated in figure 5.
600
4 588
22 225
26 698
36 000
43 529
77 393
80 272
85 000
131 544
140 500
172 166
213 000
213 500
252 000
273 000
287 338
331 205
510 120
556 879
600 000
1 035 000
1 049 178
1 332 000
1 480 000
1 490 000
0 200 000 400 000 600 000 800 000 1 000 000 1 200 000 1 400 000 1 600 000
Allianz
DnB Nord
DB PBC
Nordea
BGŻ
Invest-Bank
Getin
Dominet
BPH
Raiffeisen BP
MultiBank
Kredyt Bank
HSBC
mBank
Eurobank
ING
AIG
BZ WBK
Pekao
Millenium
Sygma
PKO BP
Citi
Lukas*
GE Money
Cetelem
Figure 5. Structure of the credit card market by suppliers in the first quarter 2009
Source: own calculations based on data from Bankier.pl.
10 Comp. B. Świecka, Bankowość elektroniczna, CeDeWu, Warszawa 2008, p. 70.11 A. Myczkowska, Zaskakująca obniżka oprocentowania, „Rzeczpospolita” 2005, nr 163, p. 4.
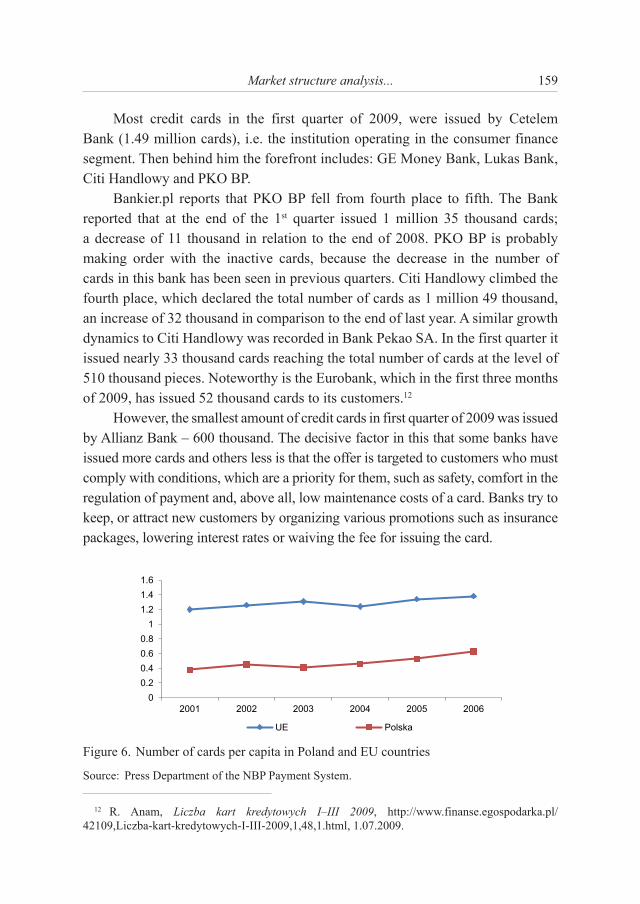
159Market structure analysis...
Most credit cards in the first quarter of 2009, were issued by Cetelem Bank (1.49 million cards), i.e. the institution operating in the consumer finance segment. Then behind him the forefront includes: GE Money Bank, Lukas Bank, Citi Handlowy and PKO BP.
Bankier.pl reports that PKO BP fell from fourth place to fifth. The Bank reported that at the end of the 1st quarter issued 1 million 35 thousand cards; a decrease of 11 thousand in relation to the end of 2008. PKO BP is probably making order with the inactive cards, because the decrease in the number of cards in this bank has been seen in previous quarters. Citi Handlowy climbed the fourth place, which declared the total number of cards as 1 million 49 thousand, an increase of 32 thousand in comparison to the end of last year. A similar growth dynamics to Citi Handlowy was recorded in Bank Pekao SA. In the first quarter it issued nearly 33 thousand cards reaching the total number of cards at the level of 510 thousand pieces. Noteworthy is the Eurobank, which in the first three months of 2009, has issued 52 thousand cards to its customers.12
However, the smallest amount of credit cards in first quarter of 2009 was issued by Allianz Bank – 600 thousand. The decisive factor in this that some banks have issued more cards and others less is that the offer is targeted to customers who must comply with conditions, which are a priority for them, such as safety, comfort in the regulation of payment and, above all, low maintenance costs of a card. Banks try to keep, or attract new customers by organizing various promotions such as insurance packages, lowering interest rates or waiving the fee for issuing the card.
0
0.2
0.4
0.6
0.8
1
1.2
1.4
1.6
2001 2002 2003 2004 2005 2006
UE Polska
Figure 6. Number of cards per capita in Poland and EU countries
Source: Press Department of the NBP Payment System.
12 R. Anam, Liczba kart kredytowych I–III 2009, http://www.finanse.egospodarka.pl/42109,Liczba-kart-kredytowych-I-III-2009,1,48,1.html, 1.07.2009.
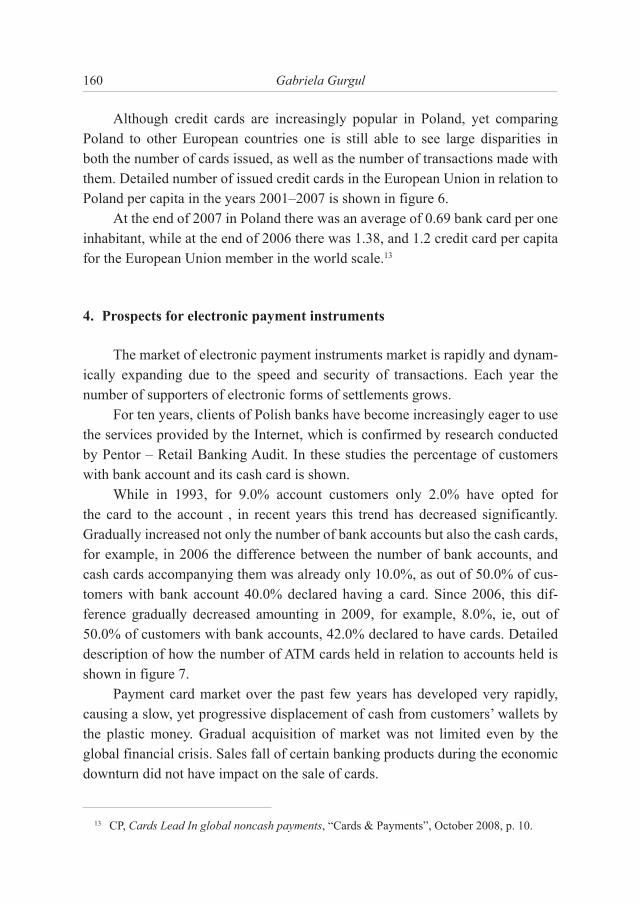
160 Gabriela Gurgul
Although credit cards are increasingly popular in Poland, yet comparing Poland to other European countries one is still able to see large disparities in both the number of cards issued, as well as the number of transactions made with them. Detailed number of issued credit cards in the European Union in relation to Poland per capita in the years 2001–2007 is shown in figure 6.
At the end of 2007 in Poland there was an average of 0.69 bank card per one inhabitant, while at the end of 2006 there was 1.38, and 1.2 credit card per capita for the European Union member in the world scale.13
4. Prospects for electronic payment instruments
The market of electronic payment instruments market is rapidly and dynam-ically expanding due to the speed and security of transactions. Each year the number of supporters of electronic forms of settlements grows.
For ten years, clients of Polish banks have become increasingly eager to use the services provided by the Internet, which is confirmed by research conducted by Pentor – Retail Banking Audit. In these studies the percentage of customers with bank account and its cash card is shown.
While in 1993, for 9.0% account customers only 2.0% have opted for
the card to the account , in recent years this trend has decreased significantly.
Gradually increased not only the number of bank accounts but also the cash cards,
for example, in 2006 the difference between the number of bank accounts, and
cash cards accompanying them was already only 10.0%, as out of 50.0% of cus-
tomers with bank account 40.0% declared having a card. Since 2006, this dif-
ference gradually decreased amounting in 2009, for example, 8.0%, ie, out of
50.0% of customers with bank accounts, 42.0% declared to have cards. Detailed
description of how the number of ATM cards held in relation to accounts held is
shown in figure 7.
Payment card market over the past few years has developed very rapidly,
causing a slow, yet progressive displacement of cash from customers’ wallets by
the plastic money. Gradual acquisition of market was not limited even by the
global financial crisis. Sales fall of certain banking products during the economic
downturn did not have impact on the sale of cards.
13 CP, Cards Lead In global noncash payments, “Cards & Payments”, October 2008, p. 10.
161Market structure analysis...
9
12
15
20
27
31
41 43
48 50 49 48 47
50 49 48 50
2 4 4 4
9
16
19
25
30
33 35 36 37
40 40 39
42
0
10
20
30
40
50
60
1993 1994 1995 1996 1997 1998 1999 2000 2001 2002 2003 2004 2005 2006 2007 2008 2009
Figure 7. Customers declared to have an account and ATM card
Source: Special Report MF Bank – Financial Horizons.
According to the data of National Bank of Poland at the end of September 2009 there were 32.5 million payment cards in circulation, and this number gradually increased since 2003 by an average of ten percent per annum.14 Having a card is in fact related to access to other banking products, which means that they are an additional advantage for customers.
Conclusions
The market of electronic payment instruments will soon reach the EU average level of credit cards saturation, but in the near term will continue to be a thriving market, particularly when it comes to credit card market, not only because of the speed and convenience of transactions, but also easy access to cash, shopping at the expense of the bank and use interest-free period, because as recent Eurostat studies have revealed, up to 54.0% of Poles declare that they live in households
that without the loan would not be able to cope with unforeseen expenses.15
The nearest future should also bring a non-contact technology dissemination,
which may entail a reduction in the average value of credit card transactions.
Yet, how long the payment card market will keep the development momentum
achieved in previous years, will largely depend on banks opening to a new segment
of customers and adapting the range of banking products to their needs.
14 Cf. www. kartybeztajemnic.pl, 31.03.2010.
15 Cf. P. Minkina, Polubiliśmy karty, “Bank” 2010, nr 2 (208), p. 40–41.

162 Gabriela Gurgul
ANALIZA STRUKTURY RYNKOWEJ
ELEKTRONICZNYCH INSTRUMENTÓW PŁATNICZYCH
W LATACH 1998–2010
Streszczenie
Na przełomie XX i XXI wieku dokonała się rewolucja na rynku środków pienięż-
nych. Społeczeństwa niemal na całym świecie realizują swoje transakcje płatnicze za
pomocą rynku elektronicznych instrumentów płatniczych, których jedną z najpopularniej-
szych form są karty płatnicze.
Karty płatnicze, podobnie jak pieniądz elektroniczny, zgodnie z ustawą są zaliczane
do elektronicznych instrumentów płatniczych oraz stanowią coraz bardziej popularną
formę rozliczeń bezgotówkowych zarówno w Polsce, jak i na świecie.
Celem artykułu jest ukazanie, jak dynamicznie zmienia się rynek elektronicznych
instrumentów płatniczych w okresie kilku lat, a także jego analiza ilościowa i zbadanie
przyszłych perspektyw rozpatrywanego zjawiska.

SCIENTIFIC JOURNAL
NR 670 SERVICE MANAGEMENT Vol. 7 2011
IZABELA KIDACKA
University of Szczecin
EVOLUTION OF FINANCING AND FINANCIAL INTERMEDIARIES FUNCTION ON SECURITIES MARKET*
1. The patterns of financial intermediation on securities market1
The securities market evolution is closely linked with financial interme-diaries function. Within the basic function of financial intermediation, which is the risk perception and transformation, the financial intermediaries facilitate the funds transfer between the securities market investors and the companies looking for capital. The funds transfer has evolved according to fig. 1 to 4. Nowadays, the most dominant forms of funds transfer, include the financial intermediary institution. These kinds of activities are called intermediate capital transfers and exercise the securities market issuing. The capital flows sequence outlines the chronology of company financing evolution and intermediary function on secu-rities market.
Today, the marginal fraction of funds is achieved from debt securities market without financial intermediaries involvement. The basic factor responsible for the direct financing vanishing was geographical limitation of market. Geographical frame constrains the number of investors with their limited financial possibilities. The other factor is informational asymmetry. It refrains the private investors, aware
* Translation to english PhD eng. Grzegorz Kidacki.1 I. Kidacka, Finanse zintegrowane. Sekurytyzacja, struktury finansowe, Difin, Warszawa
2005.

164 Izabela Kidacka
of negative selection and funds misuse risk, from being involved in investment process. The direct financing on securities market is available only for the biggest, well established corporations with the famous brand name. From investor point of view, the serious drawback of direct transfer is the lack of investment security in case of issuer default, as well as the lack of portfolio diversification.
Figure 1. Direct capital transfer
Source: own work based on E.F. Brigham, “Podstawy Zarządzania Finansami” 1997, vol. 1, p. 114.
Figure 2. The capital transfer through the investment bank
Source: own work based on E.F. Brigham, “Podstawy Zarządzania Finansami” 1997, vol. 1, p. 114.
The funds transfer with the use of investment bank has been the basic form
of financial intermediation. The investment bank key role is the underwriting
process or the acquisition of emission. The intermediation process contains the
cooperation between the bank and the issuer, regarding the issue features attractive
for the investors. The securities are usually acquired by the bank and disposed to
the market players. The marketing risk has been transferred from the issuer to the
investment bank, in exchange for the emission fee. Owing to the bank regional
facilities infrastructure, the geographical limitation has been overtaken. The infor-
mation asymmetry risk is mitigated with the investment bank reputation or rating.
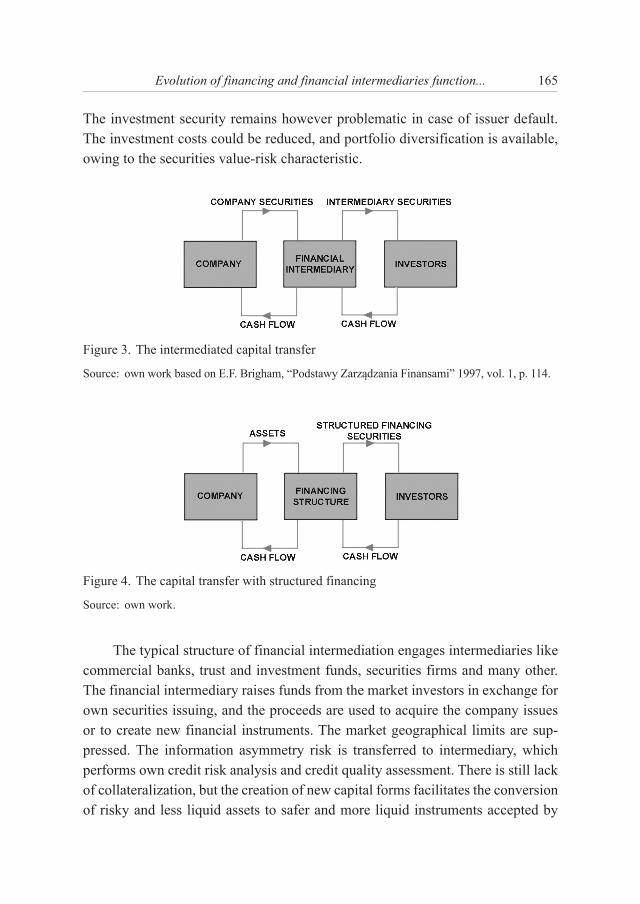
165Evolution of financing and financial intermediaries function...
The investment security remains however problematic in case of issuer default. The investment costs could be reduced, and portfolio diversification is available, owing to the securities value-risk characteristic.
Figure 3. The intermediated capital transfer
Source: own work based on E.F. Brigham, “Podstawy Zarządzania Finansami” 1997, vol. 1, p. 114.
Figure 4. The capital transfer with structured financing
Source: own work.
The typical structure of financial intermediation engages intermediaries like
commercial banks, trust and investment funds, securities firms and many other.
The financial intermediary raises funds from the market investors in exchange for
own securities issuing, and the proceeds are used to acquire the company issues
or to create new financial instruments. The market geographical limits are sup-
pressed. The information asymmetry risk is transferred to intermediary, which
performs own credit risk analysis and credit quality assessment. There is still lack
of collateralization, but the creation of new capital forms facilitates the conversion
of risky and less liquid assets to safer and more liquid instruments accepted by

166 Izabela Kidacka
investors. Thanks the scale effect and the offer of new services, the investment costs are reduced and customized. The financial intermediaries are able to diversify their offer, owing to the researches performed by the own analytical team.
The capital transfer in securitization and structured financing, present on the market since 1970s, is the most modern way of financial intermediation. Beside the features of typical financial intermediation, this form of capital transfer has introduced the collateralization and third party guaranties for issued securities payment. The financing program demands the publication of issuance rating assigned by the recognized rating agency. The rating contains the information regarding issuer ability to meet debt obligation in timely manner. From company point of view, the main advantage of structured financing is opportunity to get access to capital market, what is generally impossible for companies with lower debt rating or demands much higher financing costs. From the bank interme-diaries’ position, the main advantage is possibility of balance sheet adjustment to meet regulatory capital requirements, as well as the conversion of potentially risky and illiquid assets to the financing.
2. The assets application in financing process
Till 1970 the company with financial needs was able, theoretically, to convert assets for financing in two different ways. It could directly sell assets to debt investors; it could pledge assets as the collateral for the debt securities issuance or the bank credit (factoring). Since 70s the company can use assets as the col-lateral in securitization or structured financing – fig. 5. The direct selling demands existence of developed and liquid market. When assets are pledged for issuance or credit, the assets owner bankruptcy is the reason to default, as the effect of bank-ruptcy procedures. Both traditional methods of assets use have disadvantages, from the investors, as well as the company point of view. Direct selling demands for potential investors the evaluation of individual, different asset pool, with irregular and unstable returns. The risk of default in case of asset originator insolvency or bankruptcy refrains the potential investors from engagement in risky operations.
Securitization is the method of financing with issuance of classified secu-rities, guaranteed with proceeds from collateral. The term ”securitization” has appeared on American market in 1977 and does not have the translation to another

167Evolution of financing and financial intermediaries function...
languages. The Polish term “sekurytyzacja” was the carbon paper copy of origin English term “securitization” and was accepted in financial language in Poland.
Figure 5. The traditional assets utilization in the financing process
Source: own work.
Securitization can take two different, basic forms, depends on the cash flow characteristics. In the “pass through” structure, the intermediary acquires assets from company with proceeds from issuance of asset-backed securities – ABS.2 The securities have the characteristic of “certificates”, giving the investors title to receivables from collateral acquired by fund. The main structural feature of this securitization model is full time synchronization between receivables from assets and securities payments. This kind of structure can be applied only with regular incomes from collateral. The issued certificates are the instruments giving the investors title to all the fund assets – fig. 6.
The more complex solution is “pay – through” structure, where company transfers assets to trustee or sells them to issuing intermediary with SPV3 char-acteristic. The main function of SPV is the issuance of securities. Issuer acquires assets from the company with proceeds from the issuance. Because of lack of time synchronization between incomes from assets and the securities payments, the cash streams must be converted according to securities payments schedule. The cash inflows conversion is performed with financing structure consisting of
2 Asset Backed Securities.3 Special Purpose Vehicle.
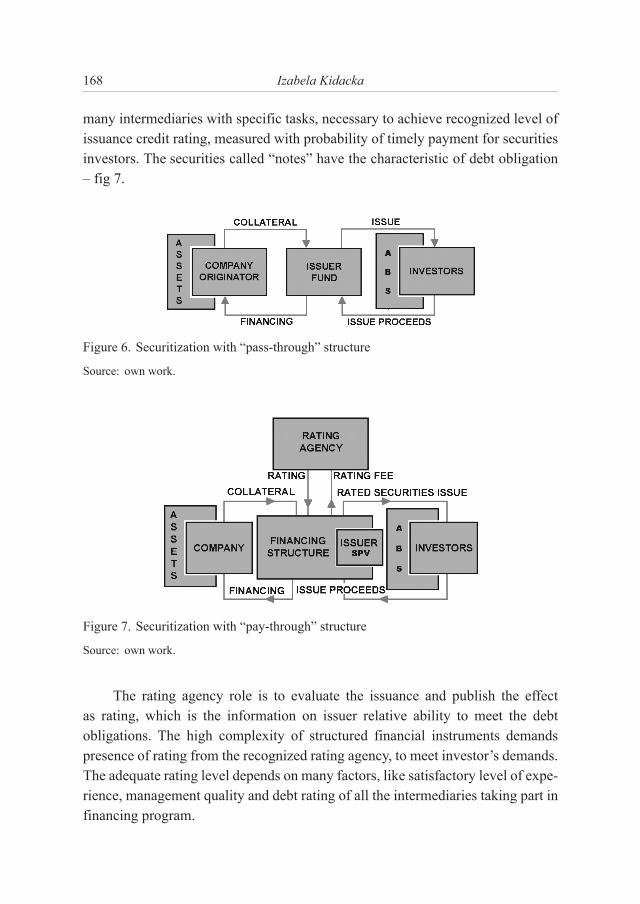
168 Izabela Kidacka
many intermediaries with specific tasks, necessary to achieve recognized level of issuance credit rating, measured with probability of timely payment for securities investors. The securities called “notes” have the characteristic of debt obligation – fig 7.
Figure 6. Securitization with “pass-through” structure
Source: own work.
Figure 7. Securitization with “pay-through” structure
Source: own work.
The rating agency role is to evaluate the issuance and publish the effect as rating, which is the information on issuer relative ability to meet the debt obligations. The high complexity of structured financial instruments demands presence of rating from the recognized rating agency, to meet investor’s demands. The adequate rating level depends on many factors, like satisfactory level of expe-rience, management quality and debt rating of all the intermediaries taking part in financing program.

169Evolution of financing and financial intermediaries function...
From investor’s point of view, securitization alleviates the disadvantages of traditional financing with utilization of assets. Securitization:
1. Transforms irregular and uncertain incomes from assets into regular pay-ment schedule.
2. Mitigates bankruptcy risk of assets originator, as the assets transfer to bankruptcy remote issuer – SPV isolates assets from bankruptcy proce-dures, or entitles investors to the all assets of fund.
3. Provides investment possibility with well-known risk profile, confirmed with credit rating, what allows for construction of investment portfolio according to the recognized standards, facilitates investment diversifica-tion and disperses the branch concentration.
3. Structured financing and structured finance
Structured financing is the process of capital gaining by means of collater-alized securities issuance, combined with an external support for mismatched cash inflows from collateral and outflows necessary to cover securities obligations, during all the market scenarios. The key difference between structured financing and guaranteed debt instruments is that in the conventional guaranteed issuance, the issuer profitability remains the basic or the most important cash source, while in structured financing the responsibility for full and timely payment of securities obligations is transferred from issuer to pool of assets or the third party.
The capital transfer in securitization and structured financing contains a few questions, important for the financial intermediation evolution:
1. The traditional bank credit was displaced with the debt securities issu-ance. The issuer was replaced with intentionally established, bankruptcy remote, special purpose company, taking the key position in the financing structure.
2. The traditional financing operation performed by the banks was split among many financial intermediaries, creating and responsible for financ-ing structure quality, measured with ability to meet debt obligations and management quality.
3. The traditional bank intermediation risk regarding credit creation and repayment was transferred from financial intermediaries to securities mar-ket investors.
170 Izabela Kidacka
4. The subjective opinions regarding debtor repayment ability were displaced with professional, objective credit ratings, which play the key role in the market self regulating actions.
4. The debt market challenges in developing economies
The diversification is the key feature of the global debt securities markets. The utilization of diversification depends mainly on the information regarding issuer’s ability to meet debt obligations. The most obvious effect of the debt markets development is more and more complex decision taking process. It demands the enlarging of geographic and cultural investment horizon, the identification of new political and low environments, new accounting standards, the acceptance of different forms and level of market transparency. If the potential risk refrains investors from engagement on new markets, the issuers are not able to find access to diversified sources of financing.
With growing complexity of market, arises the problem of market volatility forecasting. Similar to any other financial sector players, the financial interme-diaries are placed under pressure from competition, and high service standards. With classical bonds investment, the traditional focus was on acquisition and holding the securities to the due date. Presently, the investment portfolio managers are engaged with optimization of investment value on general income and rein-vestment basis, as well as evaluation of the current market value of investment. In effect, the values of any securities hold in the portfolio have to be adjusted according to the current market value and the issuer ability to meet debt obli-gations, what has direct influence on secondary market value.
The debt securities market development has brought the significant changes in relations between the investors and issuers. In the past, the investors could expect the government support or cooperation with the banks extending the loans for the company under financial stress. At present, these kinds of buffers were strongly reduced. The sovereigns became less inclined to intervention in case of private companies insolvency or bankruptcy. The only exceptions are the com-panies important for public interest. The investors of local and global market are too numerous and dissipated to be able to negotiate with issuers in case of defaults. The direct contact with strategic investors belongs to the past, and was replaced with contracts or legal agreements, designed intentionally for obligation regarding
171Evolution of financing and financial intermediaries function...
specific securities issuance. With lack of direct communication with investors, the companies in capital demand are more likely to break off obligations.
The effect of privatization trends was shrinking of government securities offer in the relation to privatized companies issues, combined with increased default risk. Many countries, like Poland, are under different stages of privatization programs. The new privatized companies decided generally to issue the debt secu-rities as the way of business financing, same like any other private enterprises. The new elements of risk have appeared along with the privatization and transfer of economy sectors to free market. As the private sector default risk evaluation is more difficult then in case of government owned enterprises, the risk evaluation became more and more complex. The consolidation of large, corporate structures is the new form of risk present on the debt securities market. The consolidation is seen as the positive factor for the company long-term ability to fulfill debt obli-gations, and simultaneously the negative for the short-term ability. The more and more complex corporate structures cause the risk of uncertainty of mutual support between parent and subsidiary company.
Despite the collateralization, the structured financing securities are not risk free. The risk profile depends on the political and economical environment. The domestic market investor’s distrust arises from the lack of experience and unique characteristic of structured financing securities that do not have the standard profiles of corporate bonds. The foreign investors have usually a lot of experience in securitization programs, but their knowledge about new markets is limited. The developing countries have usually the mature share markets, but their debt markets are in different stages of development. These debt markets consist generally of short-term loans, because the inflation volatility refrains investors from long-term engagement. The investors are more and more accustomed to the presence of the reliable and experienced rating agencies that publish the opinions necessary to evaluate the securities risk profile. The institutional investors restricted with regulatory investment standards use the credit ratings for risk eval-uation, what allows for cutting down the costs of own analysis. The credit ratings allow the issuers for enlarging the loan base through the access to domestic and international capital markets.

172 Izabela Kidacka
Figure 8. The self-regulating rating function4
Source: own work.
The ratings permit the borrower to gain long-term debt, as the rating opinions are better measure of credit risk. The ratings for securitization programs are usually the compulsory standard, and due to the complex structure of securities these are difficult for the marketing without ratings. The evaluation of risk profile elements, like the analysis of the basic collateral, the cash flows, the legal structure, the third party support, and the sovereign risk, is specially difficult, if taken under consideration that the most valuable information is classified. The ratings of securitization and structured financing published for the first time in the USA at 80s, spread through the markets of West Europe, Canada, Asia, Australia, Latin America and Central Europe. The data gathered since that time allowed for com-parisons between structured and corporate finance ratings. The statistics have shown, that structured financing programs ratings are much more stable in dif-ferent time horizons than traditional corporate bonds, and rating changes have directional memory, what facilitates the prediction of market changes.
The history of securitization and structured financing includes a few specific points important for the present picture of these financing forms. The developing economies, like Poland, are just at the beginning of their way – fig. 9. The utili-zation of developed economies experience allows for intensification and accel-eration of changes.
4 I. Kidacka, Finanse zintegrowane. Credit-rating a ryzyko, Wydawnictwo Naukowe Uniwersy-tetu Szczecińskiego, Szczecin 2006.

173Evolution of financing and financial intermediaries function...
Figure 9. The road map of securitization and structured financing
Source: own work.
The securitization of trade receivables was introduced on polish market in 1999, just three years after the first polish credit rating agency5. In 2004 the rules for securitization funds were established. The rules have been modified many times so far. We can consider, that the polish regulation and legislation authorities have appreciated the value and the prospects of modern financing techniques and independent credit rating agency role in developing economy.
EWOLUCJA SPOSOBU FINANSOWANIA I ROLI POŚREDNIKA
NA RYNKU PAPIERÓW DŁUŻNYCH
Streszczenie
Procesy obserwowane wcześniej w gospodarkach krajów rozwiniętych wkroczyły
na rynki krajów rozwijających się. Zmiany warunków makroekonomicznych, rozluźnie-
5 CERA SA was established as the effect of mutual project of Polish Banks Union and US AID
(Agency for International Development), since 2001 Fitch-Polska, the subsidiary of Fitch Ratings.
174 Izabela Kidacka
nie więzów regulacyjnych, przekazanie tradycyjnych zadań suwerena w prywatne ręce
oraz gwałtowny rozwój technologii informacji spowodowały dezintermediację oszczęd-
ności inwestorów i powstanie nowych pośredników finansowych. Strukturalną tenden-
cją rozwiniętych gospodarek jest zastępowanie tradycyjnych aktywów bankowych przez
aktywa sekurytyzowane na publicznych rynkach papierów dłużnych. Nie oznacza to jed-
nak wygaśnięcia roli banków, a jedynie ewolucję tradycyjnej roli systemu bankowego sto-
jącego przed koniecznością zmiany koncesji i poszukiwania nowych form działalności.
Wykorzystując mocne podstawy finansowe, ekspansję publicznych rynków papie-
rów dłużnych, technikę sekurytyzacji aktywów i możliwości przetwarzania informacji,
pośrednicy bankowi wprowadzili nowe strategie finansowania, zastępujące tradycyjny
kredyt bankowy, emisją instrumentów na rynku papierów dłużnych. Pozbywając się
tradycyjnej roli dostawy kredytu i ponoszenia ryzyka jego zwrotu, pośrednicy bankowi
zajęli się organizacją, sponsorowaniem i administracją struktur przepływów pieniężnych
dopasowanych do indywidualnych potrzeb finansowych klientów lub konieczności włas-
nego rozwoju. Podstawowym zajęciem wszystkich, nie tylko bankowych, pośredników
finansowych stała się transformacja i zarządzanie ryzykiem.
Warunkiem powodzenia nowych strategii finansowania jest zainteresowanie ze
strony inwestorów instytucjonalnych, uprzedzonych negatywnymi doświadczeniami
rynków obligacji wysokiego dochodu oraz ograniczonych przepisami regulacyjnymi lub
własnymi standardami jakości inwestycji. Standardy inwestowania bazują na ocenach
klasyfikacji kredytowej publikowanych przez niezależne agencje ratingowe. Spełnienie
wymogów inwestorów wymaga oparcia nowych strategii finansowania na klasyfikacji
prawdopodobieństwa naruszenia spłat papierów dłużnych. Ewolucja formy finansowa-
nia wykorzystującej emisję papierów dłużnych – od najprostszych emisji bezpośrednich
poprzez wykorzystanie pośrednika, aż do struktur wykorzystujących technikę sekuryty-
zacji i finansowanie zintegrowane – wymaga przygotowania środowiska regulacyjno-
-prawnego oraz zaplecza technologicznego. Specyficzny charakter najnowszych form
finansowania spowodował powstanie nowego sektora finansów określanego w oryginale
„structured finance”, który, jak dotąd, nie doczekał się oficjalnego odpowiednika w języku
polskim6 w publikacjach rynkowych czy naukowych.
6 The polish term „finansowanie zintegrowane” has been introduced in author dissertation at
2004.

Chapter IV
MARKETING MANAGEMENT


SCIENTIFIC JOURNAL
NR 670 SERVICE MANAGEMENT Vol. 7 2011
MAŁGORZATA GRZEGORCZYK
Univesity of Łodz
GRZEGORZ MAZUREK
Kozminski University
CUSTOMER ENGAGEMENT IN ON-LINE SERVICES AND COMPANIES’ MARKETING RESPONSES TOWARDS
THE CONCEPT
Introduction
“The Internet is believed to change not only service delivery channels, but also the level of customer participation in the service delivery process.”1 The In-ternet shifts power from the supplier to the buyer2 and brings significant change in customer interaction and behaviour. This paper seeks to gain some insight into customer’s increased role in Internet services by:
‒ analyzing current trends in virtual environment implications for market-
ing,
‒ proposing theoretical models concerning customer engagement on-line,
‒ presenting marketing responses towards the abovementioned concept,
exemplified by the strategies of “beta” version, brand support, service
support and e-migration.
1 A.J. Broderick, S. Vachirapornpuk, Service quality in Internet banking: the importance of cus-
tomer role, “Marketing Intelligence & Planning” 2002, vol. 20/6, pp. 327–335.
2 E. Daniel, Provision of electronic banking in the UK and Ireland, “International Journal of
Bank Marketing”, 1999, vol. 17, no. 5, pp. 211–232.

178 Małgorzata Grzegorczyk, Grzegorz Mazurek
1. Virtual environment – implications for marketing
In contrast with traditional service delivery format, the Internet creates specific power shift from sellers to buyers. Individuals are more demanding than ever because they are well informed, just a click away from a plethora of competitors and can easily communicate with each other. In virtual environment buyers attention is the scarce commodity and customer relationship capital is valued asset.3 On the other hand, the specificity of virtual environment creates incremental changes not only on the marketplace (e.g. price transparency, infor-mation asymmetry limitation, lower entry barriers, etc), but also in customers’ overall role. The abovementioned properties of virtual environment and their implications for marketing and customers’ roles on markets presents the following table.
Table 1. Selected properties of virtual environment and their implications for marketing
Property Marketing implications
Digital form Information, services and communication transferred to digital form can be stored, sent, utilized and duplicated with no cost
Mediating technology Relationships building and data exchange between consumers can be formed regardless of geographic location or time constrains
Network externalities Consumers can disseminate their opinions and brand attitudes with no limits and costs
Time moderator Consumers have higher expectations about communication with ser-vice providers and faster task solving processes within the company
Information equalizerCompanies implement mass customization applications whereas customers have better access to product and price information (more transparent market)
Market deconstructionMany distribution channel functions are performed by new intermedi-aries, also clients take the roles of middlemen in the process of product distribution
Information overloadThe access to information is no longer perceived by customers as op-portunity. The bias is put on the importance of information quality and value along with skills for effective decision making on-line
Source: own research.
The features of virtual environment show that nowadays customers face new challenges and they have to adjust their behavior to e-market conditions. Among
3 J. Strauss, A. El-Ansary, R. Frost, E-marketing, Pearson Prentice-Hall, New Jersey 2006, p. 11.
179Customer engagement in on-line services...
the most important issues devoted to effective and efficient usage of virtual envi-ronment by customers we have:4
‒ gaining information literacy on-line (know-how to use information on-
line),
‒ shift towards on-line informational activities providing bilateral (consum-
ers-companies) benefits,
‒ creating networks to increase the bargaining power of the demand side
(buyers).
What seems crucial to underline is that customers are no longer perceived
solely as purchasers, instead, they play various additional roles – technical sup-
porters, product developers, brand ambassadors, etc. These roles have been
accepted by marketers and utilized by means of various marketing and communi-
cation strategies in order to get added value from customers in services offering
and their further development. Several marketing strategies of taking advantage
of consumers activity on-line are presented in the final part of the paper. However,
what is a prerequisite for customers’ active role in the process of transaction and
relationship creation, is customer satisfaction.
2. Customer on-line satisfaction as prerequisite for playing active roles on the e-market
When it comes to on-line service, it is customer’s responsibility to initiate
the service by logging in, making an enquiry, interact with the service setting. The
customer’s own participation and management of the service are critical elements
in their evaluation of satisfaction. In looking at how customers perceive and relate
to online services, it is needed to consider how customers perceive and relate
to the virtual environment itself. Web sites and other interactive tools evolve to
become increasingly dynamic experiences that let people interact in real time and
fulfil more and more expectations and roles.
Former studies found that there is a positive and significant relationship
between customers’ perceptions of service quality and behavioral intentions,
4 S.U. Kucuk, Consumer empowerment model: from unspeakable to undeniable, “Direct Mar-
keting: An International Journal” 2009, vol. 3 (4).
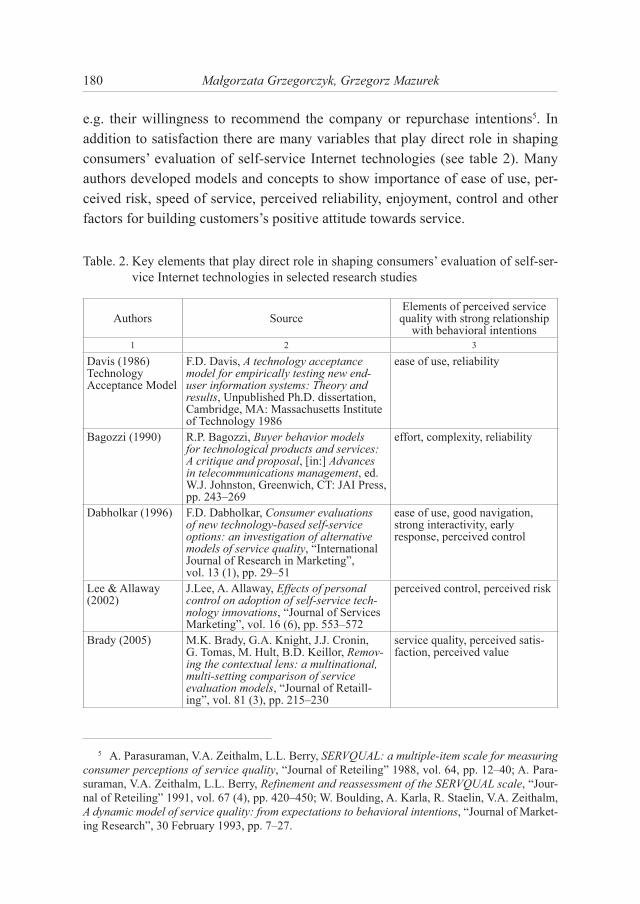
180 Małgorzata Grzegorczyk, Grzegorz Mazurek
e.g. their willingness to recommend the company or repurchase intentions5. In addition to satisfaction there are many variables that play direct role in shaping consumers’ evaluation of self-service Internet technologies (see table 2). Many authors developed models and concepts to show importance of ease of use, per-ceived risk, speed of service, perceived reliability, enjoyment, control and other factors for building customers’s positive attitude towards service.
Table. 2. Key elements that play direct role in shaping consumers’ evaluation of self-ser-vice Internet technologies in selected research studies
Authors SourceElements of perceived service
quality with strong relationship with behavioral intentions
1 2 3
Davis (1986)Technology Acceptance Model
F.D. Davis, A technology acceptance model for empirically testing new end-user information systems: Theory and results, Unpublished Ph.D. dissertation, Cambridge, MA: Massachusetts Institute of Technology 1986
ease of use, reliability
Bagozzi (1990) R.P. Bagozzi, Buyer behavior models for technological products and services: A critique and proposal, [in:] Advances in telecommunications management, ed. W.J. Johnston, Greenwich, CT: JAI Press, pp. 243–269
effort, complexity, reliability
Dabholkar (1996) F.D. Dabholkar, Consumer evaluations of new technology-based self-service options: an investigation of alternative models of service quality, “International Journal of Research in Marketing”, vol. 13 (1), pp. 29–51
ease of use, good navigation, strong interactivity, early response, perceived control
Lee & Allaway (2002)
J.Lee, A. Allaway, Effects of personal control on adoption of self-service tech-nology innovations, “Journal of Services Marketing”, vol. 16 (6), pp. 553–572
perceived control, perceived risk
Brady (2005) M.K. Brady, G.A. Knight, J.J. Cronin, G. Tomas, M. Hult, B.D. Keillor, Remov-ing the contextual lens: a multinational, multi-setting comparison of service evaluation models, “Journal of Retaill-ing”, vol. 81 (3), pp. 215–230
service quality, perceived satis-faction, perceived value
5 A. Parasuraman, V.A. Zeithalm, L.L. Berry, SERVQUAL: a multiple-item scale for measuring
consumer perceptions of service quality, “Journal of Reteiling” 1988, vol. 64, pp. 12–40; A. Para-
suraman, V.A. Zeithalm, L.L. Berry, Refinement and reassessment of the SERVQUAL scale, “Jour-
nal of Reteiling” 1991, vol. 67 (4), pp. 420–450; W. Boulding, A. Karla, R. Staelin, V.A. Zeithalm,
A dynamic model of service quality: from expectations to behavioral intentions, “Journal of Market-
ing Research”, 30 February 1993, pp. 7–27.
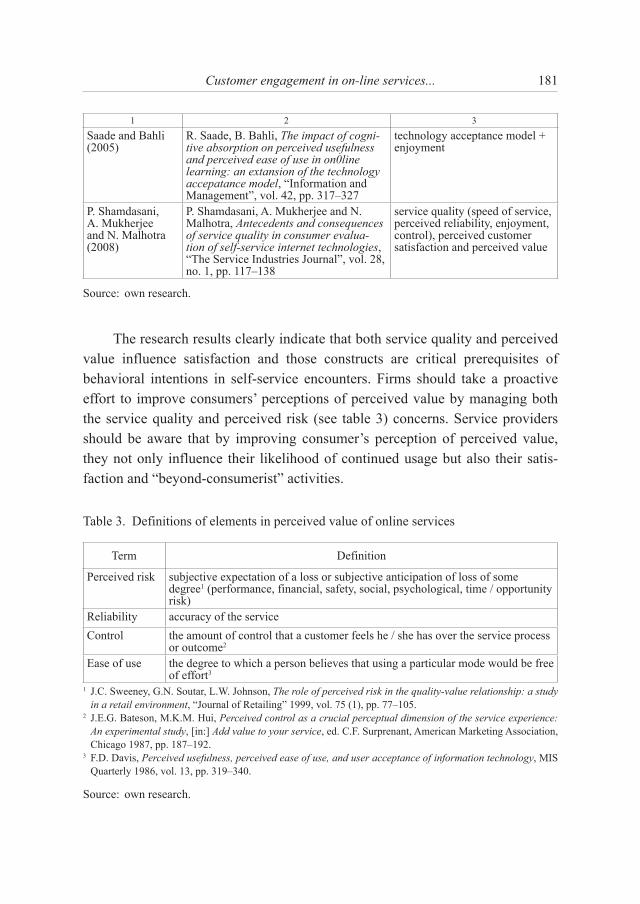
181Customer engagement in on-line services...
1 2 3
Saade and Bahli (2005)
R. Saade, B. Bahli, The impact of cogni-tive absorption on perceived usefulness and perceived ease of use in on0line learning: an extansion of the technology accepatance model, “Information and Management”, vol. 42, pp. 317–327
technology acceptance model + enjoyment
P. Shamdasani, A. Mukherjee and N. Malhotra (2008)
P. Shamdasani, A. Mukherjee and N. Malhotra, Antecedents and consequences of service quality in consumer evalua-tion of self-service internet technologies, “The Service Industries Journal”, vol. 28, no. 1, pp. 117–138
service quality (speed of service, perceived reliability, enjoyment, control), perceived customer satisfaction and perceived value
Source: own research.
The research results clearly indicate that both service quality and perceived value influence satisfaction and those constructs are critical prerequisites of behavioral intentions in self-service encounters. Firms should take a proactive effort to improve consumers’ perceptions of perceived value by managing both the service quality and perceived risk (see table 3) concerns. Service providers should be aware that by improving consumer’s perception of perceived value, they not only influence their likelihood of continued usage but also their satis-faction and “beyond-consumerist” activities.
Table 3. Definitions of elements in perceived value of online services
Term Definition
Perceived risk subjective expectation of a loss or subjective anticipation of loss of some degree1 (performance, financial, safety, social, psychological, time / opportunity risk)
Reliability accuracy of the service
Control the amount of control that a customer feels he / she has over the service process or outcome2
Ease of use the degree to which a person believes that using a particular mode would be free of effort3
1 J.C. Sweeney, G.N. Soutar, L.W. Johnson, The role of perceived risk in the quality-value relationship: a study
in a retail environment, “Journal of Retailing” 1999, vol. 75 (1), pp. 77–105.2 J.E.G. Bateson, M.K.M. Hui, Perceived control as a crucial perceptual dimension of the service experience:
An experimental study, [in:] Add value to your service, ed. C.F. Surprenant, American Marketing Association, Chicago 1987, pp. 187–192.
3 F.D. Davis, Perceived usefulness, perceived ease of use, and user acceptance of information technology, MIS Quarterly 1986, vol. 13, pp. 319–340.
Source: own research.
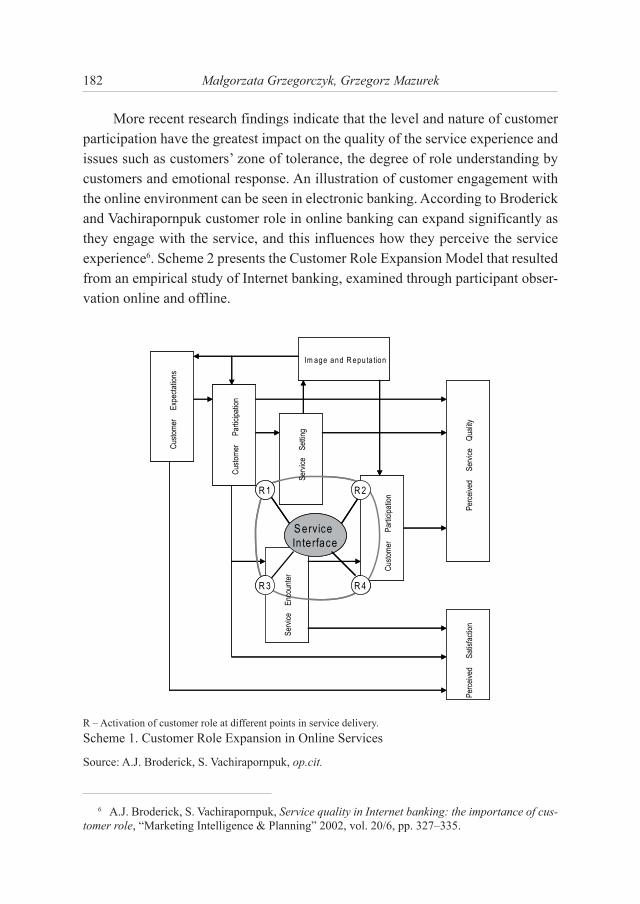
182 Małgorzata Grzegorczyk, Grzegorz Mazurek
More recent research findings indicate that the level and nature of customer participation have the greatest impact on the quality of the service experience and issues such as customers’ zone of tolerance, the degree of role understanding by customers and emotional response. An illustration of customer engagement with the online environment can be seen in electronic banking. According to Broderick and Vachirapornpuk customer role in online banking can expand significantly as they engage with the service, and this influences how they perceive the service experience6. Scheme 2 presents the Customer Role Expansion Model that resulted from an empirical study of Internet banking, examined through participant obser-vation online and offline.
S ervice
Interface
R 2
R 4R 3
R 1
Cus
tom
erP
artic
ipat
ion
Cus
tom
erE
xpec
tatio
ns
Im age and R eputa tion
Ser
vice
Set
ting
Ser
vice
Enc
ount
er
Cus
tom
erP
artic
ipat
ion
Per
ceiv
edS
ervi
ceQ
ualit
yP
erce
ived
Sat
isfa
ctio
n
S ervice
Interface
R 2
R 4R 3
R 1
Cus
tom
erP
artic
ipat
ion
Cus
tom
erE
xpec
tatio
ns
Im age and R eputa tion
Ser
vice
Set
ting
Ser
vice
Enc
ount
er
Cus
tom
erP
artic
ipat
ion
Per
ceiv
edS
ervi
ceQ
ualit
yP
erce
ived
Sat
isfa
ctio
n
R – Activation of customer role at different points in service delivery.
Scheme 1. Customer Role Expansion in Online Services
Source: A.J. Broderick, S. Vachirapornpuk, op.cit.
6 A.J. Broderick, S. Vachirapornpuk, Service quality in Internet banking: the importance of cus-
tomer role, “Marketing Intelligence & Planning” 2002, vol. 20/6, pp. 327–335.

183Customer engagement in on-line services...
For the service organization, the Interface (represented as a sphere in the centre of scheme 1) is the interlinking service processes which manage the acti-vation points for different customer scripts and makes sense of the enquiries, the follow-up calls, the e-mails, etc. “R”, stands for activation of customer role at different points in service delivery. It may include: activating the service setting (logging into the Web site), trying to contact service personnel, reporting faults or problems to staff at a call centre while being on-line, requesting follow-up backstage service outcomes, confirming a completed service transaction.
Elements having the most immediate impact on service evaluation were: cues in the service setting, key events in the service encounters and level of customer participation. When problems occur, Internet users’ responses are most frequently interventional and proactive. Some interventions may involve com-plaints or expressing negative comments, which reflect perceived poor quality. As customers work harder and become more active in seeking solution, they become more critical of the total service experience and less tolerant of the poor interface management. In Internet banking services, actions that customers have to take to initiate or re-initiate the service or intervene in the service process are likely to cause poor perceived service quality. Findings show that ease of use, good navigation, strong interactivity and early response to service actions are very important for gaining satisfaction. However, the level and nature of customer par-ticipation had the greatest impact on the expected and perceived service quality. Implications for the management of Internet banking services arise in two areas: first, within the service interface and second, with the management of increased customer role. What the increased customer role highlights is not confined only to Internet banking services but is also applicable to the management of other Internet services.
3. Consumer engagement – usage of the phenomenon in on-line marketing and communication strategies
When considering the influence of virtual environment on consumers, the concept of demand-side engagement should be taken into consideration7. The customer expansion in on-line services has tremendous impact not only on
7 Por. L. Harris, A. Rae, Social networks: the future of marketing for small business, “Journal of Business Strategy” 2009, vol. 30 (5).
184 Małgorzata Grzegorczyk, Grzegorz Mazurek
the potential customer position on the market (power shift towards demand side). The current growing satisfaction of customers having even greater impact on the company’s position is being utilized by marketers who take advantage of loyal and active customers. Those marketers’ responses on the phenomenon of customer engagement are being exemplified by several strategies in which the company’s aims and goals are performed and reached owing to the activity of customers on-line. Among those strategies there are: “beta” version strategy, brand support strategy, service support strategy and last but not least consumer e-migration strategy.
3.1. “Beta version” strategy
Strategy of “beta” version fully exploits the marketing possibilities of current Web 2.0 concept which highlights the increasing role of customer in, for instance, service development. The core concept of the strategy is in the way of communicating with consumers. Proposed services are being communicated as “not finished” or “ready for improvements”. Customers are prepared then, that the service is not perfectly tailored and they have a chance to give valuable feedback to service provider on the final version of the service. Along with such commu-nication, marketers introduce for customers additional incentives like contests, member gets member promotions, quizzes, bonuses for the most valuable ideas.8 What seems crucial here is that service in its basic version is not tailored on purpose in order to try to engage the customers and receive new ideas actually with no cost.
3.2. Brand support strategy
The concept of customer role extension on the brand ambassador has been known in marketing for a long time. What seems new in virtual environment is the diversity of activities an ambassador can fulfill and the scope of benefits which can be obtained. The most popular ways of fulfilling the roles of brand ambassadors on-line is amplifying – an ambassador is responsible for underlining benefits of the services and depreciating vices published by other consumers or brand opponents. Brand supporters can also gain direct profits by implementing on their community
8 Por. M. Levy, WEB 2.0 implications on knowledge management, “Journal of Knowledge Man-agement” 2009, vol. 13, issue 1.

185Customer engagement in on-line services...
profiles or web sites the affiliate marketing applications. It gives them a chance to obtain commission from the supported brand if visitor of ambassadors’ web site will be convinced towards the brand and afterwards would visit the brand web site and conduct there some predefined action.
3.3. Service support strategy
Similar strategy to the mentioned “Brand support” is the Service support strategy. Active and satisfied customers take the role of technical support staff, specially when the on-line service is complicated (complex decision making). Those customers take over the role of professional advisors, salesmen, information brokers or business experts, build their position on-line not only on focusing on one particular service but more on the specificity of a given service in general. Such consumers play those roles using blogs and vortals which are more knowledge than brand oriented.
3.4. Consumer e-migration strategy
Despite of the fact that digital service provision seems to be favorable for many customers, it is noteworthy that companies, for instance e-banks, insurance companies, mobile operators shift towards the e-paradigm also due to rational cost cutting. Such migration towards virtual environment can harm relationships with customers who prefer the face-to-face interactions. Such customers, reluctant towards e-service are in a way forced to conduct their operations on-line firstly due to thoroughly set pricing strategy (which discourage customers from having traditional interactions) and secondly, due to simultaneously highlighted benefits of on-line service. For such customers additional product/service benefits are proposed, which make “the Laggards” satisfied with the final outcome even if the critical “migration moment” seemed for them to be unfavorable.
Conclusions
Recent research suggests that customer participation operates not just in ini-tiating the online service experience, but also acts as a filter to perceived service quality and value. This paper demonstrates a need for online service providers to consider their service as a set of product elements that are part of networked
186 Małgorzata Grzegorczyk, Grzegorz Mazurek
offering. It is important to look not only at the service interface but also increased customer role in virtual environment. “Beta” version strategy, brand support strategy, service support strategy and consumer e-migration strategy exemplify possibilities of exploring the phenomenon of e-customer increased role.
WZROST ZAANGAŻOWANIA KLIENTA W USŁUGACH ON-LINE
– IMPLIKACJE DLA MARKETINGU
Streszczenie
Specyfika wirtualnego środowiska, wyrażona m.in. przez niwelowanie asymetrii
informacyjnych, zwiększanie transparentności rynków czy rosnącą siłę przetargową
nabywców, powoduje, że spojrzenie usługodawców na klienta musi być poddane głębo-
kiej weryfikacji. W wirtualnym środowisku, konsument może odgrywać wiele dodatko-
wych ról, np.: wsparcia technicznego dla innych potencjalnych nabywców, ambasadora
i orędownika marki czy członka zespołu rozwoju produktu. Artykuł zgłębia temat zwięk-
szonego zaangażowania i różnorodności ról pełnionych przez klienta usług internetowych
poprzez: analizę wpływu otoczenia wirtualnego na działania marketingowe, odwołanie się
do modeli teoretycznych potwierdzających wpływ zaangażowania klienta na oczekiwaną
i postrzeganą jakość e-usługi, wskazanie strategii marketingowych będących odpowiedzią
na większe zaangażowanie i różnorodność ról pełnionych przez e-klienta.

SCIENTIFIC JOURNAL
NR 670 SERVICE MANAGEMENT Vol. 7 2011
IZABELA SOWA
University of Economics in Katowice
SEGMENTATION ON THE SERVICE MARKET AS AN EXPRESSION OF DIFFERENTIATION
OF POLISH HOUSEHOLDS
Introduction
Decisions regarding consumption of services are a bit more complex than those regarding material goods. This complexity comes from the fact that services are not of material nature, therefore, given services cannot be compared with each other. Such a situation increases a purchase risk, especially the functional one. Apart from that many services are of higher-order products in character than their substitute goods, which increases social and psychological risk. In turn, lack of possibilities to compare different options, uniqueness of services allow for drawing into own experience as well as non-formal information, and these require deeper involvement of consumers in the preparation phase of a purchase. These facts cause that service purchasers attach greater importance to search for information and its verification, and therefore service purchases are more rational than purchases of material goods.
Demographic changes, economic and social factors are major determinants of service sector development. According to Allan Fisher’s division of an economy into three sectors, as further stages of economic and social development are reached, the share of food processing sector is getting relatively smaller and smaller at the expense of the second sector, industrial goods manufacturing. Within
188 Izabela Sowa
time the share of this sector will relatively get smaller, and the share of the service sector will increase, right up to reaching a dominant position.1 The economic development of the world has proved that evolution from an economy based on agriculture, through the one based on production and manufacturing to a service sphere is a natural way of advancement in developed countries and proves of improvement in a standard of living, and the share of expenditure on services is one of the prerequisites allowing to conclude on the level of development of a society.
The economic crisis, that has been prevalent from the second half of the year 2008, has probably restrained, or even reversed the phenomenon of service sphere contribution to the economy. The answer to a question, whether this is the case was to be given by a questionnaire survey conducted by the Department of Consumer Research at the University of Economics in Katowice in May 2010. The results of the conducted research are presented in this study. Its aim is to determine to what extent the economic crisis modified consumer behaviour on the service market, what are the determinants and directions of these changes. The research focused on five types of services: outpatient services, recreational and cultural services, group tourism, restaurants and hotels, hairdressing salons and personal grooming establishments.
In this paper an assumption was taken that the economic crisis made con-sumers to decide to give up on some services and contributed to behaviour that was to decrease the expenditure on services, and accordingly the degree of changes in consumer behaviour depends, first of all, on the economic situation of households.
1. The servicisation process in Polish economy
The second half of the nineties and the beginning of the 21st century is the period of increase in the consumption of services. This fact shows that the con-sumption of Polish society entered the phase of servicisation.2 That, in turn, can be proven by the macroeconomic analysis of national accounts (GDP), as well as by
1 C. Bywalec, Konsumpcja w teorii i praktyce gospodarowania, Wydawnictwo Naukowe PWN, Warszawa 2007, p. 135.
2 Ibidem, p. 193; C. Bywalec, Wzrost konsumpcji usług, czyli proces serwicyzacji konsumpcji
w Polsce, „Wiadomości Statystyczne” 2003, no. 2.
189Segmentation on the service market...
the analysis of a spending structure of households conducted on the basis of data from Household Budget Surveys.3 The macroeconomic perspective, which allows to evaluate the share of services purchased and obtained free of charge, points at progressive, constant growth of service consumption,4 which is getting to the level of 50%. Exceeding this level would mean, that Poland could be regarded as
a service society.
The analysis of households’ expenditure on services, which are the subject
of interest of this study, shows that the expenditure on these groups of services
has not decreased despite the emerging crisis. The smallest growth dynamics (just
104%) of increase in the share of expenditure displayed outpatient services in
the years 2006–2009. Besides small decrease in the share of expenditure on res-
taurants and hotels in the year 2007, the other services recorded a rise in the share
of expenditure in the overall expenditure. The biggest dynamics of growth reached
the expenditure on tourism (132%) in the year 2009 in comparison to the year
2006, but in the year 2009, when the effects of crisis had already been visible, this
increase of share of expenditure in comparison to the previous year amounted to
3% only. The high dynamics of share of expenditure in comparison to the previous
year was recorded on the markets of recreational and cultural services (109%) as
well as restaurants and hotels (107%) in the year 2009.
2. Consumers’ reactions to the economic crisis
Despite the fact that the economic crisis has not caused significant changes on
the service market it remains interesting whether consumers themselves perceive
changes in the economy and whether these changes bear any influence on their
service purchasing decisions. The conducted questionnaire surveys,5 that were to
recognize purchasers’ behaviour on the market showed that the respondents have
an optimistic outlook on the economic situation of the country: there are more
people who notice the improvement of the economic situation in our country than
those who notice its worsening. At the same time people who see the after-effects
3 More on this topic: Z. Skrzypczak, Serwicyzacja konsumpcji a zmiany wydatków na usługi
medyczne w Polsce, „Handel Wewnętrzny” 2009, no. 1.
4 Ibidem.
5 The research was conducted in May 2010 on a sample of 268 adult residents of the Silesian
Voivodeship at the age above 18. The detailed data are available at the Department of Consumer
Research at the University of Economics in Katowice.

190 Izabela Sowa
of the crisis do not run into radical conclusions: only 3.6% of respondents state
that the situation “has worsened significantly,” and over 20.0% respondents state
that the situation “has rather worsened.”
41.8 40.7
16.4
34.3
43.3
20.9 16.8
55.6
26.5
none insignificant very significant
for own household for relatives /friends for whole society
Figure 1. Visible signs of crisis [%]
Source: own elaboration.
The noticeable signs of crisis were not significant for the researched people’s
households. As far as 41.0% of respondents state that the changes which had taken
place did not affect their households, and every third respondent does not see such
changes among the households of their friends and relatives, but only 17.0% do
not notice such changes in the whole economy. Significant changes have occurred
in the entire economy according to every fourth researched person, in the friendly
households they have been noticed by every fifth respondent, and 16.4% state that
such changes have taken place in their own homes. The respondents, therefore,
are aware of the crisis, but neither does it concern them directly nor their friends
and acquaintances. The noticeable results of the crisis in the whole economy are
not regarded as significant.
Despite the above facts nearly half of the respondents state that, due to the
crisis, the financial situation in their families has changed, but one third of the
researched believe that the situation has got worse. The improvement of the sit-
uation is seen by every fourth researched person. The single biggest effect of the
crisis seems to be the increase in uncertainty: over half of the researched admit that
currently they experience greater uncertainty with regard to the financial situation of
their families than before the crisis, 42.0% of the researched are more often afraid of
a loss of a job, and 40.0% are aware of the fact that nothing can be planned.
191Segmentation on the service market...
This uncertainty has some influence over consumers’ habits regarding purchase of services: every third researched admit to some habit changes, and 46% state that their ways of purchasing have not changed at all.6 The propensity
for modifying the consumers’ behaviour regarding services is significantly cor-
related with the level and stability of income: the lower and less stable the income,
the more frequent changes to purchasing habits are. More crisis resistant occurred
food and consumer durables purchases: only 27% state that they have changed
the patterns concerning food and consumer durables purchases. This situation can
prove that services are of higher order in character and that is why they are more
vulnerable to the changing situation of a household.
The habit changes caused by the crisis are two-fold: first of all consumers
limit the use of some services (they rarely visit restaurants or a beautician or use
the services of travel agencies, etc.), secondly they try to lower the cost connected
with service purchases e.g. they order less in restaurants, look for better value
offers from travel agents, trim their holiday. Almost half of respondents state that
the frequency of using services as well as attempts to decrease the cost of living
are almost the same. No more than 30% of Poles use services more frequently:
more often they go on a privately organised holiday (30% of indications) recrea-
tional-sport services (30%), outpatient services (30%). About 40% of Poles state
that they more frequently visit pubs and restaurants. The catering establishments are
the most vulnerable to decreasing of the number of customers: 7% of the researched
state that they have limited the number of visits in restaurants, 6% that they rarely
go out to pubs, bars or cafes. Similar proportion of respondents resigned from insti-
tutionalized tourism. The smallest number of respondents admit to limiting visits at
hairdresser’s (5%), beauty salons (4%) and to giving up sports activities, and also
organising themselves holidays ( 9% each). During such trips 29% seek for additional
savings (looking for cheaper accommodation, preparing food on their own). Other
way of decreasing the expenditure on holiday is, pointed by 24% of respondents,
choosing cheaper offers from travel agencies. Every fifth Pole tries to spend less
while visiting restaurants, pubs and while going to the cinema or theatre.
A less popular form of rationalising on expenditure is providing hairdresser’s
and beautician’s services at home: about 10–13% of the researched substitute these
services with natural services but at the same time the same number of people
state that despite the crisis they rarely perform them themselves.
6 20% of respondents stated: “difficult to say.”

192 Izabela Sowa
Only 8% of the researched limit the expenditure in such a way that holiday
trips are taken by some members of their family only.
3. Segmentation of consumers according to their reactions to crisis
The actions undertaken by Poles allow determining some consumers’
strategies how to behave during a crisis. Six groups of consumers were distin-
guished7 along with their typical patterns of behaviour:
1. A group of the life users, in other words people who:
‒ go to pubs and restaurants, cafes,
‒ use group tourism,
‒ use recreational-sports services,
‒ use personal grooming establishments and hairdressers,
‒ use privately organised forms of holidays,
‒ go to the cinema and/or theatre,
‒ use personal grooming services,
‒ take a decision that a holiday trip would be taken by some members of
their family only.
2. A group of the modest, these are the people who try to economize on
living by:
‒ checking the prices of foodstuffs before a purchase,
‒ purchasing foodstuffs where is cheaper,
‒ comparing prices of different foodstuffs,
‒ purchasing foodstuffs more often but in smaller quantities in order not to
waste any,
‒ giving up on purchases of luxury foodstuffs.
3. A group of the economizers, in other words people who indulge in
pleasures, but:
‒ try to lower bills in pubs, restaurants and cafes,
‒ try to limit expenses connected with visiting the cinema/theatre
‒ choose better value offers from travel agencies,
‒ look for additional savings while organising holidays on their own.
7 This was done by the means of principal components method with Varimix rotation. The total
variation explained = 69%, test, KMO measure of the sample adequacy = 0.82.
193Segmentation on the service market...
4. A group of the resourceful:‒ do the beautician and hairdresser’s services at home,
‒ swaps the out-patient services for medical appointments within the NFZ
(National Health Fund).
5. A group of the self-reliant, undertake the following steps:
‒ prepare foodstuffs on their own,
‒ produce foodstuffs (grow cucumbers, vegetables, herbs),
‒ purchase inferior brands/models of consumer durables than the ones pre-
viously planned,
‒ mend broken equipment instead of replacing it with new purchases.
6. A group of the groomed, these are people who:
‒ use hairdresser’s services,
‒ use private out-patient medical services: doctor’s appointments and medi-
cal procedures.
The characteristics of consumers’ segments distinguished on the basis of their
behaviour on the service market in conditions of economic crisis is following:
1. The life users (percentage of a given segment representatives – 10%).
The Characteristics of a segment: Mostly these are people at the age from
25 to 34 years of age and over 45 years of age, living in 4-persons families, where
the head of a family has elementary or vocational education. They are usually
employed as blue-collar workers or they have already retired/receive annuity.
Their income is low. They believe that the crisis has affected the economy signifi-
cantly as well as their own families, but to a lesser extend the households of their
friends. There are many pessimists among them, they regard their income as an
unstable one but do not feel too worried about the future
Undertaken actions: Over 90% of the life users have increased the frequency
of holiday trips and of using restaurants, cafes and pubs offers, and over 70%
of recreational, beauty or medical services. Over half of them rarely undertake
decisions on cutting on cinema, restaurant or pub spending than before the crisis.
They do not economize in any special way, with one exception: as much as 80%
decide that a holiday trip would be taken by some family members only.
They rarely purchase on the hire purchase basis than before the crisis. They
look for bargains in retail outlets, on the sale etc. They do not buy on impulse,
prepare a shopping list beforehand and rather look for cheaper products. They do
shopping according to the list prepared.
194 Izabela Sowa
2. The modest (18%).
The Characteristics of a segment: They are over 45 years of age, live in
a 4- and 5-persons families where the head of a family has a higher education.
They are employed on white-collar positions, their income is average but unstable.
They think that the crisis directly threatened Polish families. They are rather opti-
mistic despite the fact that they are uncertain about the future of their families and
the source of income.
Undertaken actions: They try not to give up on holiday trips but they look for
offers that will allow them to save money. They more frequently visit restaurants,
cinemas and take part in recreational activities but look for ways of economizing
on such pleasure. Every fifth person from the modest seeks for savings by cutting
on the number of family members going on holidays.
Their recipe for crisis is hunting for bargains, reduced prices and postponing
bigger purchases in time. As far as 76% of them admit that they have rarely pur-
chased high quality products recently.
3. The economizers (19%).
The Characteristics of a segment: They are up to 24 years of age and live
with 1 or 2 other people. They are mostly female. They cannot see any significant
effects of the crisis on the economy and their households.
Undertaken actions: About 4% of the economizers were forced to give up
on services by the crisis. Every second person, more often, than before the crisis,
uses the group tourism as well as they visit pubs and cafes. About 40% more
often use sport-recreational and medical services. An active use of services is
connected with dramatic economies: about 80% try to lower the bills in catering
establishments while on holiday trips; every third person of the economizers
more often try to limit their spending while at the cinema or theatre as well as by
choosing travel agents’ offer in comparison to the period before the crisis.
They do not want to abandon the achieved living standards and cease the use
of services. The crisis caused that 75% of them are more cautious while planning
expenditure, do shopping according to a list prepared beforehand, a half choose
cheaper brands.
4. The resourceful (26%).
The Characteristics of a segment: Most of them are of 24 to 44 years of age,
are singles or live with a life-partner. The head of the family usually has secondary
education. Their incomes are above average and they regard them as very stable.
195Segmentation on the service market...
Neither has the crisis affected the county’s situation nor their families in their opinion. There are many positive thinkers among them.
Undertaken actions: Only every tenth person of the resourceful uses sport – recreational services, hairdresser’s services more often than before the crisis and every seventh groups tourism and catering services. They do not look for ways of economizing while they are in catering establishments, at the cinema or on tourist trips. By contrast every fourth person does beauty treatments on their own, and every fifth uses hairdresser’s services more often than before the crisis. They go on holiday as the whole family.
They do not need to economize additionally on shopping or plan spending. They avoid purchasing on credit terms but eagerly purchase on impulse in order to pander to family member whims.
5. The self-reliant (14%).
The Characteristics of a segment: Very young people: up to 24 years but
also over 55 years of age, living in households of several persons, the head of
the family rarely has higher education. They work on their own account, have
a freelance occupation or have retired. Their income is rather stable but on an
average level. They are male mostly. In their opinion the crisis has not affected
their families or friends in any way.
Undertaken actions: They rather restrict catering services. It seems that the
actions undertaken by them are driven from their fondness for household chores
than for economizing. They use institutionalized tourism to small extend. They do
not substitute beauty and hairdresser’s services with their own treatment. They go
on holiday as the whole family.
During the crisis two thirds of them admit to more cautious shopping planning
and to postponing some of the expenditure in time. None of the self-reliant state
that they more often pander to their own or family members whims during the
crisis.
6. The groomed (12%).
The Characteristics of a segment: They are usually from 35 to 44 years of
age and have families that consist of several people. They work on their own
account, have a freelance occupation or have retired. Their income is on an average
level. They perceive a significant influence of the crisis over the county’s, their
households and their friends’ families’ situation.
Undertaken actions: The groomed look after their health and their appearance:
none of them limited the use of medical or beauty services. About 60% of them

196 Izabela Sowa
use hairdressers and medical services more often than before the crisis and 77%
beauty services substitute them for their own treatment.
Forced to economize they would not resign from medical services. They
defend themselves against the effects of the crisis by hunting for bargains on
the sales as they look for good quality products. They avoid own-label products
and cheaper products. They do not plan their shopping but rather purchase on
impulse.
Conclusion
The presented ways of responding to the crisis by Polish households allow to
conclude that Polish consumers have not been forced to undertake dramatic limi-
tations on the service market. This is due to the fact that most of Polish families
have not experienced greater effects of the crisis over country’s economy or their
households. Thereby a constant growth of service consumption can be observed.
The respondents declare that such a growth will pursue.
It seems that medical, hairdresser’s and beauty services are the least affected
by the further crisis results. Simultaneously they have the weakest possibilities
for development: their future possible growth is not as dynamic as of tourism or
catering services. Recreational services have become a very interesting branch.
Both the research results of Households Budgets and questionnaire surveys show
that this branch has great opportunities for development. The growth dynamics of
their usage has already been very strong with a low level of price growth at the
same time.
The research allowed for verifying the proposed hypothesis, namely that the
economic crisis caused consumers to resign from some services and contributed
to behaviour, which was to limit the expenditure on services, while the force of
changes in consumers’ behaviour depends, first of all, on the economic situation
of households. The truth is that there is a minor reduction in the use of services.
The efforts to lower the expenditure in this branch only to a small extent result
from abandoning services, but rather from limiting the range of their consumption.
The assumption that the size and the direction of changes are influenced by the
income of consumers has been proved. But it is not exclusively identified with the
level of income. The way consumers react to a crisis depends on the stability of
income, a price, changes within the economy and the degree of changes affecting
197Segmentation on the service market...
a household. It might be stated that the changes of consumer’s behaviour are influenced by current income, future income (understood as the level of income stability as well as the level of future real income identified with the forecasts for the economic situation) and past income (evaluated on the basis of a degree the crisis affected a household).
SEGMENTACJA NA RYNKU USŁUG
JAKO WYRAZ ZRÓŻNICOWANIA
POLSKICH GOSPODARSTW DOMOWYCH
Streszczenie
Proces serwicyzacji polskiej gospodarki został nieznacznie zahamowany przez kry-zys gospodarczy, jaki miał miejsce w Polsce po 2008 roku. Sytuacja ta zmusiła gospo-darstwa domowe do modyfikacji zachowań konsumpcyjnych między innymi na rynku
usług. Przyjmowane strategie postępowania na tym rynku pozwalają wyodrębnić sześć
segmentów konsumentów (korzystających z życia, skromnych, oszczędnych, zaradnych,
samodzielnych i zadbanych). Dane zgromadzone w badaniach bezpośrednich wskazują,
że reakcje na kryzys dotyczą nie pojedynczych konsumentów, ale całych gospodarstw
domowych i są uzależnione od wysokości i stabilności dochodów. W sferze kognityw-
nej polscy konsumenci na kryzys reagują niemal wszyscy, dostrzegając jego ewentualne
skutki w skali makro i mikro, jednak reakcje w sferze behawioralnej są charakterystyczne
zasadniczo dla tych, których życie i warunki materialne uległy konkretnym zmianom
w wyniku recesji.
