ziegler famco covered call fund - zcmfunds.com · the ziegler famco covered call fund ... the...
TRANSCRIPT
www.zcmfunds.com
ZIEGLER FAMCO COVERED CALL FUND − CLASS A (CACLX) − CLASS C (CCCLX) − INSTITUTIONAL CLASS (CICLX)
ZIEGLER STRATEGIC INCOME FUND − INSTITUTIONAL CLASS (ZLSIX)
SEMI-ANNUAL REPORT TO SHAREHOLDERS
MARCH 31, 2016
Table of Contents Shareholder Letter 2 Ziegler FAMCO Covered Call Fund Schedule of Investments 4 Statement of Assets and Liabilities 8 Statement of Operations 9 Statement of Changes in Net Assets 10 Financial Highlights 11 Ziegler Strategic Income Fund Schedule of Investments 14 Statement of Assets and Liabilities 22 Statement of Operations 23 Statement of Changes in Net Assets 24 Financial Highlights 25 Notes 26 Expense Example 36 Approval of Investment Advisory Agreement 37 Other Information 38
Ziegler FAMCO Covered Call Fund LETTER TO SHAREHOLDERS March 31, 2016 (Unaudited)
Wiley D. Angell Sean C. Hughes, CFA Chief Investment Officer, FAMCO Group Senior Portfolio Manager Senior Portfolio Manager
After seven years of an equity bull market, equity valuations appear to be above long-term averages. In this difficult equity investment environment, an allocation to a conservative equity strategy that holds reasonably valued equities may be the most prudent choice. The Ziegler FAMCO Covered Call Fund (the “Fund” or “FAMCO”), which combines high quality equities with written call options for potential downside protection, could provide investors with a low beta, lower volatility equity vehicle.
The Fund invests in a diversified portfolio of large capitalization equity securities from, in our view, high quality, industry leading companies. This portfolio has been combined with an active covered call writing strategy on each individual equity holding in order to generate call premiums. The premiums from the call options can help stabilize portfolio returns by aiming to mitigate some of the losses during declining equity markets. Our goal is for the call option overlay to be dynamically managed aiming to optimize each equity position by potentially maximizing income while minimizing exercise risk. FAMCO’s active call option strategy seeks to add value relative to the passive covered call benchmark, the CBOE S&P 500 BuyWrite Index (“BXM Index”).
The Fund has outperformed the BXM Index for the month-to-date, year-to-date, and inception-to-date periods ended March 31, 2016, producing an excess return relative to the BXM Index of 2.09%, 1.54% and 0.47%, respectively (Institutional Class). In a volatile period for the equity market, FAMCO’s strategy provided some stability to returns, producing 28% less price volatility than the S&P 500 Index since inception. Holding higher quality equities and seeking downside protection from the call options were the keys to stabilizing returns. FAMCO continued to emphasize large capitalization companies with consistent earnings, attractive valuations and higher than average dividends. These value oriented stocks outperformed the S&P 500 Index during the year-to-date and inception-to-date periods by 1.00% and 0.08%, respectively. Despite the outperformance, the Fund’s stocks remained attractively valued relative to the Index and the active call strategy appears well positioned for the upcoming period.
Stock valuations: Over the past four years, the S&P 500 Growth Index has outperformed the S&P 500 Value Index in 69% of the quarters, an unusually long stretch of outperformance. Large cap growth excess performance over this period resulted in large cap value stocks beginning 2016 at attractive valuations relative to the rest of the market. At quarter-end, large cap growth stocks had a P/E ratio of 22.3, the S&P 500 Index had a P/E ratio of 18.7 and large cap value stocks had a P/E ratio of 16.0. Comparing quarter-end P/E ratios to their 10-year averages, large cap growth is 28% overvalued, the S&P 500 Index is 13% overvalued, and large cap value is 0.02% overvalued. FAMCO’s stock performance remains consistent with the performance of value stocks, which are attractively priced and historically offered the potential for above average dividends.
Active call writing process: Call premiums during the quarter were elevated as implied volatility spiked to more than 27% on several occasions (the 5-year average is 18%). Higher implied volatility can lead to higher call premiums. During this period, FAMCO extended the average maturity of the call options in order to “lock in” the elevated call premiums for longer. As a result of this active management, the call options in the portfolio outperformed the call options in the BXM Index by 0.85% year-to-date and 1.03% inception-to-date.
Low interest rates and increasingly expensive equities make allocation decisions difficult. We believe reasonably priced large cap value stocks offer the best risk/reward potential going forward, especially when combined with call premiums that can help stabilize returns and aim to provide downside protection. Compared to the equity market, the stocks owned by the Fund have historically shown more stable earnings, higher dividends and more attractive valuations. We prefer to invest the Fund’s assets in equities of companies with stable growth rather than rapid or volatile growth. The Fund’s portfolio is underweight the traditional value sectors of Energy, Materials and Financials as they have historically shown volatile earnings. Instead, the Fund’s value oriented stocks were tilted toward more stable earning companies in the Consumer and Industrial sectors. At quarter-end, the average dividend yield in the portfolio was 2.8% and the average market cap was $146 billion, both higher than the S&P 500 Index. We view the S&P 500 Index’s valuation (P/E = 18.7) as a headwind to significant upside stock appreciation, particularly in a slowly growing economy. As a result, we have positioned the Fund’s call options closer to current stocks prices in order to potentially produce more downside protection and higher premiums. We also positioned the Fund with longer dated call options – a function of locking in higher volatility for longer when volatility spiked earlier in the quarter.
2
Ziegler FAMCO Covered Call Fund LETTER TO SHAREHOLDERS (Continued) March 31, 2016 (Unaudited)
Past performance is not a guarantee of future results.
Diversification does not assure a profit nor protect against loss in a declining market.
Earnings growth is not representative of the Fund’s future performance.
Short term performance in particular is not a good indication of the fund’s future performance and an investment should not be made based solely on returns.
Opinions expressed are those of the Investment Manager, are subject to change, are not guaranteed, and should not be considered investment advice.
Fund holdings and sector allocations are subject to change and should not be considered a recommendation to buy or sell any security. For a complete list of fund holdings, please refer to the Schedule of Investments section of this report.
An investment in the Fund is subject to risk and there can be no assurance that the Fund will achieve its investment objective. The principal risks of investing in the Fund include equity securities risk, large capitalization companies risk, market risk, ADR risk, foreign securities risk, management risk, investment strategy risk, options risk, small- and mid-capitalization company risk, and new fund risk.
Writing covered call options entails certain risks, which include, but are not limited to, the following: an increase in the value of the underlying equity security above the exercise price can result in the exercise of a written option when the Fund may not otherwise have sold the security; exercise of the option by the counterparty will result in a sale below the current market value and will result in a gain or loss being realized by the Fund; writing covered call options limits the potential appreciation that could be realized on the underlying equity security to the extent of the exercise price of the option. As such, an option over-write strategy may outperform the general equity market in flat or falling bear markets but underperform in risking bull markets.
The report must be preceded or accompanied by a prospectus.
The CBOE S&P 500 BuyWrite Index (ticker symbol BXM) is a benchmark index designed to show the hypothetical performance of a portfolio that engages in a buy-write strategy using S&P 500 index call options.
The S&P 500 Index is a broad market index that tracks the performance of 500 leading stocks from major industries of the U.S. economy. The index is generally considered representative of the U.S. large capitalization market.
The S&P 500 Growth Index measures growth companies of the S&P 500 Index using three factors: sales growth, the ratio of earnings change to price, and momentum.
The S&P 500 Value Index measures value companies of the S&P 500 Index using three factors: the ratios of book value, earnings, and sales to price.
Price to earnings ratio is a common tool for comparing the prices of different common stocks and is calculated by dividing the current market price of a stock by the earnings per share.
Beta measures the sensitivity of rates of return on a fund to general market movements.
It is not possible to invest directly in an index.
The Ziegler FAMCO Covered Call Fund is distributed by Quasar Distributors, LLC.
3
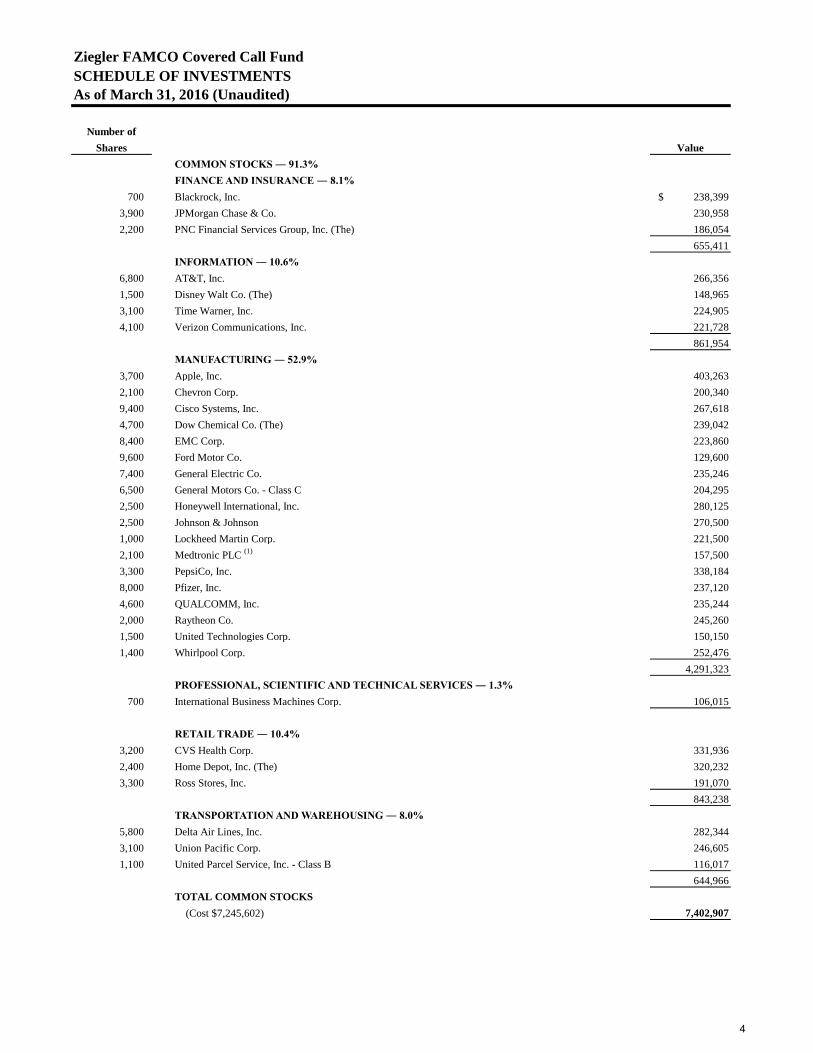
Number ofShares Value
COMMON STOCKS ― 91.3%FINANCE AND INSURANCE ― 8.1%
700 Blackrock, Inc. $ 238,399 3,900 JPMorgan Chase & Co. 230,958 2,200 PNC Financial Services Group, Inc. (The) 186,054
655,411 INFORMATION ― 10.6%
6,800 AT&T, Inc. 266,356 1,500 Disney Walt Co. (The) 148,965 3,100 Time Warner, Inc. 224,905 4,100 Verizon Communications, Inc. 221,728
861,954 MANUFACTURING ― 52.9%
3,700 Apple, Inc. 403,263 2,100 Chevron Corp. 200,340 9,400 Cisco Systems, Inc. 267,618 4,700 Dow Chemical Co. (The) 239,042 8,400 EMC Corp. 223,860 9,600 Ford Motor Co. 129,600 7,400 General Electric Co. 235,246 6,500 General Motors Co. - Class C 204,295 2,500 Honeywell International, Inc. 280,125 2,500 Johnson & Johnson 270,500 1,000 Lockheed Martin Corp. 221,500 2,100 Medtronic PLC (1) 157,500 3,300 PepsiCo, Inc. 338,184 8,000 Pfizer, Inc. 237,120 4,600 QUALCOMM, Inc. 235,244 2,000 Raytheon Co. 245,260 1,500 United Technologies Corp. 150,150 1,400 Whirlpool Corp. 252,476
4,291,323 PROFESSIONAL, SCIENTIFIC AND TECHNICAL SERVICES ― 1.3%
700 International Business Machines Corp. 106,015
RETAIL TRADE ― 10.4% 3,200 CVS Health Corp. 331,936 2,400 Home Depot, Inc. (The) 320,232 3,300 Ross Stores, Inc. 191,070
843,238 TRANSPORTATION AND WAREHOUSING ― 8.0%
5,800 Delta Air Lines, Inc. 282,344 3,100 Union Pacific Corp. 246,605 1,100 United Parcel Service, Inc. - Class B 116,017
644,966 TOTAL COMMON STOCKS
(Cost $7,245,602) 7,402,907
As of March 31, 2016 (Unaudited)SCHEDULE OF INVESTMENTSZiegler FAMCO Covered Call Fund
4
The accompanying notes are an integral part of these financial statements.
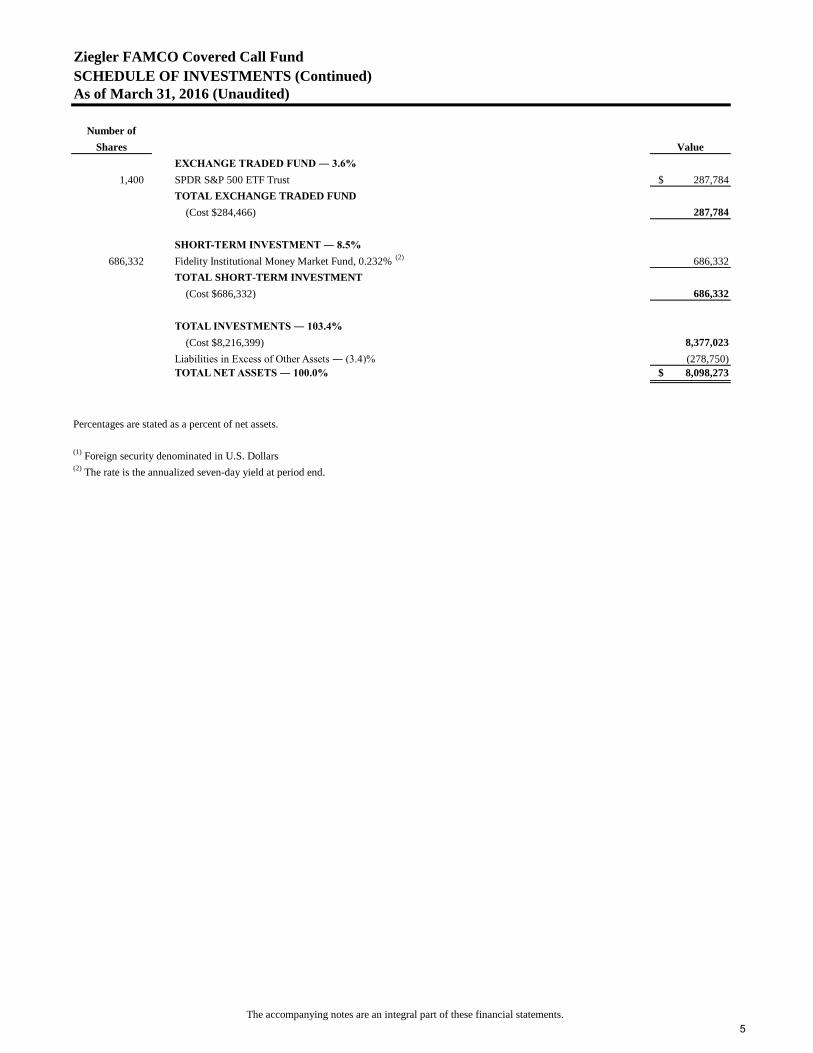
Number ofShares Value
EXCHANGE TRADED FUND ― 3.6% 1,400 SPDR S&P 500 ETF Trust $ 287,784
TOTAL EXCHANGE TRADED FUND(Cost $284,466) 287,784
SHORT-TERM INVESTMENT ― 8.5% 686,332 Fidelity Institutional Money Market Fund, 0.232% (2) 686,332
TOTAL SHORT-TERM INVESTMENT(Cost $686,332) 686,332
TOTAL INVESTMENTS ― 103.4%(Cost $8,216,399) 8,377,023
Liabilities in Excess of Other Assets ― (3.4)% (278,750) TOTAL NET ASSETS ― 100.0% $ 8,098,273
Percentages are stated as a percent of net assets.
(1) Foreign security denominated in U.S. Dollars(2) The rate is the annualized seven-day yield at period end.
Ziegler FAMCO Covered Call FundSCHEDULE OF INVESTMENTS (Continued)As of March 31, 2016 (Unaudited)
5
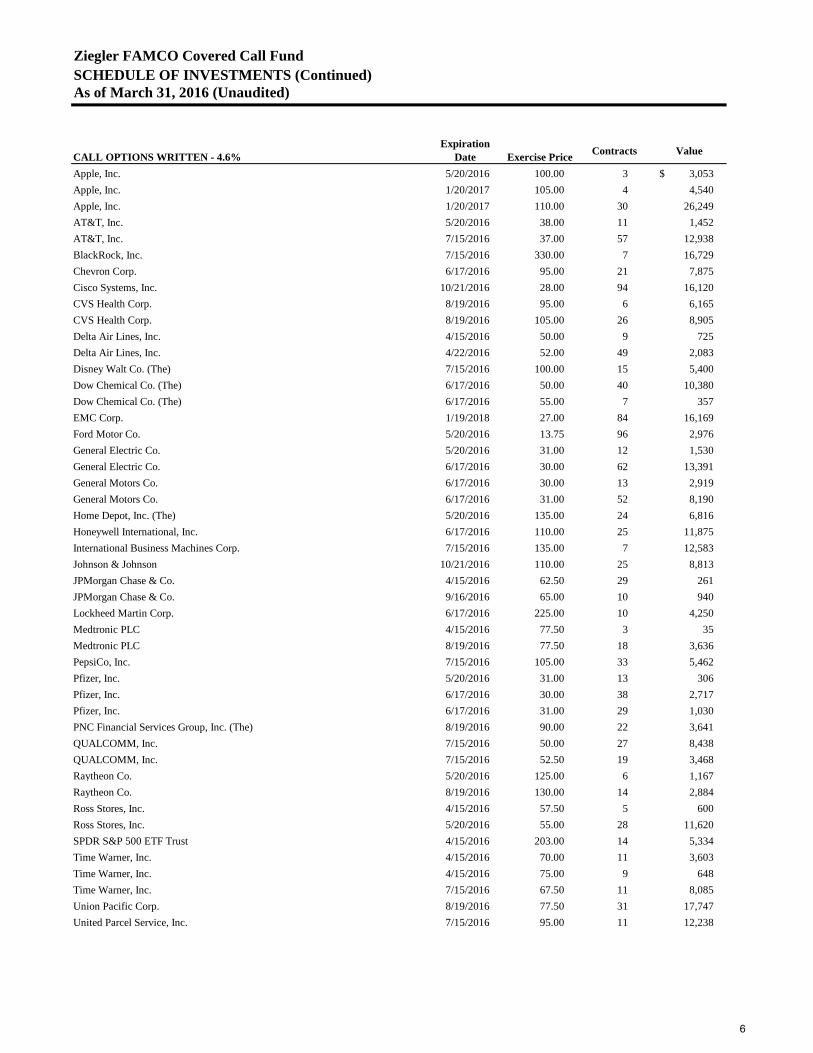
Ziegler FAMCO Covered Call FundSCHEDULE OF INVESTMENTS (Continued)As of March 31, 2016 (Unaudited)
CALL OPTIONS WRITTEN - 4.6%Expiration
Date Exercise Price Contracts Value
Apple, Inc. 5/20/2016 100.00 3 $ 3,053 Apple, Inc. 1/20/2017 105.00 4 4,540 Apple, Inc. 1/20/2017 110.00 30 26,249 AT&T, Inc. 5/20/2016 38.00 11 1,452 AT&T, Inc. 7/15/2016 37.00 57 12,938 BlackRock, Inc. 7/15/2016 330.00 7 16,729 Chevron Corp. 6/17/2016 95.00 21 7,875 Cisco Systems, Inc. 10/21/2016 28.00 94 16,120 CVS Health Corp. 8/19/2016 95.00 6 6,165 CVS Health Corp. 8/19/2016 105.00 26 8,905 Delta Air Lines, Inc. 4/15/2016 50.00 9 725 Delta Air Lines, Inc. 4/22/2016 52.00 49 2,083 Disney Walt Co. (The) 7/15/2016 100.00 15 5,400 Dow Chemical Co. (The) 6/17/2016 50.00 40 10,380 Dow Chemical Co. (The) 6/17/2016 55.00 7 357 EMC Corp. 1/19/2018 27.00 84 16,169 Ford Motor Co. 5/20/2016 13.75 96 2,976 General Electric Co. 5/20/2016 31.00 12 1,530 General Electric Co. 6/17/2016 30.00 62 13,391 General Motors Co. 6/17/2016 30.00 13 2,919 General Motors Co. 6/17/2016 31.00 52 8,190 Home Depot, Inc. (The) 5/20/2016 135.00 24 6,816 Honeywell International, Inc. 6/17/2016 110.00 25 11,875 International Business Machines Corp. 7/15/2016 135.00 7 12,583 Johnson & Johnson 10/21/2016 110.00 25 8,813 JPMorgan Chase & Co. 4/15/2016 62.50 29 261 JPMorgan Chase & Co. 9/16/2016 65.00 10 940 Lockheed Martin Corp. 6/17/2016 225.00 10 4,250 Medtronic PLC 4/15/2016 77.50 3 35 Medtronic PLC 8/19/2016 77.50 18 3,636 PepsiCo, Inc. 7/15/2016 105.00 33 5,462 Pfizer, Inc. 5/20/2016 31.00 13 306 Pfizer, Inc. 6/17/2016 30.00 38 2,717 Pfizer, Inc. 6/17/2016 31.00 29 1,030 PNC Financial Services Group, Inc. (The) 8/19/2016 90.00 22 3,641 QUALCOMM, Inc. 7/15/2016 50.00 27 8,438 QUALCOMM, Inc. 7/15/2016 52.50 19 3,468 Raytheon Co. 5/20/2016 125.00 6 1,167 Raytheon Co. 8/19/2016 130.00 14 2,884 Ross Stores, Inc. 4/15/2016 57.50 5 600 Ross Stores, Inc. 5/20/2016 55.00 28 11,620 SPDR S&P 500 ETF Trust 4/15/2016 203.00 14 5,334 Time Warner, Inc. 4/15/2016 70.00 11 3,603 Time Warner, Inc. 4/15/2016 75.00 9 648 Time Warner, Inc. 7/15/2016 67.50 11 8,085 Union Pacific Corp. 8/19/2016 77.50 31 17,747 United Parcel Service, Inc. 7/15/2016 95.00 11 12,238
6
The accompanying notes are an integral part of these financial statements.
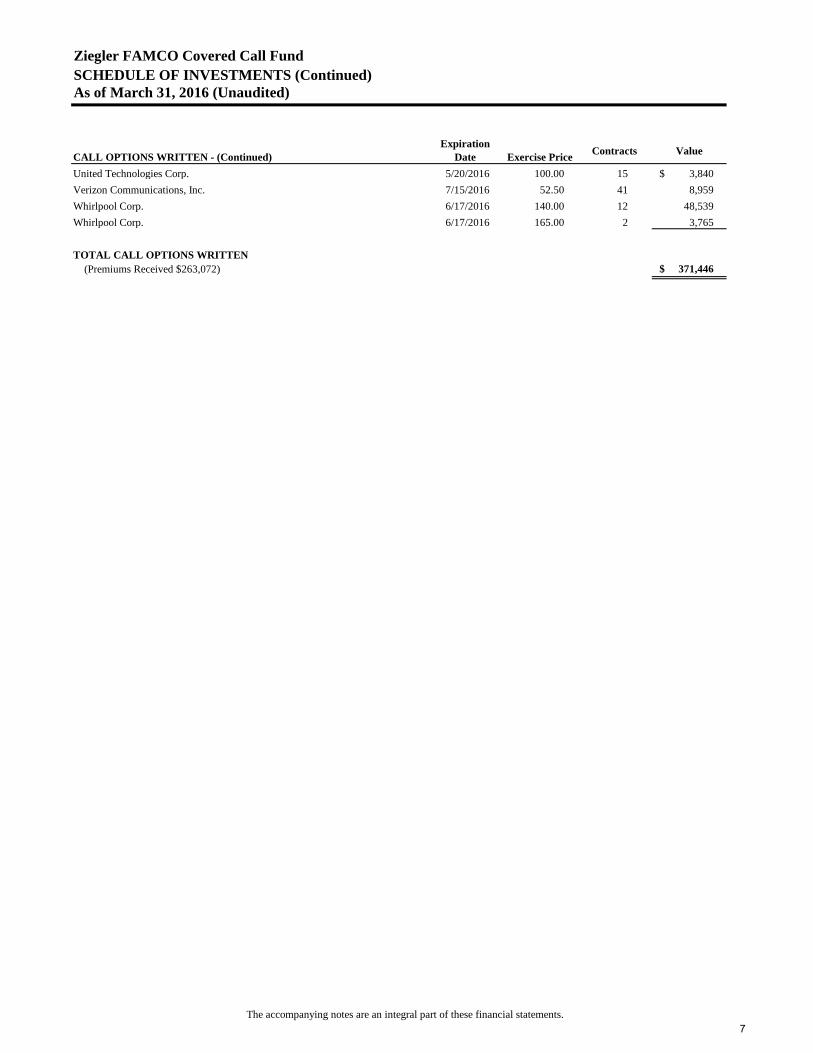
Ziegler FAMCO Covered Call FundSCHEDULE OF INVESTMENTS (Continued)As of March 31, 2016 (Unaudited)
CALL OPTIONS WRITTEN - (Continued)Expiration
Date Exercise Price Contracts Value
United Technologies Corp. 5/20/2016 100.00 15 $ 3,840 Verizon Communications, Inc. 7/15/2016 52.50 41 8,959 Whirlpool Corp. 6/17/2016 140.00 12 48,539 Whirlpool Corp. 6/17/2016 165.00 2 3,765
TOTAL CALL OPTIONS WRITTEN (Premiums Received $263,072) $ 371,446
7
The accompanying notes are an integral part of these financial statements.
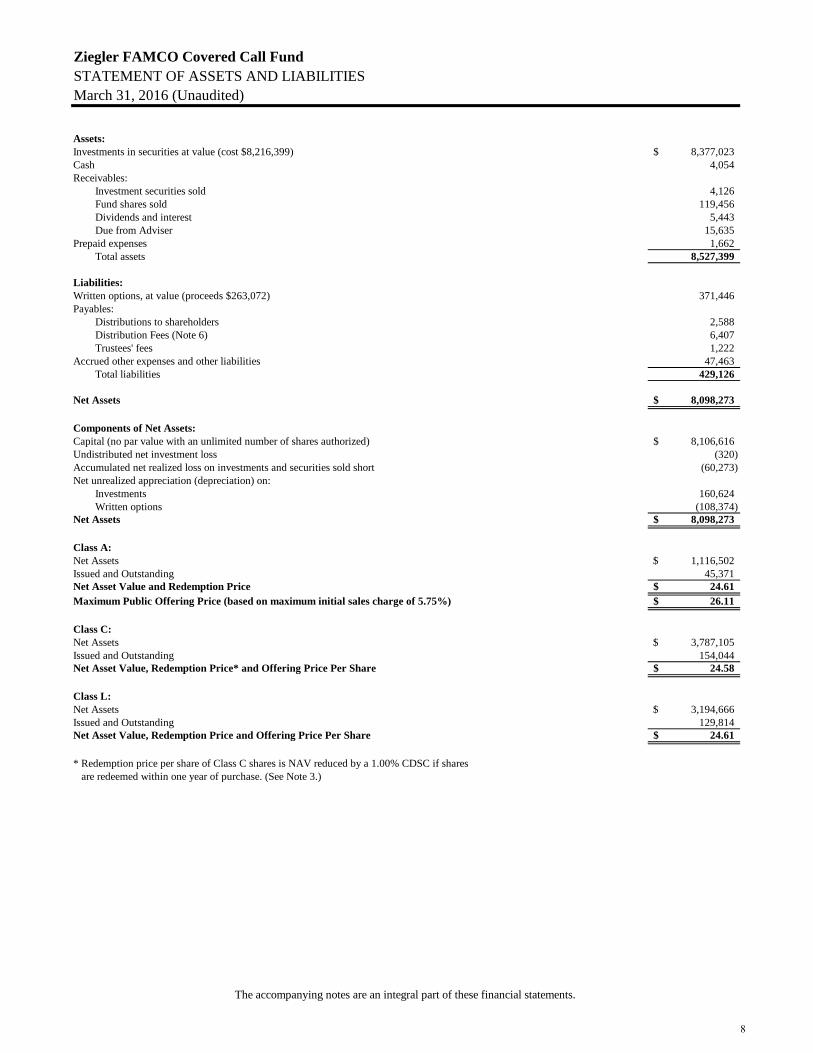
Ziegler FAMCO Covered Call FundSTATEMENT OF ASSETS AND LIABILITIESMarch 31, 2016 (Unaudited)
Assets:Investments in securities at value (cost $8,216,399) 8,377,023$ Cash 4,054 Receivables:
Investment securities sold 4,126 Fund shares sold 119,456 Dividends and interest 5,443 Due from Adviser 15,635
Prepaid expenses 1,662 Total assets 8,527,399
Liabilities:Written options, at value (proceeds $263,072) 371,446 Payables:
Distributions to shareholders 2,588 Distribution Fees (Note 6) 6,407 Trustees' fees 1,222
Accrued other expenses and other liabilities 47,463 Total liabilities 429,126
Net Assets 8,098,273$
Components of Net Assets:Capital (no par value with an unlimited number of shares authorized) 8,106,616$ Undistributed net investment loss (320) Accumulated net realized loss on investments and securities sold short (60,273) Net unrealized appreciation (depreciation) on:
Investments 160,624 Written options (108,374)
Net Assets 8,098,273$
Class A:Net Assets 1,116,502$ Issued and Outstanding 45,371 Net Asset Value and Redemption Price 24.61$ Maximum Public Offering Price (based on maximum initial sales charge of 5.75%) 26.11$
Class C:Net Assets 3,787,105$ Issued and Outstanding 154,044 Net Asset Value, Redemption Price* and Offering Price Per Share 24.58$
Class L:Net Assets 3,194,666$ Issued and Outstanding 129,814 Net Asset Value, Redemption Price and Offering Price Per Share 24.61$
* Redemption price per share of Class C shares is NAV reduced by a 1.00% CDSC if shares are redeemed within one year of purchase. (See Note 3.)
8
The accompanying notes are an integral part of these financial statements.
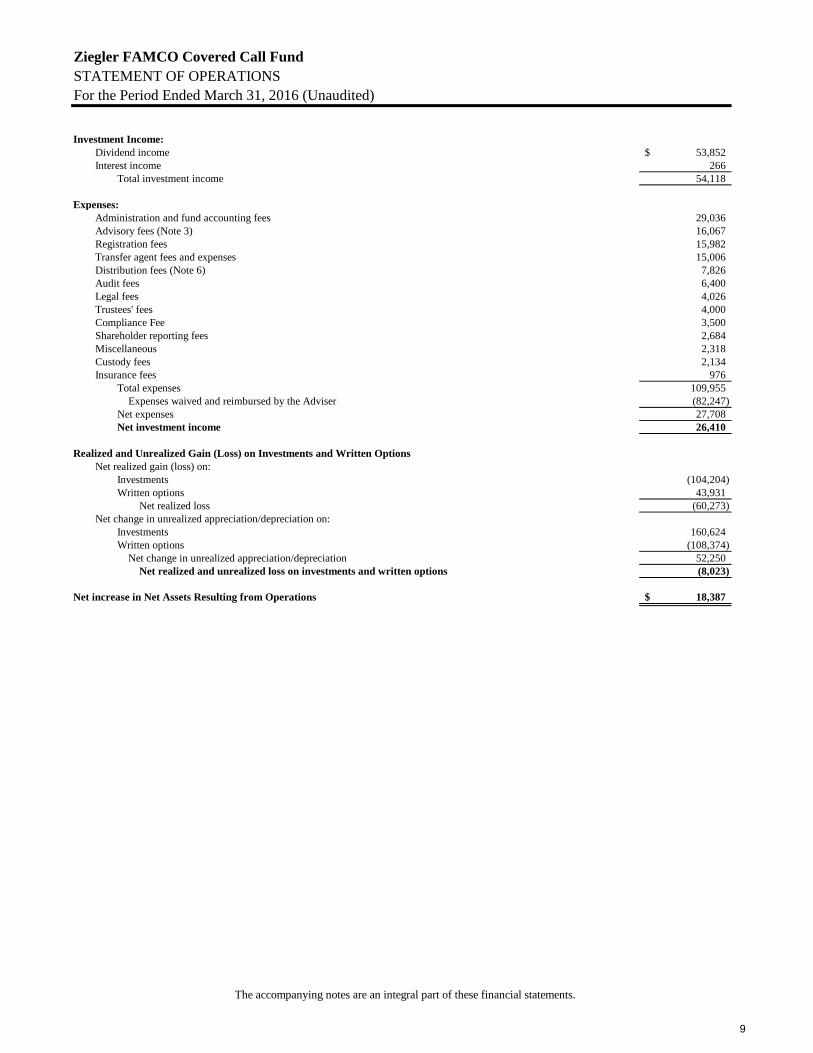
Ziegler FAMCO Covered Call FundSTATEMENT OF OPERATIONSFor the Period Ended March 31, 2016 (Unaudited)
Investment Income:Dividend income 53,852$ Interest income 266
Total investment income 54,118
Expenses:Administration and fund accounting fees 29,036 Advisory fees (Note 3) 16,067 Registration fees 15,982 Transfer agent fees and expenses 15,006 Distribution fees (Note 6) 7,826 Audit fees 6,400 Legal fees 4,026 Trustees' fees 4,000 Compliance Fee 3,500 Shareholder reporting fees 2,684 Miscellaneous 2,318 Custody fees 2,134 Insurance fees 976
Total expenses 109,955 Expenses waived and reimbursed by the Adviser (82,247)
Net expenses 27,708 Net investment income 26,410
Realized and Unrealized Gain (Loss) on Investments and Written OptionsNet realized gain (loss) on:
Investments (104,204) Written options 43,931
Net realized loss (60,273) Net change in unrealized appreciation/depreciation on:
Investments 160,624 Written options (108,374)
Net change in unrealized appreciation/depreciation 52,250 Net realized and unrealized loss on investments and written options (8,023)
Net increase in Net Assets Resulting from Operations 18,387$
9
The accompanying notes are an integral part of these financial statements.
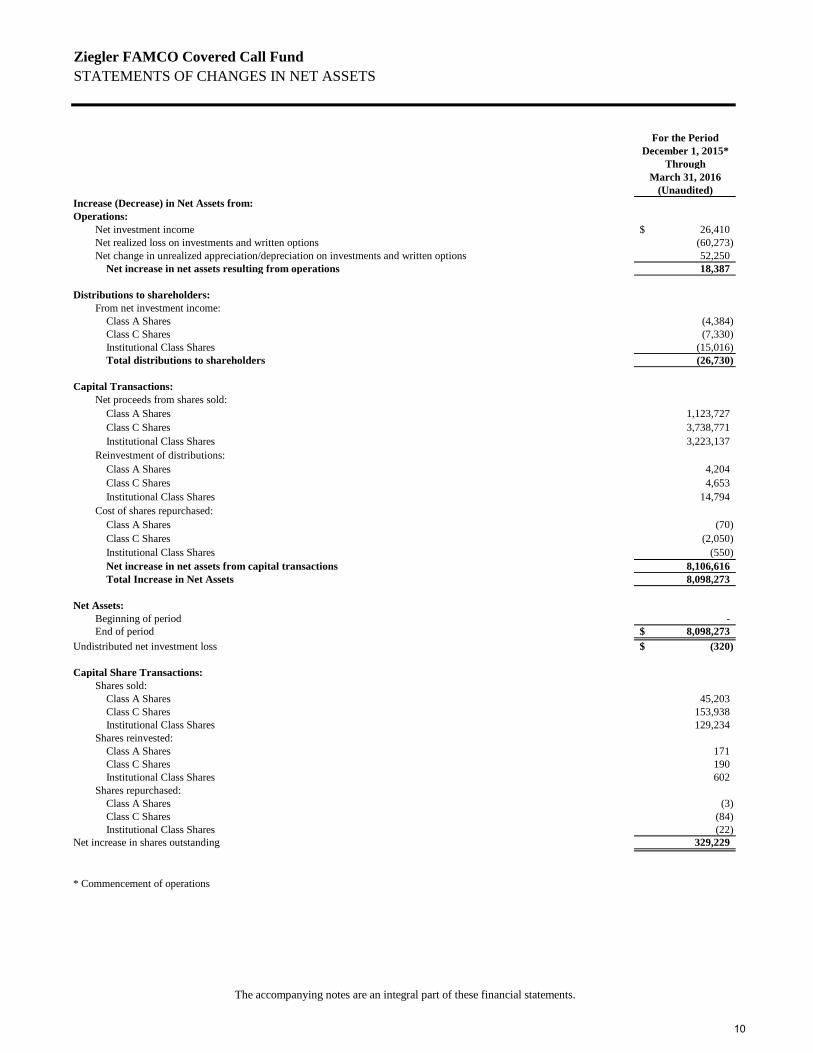
Ziegler FAMCO Covered Call FundSTATEMENTS OF CHANGES IN NET ASSETS
For the PeriodDecember 1, 2015*
ThroughMarch 31, 2016
(Unaudited)Increase (Decrease) in Net Assets from:Operations:
Net investment income 26,410$ Net realized loss on investments and written options (60,273) Net change in unrealized appreciation/depreciation on investments and written options 52,250
Net increase in net assets resulting from operations 18,387
Distributions to shareholders:From net investment income:
Class A Shares (4,384) Class C Shares (7,330) Institutional Class Shares (15,016) Total distributions to shareholders (26,730)
Capital Transactions:Net proceeds from shares sold:
Class A Shares 1,123,727 Class C Shares 3,738,771 Institutional Class Shares 3,223,137
Reinvestment of distributions:Class A Shares 4,204 Class C Shares 4,653 Institutional Class Shares 14,794
Cost of shares repurchased:Class A Shares (70) Class C Shares (2,050) Institutional Class Shares (550) Net increase in net assets from capital transactions 8,106,616 Total Increase in Net Assets 8,098,273
Net Assets:Beginning of period - End of period 8,098,273$
Undistributed net investment loss (320)$
Capital Share Transactions:Shares sold:
Class A Shares 45,203 Class C Shares 153,938 Institutional Class Shares 129,234
Shares reinvested:Class A Shares 171 Class C Shares 190 Institutional Class Shares 602
Shares repurchased:Class A Shares (3) Class C Shares (84) Institutional Class Shares (22)
Net increase in shares outstanding 329,229
* Commencement of operations
10
The accompanying notes are an integral part of these financial statements.
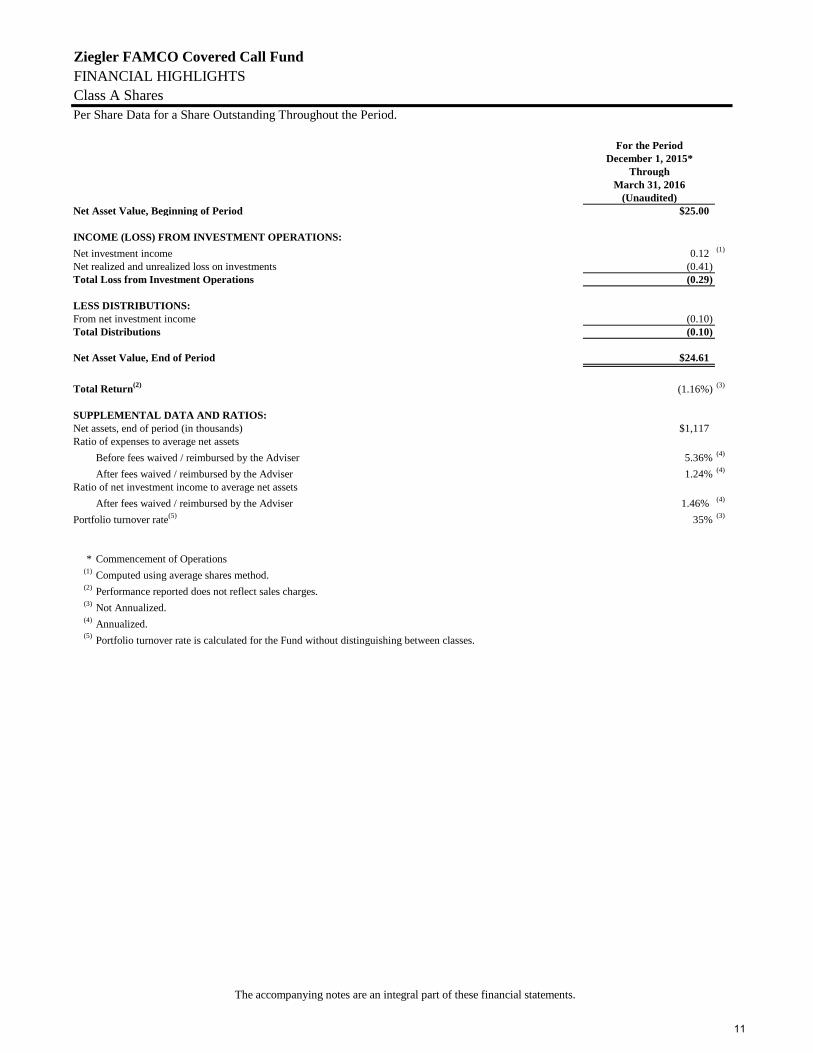
Ziegler FAMCO Covered Call FundFINANCIAL HIGHLIGHTSClass A SharesPer Share Data for a Share Outstanding Throughout the Period.
For the PeriodDecember 1, 2015*
ThroughMarch 31, 2016
(Unaudited)Net Asset Value, Beginning of Period $25.00
INCOME (LOSS) FROM INVESTMENT OPERATIONS:Net investment income 0.12 (1)
Net realized and unrealized loss on investments (0.41)Total Loss from Investment Operations (0.29)
LESS DISTRIBUTIONS:From net investment income (0.10)Total Distributions (0.10)
Net Asset Value, End of Period $24.61
Total Return(2) (1.16%) (3)
SUPPLEMENTAL DATA AND RATIOS:Net assets, end of period (in thousands) $1,117Ratio of expenses to average net assets
Before fees waived / reimbursed by the Adviser 5.36% (4)
After fees waived / reimbursed by the Adviser 1.24% (4)
Ratio of net investment income to average net assetsAfter fees waived / reimbursed by the Adviser 1.46% (4)
Portfolio turnover rate(5) 35% (3)
* Commencement of Operations(1) Computed using average shares method.(2) Performance reported does not reflect sales charges.(3) Not Annualized.(4) Annualized.(5) Portfolio turnover rate is calculated for the Fund without distinguishing between classes.
11

The accompanying notes are an integral part of these financial statements.
Ziegler FAMCO Covered Call FundFINANCIAL HIGHLIGHTSClass C SharesPer Share Data for a Share Outstanding Throughout the Period.
For the PeriodDecember 1, 2015*
ThroughMarch 31, 2016
(Unaudited)Net Asset Value, Beginning of Period $25.00
INCOME (LOSS) FROM INVESTMENT OPERATIONS:Net investment income 0.06 (1)
Net realized and unrealized loss on investments (0.41)Total Loss from Investment Operations (0.35)
LESS DISTRIBUTIONS:From net investment income (0.07)Total Distributions (0.07)
Net Asset Value, End of Period $24.58
Total Return (1.42%) (2)
SUPPLEMENTAL DATA AND RATIOS:Net assets, end of period (in thousands) $3,787Ratio of expenses to average net assets
Before fees waived / reimbursed by the Adviser 6.02% (3)
After fees waived / reimbursed by the Adviser 1.99% (3)
Ratio of net investment income to average net assetsAfter fees waived / reimbursed by the Adviser 0.69% (3)
Portfolio turnover rate(4) 35% (2)
* Commencement of Operations(1) Computed using average shares method.(2) Not Annualized.(3) Annualized.(4) Portfolio turnover rate is calculated for the Fund without distinguishing between classes.
12
The accompanying notes are an integral part of these financial statements.
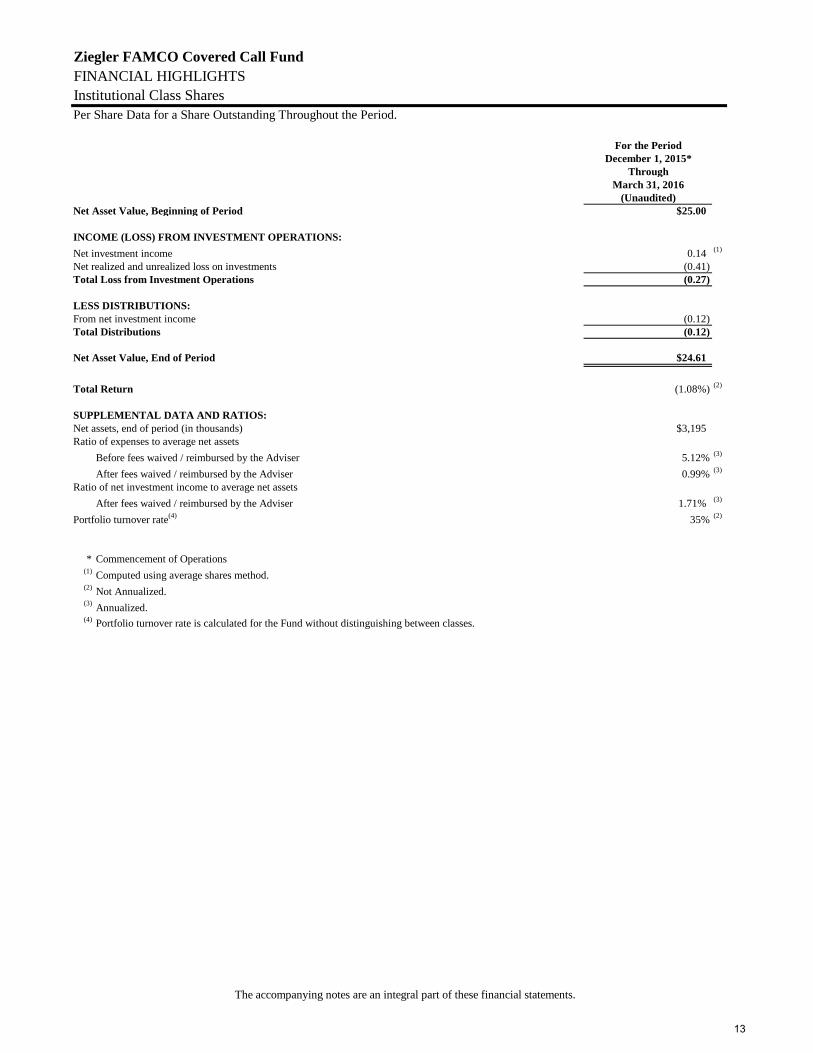
Ziegler FAMCO Covered Call FundFINANCIAL HIGHLIGHTSInstitutional Class SharesPer Share Data for a Share Outstanding Throughout the Period.
For the PeriodDecember 1, 2015*
ThroughMarch 31, 2016
(Unaudited)Net Asset Value, Beginning of Period $25.00
INCOME (LOSS) FROM INVESTMENT OPERATIONS:Net investment income 0.14 (1)
Net realized and unrealized loss on investments (0.41)Total Loss from Investment Operations (0.27)
LESS DISTRIBUTIONS:From net investment income (0.12)Total Distributions (0.12)
Net Asset Value, End of Period $24.61
Total Return (1.08%) (2)
SUPPLEMENTAL DATA AND RATIOS:Net assets, end of period (in thousands) $3,195Ratio of expenses to average net assets
Before fees waived / reimbursed by the Adviser 5.12% (3)
After fees waived / reimbursed by the Adviser 0.99% (3)
Ratio of net investment income to average net assetsAfter fees waived / reimbursed by the Adviser 1.71% (3)
Portfolio turnover rate(4) 35% (2)
* Commencement of Operations(1) Computed using average shares method.(2) Not Annualized.(3) Annualized.(4) Portfolio turnover rate is calculated for the Fund without distinguishing between classes.
13
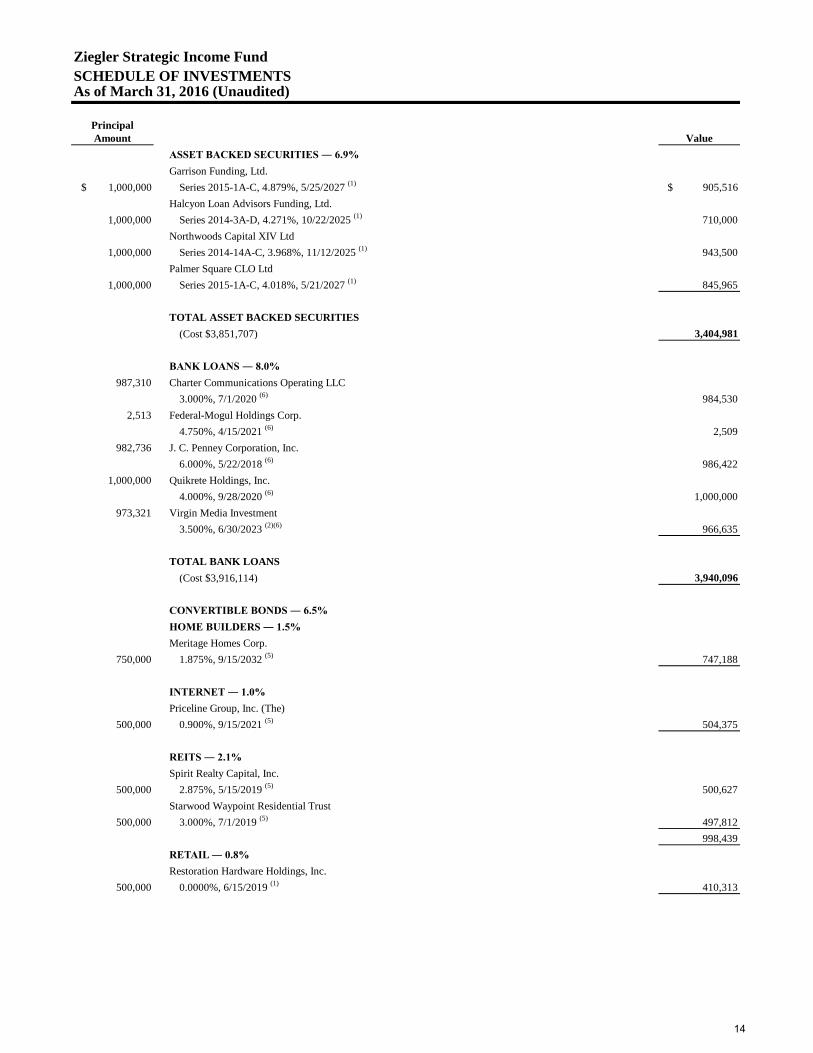
PrincipalAmount Value
ASSET BACKED SECURITIES ― 6.9%Garrison Funding, Ltd.
$ 1,000,000 Series 2015-1A-C, 4.879%, 5/25/2027 (1) $ 905,516 Halcyon Loan Advisors Funding, Ltd.
1,000,000 Series 2014-3A-D, 4.271%, 10/22/2025 (1) 710,000Northwoods Capital XIV Ltd
1,000,000 Series 2014-14A-C, 3.968%, 11/12/2025 (1) 943,500Palmer Square CLO Ltd
1,000,000 Series 2015-1A-C, 4.018%, 5/21/2027 (1) 845,965
TOTAL ASSET BACKED SECURITIES(Cost $3,851,707) 3,404,981
BANK LOANS ― 8.0%987,310 Charter Communications Operating LLC
3.000%, 7/1/2020 (6) 984,5302,513 Federal-Mogul Holdings Corp.
4.750%, 4/15/2021 (6) 2,509982,736 J. C. Penney Corporation, Inc.
6.000%, 5/22/2018 (6) 986,4221,000,000 Quikrete Holdings, Inc.
4.000%, 9/28/2020 (6) 1,000,000973,321 Virgin Media Investment
3.500%, 6/30/2023 (2)(6) 966,635
TOTAL BANK LOANS(Cost $3,916,114) 3,940,096
CONVERTIBLE BONDS ― 6.5%HOME BUILDERS ― 1.5%Meritage Homes Corp.
750,000 1.875%, 9/15/2032 (5) 747,188
INTERNET ― 1.0%Priceline Group, Inc. (The)
500,000 0.900%, 9/15/2021 (5) 504,375
REITS ― 2.1%Spirit Realty Capital, Inc.
500,000 2.875%, 5/15/2019 (5) 500,627Starwood Waypoint Residential Trust
500,000 3.000%, 7/1/2019 (5) 497,812998,439
RETAIL ― 0.8%Restoration Hardware Holdings, Inc.
500,000 0.0000%, 6/15/2019 (1) 410,313
Ziegler Strategic Income FundSCHEDULE OF INVESTMENTSAs of March 31, 2016 (Unaudited)
14
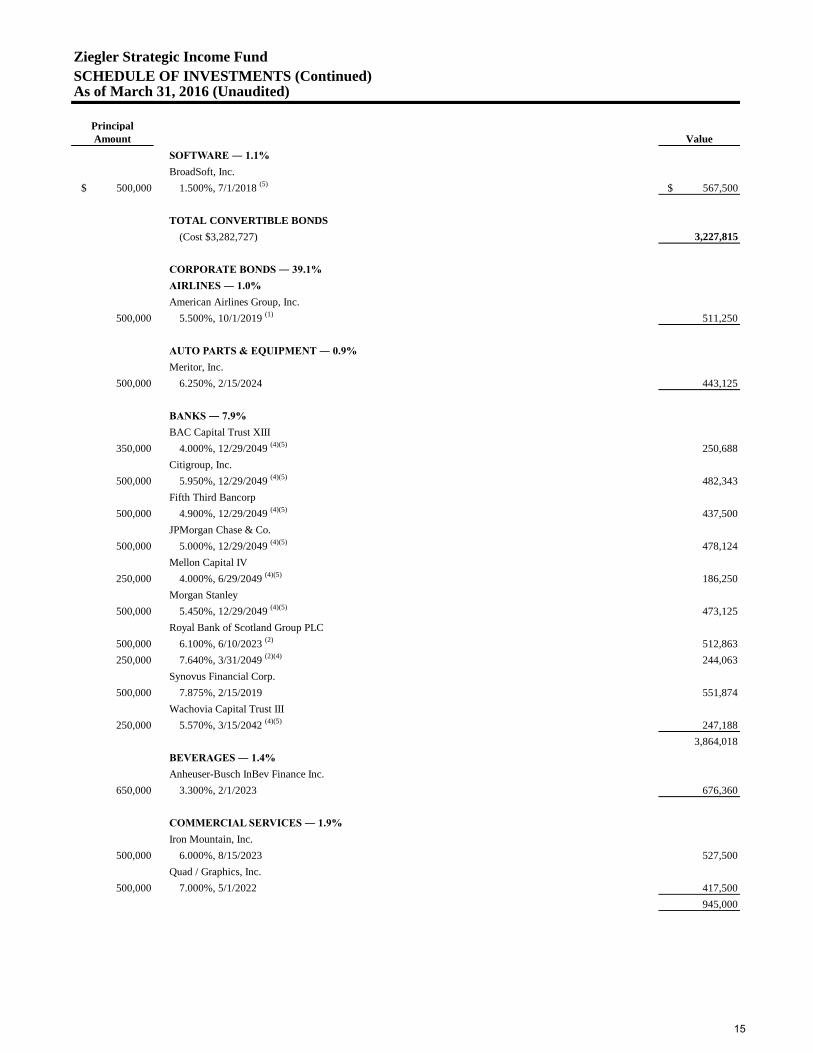
PrincipalAmount Value
SOFTWARE ― 1.1%BroadSoft, Inc.
$ 500,000 1.500%, 7/1/2018 (5) $ 567,500
TOTAL CONVERTIBLE BONDS(Cost $3,282,727) 3,227,815
CORPORATE BONDS ― 39.1%AIRLINES ― 1.0%American Airlines Group, Inc.
500,000 5.500%, 10/1/2019 (1) 511,250
AUTO PARTS & EQUIPMENT ― 0.9%Meritor, Inc.
500,000 6.250%, 2/15/2024 443,125
BANKS ― 7.9%BAC Capital Trust XIII
350,000 4.000%, 12/29/2049 (4)(5) 250,688Citigroup, Inc.
500,000 5.950%, 12/29/2049 (4)(5) 482,343Fifth Third Bancorp
500,000 4.900%, 12/29/2049 (4)(5) 437,500JPMorgan Chase & Co.
500,000 5.000%, 12/29/2049 (4)(5) 478,124Mellon Capital IV
250,000 4.000%, 6/29/2049 (4)(5) 186,250Morgan Stanley
500,000 5.450%, 12/29/2049 (4)(5) 473,125Royal Bank of Scotland Group PLC
500,000 6.100%, 6/10/2023 (2) 512,863250,000 7.640%, 3/31/2049 (2)(4) 244,063
Synovus Financial Corp. 500,000 7.875%, 2/15/2019 551,874
Wachovia Capital Trust III 250,000 5.570%, 3/15/2042 (4)(5) 247,188
3,864,018BEVERAGES ― 1.4%Anheuser-Busch InBev Finance Inc.
650,000 3.300%, 2/1/2023 676,360
COMMERCIAL SERVICES ― 1.9%Iron Mountain, Inc.
500,000 6.000%, 8/15/2023 527,500Quad / Graphics, Inc.
500,000 7.000%, 5/1/2022 417,500945,000
Ziegler Strategic Income FundSCHEDULE OF INVESTMENTS (Continued)As of March 31, 2016 (Unaudited)
15
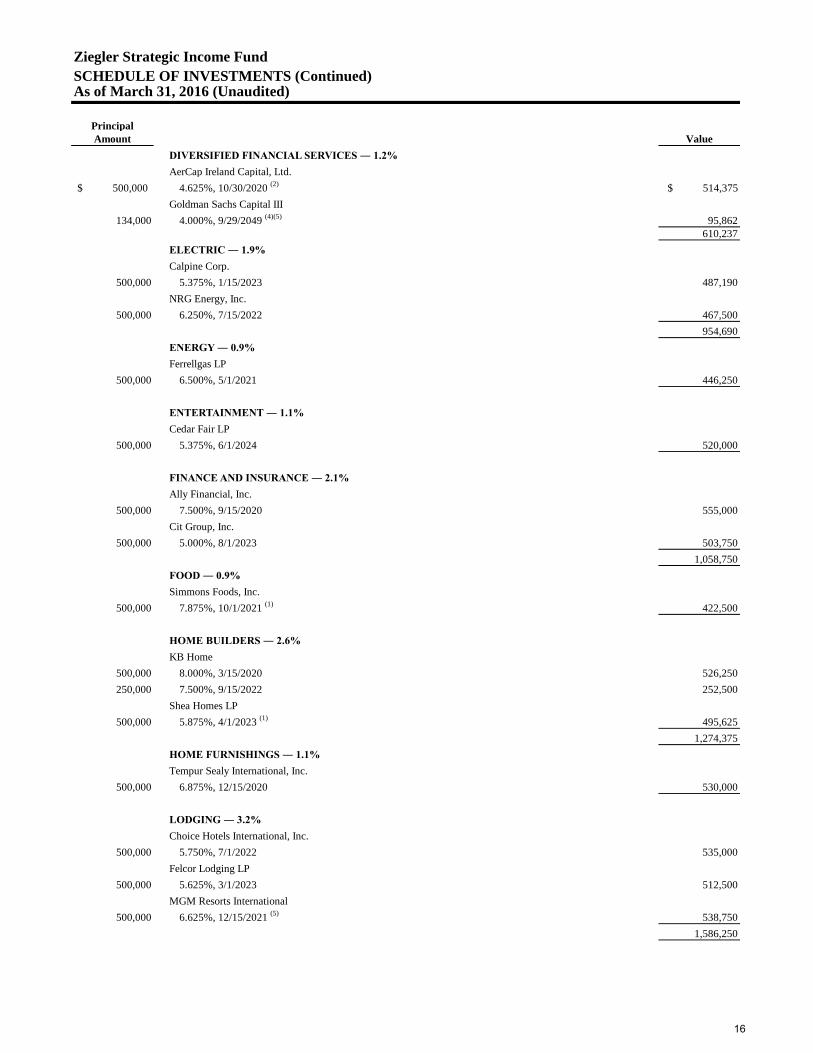
PrincipalAmount Value
DIVERSIFIED FINANCIAL SERVICES ― 1.2%AerCap Ireland Capital, Ltd.
500,000$ 4.625%, 10/30/2020 (2) $ 514,375 Goldman Sachs Capital III
134,000 4.000%, 9/29/2049 (4)(5) 95,862610,237
ELECTRIC ― 1.9%Calpine Corp.
500,000 5.375%, 1/15/2023 487,190NRG Energy, Inc.
500,000 6.250%, 7/15/2022 467,500954,690
ENERGY ― 0.9%Ferrellgas LP
500,000 6.500%, 5/1/2021 446,250
ENTERTAINMENT ― 1.1%Cedar Fair LP
500,000 5.375%, 6/1/2024 520,000
FINANCE AND INSURANCE ― 2.1%Ally Financial, Inc.
500,000 7.500%, 9/15/2020 555,000Cit Group, Inc.
500,000 5.000%, 8/1/2023 503,7501,058,750
FOOD ― 0.9%Simmons Foods, Inc.
500,000 7.875%, 10/1/2021 (1) 422,500
HOME BUILDERS ― 2.6%KB Home
500,000 8.000%, 3/15/2020 526,250250,000 7.500%, 9/15/2022 252,500
Shea Homes LP 500,000 5.875%, 4/1/2023 (1) 495,625
1,274,375HOME FURNISHINGS ― 1.1%Tempur Sealy International, Inc.
500,000 6.875%, 12/15/2020 530,000
LODGING ― 3.2%Choice Hotels International, Inc.
500,000 5.750%, 7/1/2022 535,000Felcor Lodging LP
500,000 5.625%, 3/1/2023 512,500MGM Resorts International
500,000 6.625%, 12/15/2021 (5) 538,7501,586,250
Ziegler Strategic Income FundSCHEDULE OF INVESTMENTS (Continued)As of March 31, 2016 (Unaudited)
16
PrincipalAmount Value
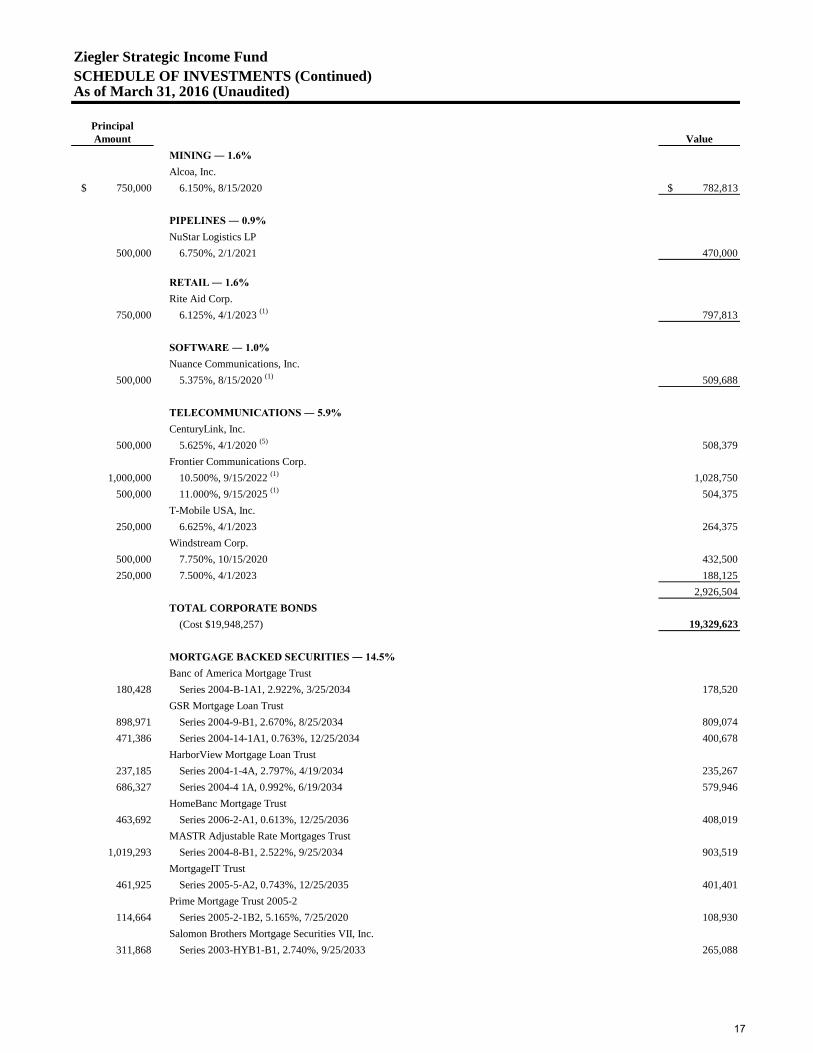
MINING ― 1.6%Alcoa, Inc.
$ 750,000 6.150%, 8/15/2020 $ 782,813
PIPELINES ― 0.9%NuStar Logistics LP
500,000 6.750%, 2/1/2021 470,000
RETAIL ― 1.6%Rite Aid Corp.
750,000 6.125%, 4/1/2023 (1) 797,813
SOFTWARE ― 1.0%Nuance Communications, Inc.
500,000 5.375%, 8/15/2020 (1) 509,688
TELECOMMUNICATIONS ― 5.9%CenturyLink, Inc.
500,000 5.625%, 4/1/2020 (5) 508,379Frontier Communications Corp.
1,000,000 10.500%, 9/15/2022 (1) 1,028,750500,000 11.000%, 9/15/2025 (1) 504,375
T-Mobile USA, Inc.250,000 6.625%, 4/1/2023 264,375
Windstream Corp. 500,000 7.750%, 10/15/2020 432,500250,000 7.500%, 4/1/2023 188,125
2,926,504TOTAL CORPORATE BONDS
(Cost $19,948,257) 19,329,623
MORTGAGE BACKED SECURITIES ― 14.5%Banc of America Mortgage Trust
180,428 Series 2004-B-1A1, 2.922%, 3/25/2034 178,520GSR Mortgage Loan Trust
898,971 Series 2004-9-B1, 2.670%, 8/25/2034 809,074471,386 Series 2004-14-1A1, 0.763%, 12/25/2034 400,678
HarborView Mortgage Loan Trust237,185 Series 2004-1-4A, 2.797%, 4/19/2034 235,267686,327 Series 2004-4 1A, 0.992%, 6/19/2034 579,946
HomeBanc Mortgage Trust 463,692 Series 2006-2-A1, 0.613%, 12/25/2036 408,019
MASTR Adjustable Rate Mortgages Trust 1,019,293 Series 2004-8-B1, 2.522%, 9/25/2034 903,519
MortgageIT Trust 461,925 Series 2005-5-A2, 0.743%, 12/25/2035 401,401
Prime Mortgage Trust 2005-2 114,664 Series 2005-2-1B2, 5.165%, 7/25/2020 108,930
Salomon Brothers Mortgage Securities VII, Inc. 311,868 Series 2003-HYB1-B1, 2.740%, 9/25/2033 265,088
Ziegler Strategic Income FundSCHEDULE OF INVESTMENTS (Continued)As of March 31, 2016 (Unaudited)
17
PrincipalAmount Value
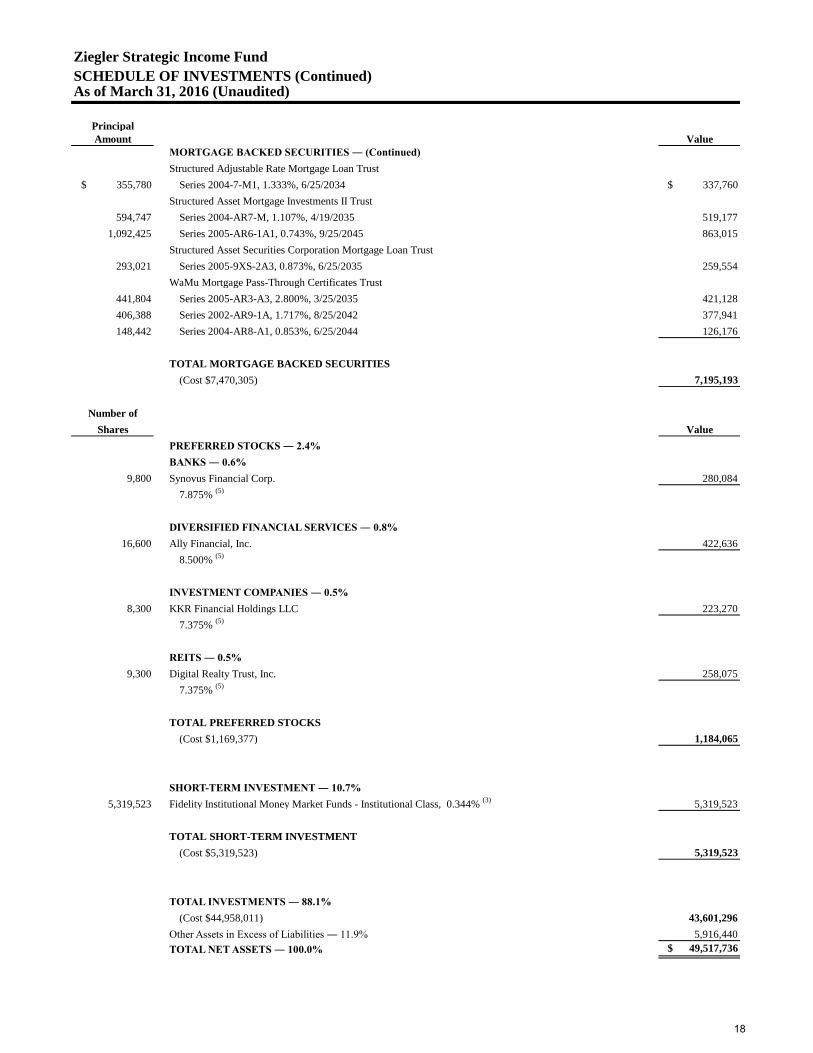
MORTGAGE BACKED SECURITIES ― (Continued)Structured Adjustable Rate Mortgage Loan Trust
$ 355,780 Series 2004-7-M1, 1.333%, 6/25/2034 $ 337,760 Structured Asset Mortgage Investments II Trust
594,747 Series 2004-AR7-M, 1.107%, 4/19/2035 519,1771,092,425 Series 2005-AR6-1A1, 0.743%, 9/25/2045 863,015
Structured Asset Securities Corporation Mortgage Loan Trust 293,021 Series 2005-9XS-2A3, 0.873%, 6/25/2035 259,554
WaMu Mortgage Pass-Through Certificates Trust 441,804 Series 2005-AR3-A3, 2.800%, 3/25/2035 421,128406,388 Series 2002-AR9-1A, 1.717%, 8/25/2042 377,941148,442 Series 2004-AR8-A1, 0.853%, 6/25/2044 126,176
TOTAL MORTGAGE BACKED SECURITIES(Cost $7,470,305) 7,195,193
Number ofShares Value
PREFERRED STOCKS ― 2.4%BANKS ― 0.6%
9,800 Synovus Financial Corp. 280,0847.875% (5)
DIVERSIFIED FINANCIAL SERVICES ― 0.8%16,600 Ally Financial, Inc. 422,636
8.500% (5)
INVESTMENT COMPANIES ― 0.5%8,300 KKR Financial Holdings LLC 223,270
7.375% (5)
REITS ― 0.5%9,300 Digital Realty Trust, Inc. 258,075
7.375% (5)
TOTAL PREFERRED STOCKS(Cost $1,169,377) 1,184,065
SHORT-TERM INVESTMENT ― 10.7%5,319,523 Fidelity Institutional Money Market Funds - Institutional Class, 0.344% (3) 5,319,523
TOTAL SHORT-TERM INVESTMENT(Cost $5,319,523) 5,319,523
TOTAL INVESTMENTS ― 88.1%(Cost $44,958,011) 43,601,296
Other Assets in Excess of Liabilities ― 11.9% 5,916,440TOTAL NET ASSETS ― 100.0% $ 49,517,736
Ziegler Strategic Income FundSCHEDULE OF INVESTMENTS (Continued)As of March 31, 2016 (Unaudited)
18
The accompanying notes are an integral part of these financial statements.
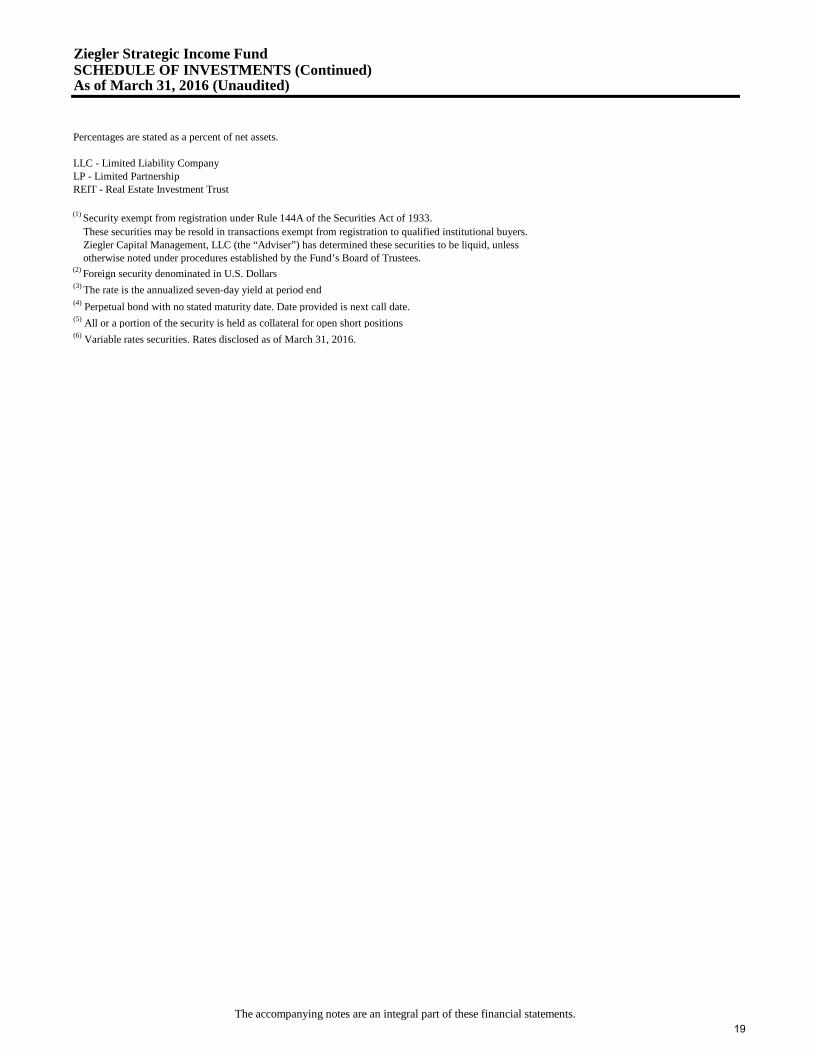
Percentages are stated as a percent of net assets.
LLC - Limited Liability Company LP - Limited Partnership REIT - Real Estate Investment Trust
(1) Security exempt from registration under Rule 144A of the Securities Act of 1933.These securities may be resold in transactions exempt from registration to qualified institutional buyers.Ziegler Capital Management, LLC (the “Adviser”) has determined these securities to be liquid, unlessotherwise noted under procedures established by the Fund’s Board of Trustees.
(2) Foreign security denominated in U.S. Dollars(3) The rate is the annualized seven-day yield at period end(4) Perpetual bond with no stated maturity date. Date provided is next call date.(5) All or a portion of the security is held as collateral for open short positions(6) Variable rates securities. Rates disclosed as of March 31, 2016.
Ziegler Strategic Income FundSCHEDULE OF INVESTMENTS (Continued)As of March 31, 2016 (Unaudited)
19
The accompanying notes are an integral part of these financial statements.
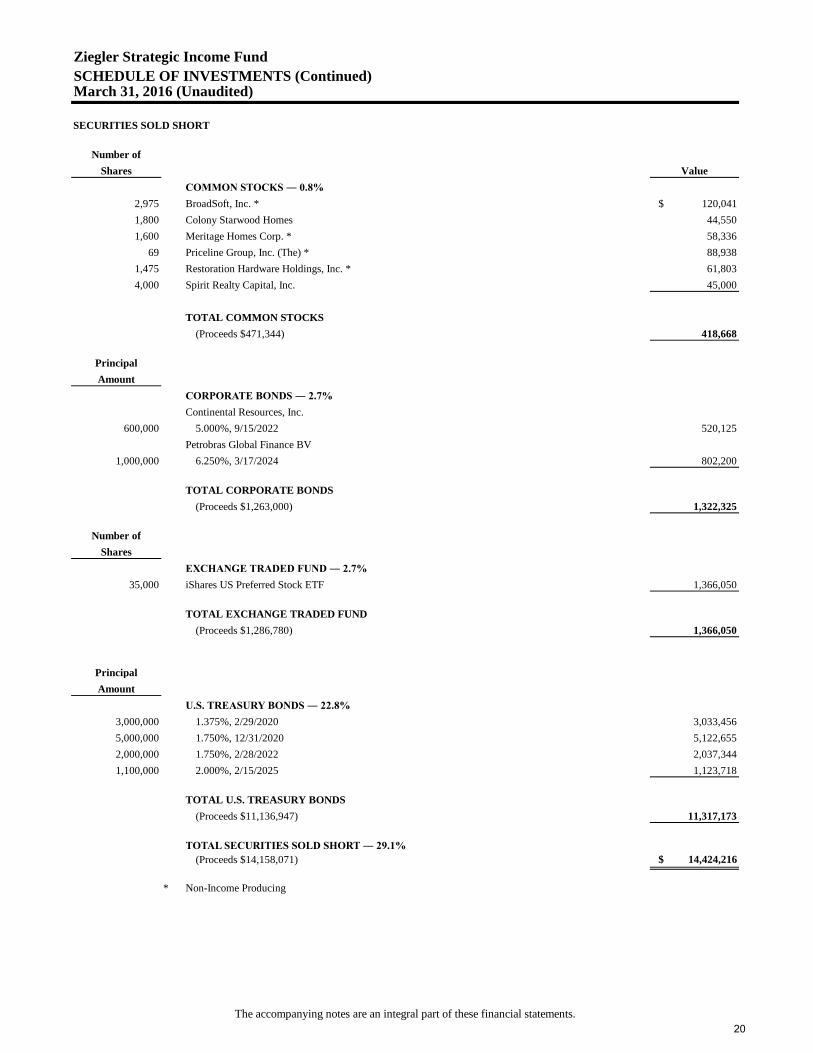
SECURITIES SOLD SHORT
Number ofShares Value
COMMON STOCKS ― 0.8%2,975 BroadSoft, Inc. * $ 120,041 1,800 Colony Starwood Homes 44,5501,600 Meritage Homes Corp. * 58,336
69 Priceline Group, Inc. (The) * 88,9381,475 Restoration Hardware Holdings, Inc. * 61,8034,000 Spirit Realty Capital, Inc. 45,000
TOTAL COMMON STOCKS(Proceeds $471,344) 418,668
PrincipalAmount
CORPORATE BONDS ― 2.7%Continental Resources, Inc.
600,000 5.000%, 9/15/2022 520,125Petrobras Global Finance BV
1,000,000 6.250%, 3/17/2024 802,200
TOTAL CORPORATE BONDS(Proceeds $1,263,000) 1,322,325
Number ofShares
EXCHANGE TRADED FUND ― 2.7%35,000 iShares US Preferred Stock ETF 1,366,050
TOTAL EXCHANGE TRADED FUND(Proceeds $1,286,780) 1,366,050
PrincipalAmount
U.S. TREASURY BONDS ― 22.8%3,000,000 1.375%, 2/29/2020 3,033,4565,000,000 1.750%, 12/31/2020 5,122,6552,000,000 1.750%, 2/28/2022 2,037,3441,100,000 2.000%, 2/15/2025 1,123,718
TOTAL U.S. TREASURY BONDS(Proceeds $11,136,947) 11,317,173
TOTAL SECURITIES SOLD SHORT ― 29.1%(Proceeds $14,158,071) $ 14,424,216
* Non-Income Producing
Ziegler Strategic Income FundSCHEDULE OF INVESTMENTS (Continued)March 31, 2016 (Unaudited)
20
The accompanying notes are an integral part of these financial statements.
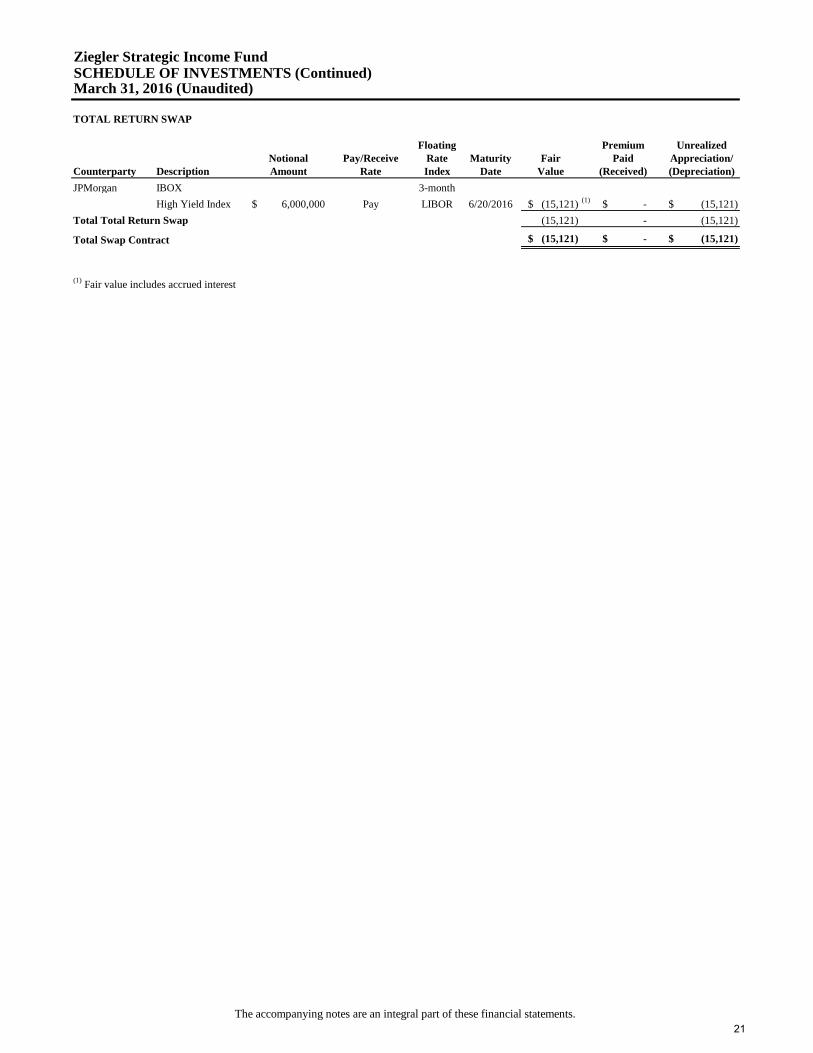
Floating Premium Unrealized Notional Pay/Receive Rate Maturity Fair Paid Appreciation/
Counterparty Description Amount Rate Index Date Value (Received) (Depreciation)JPMorgan IBOX 3-month
High Yield Index $ 6,000,000 Pay LIBOR 6/20/2016 $ (15,121) (1) $ - $ (15,121) (15,121) - (15,121) $ (15,121) $ - $ (15,121)
(1) Fair value includes accrued interest
Total Total Return Swap
Total Swap Contract
Ziegler Strategic Income FundSCHEDULE OF INVESTMENTS (Continued)March 31, 2016 (Unaudited)
TOTAL RETURN SWAP
21
The accompanying notes are an integral part of these financial statements.
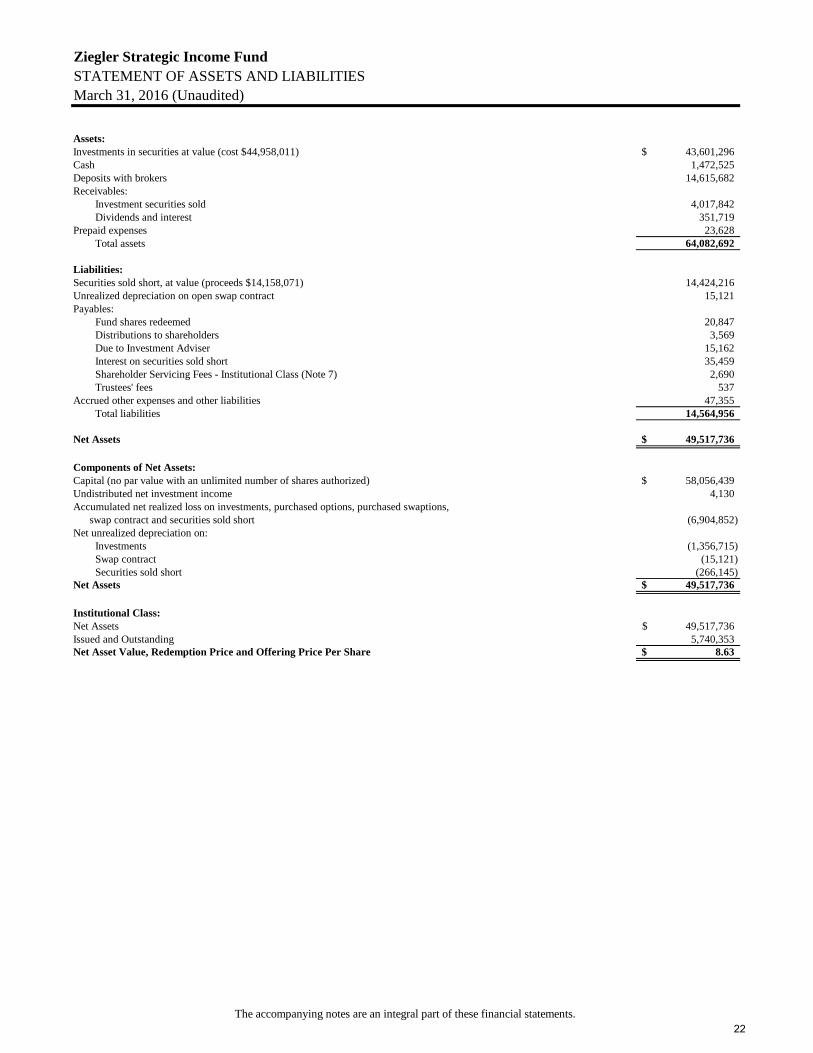
Ziegler Strategic Income FundSTATEMENT OF ASSETS AND LIABILITIESMarch 31, 2016 (Unaudited)
Assets:Investments in securities at value (cost $44,958,011) 43,601,296$ Cash 1,472,525 Deposits with brokers 14,615,682 Receivables:
Investment securities sold 4,017,842 Dividends and interest 351,719
Prepaid expenses 23,628 Total assets 64,082,692
Liabilities:Securities sold short, at value (proceeds $14,158,071) 14,424,216 Unrealized depreciation on open swap contract 15,121 Payables:
Fund shares redeemed 20,847 Distributions to shareholders 3,569 Due to Investment Adviser 15,162 Interest on securities sold short 35,459 Shareholder Servicing Fees - Institutional Class (Note 7) 2,690 Trustees' fees 537
Accrued other expenses and other liabilities 47,355 Total liabilities 14,564,956
Net Assets 49,517,736$
Components of Net Assets:Capital (no par value with an unlimited number of shares authorized) 58,056,439$ Undistributed net investment income 4,130 Accumulated net realized loss on investments, purchased options, purchased swaptions, swap contract and securities sold short (6,904,852) Net unrealized depreciation on:
Investments (1,356,715) Swap contract (15,121) Securities sold short (266,145)
Net Assets 49,517,736$
Institutional Class:Net Assets 49,517,736$ Issued and Outstanding 5,740,353 Net Asset Value, Redemption Price and Offering Price Per Share 8.63$
22
The accompanying notes are an integral part of these financial statements.
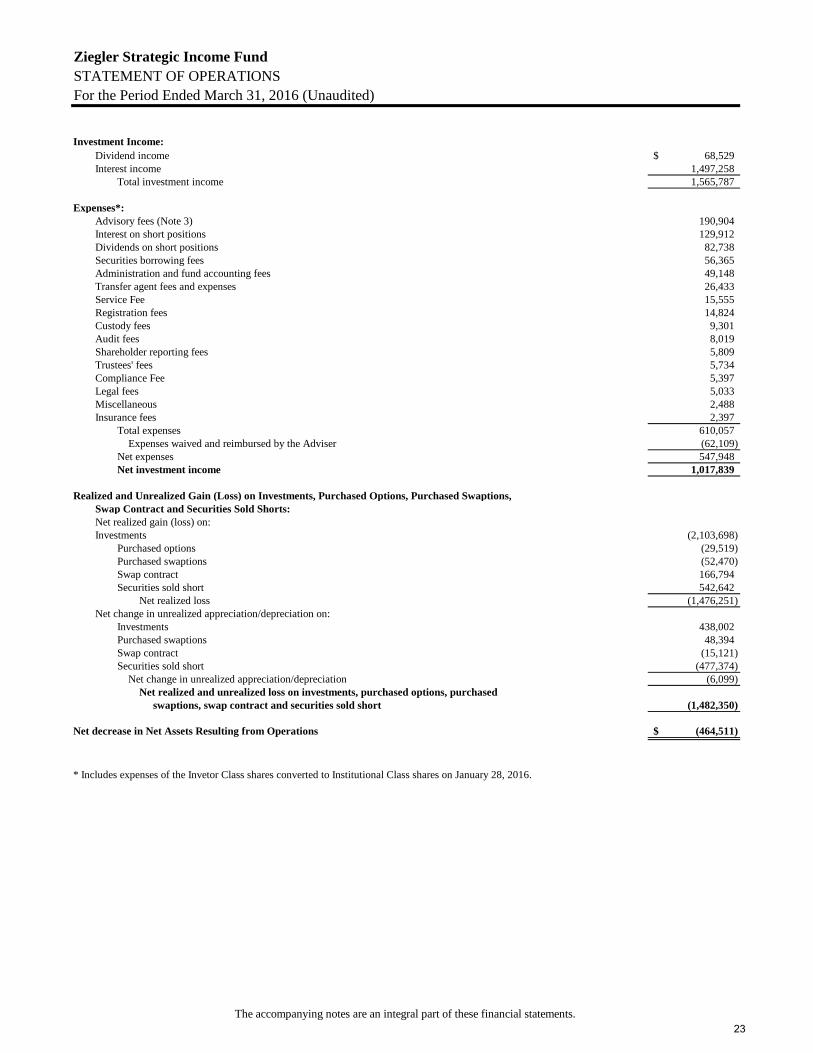
Ziegler Strategic Income FundSTATEMENT OF OPERATIONSFor the Period Ended March 31, 2016 (Unaudited)
Investment Income:Dividend income 68,529$ Interest income 1,497,258
Total investment income 1,565,787
Expenses*:Advisory fees (Note 3) 190,904 Interest on short positions 129,912 Dividends on short positions 82,738 Securities borrowing fees 56,365 Administration and fund accounting fees 49,148 Transfer agent fees and expenses 26,433 Service Fee 15,555 Registration fees 14,824 Custody fees 9,301 Audit fees 8,019 Shareholder reporting fees 5,809 Trustees' fees 5,734 Compliance Fee 5,397 Legal fees 5,033 Miscellaneous 2,488 Insurance fees 2,397
Total expenses 610,057 Expenses waived and reimbursed by the Adviser (62,109)
Net expenses 547,948 Net investment income 1,017,839
Realized and Unrealized Gain (Loss) on Investments, Purchased Options, Purchased Swaptions,Swap Contract and Securities Sold Shorts:Net realized gain (loss) on:Investments (2,103,698)
Purchased options (29,519) Purchased swaptions (52,470) Swap contract 166,794 Securities sold short 542,642
Net realized loss (1,476,251) Net change in unrealized appreciation/depreciation on:
Investments 438,002 Purchased swaptions 48,394 Swap contract (15,121) Securities sold short (477,374)
Net change in unrealized appreciation/depreciation (6,099) Net realized and unrealized loss on investments, purchased options, purchased
swaptions, swap contract and securities sold short (1,482,350)
Net decrease in Net Assets Resulting from Operations (464,511)$
* Includes expenses of the Invetor Class shares converted to Institutional Class shares on January 28, 2016.
23
The accompanying notes are an integral part of these financial statements.
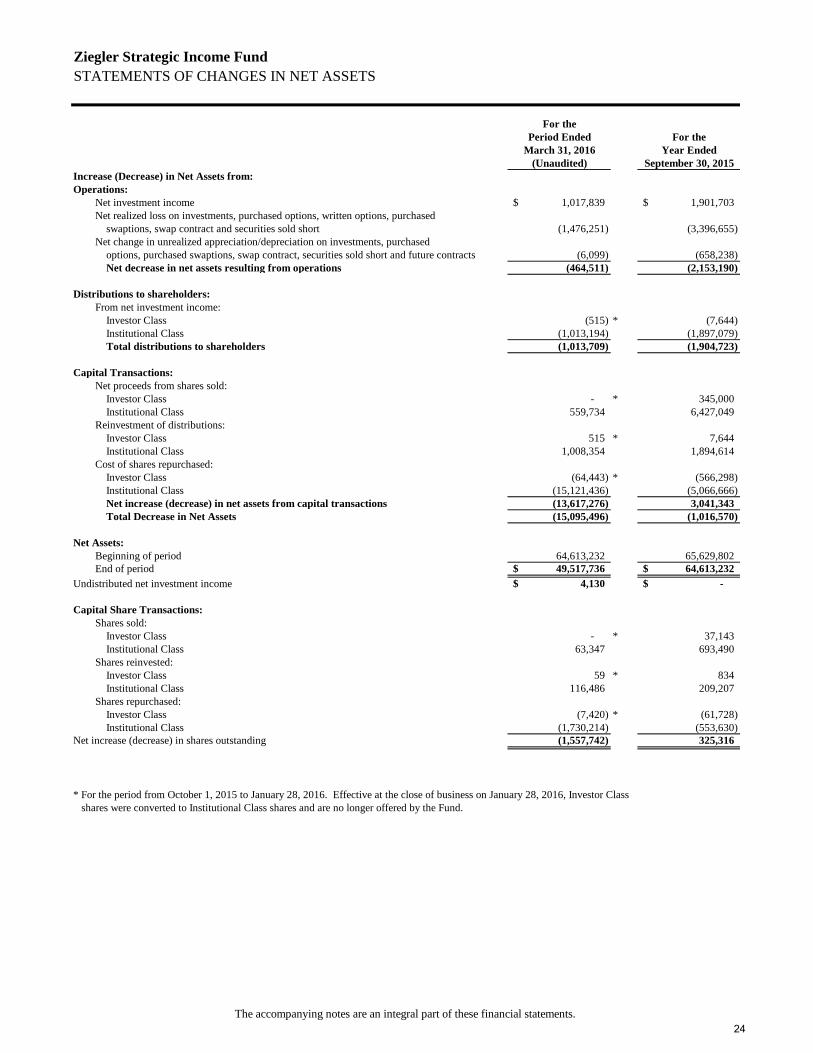
Ziegler Strategic Income FundSTATEMENTS OF CHANGES IN NET ASSETS
For thePeriod Ended For the
March 31, 2016 Year Ended (Unaudited) September 30, 2015
Increase (Decrease) in Net Assets from:Operations:
Net investment income 1,017,839$ 1,901,703$ Net realized loss on investments, purchased options, written options, purchased
swaptions, swap contract and securities sold short (1,476,251) (3,396,655) Net change in unrealized appreciation/depreciation on investments, purchased
options, purchased swaptions, swap contract, securities sold short and future contracts (6,099) (658,238) Net decrease in net assets resulting from operations (464,511) (2,153,190)
Distributions to shareholders:From net investment income:
Investor Class (515) * (7,644) Institutional Class (1,013,194) (1,897,079) Total distributions to shareholders (1,013,709) (1,904,723)
Capital Transactions:Net proceeds from shares sold:
Investor Class - * 345,000 Institutional Class 559,734 6,427,049
Reinvestment of distributions:Investor Class 515 * 7,644 Institutional Class 1,008,354 1,894,614
Cost of shares repurchased:Investor Class (64,443) * (566,298) Institutional Class (15,121,436) (5,066,666) Net increase (decrease) in net assets from capital transactions (13,617,276) 3,041,343 Total Decrease in Net Assets (15,095,496) (1,016,570)
Net Assets:Beginning of period 64,613,232 65,629,802 End of period 49,517,736$ 64,613,232$
Undistributed net investment income 4,130$ -$
Capital Share Transactions:Shares sold:
Investor Class - * 37,143 Institutional Class 63,347 693,490
Shares reinvested:Investor Class 59 * 834 Institutional Class 116,486 209,207
Shares repurchased:Investor Class (7,420) * (61,728) Institutional Class (1,730,214) (553,630)
Net increase (decrease) in shares outstanding (1,557,742) 325,316
* For the period from October 1, 2015 to January 28, 2016. Effective at the close of business on January 28, 2016, Investor Classshares were converted to Institutional Class shares and are no longer offered by the Fund.
24
The accompanying notes are an integral part of these financial statements.
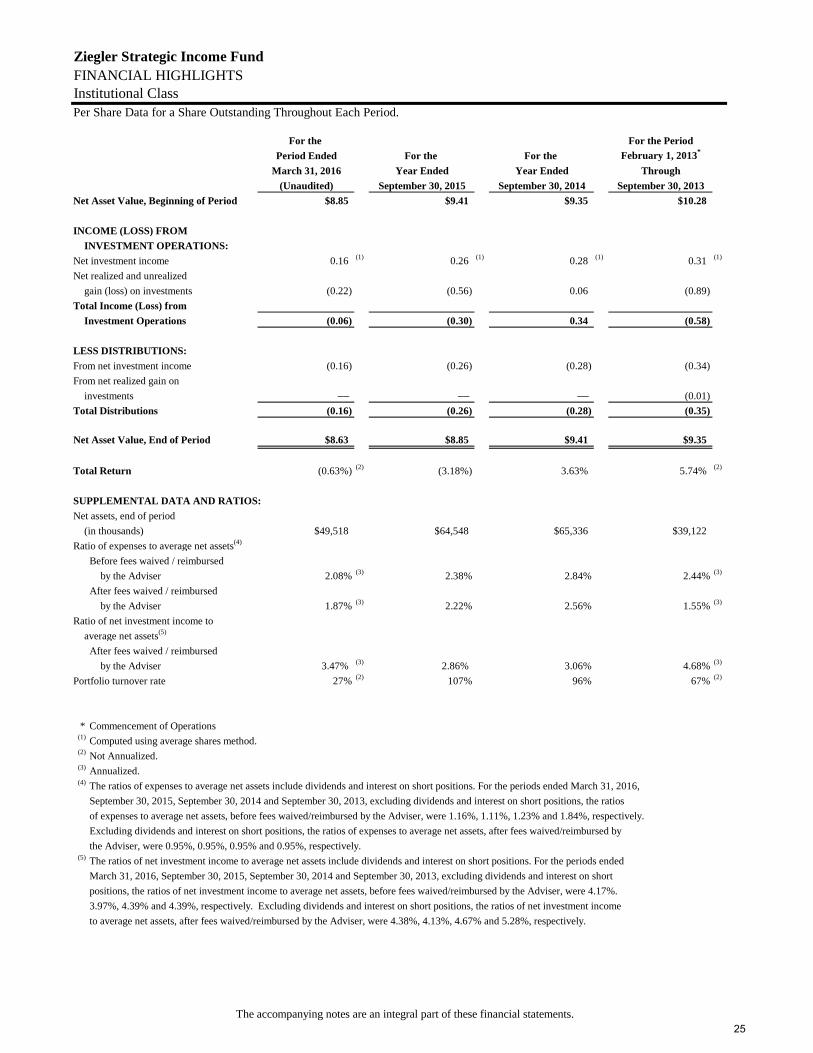
Ziegler Strategic Income FundFINANCIAL HIGHLIGHTSInstitutional ClassPer Share Data for a Share Outstanding Throughout Each Period.
For the For the PeriodPeriod Ended For the For the February 1, 2013*
March 31, 2016 Year Ended Year Ended Through(Unaudited) September 30, 2015 September 30, 2014 September 30, 2013
Net Asset Value, Beginning of Period $8.85 $9.41 $9.35 $10.28
INCOME (LOSS) FROMINVESTMENT OPERATIONS:
Net investment income 0.16 (1) 0.26 (1) 0.28 (1) 0.31 (1)
Net realized and unrealizedgain (loss) on investments (0.22) (0.56) 0.06 (0.89)
Total Income (Loss) fromInvestment Operations (0.06) (0.30) 0.34 (0.58)
LESS DISTRIBUTIONS:From net investment income (0.16) (0.26) (0.28) (0.34)From net realized gain on
investments –– –– –– (0.01)Total Distributions (0.16) (0.26) (0.28) (0.35)
Net Asset Value, End of Period $8.63 $8.85 $9.41 $9.35
Total Return (0.63%) (2) (3.18%) 3.63% 5.74% (2)
SUPPLEMENTAL DATA AND RATIOS:Net assets, end of period
(in thousands) $49,518 $64,548 $65,336 $39,122Ratio of expenses to average net assets(4)
Before fees waived / reimbursedby the Adviser 2.08% (3) 2.38% 2.84% 2.44% (3)
After fees waived / reimbursedby the Adviser 1.87% (3) 2.22% 2.56% 1.55% (3)
Ratio of net investment income toaverage net assets(5)
After fees waived / reimbursedby the Adviser 3.47% (3) 2.86% 3.06% 4.68% (3)
Portfolio turnover rate 27% (2) 107% 96% 67% (2)
* Commencement of Operations(1) Computed using average shares method.(2) Not Annualized.(3) Annualized.(4) The ratios of expenses to average net assets include dividends and interest on short positions. For the periods ended March 31, 2016,
September 30, 2015, September 30, 2014 and September 30, 2013, excluding dividends and interest on short positions, the ratiosof expenses to average net assets, before fees waived/reimbursed by the Adviser, were 1.16%, 1.11%, 1.23% and 1.84%, respectively.Excluding dividends and interest on short positions, the ratios of expenses to average net assets, after fees waived/reimbursed bythe Adviser, were 0.95%, 0.95%, 0.95% and 0.95%, respectively.
(5) The ratios of net investment income to average net assets include dividends and interest on short positions. For the periods endedMarch 31, 2016, September 30, 2015, September 30, 2014 and September 30, 2013, excluding dividends and interest on shortpositions, the ratios of net investment income to average net assets, before fees waived/reimbursed by the Adviser, were 4.17%.3.97%, 4.39% and 4.39%, respectively. Excluding dividends and interest on short positions, the ratios of net investment incometo average net assets, after fees waived/reimbursed by the Adviser, were 4.38%, 4.13%, 4.67% and 5.28%, respectively.
25
Ziegler Funds NOTES TO FINANCIAL STATEMENTS March 31, 2016 (Unaudited)
NOTE 1 – ORGANIZATION
The Ziegler FAMCO Covered Call Fund (the “Covered Called Fund”) and the Ziegler Strategic Income Fund (the “Strategic Income Fund”), collectively, the “Funds”) are each a separate series of Trust for Advised Portfolios (the “Trust”). The Trust was organized on August 29, 2003, as a Delaware Statutory Trust and is registered under the Investment Company Act of 1940, as amended (the “1940 Act”) as an open-end investment management company. Prior to January 1, 2014, the Trust was previously registered as the Ziegler Capital Management Investment Trust” “Ziegler Lotsoff Capital Management Investment Trust” and “Lotsoff Capital Management Investment Trust”.
The Covered Call Fund is registered as a diversified investment series of the Trust. The Fund seeks long-term capital appreciation by investing in a portfolio of equity securities and writing (selling) call options. The Fund offers three classes of shares: Class A, Class C and Institutional Class. The Fund commenced operations on December 1, 2015. Each class of shares represents an equal pro rata interest in the Fund, except that they have different expenses, which reflects the difference in the range of services provided to them. Income and expenses (other than those attributable to a specific class), and realized and unrealized gains and losses on investments are allocated to each class based on relative net assets on a daily basis.
The Strategic Income Fund is registered as a non-diversified investment series of the Trust. The Fund seeks to provide high current income and capital appreciation by investing in U.S. and foreign debt securities, both investment and non-investment grade credit quality. The Fund currently offers one class of shares: Institutional Class. The Fund commenced operations on January 31, 2012, and the outstanding shares of the Fund were renamed Investor Class shares on February 1, 2013. The Institutional Class commenced operations on February 1, 2013. On January 29, 2016, the Fund converted its Investor Class shares into Institutional Class shares of the Fund.
NOTE 2 – SIGNIFICANT ACCOUNTING POLICIES
The following is a summary of significant accounting policies consistently followed by the Trust in the preparation of its financial statements. These policies are in conformity with accounting principles generally accepted in the United States of America (“GAAP”) for investment companies. The presentation of financial statements in conformity with GAAP requires management to make estimates and assumptions that affect the reported amounts of assets and liabilities and disclosure of contingent assets and liabilities at the date of the financial statements and the reported amounts of income and expenses during the period reported. Actual results may differ from those estimates.
(a) Securities Valuation – Investments in securities traded on a national securities exchange are valued at the last reportedsales price on the exchange on which the security is principally traded. Securities traded on the NASDAQ exchanges arevalued at the NASDAQ Official Closing Price (“NOCP”). Exchange-traded securities for which no sale was reported andNASDAQ securities for which there is no NOCP are valued at the mean of the most recent quoted bid and ask prices.Unlisted securities held by the Funds are valued at the last sale price in the over-the-counter (“OTC”) market. If there is notrading on a particular day, the mean between the last quoted bid and ask price is used.
Long-term fixed income securities are valued using prices provided by an independent pricing service approved by the Board of Trustees. Pricing services may use various valuation methodologies, including matrix pricing and other analytical models as well as market transactions and dealer quotations. Short-term investments are valued at amortized cost, which approximates fair value. If amortized cost does not approximate fair value, short term securities are reported at fair value. Swaps, options, swaptions and any other financial derivatives not traded on an exchange, are valued by an independent pricing service using pricing models. Securities for which market quotations are not readily available are valued at their estimated fair value as determined in good faith by Ziegler Capital Management, LLC (the “Adviser” or “Ziegler”) under procedures established by and under the general supervision and responsibility of the Trust’s Board of Trustees (the “Board”).
The fair value of bank loans is generally valued using recently executed transactions, market price quotations (where observable) and market observable credit default swap levels. Fair value is based on the average of one or more broker quotes received. When quotations are unobservable, proprietary valuation models and default recovery analysis methods are employed. Bank debt is generally categorized in Level 2 or 3 of the fair value hierarchy, depending on the use and availability of observable inputs. As of March 31, 2016, the Strategic Income Fund had outstanding bank loans as listed on the Schedule of Investments.
26
Ziegler Funds NOTES TO FINANCIAL STATEMENTS (Continued) March 31, 2016 (Unaudited)
Various inputs are used in determining the value of the Funds’ investments. These inputs are summarized into three broad levels and described below:
Level 1 - quoted prices in active markets for identical securities. An active market for the security is a market in which transactions occur with sufficient frequency and volume to provide pricing information on an ongoing basis. A quoted price in an active market provides the most reliable evidence of fair value.
Level 2 - observable inputs other than quoted prices included in level 1 that are observable for the asset or liability either directly or indirectly. These inputs may include quoted prices for the identical instrument on an inactive market, prices for similar instruments, interest rates, prepayment speeds, credit risk, yield curves, default rates, and similar data.
Level 3 - significant unobservable inputs, including the Funds’ own assumptions in determining the fair value of investments.
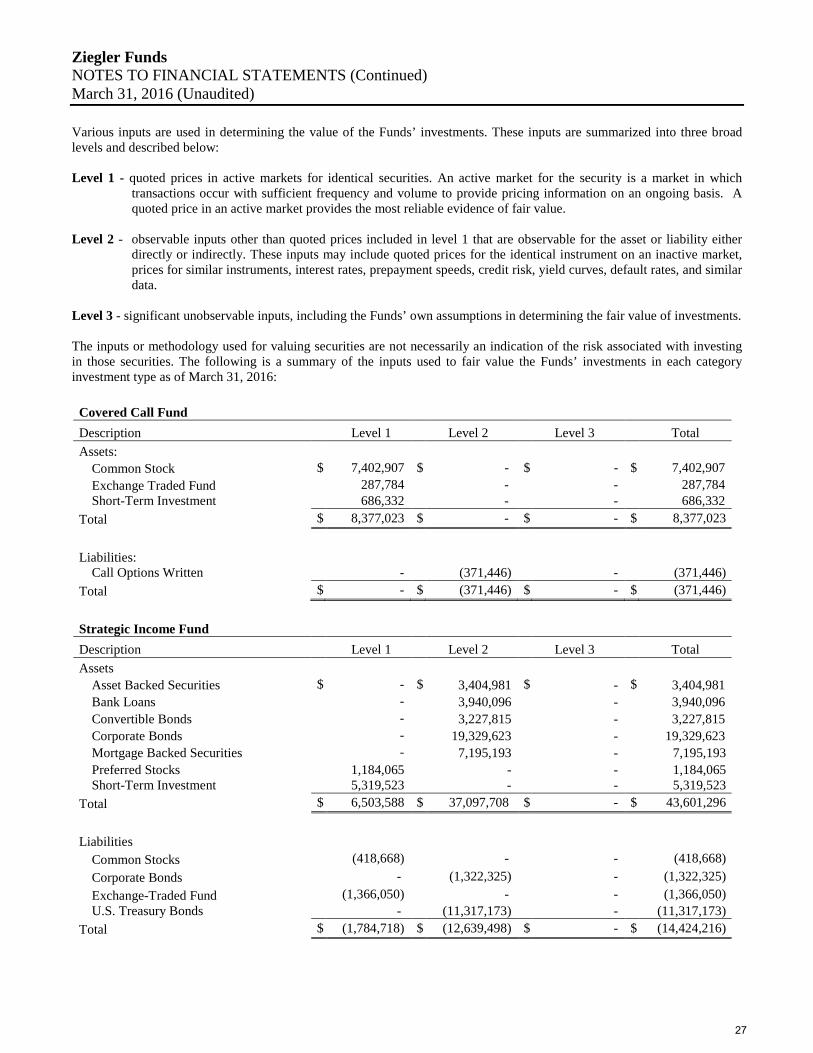
The inputs or methodology used for valuing securities are not necessarily an indication of the risk associated with investing in those securities. The following is a summary of the inputs used to fair value the Funds’ investments in each category investment type as of March 31, 2016:
Covered Call Fund Description Level 1 Level 2 Level 3 Total Assets:
Common Stock $ 7,402,907 $ - $ - $ 7,402,907 Exchange Traded Fund 287,784 - - 287,784 Short-Term Investment 686,332 - - 686,332
Total $ 8,377,023 $ - $ - $ 8,377,023
Liabilities: Call Options Written - (371,446) - (371,446)
Total $ - $ (371,446) $ - $ (371,446)
Strategic Income Fund Description Level 1 Level 2 Level 3 Total Assets
Asset Backed Securities $ - $ 3,404,981 $ - $ 3,404,981 Bank Loans - 3,940,096 - 3,940,096Convertible Bonds - 3,227,815 - 3,227,815Corporate Bonds - 19,329,623 - 19,329,623Mortgage Backed Securities - 7,195,193 - 7,195,193Preferred Stocks 1,184,065 - - 1,184,065Short-Term Investment 5,319,523 - - 5,319,523
Total $ 6,503,588 $ 37,097,708 $ - $ 43,601,296
Liabilities Common Stocks (418,668) - - (418,668) Corporate Bonds - (1,322,325) - (1,322,325)Exchange-Traded Fund (1,366,050) - - (1,366,050)U.S. Treasury Bonds - (11,317,173) - (11,317,173)
Total $ (1,784,718) $ (12,639,498) $ - $ (14,424,216)
27
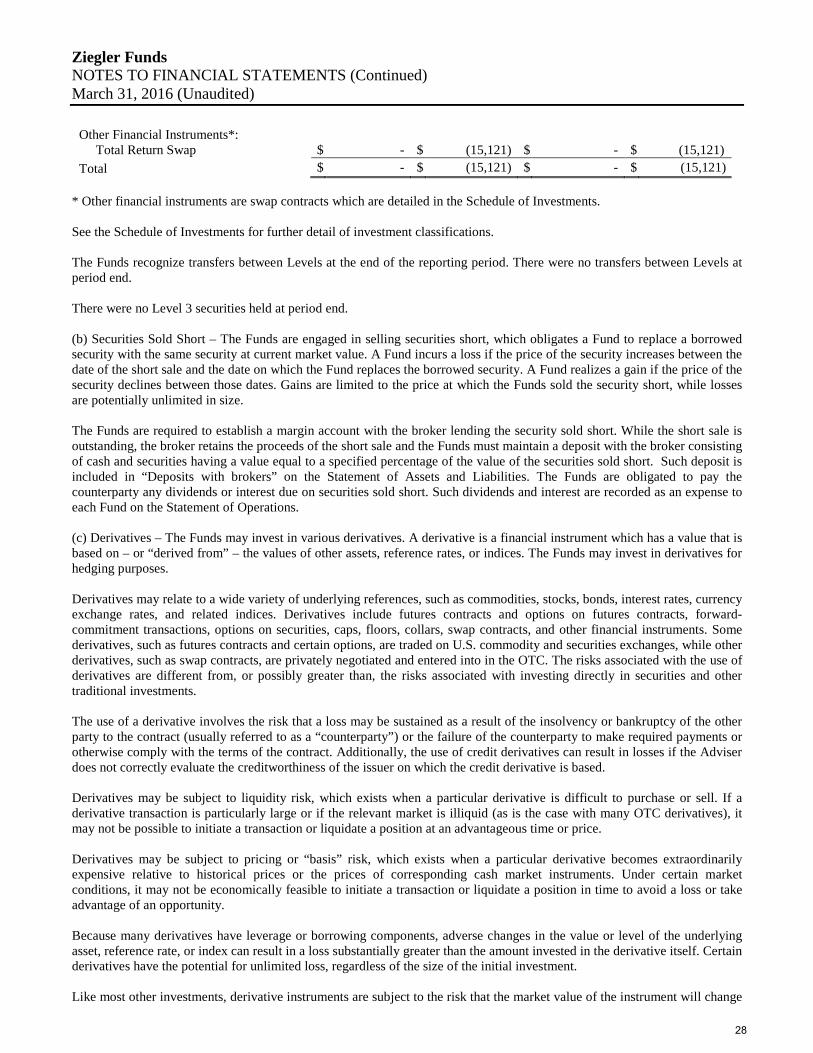
Ziegler Funds NOTES TO FINANCIAL STATEMENTS (Continued) March 31, 2016 (Unaudited)
Other Financial Instruments*: Total Return Swap $ - $ (15,121) $ - $ (15,121)
Total $ - $ (15,121) $ - $ (15,121)
* Other financial instruments are swap contracts which are detailed in the Schedule of Investments.
See the Schedule of Investments for further detail of investment classifications.
The Funds recognize transfers between Levels at the end of the reporting period. There were no transfers between Levels at period end.
There were no Level 3 securities held at period end.
(b) Securities Sold Short – The Funds are engaged in selling securities short, which obligates a Fund to replace a borrowedsecurity with the same security at current market value. A Fund incurs a loss if the price of the security increases between thedate of the short sale and the date on which the Fund replaces the borrowed security. A Fund realizes a gain if the price of thesecurity declines between those dates. Gains are limited to the price at which the Funds sold the security short, while lossesare potentially unlimited in size.
The Funds are required to establish a margin account with the broker lending the security sold short. While the short sale is outstanding, the broker retains the proceeds of the short sale and the Funds must maintain a deposit with the broker consisting of cash and securities having a value equal to a specified percentage of the value of the securities sold short. Such deposit is included in “Deposits with brokers” on the Statement of Assets and Liabilities. The Funds are obligated to pay the counterparty any dividends or interest due on securities sold short. Such dividends and interest are recorded as an expense to each Fund on the Statement of Operations.
(c) Derivatives – The Funds may invest in various derivatives. A derivative is a financial instrument which has a value that isbased on – or “derived from” – the values of other assets, reference rates, or indices. The Funds may invest in derivatives forhedging purposes.
Derivatives may relate to a wide variety of underlying references, such as commodities, stocks, bonds, interest rates, currency exchange rates, and related indices. Derivatives include futures contracts and options on futures contracts, forward-commitment transactions, options on securities, caps, floors, collars, swap contracts, and other financial instruments. Some derivatives, such as futures contracts and certain options, are traded on U.S. commodity and securities exchanges, while other derivatives, such as swap contracts, are privately negotiated and entered into in the OTC. The risks associated with the use of derivatives are different from, or possibly greater than, the risks associated with investing directly in securities and other traditional investments.
The use of a derivative involves the risk that a loss may be sustained as a result of the insolvency or bankruptcy of the other party to the contract (usually referred to as a “counterparty”) or the failure of the counterparty to make required payments or otherwise comply with the terms of the contract. Additionally, the use of credit derivatives can result in losses if the Adviser does not correctly evaluate the creditworthiness of the issuer on which the credit derivative is based.
Derivatives may be subject to liquidity risk, which exists when a particular derivative is difficult to purchase or sell. If a derivative transaction is particularly large or if the relevant market is illiquid (as is the case with many OTC derivatives), it may not be possible to initiate a transaction or liquidate a position at an advantageous time or price.
Derivatives may be subject to pricing or “basis” risk, which exists when a particular derivative becomes extraordinarily expensive relative to historical prices or the prices of corresponding cash market instruments. Under certain market conditions, it may not be economically feasible to initiate a transaction or liquidate a position in time to avoid a loss or take advantage of an opportunity.
Because many derivatives have leverage or borrowing components, adverse changes in the value or level of the underlying asset, reference rate, or index can result in a loss substantially greater than the amount invested in the derivative itself. Certain derivatives have the potential for unlimited loss, regardless of the size of the initial investment.
Like most other investments, derivative instruments are subject to the risk that the market value of the instrument will change
28
Ziegler Funds NOTES TO FINANCIAL STATEMENTS (Continued) March 31, 2016 (Unaudited)
in a way detrimental to the Funds’ interest. The Funds bear the risk that the Adviser will incorrectly forecast future market trends or the values of assets, reference rates, indices, or other financial or economic factors in establishing derivative positions for the Funds. If the Adviser attempts to use a derivative as a hedge against, or as a substitute for, a portfolio investment, the Funds will be exposed to the risk that the derivative will have or will develop an imperfect or no correlation with the portfolio investment. This could cause substantial losses for the Funds. While hedging strategies involving derivative instruments can reduce the risk of loss, they can also reduce the opportunity for gain or even result in losses by offsetting favorable price movements in other investments. Many derivatives, in particular OTC derivatives, are complex and often valued subjectively. Improper valuations can result in increased cash payment requirements to counterparties or a loss of value to the Funds.
The following provides more information on specific types of derivatives and activity in the Funds. The use of derivative instruments by the Funds for the period ended March 31, 2016 was related to the use written options and swap contracts.
Swap Contracts – The Strategic Income Fund may engage in various swap transactions. The Fund may engage in total return swaps, in which payments made by the Fund or the counterparty are based on the total return of a particular reference asset or portfolio of assets (such as a single security, combination or “basket” of securities, or an index). The value of the Fund’s swap positions increase or decrease depending on the changes in value of the underlying rates, currency values, volatility or other indices or measures. The Fund may engage in credit default swaps which involve the exchange of a periodic premium for protection against a defined credit event (such as payment default, refinancing or bankruptcy). Under the terms of a credit default swap contract, one party acts as a guarantor receiving a periodic payment that is a fixed percentage applied to a notional amount. In return, the party agrees to purchase the notional amount of the underlying instrument, at par, if a credit event occurs during the term of the contract. The Fund may enter into credit default swaps in which the Fund acts as guarantor, and may enter into credit default swaps in which the counterparty acts as guarantor.
Swap premiums paid to or by the Fund are accrued daily and included in realized gain (loss) on swaps. Swap contracts are marked-to-market daily using fair value estimates provided by an independent pricing service. Changes in value are recorded as unrealized appreciation (depreciation). Unrealized gains are reported as an asset and unrealized losses are reported as a liability. The change in value of swaps, including accruals of periodic amounts of interest to be paid or received on swaps is reported as unrealized gains or losses. Gains or losses are realized upon termination of the contracts. The risk of loss under a swap contract may exceed the amount recorded as an asset or a liability on the Statement of Assets and Liabilities. The notional amount of a swap contract is the reference amount pursuant to which the counterparties make payments. For swaps in which the referenced obligation is an index, in the event of default of any debt security included in the corresponding index, the Fund pays or receives the percentage of the corresponding index that the defaulted security comprises (1) multiplied by the notional value and (2) multiplied by the ratio of one minus the ratio of the market value of the defaulted debt security to its par value.
Risks associated with swap contracts include changes in the returns of underlying instruments, failure of the counterparties to perform under the contracts’ terms and the possible lack of liquidity with respect to the contracts. As of March 31, 2016, the Fund had outstanding swap contract as listed on the Schedule of Investments.
Options Contracts – The Funds may write covered call and put options on securities, derivative instruments, or currencies the Funds own or in which it may invest. Writing put options tends to increase the Funds’ exposure to the underlying instrument. Writing call options tends to decrease the Funds’ exposure to the underlying instrument. When a Fund writes a call or put option, an amount equal to the premium received is recorded as a liability and subsequently marked to market to reflect the current value of the option written. These liabilities are reflected as written options outstanding in the Statement of Assets and Liabilities. Payments received or made, if any, from writing options with premiums to be determined on a future date are reflected as such on the Statement of Assets and Liabilities. Premiums received from writing options which expire are treated as realized gains. Premiums received from writing options which are exercised or closed are added to the proceeds or offset against amounts paid on the underlying future, swap, security or currency transaction to determine the realized gain or loss. A Fund, as a writer of an option, has no control over whether the underlying future, swap, security or currency may be sold (call) or purchased (put) and, as a result, bears the market risk of an unfavorable change in the price of the future, swap, security or currency underlying the written option. The risk exists that the Funds may not be able to enter into a closing transaction because of an illiquid market.
29
Ziegler Funds NOTES TO FINANCIAL STATEMENTS (Continued) March 31, 2016 (Unaudited)
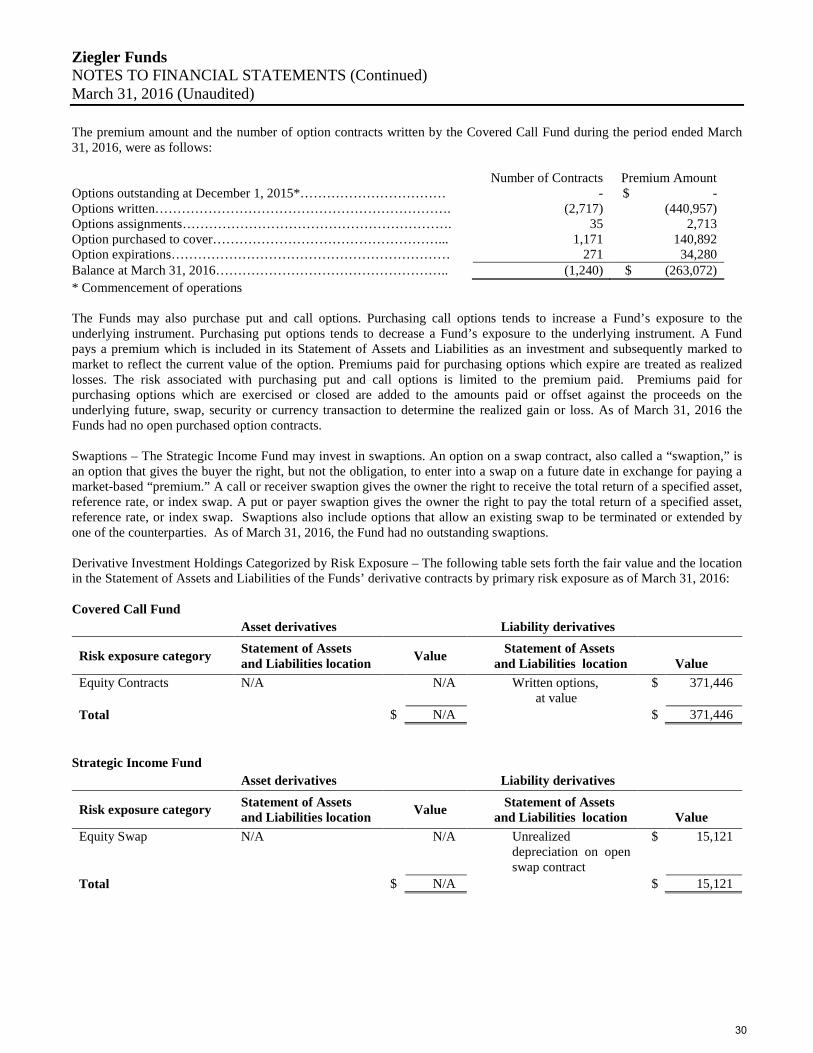
The premium amount and the number of option contracts written by the Covered Call Fund during the period ended March 31, 2016, were as follows:
Number of Contracts Premium Amount Options outstanding at December 1, 2015*…………………………… - $ - Options written…………………………………………………………. (2,717) (440,957) Options assignments……………………………………………………. 35 2,713 Option purchased to cover……………………………………………... 1,171 140,892 Option expirations……………………………………………………… 271 34,280 Balance at March 31, 2016…………………………………………….. (1,240) $ (263,072) * Commencement of operations
The Funds may also purchase put and call options. Purchasing call options tends to increase a Fund’s exposure to the underlying instrument. Purchasing put options tends to decrease a Fund’s exposure to the underlying instrument. A Fund pays a premium which is included in its Statement of Assets and Liabilities as an investment and subsequently marked to market to reflect the current value of the option. Premiums paid for purchasing options which expire are treated as realized losses. The risk associated with purchasing put and call options is limited to the premium paid. Premiums paid for purchasing options which are exercised or closed are added to the amounts paid or offset against the proceeds on the underlying future, swap, security or currency transaction to determine the realized gain or loss. As of March 31, 2016 the Funds had no open purchased option contracts.
Swaptions – The Strategic Income Fund may invest in swaptions. An option on a swap contract, also called a “swaption,” is an option that gives the buyer the right, but not the obligation, to enter into a swap on a future date in exchange for paying a market-based “premium.” A call or receiver swaption gives the owner the right to receive the total return of a specified asset, reference rate, or index swap. A put or payer swaption gives the owner the right to pay the total return of a specified asset, reference rate, or index swap. Swaptions also include options that allow an existing swap to be terminated or extended by one of the counterparties. As of March 31, 2016, the Fund had no outstanding swaptions.
Derivative Investment Holdings Categorized by Risk Exposure – The following table sets forth the fair value and the location in the Statement of Assets and Liabilities of the Funds’ derivative contracts by primary risk exposure as of March 31, 2016:
Covered Call Fund Asset derivatives Liability derivatives
Risk exposure category Statement of Assets and Liabilities location Value Statement of Assets
and Liabilities location Value Equity Contracts N/A N/A Written options,
at value $ 371,446
Total $ N/A $ 371,446
Strategic Income Fund Asset derivatives Liability derivatives
Risk exposure category Statement of Assets and Liabilities location Value Statement of Assets
and Liabilities location Value Equity Swap N/A N/A Unrealized
depreciation on open swap contract
$ 15,121
Total $ N/A $ 15,121
30
Ziegler Funds NOTES TO FINANCIAL STATEMENTS (Continued) March 31, 2016 (Unaudited)
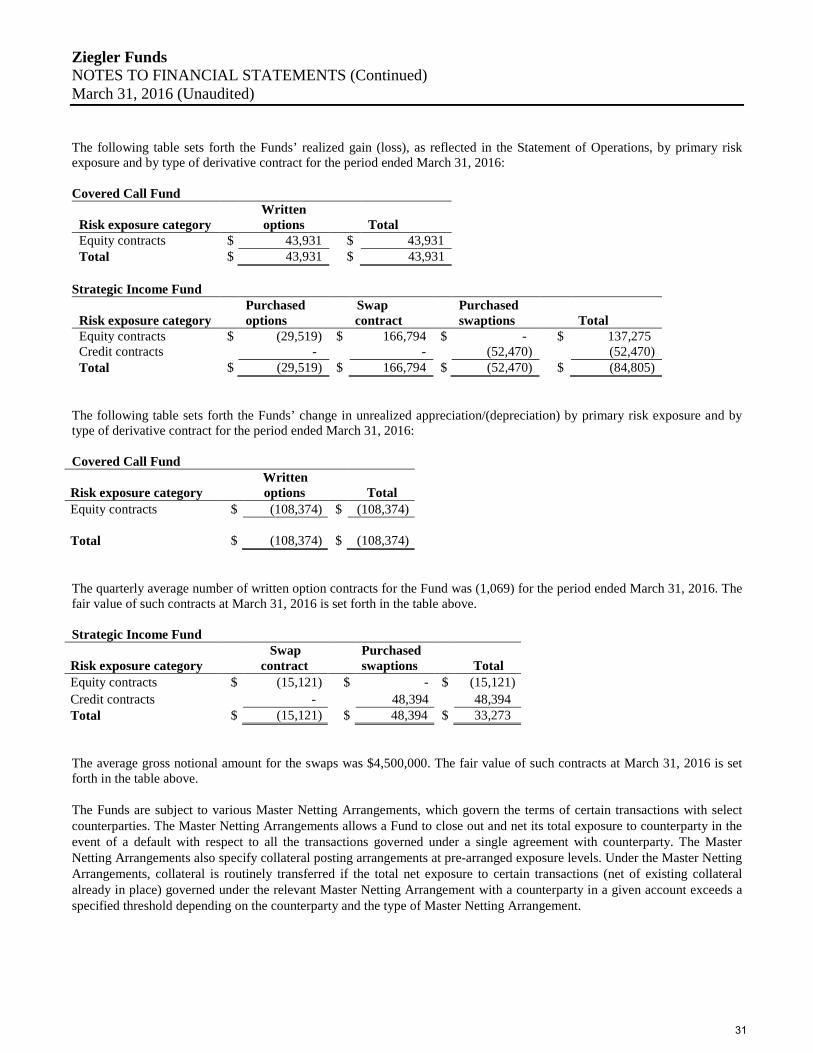
The following table sets forth the Funds’ realized gain (loss), as reflected in the Statement of Operations, by primary risk exposure and by type of derivative contract for the period ended March 31, 2016:
Covered Call Fund
Risk exposure category Written options Total
Equity contracts $ 43,931 $ 43,931 Total $ 43,931 $ 43,931
Strategic Income Fund
Risk exposure category Purchased options
Swap contract
Purchased swaptions Total
Equity contracts $ (29,519) $ 166,794 $ - $ 137,275 Credit contracts - - (52,470) (52,470) Total $ (29,519) $ 166,794 $ (52,470) $ (84,805)
The following table sets forth the Funds’ change in unrealized appreciation/(depreciation) by primary risk exposure and by type of derivative contract for the period ended March 31, 2016:
Covered Call Fund
Risk exposure category Written options Total
Equity contracts $ (108,374) $ (108,374)
Total $ (108,374) $ (108,374)
The quarterly average number of written option contracts for the Fund was (1,069) for the period ended March 31, 2016. The fair value of such contracts at March 31, 2016 is set forth in the table above.
Strategic Income Fund
Risk exposure category Swap
contract Purchased swaptions Total
Equity contracts $ (15,121) $ - $ (15,121)Credit contracts - 48,394 48,394 Total $ (15,121) $ 48,394 $ 33,273
The average gross notional amount for the swaps was $4,500,000. The fair value of such contracts at March 31, 2016 is set forth in the table above.
The Funds are subject to various Master Netting Arrangements, which govern the terms of certain transactions with select counterparties. The Master Netting Arrangements allows a Fund to close out and net its total exposure to counterparty in the event of a default with respect to all the transactions governed under a single agreement with counterparty. The Master Netting Arrangements also specify collateral posting arrangements at pre-arranged exposure levels. Under the Master Netting Arrangements, collateral is routinely transferred if the total net exposure to certain transactions (net of existing collateral already in place) governed under the relevant Master Netting Arrangement with a counterparty in a given account exceeds a specified threshold depending on the counterparty and the type of Master Netting Arrangement.
31
Ziegler Funds NOTES TO FINANCIAL STATEMENTS (Continued) March 31, 2016 (Unaudited)
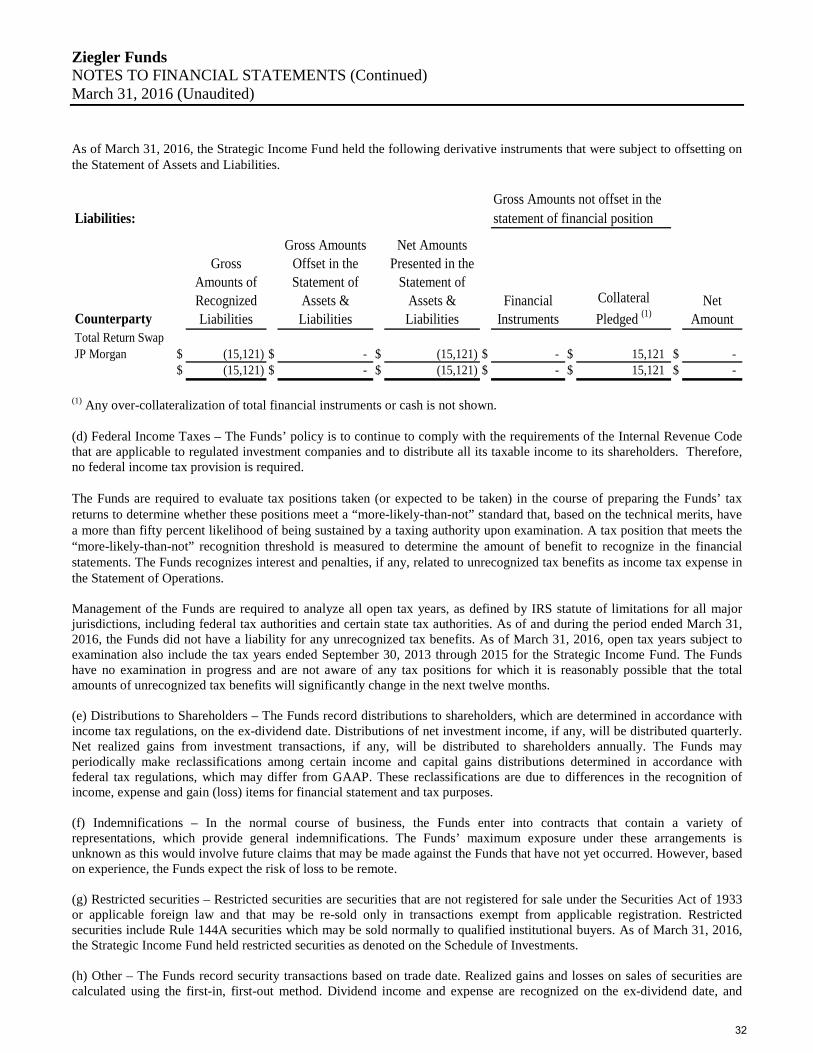
As of March 31, 2016, the Strategic Income Fund held the following derivative instruments that were subject to offsetting on the Statement of Assets and Liabilities.
Liabilities: statement of financial position
Counterparty
Gross Amounts of Recognized Liabilities
Gross Amounts Offset in the Statement of
Assets & Liabilities
Net Amounts Presented in the
Statement of Assets & Liabilities
Financial Instruments
Collateral Pledged (1)
Net Amount
Total Return SwapJP Morgan $ (15,121) $ - $ (15,121) $ - $ 15,121 $ -
$ (15,121) $ - $ (15,121) $ - $ 15,121 $ -
Gross Amounts not offset in the
(1) Any over-collateralization of total financial instruments or cash is not shown.
(d) Federal Income Taxes – The Funds’ policy is to continue to comply with the requirements of the Internal Revenue Codethat are applicable to regulated investment companies and to distribute all its taxable income to its shareholders. Therefore,no federal income tax provision is required.
The Funds are required to evaluate tax positions taken (or expected to be taken) in the course of preparing the Funds’ tax returns to determine whether these positions meet a “more-likely-than-not” standard that, based on the technical merits, have a more than fifty percent likelihood of being sustained by a taxing authority upon examination. A tax position that meets the “more-likely-than-not” recognition threshold is measured to determine the amount of benefit to recognize in the financial statements. The Funds recognizes interest and penalties, if any, related to unrecognized tax benefits as income tax expense in the Statement of Operations.
Management of the Funds are required to analyze all open tax years, as defined by IRS statute of limitations for all major jurisdictions, including federal tax authorities and certain state tax authorities. As of and during the period ended March 31, 2016, the Funds did not have a liability for any unrecognized tax benefits. As of March 31, 2016, open tax years subject to examination also include the tax years ended September 30, 2013 through 2015 for the Strategic Income Fund. The Funds have no examination in progress and are not aware of any tax positions for which it is reasonably possible that the total amounts of unrecognized tax benefits will significantly change in the next twelve months.
(e) Distributions to Shareholders – The Funds record distributions to shareholders, which are determined in accordance withincome tax regulations, on the ex-dividend date. Distributions of net investment income, if any, will be distributed quarterly.Net realized gains from investment transactions, if any, will be distributed to shareholders annually. The Funds mayperiodically make reclassifications among certain income and capital gains distributions determined in accordance withfederal tax regulations, which may differ from GAAP. These reclassifications are due to differences in the recognition ofincome, expense and gain (loss) items for financial statement and tax purposes.
(f) Indemnifications – In the normal course of business, the Funds enter into contracts that contain a variety ofrepresentations, which provide general indemnifications. The Funds’ maximum exposure under these arrangements isunknown as this would involve future claims that may be made against the Funds that have not yet occurred. However, basedon experience, the Funds expect the risk of loss to be remote.
(g) Restricted securities – Restricted securities are securities that are not registered for sale under the Securities Act of 1933or applicable foreign law and that may be re-sold only in transactions exempt from applicable registration. Restrictedsecurities include Rule 144A securities which may be sold normally to qualified institutional buyers. As of March 31, 2016,the Strategic Income Fund held restricted securities as denoted on the Schedule of Investments.
(h) Other – The Funds record security transactions based on trade date. Realized gains and losses on sales of securities arecalculated using the first-in, first-out method. Dividend income and expense are recognized on the ex-dividend date, and
32
Ziegler Funds NOTES TO FINANCIAL STATEMENTS (Continued) March 31, 2016 (Unaudited)
interest income and expense are recognized on an accrual basis. Discounts and premiums on securities purchased are amortized over the lives of the respective securities using the effective yield method. Withholding taxes on foreign dividends have been provided for in accordance with the Trust’s understanding of the applicable country’s tax rules and rates.
NOTE 3 – Related Party Transactions
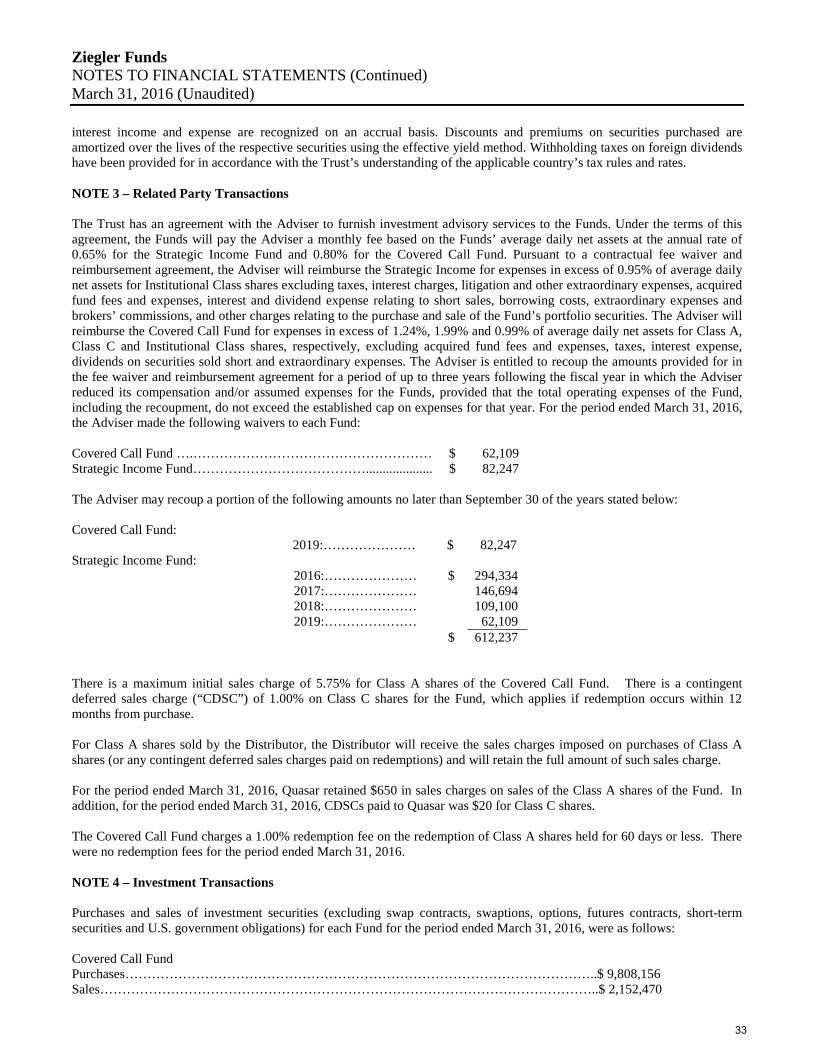
The Trust has an agreement with the Adviser to furnish investment advisory services to the Funds. Under the terms of this agreement, the Funds will pay the Adviser a monthly fee based on the Funds’ average daily net assets at the annual rate of 0.65% for the Strategic Income Fund and 0.80% for the Covered Call Fund. Pursuant to a contractual fee waiver and reimbursement agreement, the Adviser will reimburse the Strategic Income for expenses in excess of 0.95% of average daily net assets for Institutional Class shares excluding taxes, interest charges, litigation and other extraordinary expenses, acquired fund fees and expenses, interest and dividend expense relating to short sales, borrowing costs, extraordinary expenses and brokers’ commissions, and other charges relating to the purchase and sale of the Fund’s portfolio securities. The Adviser will reimburse the Covered Call Fund for expenses in excess of 1.24%, 1.99% and 0.99% of average daily net assets for Class A, Class C and Institutional Class shares, respectively, excluding acquired fund fees and expenses, taxes, interest expense, dividends on securities sold short and extraordinary expenses. The Adviser is entitled to recoup the amounts provided for in the fee waiver and reimbursement agreement for a period of up to three years following the fiscal year in which the Adviser reduced its compensation and/or assumed expenses for the Funds, provided that the total operating expenses of the Fund, including the recoupment, do not exceed the established cap on expenses for that year. For the period ended March 31, 2016, the Adviser made the following waivers to each Fund:
Covered Call Fund ….……………………………………………… $ 62,109 Strategic Income Fund………………………………….................... $ 82,247
The Adviser may recoup a portion of the following amounts no later than September 30 of the years stated below:
Covered Call Fund: 2019:………………… $ 82,247
Strategic Income Fund: 2016:………………… $ 294,334 2017:………………… 146,694 2018:………………… 109,100 2019:………………… 62,109
$ 612,237
There is a maximum initial sales charge of 5.75% for Class A shares of the Covered Call Fund. There is a contingent deferred sales charge (“CDSC”) of 1.00% on Class C shares for the Fund, which applies if redemption occurs within 12 months from purchase.
For Class A shares sold by the Distributor, the Distributor will receive the sales charges imposed on purchases of Class A shares (or any contingent deferred sales charges paid on redemptions) and will retain the full amount of such sales charge.
For the period ended March 31, 2016, Quasar retained $650 in sales charges on sales of the Class A shares of the Fund. In addition, for the period ended March 31, 2016, CDSCs paid to Quasar was $20 for Class C shares.
The Covered Call Fund charges a 1.00% redemption fee on the redemption of Class A shares held for 60 days or less. There were no redemption fees for the period ended March 31, 2016.
NOTE 4 – Investment Transactions
Purchases and sales of investment securities (excluding swap contracts, swaptions, options, futures contracts, short-term securities and U.S. government obligations) for each Fund for the period ended March 31, 2016, were as follows:
Covered Call Fund Purchases……………………………………………………………………………………………..$ 9,808,156 Sales…………………………………………………………………………………………………..$ 2,152,470
33
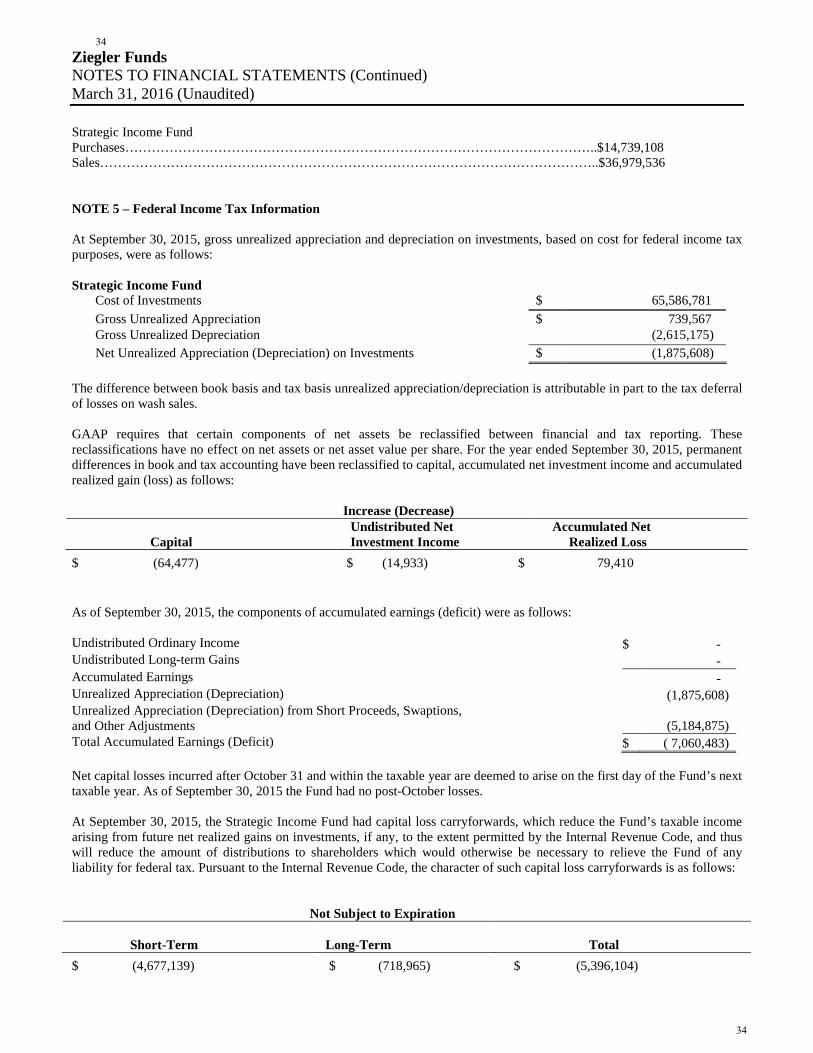
Ziegler Funds NOTES TO FINANCIAL STATEMENTS (Continued) March 31, 2016 (Unaudited) Strategic Income Fund Purchases……………………………………………………………………………………………..$14,739,108 Sales…………………………………………………………………………………………………..$36,979,536 NOTE 5 – Federal Income Tax Information At September 30, 2015, gross unrealized appreciation and depreciation on investments, based on cost for federal income tax purposes, were as follows: Strategic Income Fund
Cost of Investments $ 65,586,781 Gross Unrealized Appreciation $ 739,567 Gross Unrealized Depreciation (2,615,175) Net Unrealized Appreciation (Depreciation) on Investments $ (1,875,608)
The difference between book basis and tax basis unrealized appreciation/depreciation is attributable in part to the tax deferral of losses on wash sales. GAAP requires that certain components of net assets be reclassified between financial and tax reporting. These reclassifications have no effect on net assets or net asset value per share. For the year ended September 30, 2015, permanent differences in book and tax accounting have been reclassified to capital, accumulated net investment income and accumulated realized gain (loss) as follows: Increase (Decrease) Capital
Undistributed Net Investment Income
Accumulated Net Realized Loss
As of September 30, 2015, the components of accumulated earnings (deficit) were as follows: Undistributed Ordinary Income $ - Undistributed Long-term Gains - Accumulated Earnings - Unrealized Appreciation (Depreciation) (1,875,608) Unrealized Appreciation (Depreciation) from Short Proceeds, Swaptions, and Other Adjustments (5,184,875) Total Accumulated Earnings (Deficit) $ ( 7,060,483) Net capital losses incurred after October 31 and within the taxable year are deemed to arise on the first day of the Fund’s next taxable year. As of September 30, 2015 the Fund had no post-October losses. At September 30, 2015, the Strategic Income Fund had capital loss carryforwards, which reduce the Fund’s taxable income arising from future net realized gains on investments, if any, to the extent permitted by the Internal Revenue Code, and thus will reduce the amount of distributions to shareholders which would otherwise be necessary to relieve the Fund of any liability for federal tax. Pursuant to the Internal Revenue Code, the character of such capital loss carryforwards is as follows: Not Subject to Expiration Short-Term
Long-Term
Total
$ (64,477) $ (14,933) $ 79,410
$ (4,677,139) $ (718,965) $ (5,396,104)
34
34
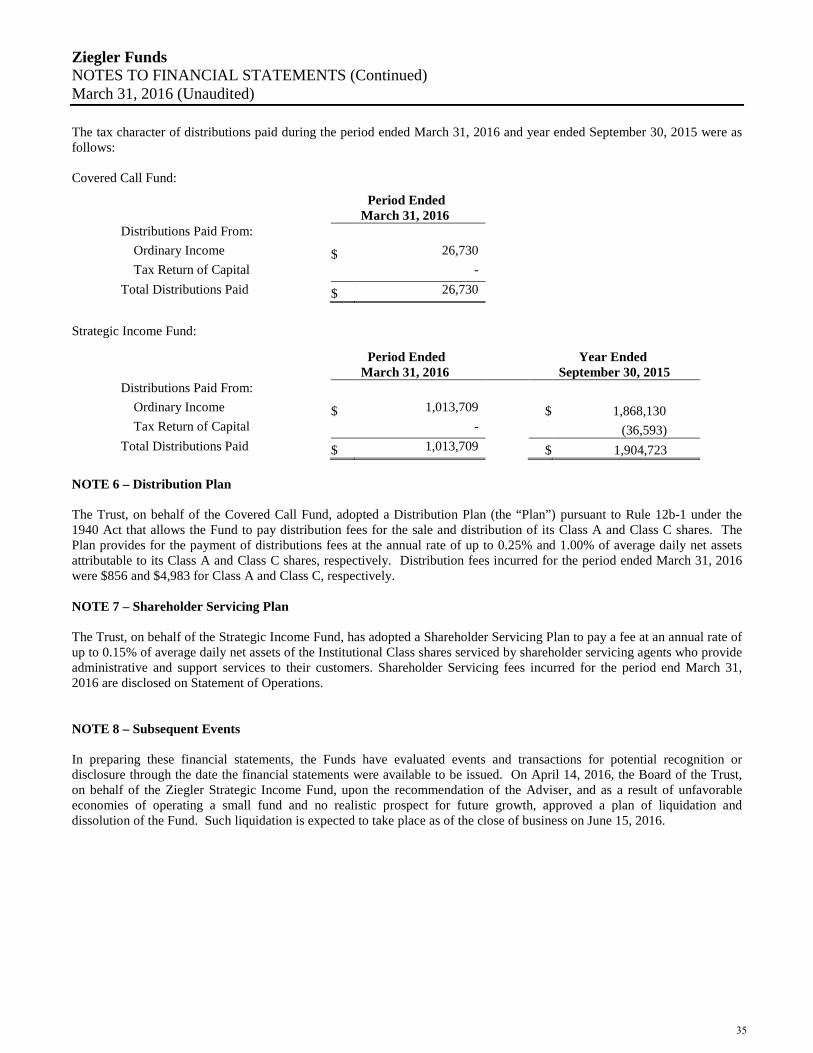
Ziegler Funds NOTES TO FINANCIAL STATEMENTS (Continued) March 31, 2016 (Unaudited) The tax character of distributions paid during the period ended March 31, 2016 and year ended September 30, 2015 were as follows: Covered Call Fund: Strategic Income Fund: NOTE 6 – Distribution Plan The Trust, on behalf of the Covered Call Fund, adopted a Distribution Plan (the “Plan”) pursuant to Rule 12b-1 under the 1940 Act that allows the Fund to pay distribution fees for the sale and distribution of its Class A and Class C shares. The Plan provides for the payment of distributions fees at the annual rate of up to 0.25% and 1.00% of average daily net assets attributable to its Class A and Class C shares, respectively. Distribution fees incurred for the period ended March 31, 2016 were $856 and $4,983 for Class A and Class C, respectively. NOTE 7 – Shareholder Servicing Plan The Trust, on behalf of the Strategic Income Fund, has adopted a Shareholder Servicing Plan to pay a fee at an annual rate of up to 0.15% of average daily net assets of the Institutional Class shares serviced by shareholder servicing agents who provide administrative and support services to their customers. Shareholder Servicing fees incurred for the period end March 31, 2016 are disclosed on Statement of Operations. NOTE 8 – Subsequent Events In preparing these financial statements, the Funds have evaluated events and transactions for potential recognition or disclosure through the date the financial statements were available to be issued. On April 14, 2016, the Board of the Trust, on behalf of the Ziegler Strategic Income Fund, upon the recommendation of the Adviser, and as a result of unfavorable economies of operating a small fund and no realistic prospect for future growth, approved a plan of liquidation and dissolution of the Fund. Such liquidation is expected to take place as of the close of business on June 15, 2016.
Period Ended March 31, 2016
Distributions Paid From: Ordinary Income $ 26,730 Tax Return of Capital -
Total Distributions Paid $ 26,730
Period Ended March 31, 2016
Year Ended September 30, 2015
Distributions Paid From: Ordinary Income $ 1,013,709 $ 1,868,130 Tax Return of Capital - (36,593)
Total Distributions Paid $ 1,013,709 $ 1,904,723
35
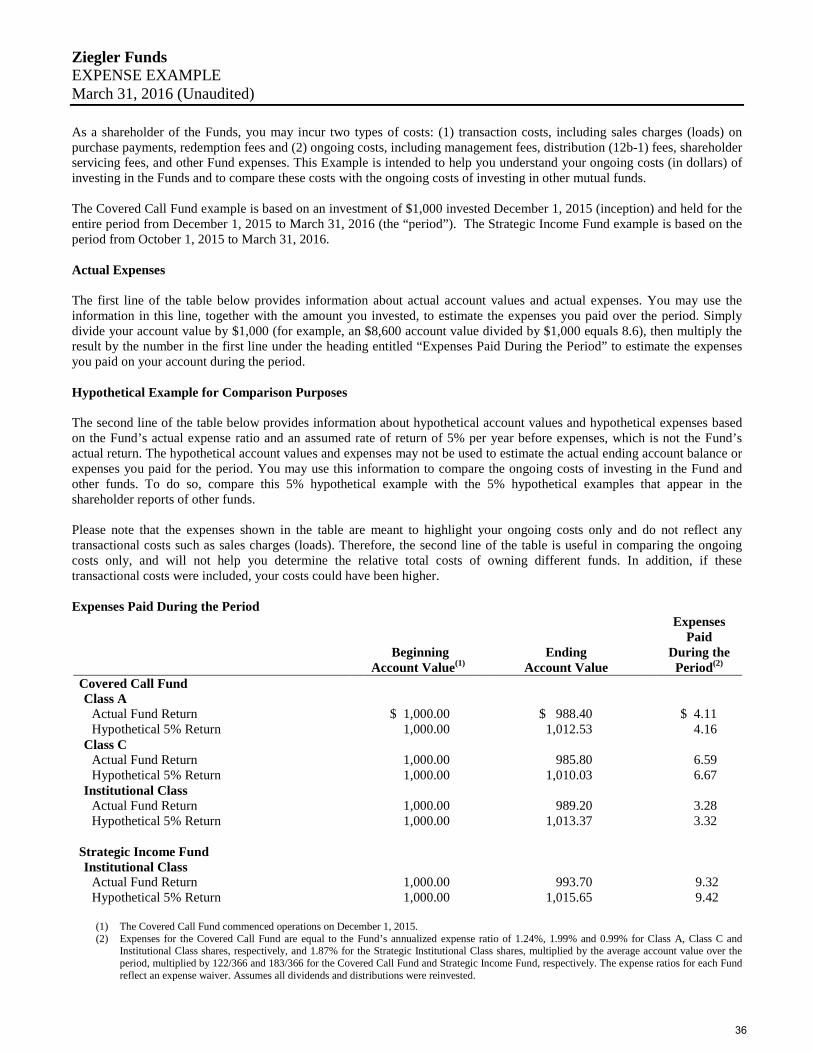
Ziegler Funds EXPENSE EXAMPLE March 31, 2016 (Unaudited)
As a shareholder of the Funds, you may incur two types of costs: (1) transaction costs, including sales charges (loads) on purchase payments, redemption fees and (2) ongoing costs, including management fees, distribution (12b-1) fees, shareholder servicing fees, and other Fund expenses. This Example is intended to help you understand your ongoing costs (in dollars) of investing in the Funds and to compare these costs with the ongoing costs of investing in other mutual funds.
The Covered Call Fund example is based on an investment of $1,000 invested December 1, 2015 (inception) and held for the entire period from December 1, 2015 to March 31, 2016 (the “period”). The Strategic Income Fund example is based on the period from October 1, 2015 to March 31, 2016.
Actual Expenses
The first line of the table below provides information about actual account values and actual expenses. You may use the information in this line, together with the amount you invested, to estimate the expenses you paid over the period. Simply divide your account value by $1,000 (for example, an $8,600 account value divided by $1,000 equals 8.6), then multiply the result by the number in the first line under the heading entitled “Expenses Paid During the Period” to estimate the expenses you paid on your account during the period.
Hypothetical Example for Comparison Purposes
The second line of the table below provides information about hypothetical account values and hypothetical expenses based on the Fund’s actual expense ratio and an assumed rate of return of 5% per year before expenses, which is not the Fund’s actual return. The hypothetical account values and expenses may not be used to estimate the actual ending account balance or expenses you paid for the period. You may use this information to compare the ongoing costs of investing in the Fund and other funds. To do so, compare this 5% hypothetical example with the 5% hypothetical examples that appear in the shareholder reports of other funds.
Please note that the expenses shown in the table are meant to highlight your ongoing costs only and do not reflect any transactional costs such as sales charges (loads). Therefore, the second line of the table is useful in comparing the ongoing costs only, and will not help you determine the relative total costs of owning different funds. In addition, if these transactional costs were included, your costs could have been higher.
Expenses Paid During the Period
Beginning Account Value(1)
Ending Account Value
Expenses Paid
During the Period(2)
Covered Call Fund Class A
Actual Fund Return $ 1,000.00 $ 988.40 $ 4.11 Hypothetical 5% Return 1,000.00 1,012.53 4.16
Class C Actual Fund Return 1,000.00 985.80 6.59 Hypothetical 5% Return 1,000.00 1,010.03 6.67
Institutional Class Actual Fund Return 1,000.00 989.20 3.28 Hypothetical 5% Return 1,000.00 1,013.37 3.32
Strategic Income Fund Institutional Class
Actual Fund Return 1,000.00 993.70 9.32 Hypothetical 5% Return 1,000.00 1,015.65 9.42
(1) The Covered Call Fund commenced operations on December 1, 2015. (2) Expenses for the Covered Call Fund are equal to the Fund’s annualized expense ratio of 1.24%, 1.99% and 0.99% for Class A, Class C and
Institutional Class shares, respectively, and 1.87% for the Strategic Institutional Class shares, multiplied by the average account value over theperiod, multiplied by 122/366 and 183/366 for the Covered Call Fund and Strategic Income Fund, respectively. The expense ratios for each Fund reflect an expense waiver. Assumes all dividends and distributions were reinvested.
36
Ziegler Funds APPROVAL OF INVESTMENT ADVISORY AGREEMENT (Unaudited)
At a meeting held on August 19, 2015, the Board of Trustees (the “Board”) of Trust for Advised Portfolios (the “Trust”), including all Trustees who are not “interested persons” of the Trust, as that term is defined in the Investment Company Act of 1940, as amended (“1940 Act”), considered the initial approval of an Investment Advisory Agreement (“Advisory Agreement”) with Ziegler Capital Management, LLC (“Ziegler” or the “Adviser”), for the Ziegler FAMCO Covered Call Fund (the “Fund”), a new series of the Trust (the “Advisory Agreement”). Ahead of the August meeting, the Board received and reviewed substantial information regarding the Fund, the Adviser and the services to be provided by the Adviser to the Fund under the Advisory Agreement. This information formed the primary (but not exclusive) basis for the Board’s determinations. Below is a summary of the factors considered by the Board and the conclusions that formed the basis for the Board’s initial approval and renewal of the Advisory Agreement:
In considering the approvals of the Advisory Agreement, the Board considered the following factors and made the following determinations. In its deliberations, the Board did not identify any single factor or piece of information as all important, controlling, or determinative of its decision, and each Trustee may have attributed different weights to the various factors and information.
• In considering the nature, extent and quality of the services provided by the Adviser, the Trustees consideredthe Adviser’s specific responsibilities in all aspects of the day-to-day management of the Fund as well as thequalifications, experience and responsibilities of the portfolio managers and other key personnel that would beinvolved in the day-to-day activities the Fund, including those employees who had joined Ziegler for the specificpurpose of managing the Fund. The Board reviewed the proposed services that Ziegler would provide to the Fundas investment adviser, noting to what degree those services extended beyond portfolio management. The Trusteesalso considered the structure of the compliance procedures and the trading capability of Ziegler. The Board alsoconsidered the existing relationship between Ziegler and the Trust, as well as the Board’s knowledge of Ziegler’soperations, and noted that during the course of the prior year they had met with Ziegler in person to discussvarious marketing and compliance topics, including the Advisor’s risk management process. After reviewing theAdvisor’s compliance policies and procedures, the Board concluded that Ziegler had sufficient quality and depthof personnel, resources, investment methods and compliance policies and procedures essential to performing itsduties under the Advisory Agreement and that, in the Board’s view, the nature, overall quality, and extent of themanagement services to be provided would be satisfactory and reliable.
• As the Fund was newly created, the Board was unable to review the performance of that Fund. The Board didconsider the Adviser’s performance history with respect to its separately managed accounts and other registeredmutual fund with similar investment strategies and a similar portfolio management team.
• The Trustees also reviewed the cost of the services, and the structure and level of advisory fees payable by theFund, including a comparison of those fees to fees charged by a peer group of funds. After reviewing thematerials that were provided, the Trustees concluded that the fees to be received by Ziegler were fair andreasonable.
• With respect to the Fund, the Trustees considered Ziegler’s assertion that, because the Fund is new, it is not yetable to determine whether there will be economies of scale in the management of the Fund. The Board noted thatthe Adviser has contractually agreed to reduce its advisory fees or reimburse expenses so that each Fund does notexceed its specified expense limitation. The Board concluded that there were no effective economies of scale tobe shared with the Fund at current asset levels, but would revisit this issue in the future as circumstances changedand asset levels increased.
• The Trustees considered the profitability of Ziegler from managing the Fund. In assessing Ziegler’s profitability,the Trustees reviewed Ziegler’s financial information that was provided in the Board materials and took intoaccount both the direct and indirect benefits to Ziegler from managing the Fund. The Trustees concluded thatZiegler’s profits from managing the Fund would likely not be excessive and, after a review of the relevantfinancial information, Ziegler appeared to have adequate capitalization and/or would maintain adequate profitlevels to support the Fund.
37
Ziegler Funds OTHER INFORMATION (Unaudited) Form N-Q The Funds file their complete schedule of portfolio holdings for the first and third quarters of each fiscal year with the SEC on Form N-Q. The Funds’ Form N-Q is available without charge by visiting the SEC’s Web site at www.sec.gov and may be reviewed and copied at the SEC’s Public Reference Room in Washington D.C. You may obtain information on the operation of the Public Reference Room by calling (800) SEC-0330. Proxy Voting The Funds file their proxy voting records annually as of June 30 with the SEC on Form N-PX. The Funds’ Form N-PX is available without charge by visiting the SEC’s Web site at www.sec.gov and may be reviewed and copied at the SEC’s Public Reference Room in Washington D.C. You may obtain information on the operation of the Public Reference Room by calling (800) SEC-0330.
38
www.zcmfunds.com
ZIEGLER FAMCO COVERED CALL FUND − CLASS A (CACLX) − CLASS C (CCCLX) − INSTITUTIONAL CLASS (CICLX)
ZIEGLER STRATEGIC INCOME FUND − INSTITUTIONAL CLASS (ZLSIX)
Quasar Distributors, LLC 615 E. Michigan Street
Milwaukee, WI 53201-1811