zhulian corporation berhad outperform - listed...
TRANSCRIPT

KENANGA RESEARCH Initiating Coverage
05 September 2013
PP7004/02/2013(031762) KENANGA RESEARCH
Zhulian Corporation Berhad OUTPERFORM Price: RM3.10
Thai Market To Drive New Growth Era! Target Price: RM4.05
We are initiating coverage on Zhulian Corporation Bhd (“ZHULIAN”) with an OUTPERFORM rating and TP of RM4.05 (with a potential
total return of 36.9%) based on a targeted PER of 12.5x over FY14E EPS of 32.4 sen. An under-researched stock, ZHULIAN currently
trades at 9.6x Fwd PER, at a discount compared to its peers within
the multi-level marketing (“MLM”) sector such as Amway (17.8x) and in line with Hai-O (9.8x). Its current valuation appears
conservative based on the following; (i) ZHULIAN’s market cap is nearly 3 times bigger than Hai-O’s; (ii) ZHULIAN’s position in both
regional and domestic Bumiputra market is more dominant compared to Amway and Hai-O; and (iii) ZHULIAN offers the highest
earnings visibility in terms of EPS growth and a net dividend yield of 6.3%. We estimate FY13E-FY14E net profit of RM129.8m (+11%
YoY) – RM149.1m (+15% YoY). We believe this home-grown MLM giant is ripe for a PER re-rating upwards due to its current cheap
valuation and excellent growth prospects.
Thailand to drive the re-rating story. ZHULIAN (THAILAND) LTD is now
the Top 3 MLM companies in Thailand, and also the major contributor to the group's total revenue. In last 5 years, export revenue has recorded a
phenomenally strong CAGR of 25.6% vs. other players like Amway and Hai-O which mainly focuses on the domestic market. The group has an absolute
first-mover advantage over its peers in the regional market due to its early penetration since 1996. Going forward, export revenue to Thailand is expected
to continue growing at an average of 20% per annum, underpinned by the
higher population and low per capita sales base compared to Malaysia.
An established domestic MLM brand name. Known as a leading MLM
giant in Malaysia, the majority Bumiputera population made up about 90% of ZHULIAN’s members. Its strong branding within the community will propel
ZHULIAN to cash in on this consumer category which is experiencing the fastest growth in terms of population and income.
A complete value-chain business model. Around 80% of ZHULIAN’s products are manufactured in-house in Malaysia which enables better cost and
supply control whereas its peers mainly outsourced their manufacturing requirements at a higher cost. Hence, this has historically resulted in strong
EBIT margins (average of 24% in the past five years vs. peer average of 16%). They will also benefit from a stronger USD against the Ringgit where
every 5% appreciation in USD will result in a 10%-11% increase in earnings.
Highest dividend yield among MLM sector. As at 2Q13, the group is
sitting on a cash pile of RM106.4m (RM0.23/share) and zero debt. Riding on the group’s minimum 60% dividend payout policy, we are anticipating a
payout of 16.9 sen and 19.4 sen NDPS in FY13E and FY14E respectively. This
implied an attractive net dividend yield of 6.3%, higher than Amway (5.2%) and Hai-O (5.6%).
Hidden gem amongst consumer stocks. ZHULIAN is an under-researched stock in the consumer sector with only one research house coverage. The
stock is trading at an undemanding 9.6x Fwd. PER, which is at a deep discount against its peer Amway (17.8x) and in line with Hai-O at (9.8x). We
pegged Fwd PER of 12.5x in FY14E to value ZHULIAN at a TP of RM4.05 as we postulate that the stock deserves to trade at premium to Hai-O (OP; TP:
RM3.00 on targeted PER of 11.8x) given that it is stronger in terms of networking, earnings growth, dividend yield and market cap.
Share Price Performance
1.80
2.00
2.20
2.40
2.60
2.80
3.00
3.20
3.40
3.60
Sep-12 Oct-12 Nov-12 Dec-12 Jan-13 Feb-13 Mar-13 Apr-13 May-13 Jun-13 Jul-13 Aug-13 Sep-13
KLCI 1716.76 YTD KLCI chg 1.6% YTD stock price chg 8.3%
Stock Information Bloomberg Ticker ZHCB MK Equity Market Cap (RM m) 1,426.0 Issued shares 460.0
52-week range (H) 3.39
52-week range (L) 2.27
3-mth avg daily vol: 210,557
Free Float 37%
Beta 0.9
Major Shareholders
ZHULIAN HOLDINGS SDN 35.0%
BEST SOURCE HOLDINGS 17.3%
BENG SENG TEOH 10.4%
Summary Earnings Table
FYE Nov (RM m) 2012A 2013E 2014E
Turnover 450.4 500.4 563.7 EBITDA 103.2 106.1 119.6 PBT 141.3 156.7 179.9 Net Profit (NP) 117.1 129.8 149.1 Consensus (NP) 134.3 158.0
Earnings Revision (%) - -
EPS (sen) 25.5 28.2 32.4
EPS growth (%) 22.8 10.9 14.8
NDPS (sen) 15.5 16.9 19.4
BVPS (RM) 1.0 1.1 1.2
NTA/Share (RM) 1.0 1.1 1.2
PER (x) 12.2 11.0 9.6
Price/NTA (x) 3.2 2.8 2.5
Net Gearing (x) N.Cash N.Cash N.Cash
Dividend Yield (%) 5.0 5.5 6.3
The Research Team
[email protected] Tel: 603-2713 2292

Zhulian Corporation Berhad 05 September 2013
Page 2 of 18 KENANGA RESEARCH
Executive Summary
We are initiating coverage on Zhulian Corporation Bhd (ZHULIAN) with an OUTPERFORM rating and TP of RM4.05
based on a targeted PER of 12.5x on FY14E EPS of 32.4 sen. ZHULIAN has emerged as the second largest MLM company listed on Bursa Malaysia in terms of market cap after Amway. Despite its strong outperformance, we continue to like the stock at these levels
given its: (i) strong regional markets expansion in Thailand and we are expecting an average 20% growth p.a. from its Thailand export revenue), (ii) positive mid-to-long term MLM sector outlook driven by a growing household income and the sector’s decent
earnings growth via continuous efforts to enhance its product mix and expand into new markets, (iii) highest net dividend yield in the MLM sector, we are anticipating a 6.3% net div. yield in FY14E (vs. 5.2%-5.6% for its peers), (iv) strong historical track record and a
complete value chain business model which have historically resulted in strong EBIT margins (average of 24% in the past five years vs peer average of 16%); and (v) prospects for valuation re-rating given its current undemanding valuation. We believe this home-grown
MLM giant is ripe for a PER re-rating upwards due to its current cheap valuation despite excellent growth prospects.
Investment Merits
Thailand to drive the re-rating story. ZHULIAN (THAILAND) LTD is now the Top 3 MLM companies in Thailand (out of the 489
direct selling companies currently registered), and also the major contributor of the group's revenue. Over the last five years, the
group has been enjoying supernormal growth from Thailand as its distribution channels are now reaping the fruits of its labour. In fact, the last 5-year export revenue CAGR has been phenomenally strong at 25.6% (from RM83.95m in FY07 to RM262.14m in FY12)
vs. other players like Amway and Hai-O which mainly focuses on the domestic market. The group has a first-mover advantage over its peers in the regional market – ZHULIAN started to penetrate into the Thailand and Indonesia since 1996 vs. Amway which were
confined to Malaysia and Brunei market vs. Hai-O which has just started to expand into Indonesia 2 years ago and is still relatively small.
Thailand export revenue is expected to grow at an average of 20% YoY over FY13E-FY15E, underpinned by the higher population and low per capita sales base in Thailand compared to Malaysia. We believe that this is highly achievable as ZHULIAN
THAILAND is now doing more than RM72.07m (THB700m) sales per month. This implies that, in our forecast, the Thailand market would contribute around 59% of the group’s total revenue for FY13E (up from the 53% contribution in FY12), the single largest
revenue contributor in ZHULIAN.
Export Revenue Growth
Source: Company, Kenanga Research
Geographical Revenue Contribution Breakdown Thailand Associate Export Revenue Growth
Source: Company, Kenanga Research
Zhulian Corporation Berhad 05 September 2013
Page 3 of 18 KENANGA RESEARCH
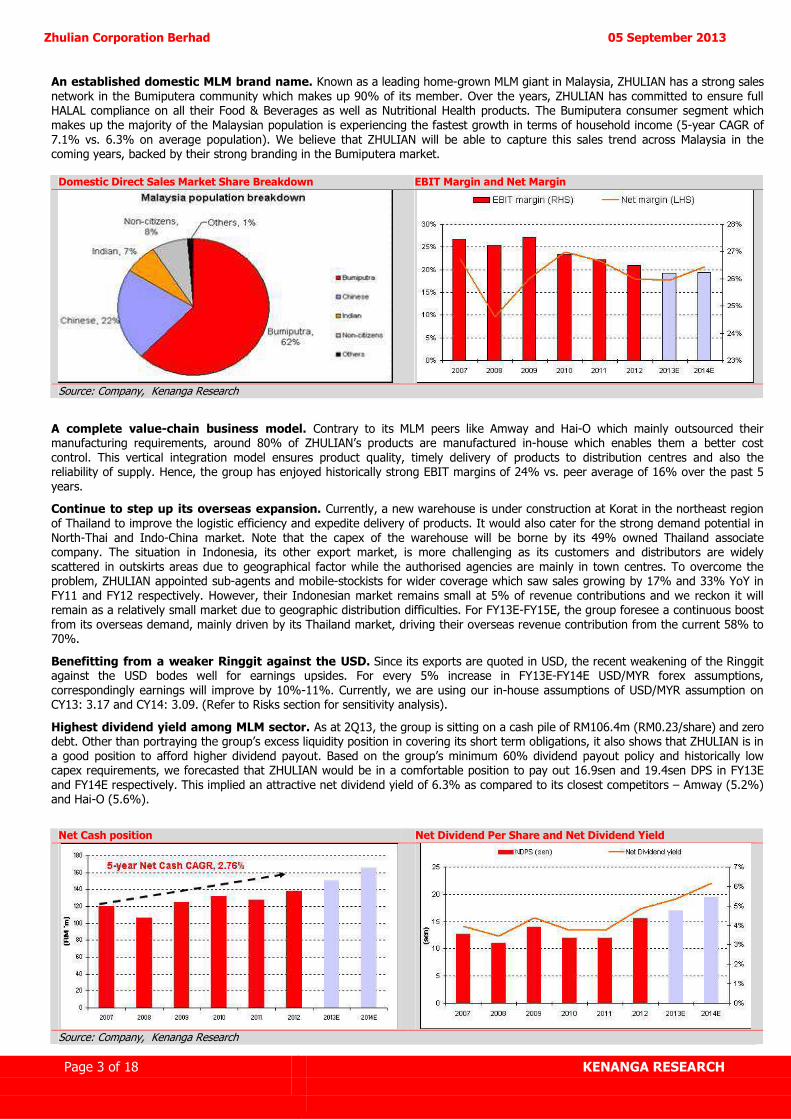
An established domestic MLM brand name. Known as a leading home-grown MLM giant in Malaysia, ZHULIAN has a strong sales
network in the Bumiputera community which makes up 90% of its member. Over the years, ZHULIAN has committed to ensure full HALAL compliance on all their Food & Beverages as well as Nutritional Health products. The Bumiputera consumer segment which
makes up the majority of the Malaysian population is experiencing the fastest growth in terms of household income (5-year CAGR of
7.1% vs. 6.3% on average population). We believe that ZHULIAN will be able to capture this sales trend across Malaysia in the coming years, backed by their strong branding in the Bumiputera market.
Domestic Direct Sales Market Share Breakdown EBIT Margin and Net Margin
Source: Company, Kenanga Research
A complete value-chain business model. Contrary to its MLM peers like Amway and Hai-O which mainly outsourced their manufacturing requirements, around 80% of ZHULIAN’s products are manufactured in-house which enables them a better cost
control. This vertical integration model ensures product quality, timely delivery of products to distribution centres and also the reliability of supply. Hence, the group has enjoyed historically strong EBIT margins of 24% vs. peer average of 16% over the past 5
years.
Continue to step up its overseas expansion. Currently, a new warehouse is under construction at Korat in the northeast region
of Thailand to improve the logistic efficiency and expedite delivery of products. It would also cater for the strong demand potential in
North-Thai and Indo-China market. Note that the capex of the warehouse will be borne by its 49% owned Thailand associate company. The situation in Indonesia, its other export market, is more challenging as its customers and distributors are widely
scattered in outskirts areas due to geographical factor while the authorised agencies are mainly in town centres. To overcome the problem, ZHULIAN appointed sub-agents and mobile-stockists for wider coverage which saw sales growing by 17% and 33% YoY in
FY11 and FY12 respectively. However, their Indonesian market remains small at 5% of revenue contributions and we reckon it will remain as a relatively small market due to geographic distribution difficulties. For FY13E-FY15E, the group foresee a continuous boost
from its overseas demand, mainly driven by its Thailand market, driving their overseas revenue contribution from the current 58% to 70%.
Benefitting from a weaker Ringgit against the USD. Since its exports are quoted in USD, the recent weakening of the Ringgit against the USD bodes well for earnings upsides. For every 5% increase in FY13E-FY14E USD/MYR forex assumptions,
correspondingly earnings will improve by 10%-11%. Currently, we are using our in-house assumptions of USD/MYR assumption on CY13: 3.17 and CY14: 3.09. (Refer to Risks section for sensitivity analysis).
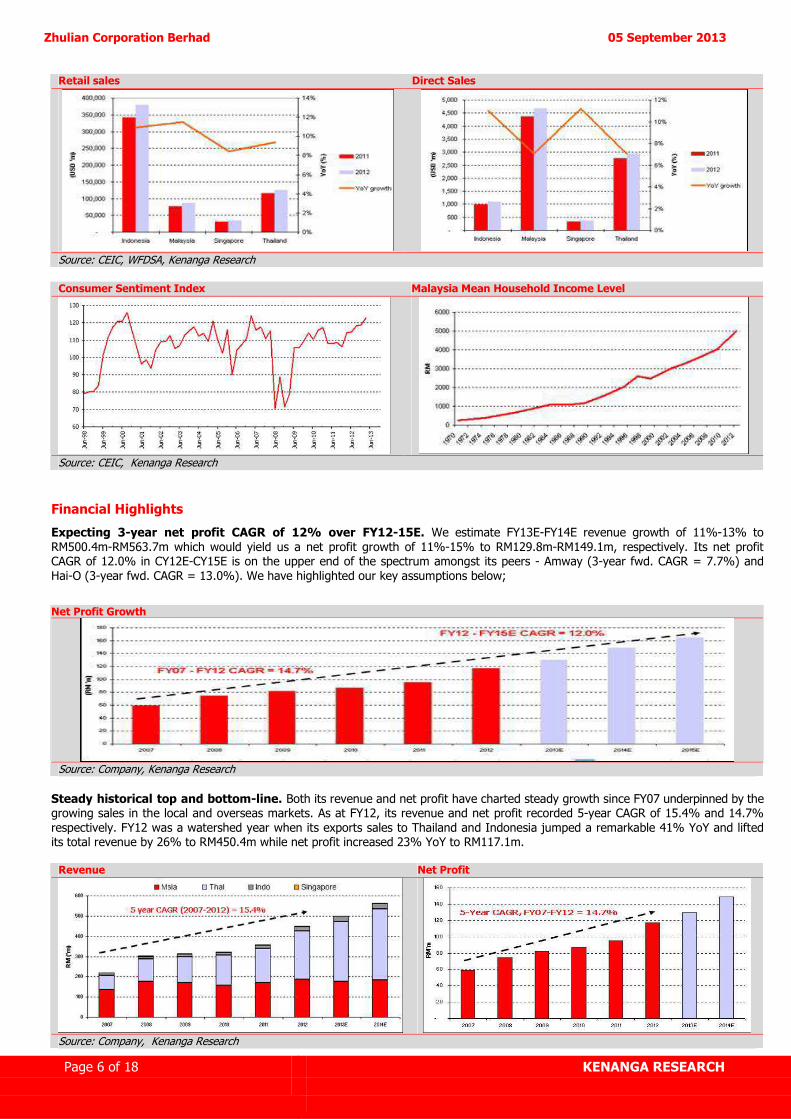
Highest dividend yield among MLM sector. As at 2Q13, the group is sitting on a cash pile of RM106.4m (RM0.23/share) and zero debt. Other than portraying the group’s excess liquidity position in covering its short term obligations, it also shows that ZHULIAN is in
a good position to afford higher dividend payout. Based on the group’s minimum 60% dividend payout policy and historically low capex requirements, we forecasted that ZHULIAN would be in a comfortable position to pay out 16.9sen and 19.4sen DPS in FY13E
and FY14E respectively. This implied an attractive net dividend yield of 6.3% as compared to its closest competitors – Amway (5.2%) and Hai-O (5.6%).
Net Cash position Net Dividend Per Share and Net Dividend Yield
Source: Company, Kenanga Research

Zhulian Corporation Berhad 05 September 2013
Page 4 of 18 KENANGA RESEARCH
Peer Comparison
Mkt Cap (RM ’m)
Revenue (RM ‘m)
Net Profit
(RM ‘m)
Net margin
(%)
ROE (%)
ROA (%)
Current ratio (x)
Dvd yield (%)
FY14E EPS
(sen)
FY14E PER (x)
FY14E BV/share
(RM)
FY14E PBV (x)
AMWAY 1982.5 797.5 99.7 12.3 47.5 31.1 2.3 5.2 67.7 17.8 1.5 8.1
HAI-O 498.2 239.5 34.0 13.6 16.0 12.4 3.5 5.6 25.8 9.8 1.4 1.7
ZHULIAN 1426.0 450.4 117.1 26.0 27.7 24.0 3.8 6.3 32.4 9.6 1.2 2.6 Source: Bloomberg, Kenanga Research
Hidden gem amongst consumer stocks. ZHULIAN is an under-researched stock in the consumer sector with only one research house coverage. The stock is trading at an undemanding 9.6x Fwd. PER, which is at a deep discount against its peer Amway (17.8x)
and in line with Hai-O at (9.8x). We postulate that ZHULIAN should trade on premium of HAI-O’s Fwd PER because: (i) ZHULIAN is in a more dominant position in the regional and domestic Bumiputera market compared to its peers, (ii)
ZHULIAN has the highest EBIT and net margin among its peers due to its complete value chain business model; (iii) ZHULIAN provides the highest dividend yield in the MLM sector, (iv) ZHULIAN’s market cap is 2.8x bigger than Hai-O;
and (v) ZHULIAN generates higher ROE and ROA than Hai-O, implying that ZHULIAN is more efficient at enhancing
shareholder value.
Value-added Points
Wider range of product demands compared to peers. Over the years, ZHULIAN diversified their product portfolio, switching
from single-product strategy to multiple-product strategy. Their wide range of offerings now include fashion jewellery, food and beverages, nutritional health supplement, homecare, personal care toiletries, beauty care products and home-tech appliances. As
opposed to some MLM players who rely heavily on certain products, ZHULIAN’s earning base are spread across a mixed range of products with each accounting for approximately 20% of sales. Product differentiation helps ZHULIAN to serve for different market
needs, maximising their sales and profits, as well as acting as earning buffers during the economic downturn.
Biggest distributor force amongst its peers. ZHULIAN currently has 674,100 distributors and 320 authorized agencies throughout
the major cities in Malaysia, Thailand, Indonesia and Singapore. Its core distributor force (CDF) of the group grew by 17% in 2012, led by its vibrant Thailand operations. We gathered that ZHULIAN has the biggest distributor force amongst its peers vs. Amway
(244,000) and Hai-O (171,350), due to its strong regional presence compared to its peers.
Distributor Force Network Presence
FY10 FY11 FY12
Malaysia 88000 88000 87200 Thailand 439000 473000 568500 Indonesia 13000 12000 17500 Singapore 1000 1000 900 Total 541000 574000 674100
Source: Company, Kenanga Research
FY12 products revenue contribution breakdown Number of distributors
Source: Company, Kenanga Research
Industry Overview
Global direct selling sales hit USD166.9b in 2012. Globally, the direct selling channel is a fast growing distribution conduit for “low ticket” consumer goods particularly household products, cosmetics, nutritional supplements and personal goods. Today virtually
all new direct selling companies are organized under “MLM” principles, also known as network marketing. According to the World Federation of Direct Selling Associations (“WFDSA”), the direct selling industry sales recorded a high of USD166.9b in 2012 with
around 89.7m direct sellers throughout the world, translating into USD1860.88 per distributor. The Asia Pacific region continued to
shine as the major hotspot for the MLM industry, with 44% market share in terms of revenue contribution.

Zhulian Corporation Berhad 05 September 2013
Page 5 of 18 KENANGA RESEARCH
A matured domestic market. Malaysia was ranked as the top direct selling market in the ASEAN region with per capita sales of
USD159.61 in CY12, up from USD100.76 a year ago. Wellness products (including weight management products, nutritional supplements, health foods and beverages, etc) have enjoyed steady gain in market share for the last several years and currently
account for 43% of the total sales. With MLM modus operandi gaining acceptance as a legitimate business model, the MLM industry
growth prospect is bright given the huge population in other ASEAN countries such as Thailand and Indonesia where ZHULIAN already has firm footholds.
CY12 Direct-Selling Industry Revenue
Population ('m) GDP (USD 'b) GDP per capita (USD) Sales (USD'm) Sales per capita (USD)
Malaysia 29.24 303.5 10,380.53 4,667 159.61
Thailand 66.79 365.6 5,473.74 2,947 44.13
Indonesia 246.86 878.0 3,556.79 1,088 4.41
Singapore 5.31 274.7 51,713.10 367 69.09 Source: World Bank, WFDSA, Kenanga Research
Malaysia Direct Sales Industry Revenue By Product Category
Source: WFDSA, Kenanga Research
Positive mid-to-long term MLM sector outlook. As at CY12, the MLM sector is still relatively small compared to the consumer retail sector. In Malaysia, the MLM sector is just about 5.5% of the size of consumer retail sector in terms of revenue. This shows the
huge potential for the MLM sector companies in the country. We are positive that the contribution from the MLM sector in the
consumer market would be bigger in the coming years, backed by their continuous efforts to enhance its product mix and expand new market. Besides, we believe that moving forward, there is a huge market for quality products and direct selling products are known to
be of higher quality compared to those sold in stalls. In 2012, the Direct Selling Blue Print launched by the government anticipated the industry to contribute RM54.5b during the 10th Malaysia Plan (2011-2015) and another RM86.0b in the 11th Malaysia Plan (2016-
2020), which equates to a total contribution of RM140.5b to the economy by 2020.
MLM in Malaysia is well regulated. The MLM industry in Malaysia is tightly regulated by the Ministry of Domestic Trade, Cooperative and Consumerism Malaysia (“MDTCC”). Also, most of the MLM companies are voluntary members of the Direct Selling
Association of Malaysia (“DSAM”), which is the national trade association formed to promote and maintain a conductive environment for the growth and stability of direct selling industry in Malaysia. Companies that intend to operate direct sales or multi-level
marketing need to apply for a license under the Direct Sales Act 1993 and Direct Sales Regulation 1993.
Growing household income and private spending. Higher national income level as aspired by the Economic Transformation Programme (“ETP”) aimed at boosting income levels and spurring investments will support MLM-related spending. For instance, the
two salary increments; first one in January and another round in July for the country’s 1.4 million civil servants that had cost the Government RM3.9b would help sustain consumer spending in the latter part of the year.
Zhulian Corporation Berhad 05 September 2013
Page 6 of 18 KENANGA RESEARCH
Retail sales Direct Sales
Source: CEIC, WFDSA, Kenanga Research
Consumer Sentiment Index Malaysia Mean Household Income Level
Source: CEIC, Kenanga Research
Financial Highlights
Expecting 3-year net profit CAGR of 12% over FY12-15E. We estimate FY13E-FY14E revenue growth of 11%-13% to
RM500.4m-RM563.7m which would yield us a net profit growth of 11%-15% to RM129.8m-RM149.1m, respectively. Its net profit CAGR of 12.0% in CY12E-CY15E is on the upper end of the spectrum amongst its peers - Amway (3-year fwd. CAGR = 7.7%) and
Hai-O (3-year fwd. CAGR = 13.0%). We have highlighted our key assumptions below;
Net Profit Growth
Source: Company, Kenanga Research
Steady historical top and bottom-line. Both its revenue and net profit have charted steady growth since FY07 underpinned by the growing sales in the local and overseas markets. As at FY12, its revenue and net profit recorded 5-year CAGR of 15.4% and 14.7%
respectively. FY12 was a watershed year when its exports sales to Thailand and Indonesia jumped a remarkable 41% YoY and lifted its total revenue by 26% to RM450.4m while net profit increased 23% YoY to RM117.1m.
Revenue Net Profit
Source: Company, Kenanga Research

Zhulian Corporation Berhad 05 September 2013
Page 7 of 18 KENANGA RESEARCH
Sources of income. Its Thailand operations earn two sources of revenue; export of goods to its Thailand associates (manufacturing
sales) and associate income from its Thailand operations which they have a 49% stake (distribution income). Its Malaysian operations also has two sources of income, namely manufacturing and distribution sales, although both of them are captured at gross levels.
ZHULIAN: How various income sources are accounted in the Income Statement
Source: Company, Kenanga Research
Thailand associate to drive growth. We have factored in an average of 20% export revenue growth p.a. for Thailand over FY13-
FY15E. We are being conservative, bearing in mind the 43% YoY revenue growth in FY12. In view of the vast prospects derived from a huge population size and a lower starting base, we are expecting the Thailand associate (distribution income) to spearhead the
growth of the company for the next 3 years. Back by a bullish outlook on the Thailand market and a stronger USD/MYR currency rate, we forecasted that the share of profit from associate is expected to jump from RM47.0m in FY12 to RM60.0m in FY13E and RM70.8 in
FY14E. Note that the export sales also include Indonesia and Singapore, which are fairly small markets which comprises 5% of export revenue; so export revenue will actually grow at an average of 19% p.a. over FY13E-FY15E.
No front loading despite price increase. A check with management confirmed that there was no front loading cases in Thailand after ZHULIAN increased its products prices in June to pass on higher raw material cost. This is mainly because of the short time gap
between the announcement during mid-May and the actual price adjustment in June. Accordingly, the management believe there was no pent-up demand just before the price increase period which means that the increasing sales from its Thailand associate are
sustainable and we expect a better 2H13 performance.
Thailand’s growth will more than compensate weaker Malaysian operations. We expect Malaysia to see slight declines in distribution sales volume, which has been conservatively reflected in our estimates, due to the price increases earlier this year. We are
forecasting an 8% drop in local distribution sales volume, a similar situation to the domestic market when the company increases their product prices back in 2010. Net effect of our forecast is a 6% YoY drop in local distribution revenue. Even so, growth in its Thailand
operations is more than enough to mitigate softer domestic sales.
No major costs concerns. Forex fluctuations, surging raw material and gold prices clawed into ZHULIAN’s earnings in FY11 and
FY12, resulting in lower margins in both years. Going forward, in line with our consumer strategy report, we believe that raw material prices except for milk powder would remain stable. Although milk powder prices are expected to increase, it is a very small
composition of its products. With a higher proportion of export manufacturing sales quoted in USD, the stronger USD coupled with the prices of its major raw materials (gold) trending lower, we can expect these developments to bode well for its Thailand contributions,
as highlighted earlier.
Gold Spot Prices Gross & Net Margins
Source: Bloomberg, Kenanga Research
Potential earnings catalysts if higher pricings results in better margins. From what we have gathered from the management, during the last price hike in FY10, gross margin surged to the highest point of 74%. ZHULIAN has raised their product
prices at the beginning of this year for Malaysia and in June for Thailand. However, to be conservative, we have yet to factor in this positive effect as we would like better clarity on how its consumers would react to the higher pricings.

Zhulian Corporation Berhad 05 September 2013
Page 8 of 18 KENANGA RESEARCH
Margin comparisons may hold less meaning going forward. We gathered that export revenue will become the most prominent
source of income for the group, going forward. Currently, exports makes up 58% of revenue while its local market makes up the balance. However, in FY13-FY14, we expect the export-local revenue ratio to lean towards exports at 65%:35% to 67%:33%. Do
note that the domestic market (manufacturing and distribution) sees higher margins vs. its export portion of sales. This is because its
export portion of sales is solely the manufacturing sales while its Thailand distribution income is captured at the ‘share of profit from associates’ given that its Thailand distribution arm is only 49% owned. As a result, as the group moves towards higher contributions
from its Thailand operations, we may see overall gross margins come-off while PBT/net margins will become distorted due to the significant share of associate’s contributions. Hence, we opine that margin comparisons with peers will become increasingly
meaningless given Zhulian’s unique structure. FY13-FY14 Earnings Forecast
FY10 FY11 FY12 FY13E FY14E
Malaysia revenue (Manufacturing & Sales) (RM ‘m) 157.7 172.1 188.3 176.7 183.8
Thailand export revenue (Manufacturing ONLY) (RM ‘m) 149.2 167.2 239.1 296.8 349.9
Gross profit margin (%) 74% 73% 69% 68% 68%
Share of profit from associate (Thailand sales) (RM ‘m) 30.4 35.5 47.0 60.0 70.1
Net profit (RM ‘m) 87.1 95.3 117.1 129.8 149.1
ROE (%) 25% 24% 26% 26% 26%
Malaysia revenue (Manufacturing & Sales) as % of Total Revenue 49% 48% 42% 35% 33%
Thailand export revenue (Manufacturing ONLY) as % of Total Revenue 46% 47% 53% 59% 62%
YoY Changes
Malaysia revenue (Manufacturing & Sales) -8% 9% 9% -6% 4%
Thailand export revenue (Manufacturing ONLY) 17% 12% 43% 24% 18%
Gross Profit Margin (ppt) -0.8 -1.5 -3.4 -1.1 0.0
Share of profit from associate (Thailand sales) 79% 17% 32% 28% 18%
Net profit 6% 9% 23% 11% 15% Source: Company, Kenanga Research
Hefty cash pile. As at FY12, ZHULIAN is sitting on RM137.7m net cash position. Being a cash-driven business, it has not taken any borrowings since its listing in 2007. As the management has indicated that they have no plans of expansion in the near term, this
brings us to forecast that ZHULIAN’s cash pile would continue to increase (FY13E: RM150.5m and FY14E: RM165.7m).
High dividend yield of 6.3%. Over the years, ZHULIAN has been paying out a minimum of 60% of its earnings as dividend. The
generous dividend payout is backed by the strength of its balance sheet and low capex spending requirements. A NDPS of 15.5 sen was paid out in FY12, implying 5.1% dividend yield. By applying a conservative 60% dividend payout ratio in FY14, we expect 19.4
sen NDPS, giving a yield of 6.3%.
Healthy Cash Conversion Cycle against its peers. Based on the table below, it appears that ZHULIAN’s turnover days for each of
the components such as inventory, receivables and payables are the highest. Having said that, we reckon that ZHULIAN’s cash
conversion cycle is still deemed as healthy at 49.54 days which is lower than Hai-O’s 106.79 days in FY12. Interestingly, Amway’s cycle for the same period is negative at minus 14.78 days. This means that Amway is leveraging on its good relationship with its
parent company where it only pays its parent company after it receives payment for selling those inventories.
FY12 Cash Conversion Cycle Peers Comparison
ZHULIAN HAI-O AMWAY
Inventory turnover (days) 162.35 101.47 45.76
Receivable turnover (days) 62.94 24.61 7.76
Payables turnover (days) 175.75 19.29 68.30
Cash Conversion cycle (days) 49.54 106.79 -14.78 Source: Company, Bloomberg, Kenanga Research
Historical Net Operating Cash Flow Historical Free Cash Flow
Source: Company, Kenanga Research
Zhulian Corporation Berhad 05 September 2013
Page 9 of 18 KENANGA RESEARCH
Risks
Regulatory risk. MLM companies have been a frequent subject of criticism as well as the target of lawsuits. Criticism mainly focused
on their similarity to illegal pyramid schemes, price fixing of products, emphasis on membership recruitment over actual sales, complex and sometimes exaggerated compensation schemes. New changes in regulations may results in stricter rules that may impair
growth.
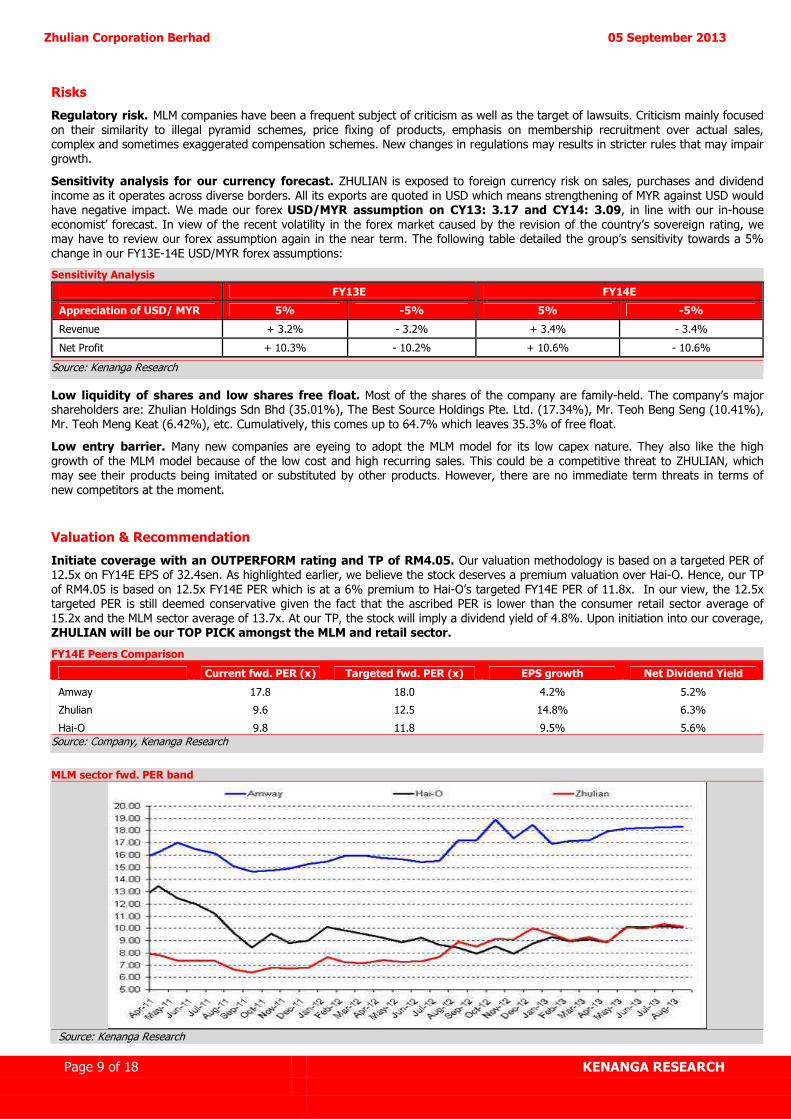
Sensitivity analysis for our currency forecast. ZHULIAN is exposed to foreign currency risk on sales, purchases and dividend
income as it operates across diverse borders. All its exports are quoted in USD which means strengthening of MYR against USD would have negative impact. We made our forex USD/MYR assumption on CY13: 3.17 and CY14: 3.09, in line with our in-house
economist’ forecast. In view of the recent volatility in the forex market caused by the revision of the country’s sovereign rating, we may have to review our forex assumption again in the near term. The following table detailed the group’s sensitivity towards a 5%
change in our FY13E-14E USD/MYR forex assumptions:
Sensitivity Analysis
FY13E FY14E
Appreciation of USD/ MYR 5% -5% 5% -5%
Revenue + 3.2% - 3.2% + 3.4% - 3.4%
Net Profit + 10.3% - 10.2% + 10.6% - 10.6%
Source: Kenanga Research
Low liquidity of shares and low shares free float. Most of the shares of the company are family-held. The company’s major shareholders are: Zhulian Holdings Sdn Bhd (35.01%), The Best Source Holdings Pte. Ltd. (17.34%), Mr. Teoh Beng Seng (10.41%),
Mr. Teoh Meng Keat (6.42%), etc. Cumulatively, this comes up to 64.7% which leaves 35.3% of free float.
Low entry barrier. Many new companies are eyeing to adopt the MLM model for its low capex nature. They also like the high
growth of the MLM model because of the low cost and high recurring sales. This could be a competitive threat to ZHULIAN, which may see their products being imitated or substituted by other products. However, there are no immediate term threats in terms of
new competitors at the moment.
Valuation & Recommendation
Initiate coverage with an OUTPERFORM rating and TP of RM4.05. Our valuation methodology is based on a targeted PER of 12.5x on FY14E EPS of 32.4sen. As highlighted earlier, we believe the stock deserves a premium valuation over Hai-O. Hence, our TP
of RM4.05 is based on 12.5x FY14E PER which is at a 6% premium to Hai-O’s targeted FY14E PER of 11.8x. In our view, the 12.5x targeted PER is still deemed conservative given the fact that the ascribed PER is lower than the consumer retail sector average of
15.2x and the MLM sector average of 13.7x. At our TP, the stock will imply a dividend yield of 4.8%. Upon initiation into our coverage, ZHULIAN will be our TOP PICK amongst the MLM and retail sector.
FY14E Peers Comparison
Current fwd. PER (x) Targeted fwd. PER (x) EPS growth Net Dividend Yield
Amway 17.8 18.0 4.2% 5.2%
Zhulian 9.6 12.5 14.8% 6.3%
Hai-O 9.8 11.8 9.5% 5.6% Source: Company, Kenanga Research
MLM sector fwd. PER band
Source: Kenanga Research

Zhulian Corporation Berhad 05 September 2013
Page 10 of 18 KENANGA RESEARCH
MLM sector peers comparison
As at 4-Sept 13 Market cap P/E (RM ‘m) FY13E FY14E
Amway 1982.5 18.6 17.8 Zhulian 1426.0 11.0 9.6 Hai-O 498.2 9.8 9.0 Sector Weighted Average 1302.2 14.7 13.7
Source: Kenanga Research
Retail sector peers comparison
As at 4-Sept 13 Market cap P/E (RM ‘m) FY13E FY14E
Amway 1982.5 18.6 17.8 Zhulian 1426.0 11.0 9.6 Hai-O 498.2 9.8 9.0 Aeon 5047.4 21.4 20.4 Padini 1171.1 13.2 10.8 Engkah 201.6 18.0 16.8 Parkson 3742.0 12.7 11.9 Asia Brands 272.9 7.4 6.4 Sector Weighted Average 896.3 16.3 15.2
Source: Kenanga Research
This section is left intentionally blank

Zhulian Corporation Berhad 05 September 2013
Page 11 of 18 KENANGA RESEARCH
Peer Comparison
COMPANY NAME Price Mkt Cap
PER (x)
Est. Div. Yld.
Historical ROE
P/BV Net
Profit (RMm)
This Year
Growth
Next Year
Growth
Target Price
Rating
(RM) (RMm) FY12A FY13F FY14F (%) (%) (x) FY12A FY13F FY14F (%) (%) (RM)
CORE COVERAGE
AMWAY (MALAYSIA) HLDGS BHD 12.08 1,982.5 19.9 18.6 17.8 5.2% 51.0% 8.61 99.80 106.90 111.30 7.1% 4.1% 12.20 Market Perform
HAI-O ENTERPRISE BHD 2.53 498.2 15.0 10.8 9.8 5.6% 21.0% 2.94 34.00 47.40 52.20 39.4% 10.1% 3.00 Outperform
ZHULIAN CORP BHD 3.10 1,426.0 12.1 10.9 9.5 6.4% 25.9% 3.13 117.10 129.82 149.09 10.9% 14.8% 4.05 Outperform
Simple Average 15.7 13.5 12.4
Weighted Average 16.5 14.8 13.8
Source: Bloomberg, Kenanga Research
Peer Comparison
Price (4/9/13) Target Price Potential Capital Upside Valuation Methodology COMPANY NAME
(RM) (RM)
CORE COVERAGE
AMWAY (MALAYSIA) HLDGS BHD 12.08 12.20 +1.0% FY14 PER of 18.0x (+1.1x SD above its mean)
HAI-O ENTERPRISE BHD 2.53 3.00 +18.6% FY14 PER of 11.8x (+1.7x SD above its mean)
ZHULIAN CORP BHD 3.10 4.05 +30.6% FY14 PER of 12.5x (+3.25x SD above its mean)
Source: Bloomberg, Kenanga Research

Zhulian Corporation Berhad 05 September 2013
Page 12 of 18 KENANGA RESEARCH
Income Statement Financial Data & Ratios
FY Nov (RM m) 2010A 2011A 2012A 2013E 2014E FY Nov (RM m) 2010A 2011A 2012A 2013E 2014E
Revenue 322.6 357.5 450.4 500.4 563.7 Growth (%)
EBITDA 82.4 87.3 103.2 106.1 119.6 Turnover 2.3 10.8 26.0 11.1 12.7 Depreciation (6.9) (7.8) (8.8) (9.5) (10.4) EBITDA -9.9 6.0 18.1 2.9 12.7 Operating Profit 75.5 79.6 94.3 96.7 109.2 Operating Profit -11.9 5.4 18.5 2.5 13.0 Interest Income (3.3) (4.1) (4.1) (4.1) (4.5) PBT 3.1 8.7 22.8 10.9 14.8 Interest Exp 0.0 0.0 0.0 0.0 0.0 Net Profit 6.2 9.5 22.8 10.9 14.8 Associate 30.4 35.5 47.0 60.0 70.8 Exceptional Items 0.0 0.0 0.0 0.0 0.0 Profitability (%) PBT 105.9 115.1 141.3 156.7 179.9 EBITDA Margin 25.5 24.4 22.9 21.2 21.2 Taxation (19.2) (19.8) (24.2) (26.9) (30.9) Operating Margin 23.4 22.3 20.9 19.3 19.4 Minority Interest 0.4 0.0 0.0 0.0 0.0 PBT Margin 32.8 32.2 31.4 31.3 31.9 Net Profit 87.1 95.3 117.1 129.8 149.1 Net Margin 27.0 26.7 26.0 25.9 26.4 Effective Tax Rate 18.2 17.2 17.1 17.1 17.1 Balance Sheet ROE 24.7 24.3 25.9 25.8 26.5 FY Nov (RM m) 2010A 2011A 2012A 2013E 2014E ROA 21.5 21.4 22.1 17.3 17.8 Fixed Assets 120.6 137.3 144.2 149.7 154.3 Intangible Assets 1.2 1.2 1.2 1.2 1.2 DuPont Analysis Other FA 58.4 79.6 105.2 133.9 164.0 Net Margin (%) 27.0 26.7 26.0 25.9 26.4 Inventories 44.4 48.8 62.0 235.5 265.3 Assets Turnover (x) 0.8 0.8 0.9 0.7 0.7 Receivables 48.3 49.3 77.7 77.6 87.4 Leverage Factor (x) 1.2 1.1 1.2 1.5 1.5 Other CA 1.3 2.4 0.9 0.9 0.9 ROE (%) 24.7 24.3 25.9 25.8 26.5 Cash 131.5 127.7 137.7 150.5 165.7 Total Assets 405.6 446.2 528.8 749.4 838.8 Leverage Debt/Asset (x) 0.0 0.0 0.0 0.0 0.0
Payables 47.5 45.3 67.1 235.7 265.5 Debt/Equity (x) 0.0 0.0 0.0 0.0 0.0
ST Borrowings 0.0 0.0 0.0 0.0 0.0 Net Cash/(Debt) 131.5 127.7 137.7 150.5 165.7 Other ST Liability 3.2 4.9 5.6 5.6 5.6 Net Debt/Equity (x) N.Cash N.Cash N.Cash N.Cash N.Cash LT Borrowings 0.0 0.0 0.0 0.0 0.0 Other LT Liability 2.9 3.7 4.3 4.3 4.3 Valuations Minorities Int. 0.0 0.0 0.0 0.0 0.0 EPS (sen) 18.9 20.7 25.5 28.2 32.4 Net Assets 352.0 392.3 451.8 503.8 563.4 NDPS (sen) 12.0 12.0 15.5 16.9 19.4 NTA (RM) 0.8 0.9 1.0 1.1 1.2 Share Capital 230.0 230.0 230.0 230.0 230.0 PER (x) 16.4 15.0 12.2 11.0 9.6 Reserves 122.0 162.3 221.8 273.8 333.4 Net Div. Yield (%) 3.9 3.9 5.0 5.5 6.3 Equity 352.0 392.3 451.8 503.8 563.4 P/NTA (x) 4.1 3.6 3.2 2.8 2.5 EV/EBITDA 15.7 14.9 12.5 12.0 10.5 Cashflow Statement FY Nov (RM m) 2010A 2011A 2012A 2013E 2014E Operating CF 80.8 73.6 63.5 95.1 103.6
Investing CF (19.1) (22.2) (12.1) (10.9) (10.5)
Financing CF (55.2) (55.2) (41.4) (71.3) (77.9)
Change In Cash 6.5 (3.8) 10.1 12.9 15.2
Free CF 77.7 67.3 71.5 107.0 119.4
Source: Kenanga Research
Fwd PER Band Fwd PBV Band
1.00
1.50
2.00
2.50
3.00
3.50
4.00
Apr-
11
Jun-1
1
Aug-1
1
Oct
-11
Dec-
11
Feb-1
2
Apr-
12
Jun-1
2
Aug-1
2
Oct
-12
Dec-
12
Feb-1
3
Apr-
13
Jun-1
3
Aug-1
3
PRICE (RM) PER 6.4 x PER 7.4 x PER 8.5 x PER 9.5 x PER 10.5 x
1.00
1.50
2.00
2.50
3.00
3.50
Ap
r-1
1
Jun
-11
Au
g-1
1
Oct
-11
Dec-
11
Feb
-12
Ap
r-1
2
Jun
-12
Au
g-1
2
Oct
-12
Dec-
12
Feb
-13
Ap
r-1
3
Jun
-13
Au
g-1
3
PRICE (RM) PBV 1.6 x PBV 1.9 x PBV 2.2 x PBV 2.5 x PBV 2.8 x
Source: Bloomberg, Kenanga Research

Zhulian Corporation Berhad 05 September 2013
Page 13 of 18 KENANGA RESEARCH
APPENDIX
Company Background
ZHULIAN was founded in 1989 initially to distribute gold-plated jewellery through the MLM channel. Within 4 years of inception, the
group commenced the construction of its first plant at Bayan Lepas Industrial Estate, Penang to cater for growing demand. Subsequently, to reduce its dependence on core products namely gold plated jewellery, the group diversified its product portfolio,
switching from a single-product strategy to a multiple-product strategy. Since then, ZHULIAN has grown into an integrated group with a regional presence in Malaysia, Thailand, Indonesia and Singapore. Today, ZHULIAN has emerged as one of the largest MLM
innovators in the direct selling industry, having an extensive network size of more than 954 internal staffs, 320 agencies and 674,100 distributors in the South-East Asia region.
ZHULIAN expansion milestone
1989 Years of founding 1993 Construction of its first plant 1996 Started to diversify product range 1996 Ventured into Thailand and Indonesia 2003 Ventured into Singapore 2009 Acquired 60% stake of ZHULIAN Indonesia
Source: Company, Kenanga Research
Company Milestones
Year Details
1989 • ZHULIAN MARKETING (M) SDN BHD (ZMMSB), a trading company was incorporated to market consumer products (mainly
gold-plated jewellery) through multi-level marketing (MLM) method.
1993 • ZHULIAN MARKETING (M) SDN BHD (ZMSB) received its direct selling license in 1993 when the Direct Selling Act, 1993 was
officially gazetted.
1994, Jan • Moved into the new premise located at Plot 41, Bayan Lepas Industrial Estate, Phase IV, Penang
1996, Nov • The company’s MLM business spread its wings to Thailand market through its Associate Company, ZHULIAN (THAILAND)
LTD. (ZTH) with an office situated in Haadyai, Thailand.
1997, Jul • ZHULIAN’s 2nd building located at Plot 42, Bayan Lepas Industrial Estate, Phase IV, Penang next to the 1st building
commenced operations.
1997, Oct • The company’s MLM business penetrated into the Indonesia market and set up its regional office in Medan, Indonesia.
1999, Oct • Relocation of ZHULIAN (THAILAND) LTD. (ZTH)’s regional office from Haadyai to Bangna, Bangkok for better logistic
infrastructures.
2002 • ZHULIAN’s nutritional food and beverage manufacturing division, was accredited with ISO 9001:2000 for compliance with
its standard quality management system
2003, May • Relocation of Indonesia Regional Office, now known as PT. ZHULIAN INDONESIA from Medan to Jakarta, Indonesia.
2003, July • ZHULIAN (THAILAND) LTD (ZTH) moved into its own premise where the regional office and warehouse were incorporated
under one roof at Nontaburi, Thailand
2004 • ZHULIAN began to tap into the Singapore market when ZHULIAN (SINGAPORE) PTE LTD (ZSG) commenced business
operations as one of its distribution arms.
2007 • ZHULIAN CORPORATION BERHAD was officially listed on the Main Board of Bursa Malaysia Securities Berhad. • ZHULIAN (SINGAPORE) PRE LTD (ZSG) moved into a bigger premise located at Jalan Masjid, Singapore • Set up a distribution centre at Kota Kinabalu, Sabah
2008, July • ZHULIAN’s third plant which is situated at Plot 3, Bayan Lepas Free Industrial Zone, Penang commenced operations
2009
• PT. ZHULIAN INDONESIA became one of the subsidiaries under ZHULIAN CORPORATION BERHAD with the Group having successfully acquired 60% of its shares
• Set up another distribution centre at East Malaysia which is situated at Kuching, Sarawak • ZHULIAN’s 3rd plant which produces nutritional food and beverage products obtained GMP (Good Manufacturing Practice)
certification for food quality and safety.
2010 • ZHULIAN (THAILAND) LTD. opened its 2-storey mega auditorium building on the premise adjacent to its regional office
building in Nontaburi, Thailand.
2011
• ZHULIAN’s nutritional food and beverage manufacturing division, which had been a certified compliant to ISO 9001:2000 since year 2002, obtained the latest ISO 9001:2008 recertification
• The office opening of its newly revamped 3-storey INTERNATIONAL HEADQUARTERS BUILDING on Plot 41, Bayan Lepas Industrial Estate, Penang.
Source: Company; Kenanga Research

Zhulian Corporation Berhad 05 September 2013
Page 14 of 18 KENANGA RESEARCH
ZHULIAN Corporate Structure
Source: Company Data; Kenanga Research
Subsidiaries under ZHULIAN Group
Multi-level Marketing ZHULIAN Industries Sdn. Bhd. Manufacturing of consumer products
ZHULIAN Jewellery Manufacturing Sdn. Bhd. Manufacturing of costume / fine jewellery and accessories
Beyond Products Technology Sdn. Bhd. Manufacturing of home technology products
ZHULIAN Manufacturing Sdn. Bhd. Manufacturing of bedroom apparels and therapeutic products
Amazing Vestrax Sdn. Bhd. Manufacturing of personal care products
ZHULIAN Nutraceutical Sdn. Bhd. Manufacturing of traditional products
ZHULIAN Printing Industries Sdn. Bhd. Printing of brochures, leaflets, catalogues, name cards and other related documents
Master Square Sdn. Bhd. Trading of consumer products
ZHULIAN Marketing (M) Sdn. Bhd. Direct marketing of costume jewellery and consumer products
ZHULIAN (Singapore) Pte. Ltd. Direct marketing of all kinds of costume jewellery and consumer products
P.T. ZHULIAN Indonesia Direct marketing of costume jewellery and consumer products
ZHULIAN (Thailand) Ltd. Direct marketing of costume jewellery and consumer products
Investment Holding ZHULIAN Management Sdn. Bhd. Provision of management services and investment holding
ZHULIAN Labuan Limited Investment holding
Others ZHULIAN Development Sdn. Bhd. Property development
Diamond Inspiration Sdn. Bhd. Operator of cafeteria for the employees of the Group
ZHULIAN Ventures Sdn. Bhd. Dormant
ZHULIAN Properties Sdn. Bhd. Dormant
Selat Nusantara Development Sdn. Bhd. Dormant
Dexassets Sdn. Bhd. Dormant
ZHULIAN Construction Sdn. Bhd. Dormant
ZHULIAN Development Co. Ltd. Dormant
Source: Company, Kenanga Research
Zhulian Corporation Berhad 05 September 2013
Page 15 of 18 KENANGA RESEARCH
Management Profile
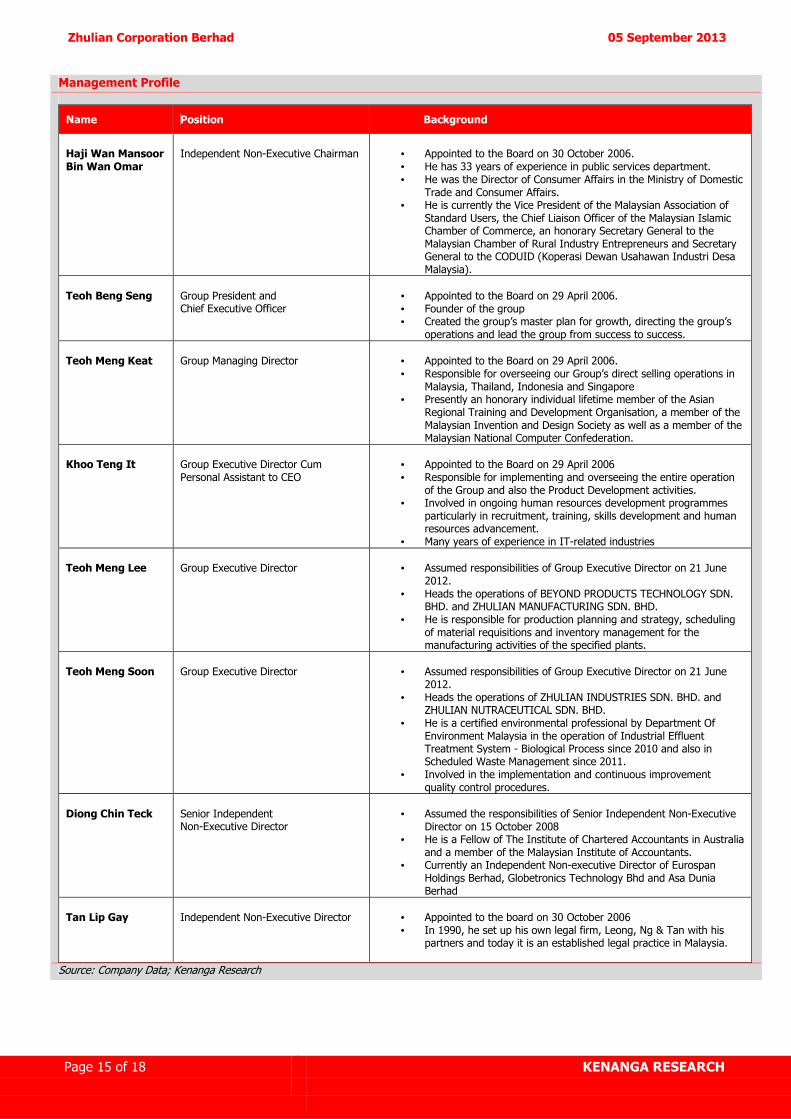
Name Position Background
Haji Wan Mansoor Bin Wan Omar
Independent Non-Executive Chairman
• Appointed to the Board on 30 October 2006. • He has 33 years of experience in public services department. • He was the Director of Consumer Affairs in the Ministry of Domestic
Trade and Consumer Affairs. • He is currently the Vice President of the Malaysian Association of
Standard Users, the Chief Liaison Officer of the Malaysian Islamic Chamber of Commerce, an honorary Secretary General to the Malaysian Chamber of Rural Industry Entrepreneurs and Secretary General to the CODUID (Koperasi Dewan Usahawan Industri Desa Malaysia).
Teoh Beng Seng
Group President and Chief Executive Officer
• Appointed to the Board on 29 April 2006. • Founder of the group • Created the group’s master plan for growth, directing the group’s
operations and lead the group from success to success.
Teoh Meng Keat
Group Managing Director
• Appointed to the Board on 29 April 2006. • Responsible for overseeing our Group’s direct selling operations in
Malaysia, Thailand, Indonesia and Singapore • Presently an honorary individual lifetime member of the Asian
Regional Training and Development Organisation, a member of the Malaysian Invention and Design Society as well as a member of the Malaysian National Computer Confederation.
Khoo Teng It
Group Executive Director Cum Personal Assistant to CEO
• Appointed to the Board on 29 April 2006 • Responsible for implementing and overseeing the entire operation
of the Group and also the Product Development activities. • Involved in ongoing human resources development programmes
particularly in recruitment, training, skills development and human resources advancement.
• Many years of experience in IT-related industries
Teoh Meng Lee
Group Executive Director
• Assumed responsibilities of Group Executive Director on 21 June
2012. • Heads the operations of BEYOND PRODUCTS TECHNOLOGY SDN.
BHD. and ZHULIAN MANUFACTURING SDN. BHD. • He is responsible for production planning and strategy, scheduling
of material requisitions and inventory management for the manufacturing activities of the specified plants.
Teoh Meng Soon
Group Executive Director
• Assumed responsibilities of Group Executive Director on 21 June
2012. • Heads the operations of ZHULIAN INDUSTRIES SDN. BHD. and
ZHULIAN NUTRACEUTICAL SDN. BHD. • He is a certified environmental professional by Department Of
Environment Malaysia in the operation of Industrial Effluent Treatment System - Biological Process since 2010 and also in Scheduled Waste Management since 2011.
• Involved in the implementation and continuous improvement quality control procedures.
Diong Chin Teck
Senior Independent Non-Executive Director
• Assumed the responsibilities of Senior Independent Non-Executive
Director on 15 October 2008 • He is a Fellow of The Institute of Chartered Accountants in Australia
and a member of the Malaysian Institute of Accountants. • Currently an Independent Non-executive Director of Eurospan
Holdings Berhad, Globetronics Technology Bhd and Asa Dunia Berhad
Tan Lip Gay
Independent Non-Executive Director
• Appointed to the board on 30 October 2006 • In 1990, he set up his own legal firm, Leong, Ng & Tan with his
partners and today it is an established legal practice in Malaysia.
Source: Company Data; Kenanga Research

Zhulian Corporation Berhad 05 September 2013
Page 16 of 18 KENANGA RESEARCH
ZHULIAN Golden Business Plan for distributors
Source: Company Data; Kenanga Research
ZHULIAN product range
Source: Company Data; Kenanga Research

Zhulian Corporation Berhad 05 September 2013
Page 17 of 18 KENANGA RESEARCH
Sample MLM companies in Malaysia
MLM Company List 1
Source: DSAM
MLM Company List 2
Source: DSAM

Page 18 of 18 KENANGA RESEARCH
Stock Ratings are defined as follows:
Stock Recommendations
OUTPERFORM : A particular stock’s Expected Total Return is MORE than 10% (an approximation to the 5-year annualised Total Return of FBMKLCI of 10.2%).
MARKET PERFORM : A particular stock’s Expected Total Return is WITHIN the range of 3% to 10%.
UNDERPERFORM : A particular stock’s Expected Total Return is LESS than 3% (an approximation to the 12-month Fixed Deposit Rate of 3.15% as a proxy to Risk-Free Rate).
Sector Recommendations***
OVERWEIGHT : A particular stock’s Expected Total Return is MORE than 10% (an approximation to the 5-year annualised Total Return of FBMKLCI of 10.2%).
NEUTRAL : A particular stock’s Expected Total Return is WITHIN the range of 3% to 10%. UNDERWEIGHT : A particular stock’s Expected Total Return is LESS than 3% (an approximation to the
12-month Fixed Deposit Rate of 3.15% as a proxy to Risk-Free Rate).
***Sector recommendations are defined based on market capitalisation weighted average expected total return for stocks under our coverage.
This document has been prepared for general circulation based on information obtained from sources believed to be reliable but we do not make any representations as to its accuracy or completeness. Any recommendation contained in this document does not have regard to the specific investment objectives, financial situation and the particular needs of any specific person who may read this document. This document is for the information of addressees only and is not to be taken in substitution for the exercise of judgement by addressees. Kenanga Investment Bank Berhad accepts no liability whatsoever for any direct or consequential loss arising from any use of this document or any solicitations of an offer to buy or sell any securities. Kenanga Investment Bank Berhad and its associates, their directors, and/or employees may have positions in, and may effect transactions in securities mentioned herein from time to time in the open market or otherwise, and may receive brokerage fees or act as principal or agent in dealings with respect to these companies.
Published and printed by: KENANGA INVESTMENT BANK BERHAD (15678-H) 8th Floor, Kenanga International, Jalan Sultan Ismail, 50250 Kuala Lumpur, Malaysia Chan Ken Yew Telephone: (603) 2166 6822 Facsimile: (603) 2166 6823 Website: www.kenangaresearch.com Head of Research