zhu, et al. proteomics in pathology: pt-swath analysis of ... · # correspondence should be...
TRANSCRIPT

Zhu, et al. Proteomics in Pathology: PCT-SWATH analysis of Hepatocellular carcinoma 1 / 26
1
Identification of protein abundance changes in biopsy-level hepatocellular carcinoma
tissues using PCT-SWATH
Yi Zhu1,2*, Jiang Zhu3*, Cong Lu3, Ping Sun4, Wei Xie3, Qiushi Zhang1, Liang Yue1, Tiansheng
Zhu1, Guan Ruan1, Ruedi Aebersold2,5#, Shi’ang Huang3#, Tiannan Guo1,2#
1 Westlake Institute for Advanced Study, Hangzhou, Zhejiang, P. R. China
2 Department of Biology, Institute of Molecular Systems Biology, Eidgenössische Technische
Hochschule (ETH) Zurich, Zurich, Switzerland
3 Center for Stem Cell Research and Application, Union Hospital, Tongji Medical College,
Huazhong University of Science and Technology, Wuhan, Hubei, P. R. China
4 Department of Hepatobiliary Surgery, Union Hospital, Tongji Medical College, Huazhong
University of Science and Technology, Wuhan, Hubei, P. R. China
5 Faculty of Science, University of Zürich, Zürich, Switzerland
*, co-first authors
# Correspondence should be addressed to Ruedi Aebersold ([email protected]),
Shi’ang Huang ([email protected]), and Tiannan Guo ([email protected])
peer-reviewed) is the author/funder. All rights reserved. No reuse allowed without permission. The copyright holder for this preprint (which was not. http://dx.doi.org/10.1101/300673doi: bioRxiv preprint first posted online Apr. 13, 2018;

Zhu, et al. Proteomics in Pathology: PCT-SWATH analysis of Hepatocellular carcinoma 2 / 26
2
Abstract
In this study, we optimized the pressure-cycling technology (PCT) and SWATH mass
spectrometry workflow to analyze biopsy-level tissue samples (2 mg wet weight) from 19
hepatocellular carcinoma (HCC) patients. Using OpenSWATH and pan-human spectral library,
we quantified 11,787 proteotypic peptides from 2,579 SwissProt proteins in 76 HCC tissue
samples within about 9 working days (from receiving tissue to SWATH data). The coefficient of
variation (CV) of peptide yield using PCT was 32.9%, and the R2 of peptide quantification was
0.9729. We identified protein changes in malignant tissues compared to matched control samples
in HCC patients, and further stratified patient samples into groups with high α-fetoprotein (AFP)
expression or HBV infection. In aggregate, the data identified 23 upregulated pathways and 13
ones. We observed enhanced biomolecule synthesis and suppressed small molecular metabolism
in liver tumor tissues. 16 proteins of high documented relevance to HCC are highlighted in our
data. We also identified changes of virus-infection-related proteins including PKM, CTPS1 and
ALDOB in the HBV+ HCC subcohort. In conclusion, we demonstrate the practicality of
performing proteomic analysis of biopsy-level tissue samples with PCT-SWATH methodology
with moderate effort and within a relatively short timeframe.
peer-reviewed) is the author/funder. All rights reserved. No reuse allowed without permission. The copyright holder for this preprint (which was not. http://dx.doi.org/10.1101/300673doi: bioRxiv preprint first posted online Apr. 13, 2018;

Zhu, et al. Proteomics in Pathology: PCT-SWATH analysis of Hepatocellular carcinoma 3 / 26
3
Introduction
Hepatocellular carcinoma (HCC) is the fifth frequent malignancy worldwide and ranks as
the third leading cause of cancer-related mortality1. In China, HCC accounts for more than
300,000 deaths every year 2. In early-stage disease, HCC patients’ survival can be significantly
improved by treatment including surgical resection and liver transplant. However, HCC mostly
exhibits no symptom at early stages. Consequently, less than one third of newly diagnosed HCC
patients are eligible for potential curative therapies. Therefore, early diagnosis of HCC is vital
for patient survival, and the identification of biomarkers for early HCC detection is a crucial
clinical need3.
Currently three FDA approved serum biomarkers are recommended to indicate the risk of
liver cancer in high risk populations: α-fetoprotein (AFP), AFP-L3, which is a fucosylated
isoform of AFP, and des-gamma-carboxy-prothrombin (DCP) 4. However, these markers are not
included in the surveillance guidelines published by the American Association for the Study of
Liver Diseases 5 and the European Association for the Study of the Liver 6 because of low
sensitivity and specificity. In China, AFP is used jointly with ultrasonography, computed
tomography (CT) and pathology examination for early screening of HCC patients, as
recommended by the Asian Pacific Association for the Study of the Liver 7. This is based on the
knowledge that the positive rate of AFP in HCC is about 60-80% 8.
Better biomarkers are needed for HCC. The search for HCC biomarkers from clinical
specimens using proteomics approaches has been focused mainly on blood samples 9,10. Besides,
some studies also investigated biological fluids including urine 11 and tissue interstitial fluid 12.
Nevertheless, HCC tissue samples have not been extensively studied by advanced proteomics
methods, even though dysregulated tissue proteins are presumably the main source of potential
blood and biofluidic biomarkers. From the literature, we found that Li, et al studied malignant
and matched non-tumorous tissues (about 100 mg tissue per sample) from eleven HCC patients
using two dimensional LC coupled with shotgun proteomics with a LC gradient of 165 min and
observed upregulation of SET Complex proteins 13. Megger, et al nominated 51 differentially
expressed proteins from about 573 proteins identified by 2D gel electrophoresis and label-free
shotgun proteomic analysis of 7 pairs of HCC tissue samples, 14. In a more recent study,
Naboulsi W. et al. identified and quantified 2,736 proteins from 19 pairs of HCC tumorous and
peer-reviewed) is the author/funder. All rights reserved. No reuse allowed without permission. The copyright holder for this preprint (which was not. http://dx.doi.org/10.1101/300673doi: bioRxiv preprint first posted online Apr. 13, 2018;

Zhu, et al. Proteomics in Pathology: PCT-SWATH analysis of Hepatocellular carcinoma 4 / 26
4
adjacent non-tumorous tissue using the label-free shotgun proteomics over a 98-min LC gradient
15. Gao et al 16 applied SWATH-MS to study 14 pairs of HCC and non-HCC tissues and
quantified 4,216 proteins in at least one biological replicates and 1,903 proteins in at least three
out of five biological replicates using a 120-min LC gradient. For each sample, about 200 mg
tissue was used. These studies are generally of relatively low throughput and consumes relatively
large amount of tissue samples.
We have recently developed a methodology integrating pressure cycling technology
(PCT) and SWATH mass spectrometry (MS) for the rapid acquisition of proteotypes, defined as
the acute quantitative state of a proteome, from biopsy-level tissue samples (about 2 mg wet
weight) 17. PCT technology produces high pressure (up to 45,000 p.s.i.) and lyses tissue samples
by oscillating the pressure between low and high values, thereby allowing tissue lysis and protein
digestion to occur in the same PCT-MicroTube. The method can be applied in a semi-automated
and standardized manner and achieves relatively high sample throughput 17-19. SWATH-MS is an
emerging data-independent acquisition (DIA) mass spectrometric method that offers a high
degree of quantitative accuracy, proteomic coverage, reproducibility of proteome coverage and
sample-throughput 20. The PCT-SWATH methodology was further demonstrated to be
applicable to rapid proteotype acquisition from sub milligrams of tissue samples 19. In our first
study that demonstrated the technology, the PCT-SWATH method was applied to process and
convert 18 biopsy samples from nine patients with renal cell carcinoma into SWATH-MS
fragment ion maps 17. With a two-hour LC gradient, a 32 fixed SWATH windows setting, and
the OpenSWATH data analysis tool 21, about 2,000 SwissProt proteins were identified with a
high degree of reproducibility across all samples 17. More recently, a more advanced and
miniaturized device, i.e. PCT-MicroPestle 18 was introduced providing for higher efficiency of
protein extraction and peptide generation from biopsy-level tissues.
In this study, we firstly improved the PCT-SWATH methodology by adopting a 45-min
LC gradient and an acquisition method using 67 variable SWATH windows to increase the
sample throughput without compromising the proteomic depth. Then we applied the improved
workflow to analyze peptide samples from a cohort of HCC patients in technical duplicate with
unprecedented reproducibility and throughput.
peer-reviewed) is the author/funder. All rights reserved. No reuse allowed without permission. The copyright holder for this preprint (which was not. http://dx.doi.org/10.1101/300673doi: bioRxiv preprint first posted online Apr. 13, 2018;

Zhu, et al. Proteomics in Pathology: PCT-SWATH analysis of Hepatocellular carcinoma 5 / 26
5
Materials and Methods
Patients and tissue samples
38 fresh frozen tissues from 19 HCC patients were collected from Union Hospital, Tongji
Medical College, Huazhong University of Science and Technology, Wuhan, China. The clinical
and pathological data for these patients are provided in Table 1. For each patient, two tissue
biopsy punches (with dimensions of 5*5*5 mm3) including a tumorous tissue and a non-
tumorous tissue from an adjacent region as determined by histomorphological examination were
collected. All 38 tissue samples were collected from hepatectomy specimens within 1 hour after
surgical removal, snap frozen and stored at -80℃ until proteomic analysis. The sample collection
was approved by institutional review board of the Union Hospital in Wuhan, China. This study
was approved by Ethics Committee of Tongji Medical College, Huazhong University of Science
and Technology.
PCT-assisted sample preparation
For each sample, about 1.6 ~ 2.5 mg (wet weight) of frozen tissue was processed based
on the protocol described previously 17,18. Briefly, tissues were lysed with the PCT-MicroPestle
device (Pressure BioSciences Inc, South Easton, MA) in 30 µL of lysis buffer composed of 8M
urea, 0.1 M ammonium bicarbonate, and protease inhibitor (Roche) in a barocycler HUB440
(Pressure BioSciences Inc). The tissue lysis was performed under a program consisting of 60
oscillating cycles, with each cycle consisting 50 s of high pressure at 45,000psi and 10 s of
ambient pressure at 33℃. Then the extracted proteins were reduced and alkylated by incubation
with 10mM Tris (2-carboxyethyl) phosphine (TCEP) and 20 mM Iodoacetamide (IAA) at 25°C.
This was followed by vortexing at 600 rpm for 30 min in the dark, at ambient pressure.
Afterwards, digestion was first performed with Lys-C (Wako; enzyme-to-substrate ratio, 1:40) in
the barocycler (20,000 psi, 50 s high pressure and 10 s ambient pressure, 45 cycles), followed by
trypsin (Promega, enzyme-to-substrate ratio, 1:50) digestion in the barocycler (20,000 psi, 50 s
high pressure and 10 s ambient pressure, 90 cycles). After digestion, the peptides were acidified
with trifluoroacetic acid (TFA) to pH 2-3 and cleaned with SEP-PAK C18 (1cc 50mg) cartridges
(Waters).
SWATH-MS
peer-reviewed) is the author/funder. All rights reserved. No reuse allowed without permission. The copyright holder for this preprint (which was not. http://dx.doi.org/10.1101/300673doi: bioRxiv preprint first posted online Apr. 13, 2018;

Zhu, et al. Proteomics in Pathology: PCT-SWATH analysis of Hepatocellular carcinoma 6 / 26
6
The sample samples were spiked with iRT peptides (Biognosis, Zurich, Switzerland) at a
1:10 (vol/vol) ratio. One microgram of peptide sample was injected to an Eksigent 1D+ Nano LC
systems (Eksigent, Dublin, CA) and analyzed in a 5600 TripleTOF mass spectrometer (SCIEX)
in SWATH mode as described previously 17. We optimized the LC gradient to 45 min
(Supplementary Fig. 1), and the SWATH acquisition scheme to 67 variable windows
(Supplementary Table 1). The other SWATH parameters were set exactly as in our previous
study 17, except that the ion accumulation time for each SWATH window was 40 ms. Ion
accumulation time for peptide precursors was set at 50ms. The 38 samples were injected into the
mass spec in randomized sequence once and then the same sequence was injected again to obtain
a duplicate analysis. After each gradient, the column was washed twice using ramping gradient
to minimize carry-over (Supplementary Fig. 1). Mass calibration using beta-gal was performed
every fourth injection.
OpenSWATH analysis
OpenSWATH (version 2014-12-01-154112) 22 was performed as described previously 17
except that a pan-human library (32 windows version) 21 was used to search the SWATH data in
the iPortal platform 23. The details of the pan-human library, containing 139,449 peptides from
10,316 proteins, have been described previously21. The default parameters as used previously 17
are provided in Supplementary Table 2.
Pathway and process enrichment analysis
Pathway and process enrichment analysis of the differentially abundant proteins were
performed using Metascape (http://metascape.org). Terms with p-value < 0.01, minimum count
3, and enrichment factor > 1.5 (enrichment factor is the ratio between observed count and the
count expected by chance) are collected and grouped into clusters based on their membership
similarities. To further capture the relationship among terms, a subset of enriched terms was
selected and rendered as a network plot, where terms with similarity > 0.3 are connected by
edges.
Protein-protein interaction enrichment analysis was carried out for each given gene list
(http://metascape.org). The resultant network contains the subset of proteins that form physical
interactions with at least another list member. Molecular Complex Detection (MCODE)
algorithm 24 was applied to identify densely connected network components. Pathway and
peer-reviewed) is the author/funder. All rights reserved. No reuse allowed without permission. The copyright holder for this preprint (which was not. http://dx.doi.org/10.1101/300673doi: bioRxiv preprint first posted online Apr. 13, 2018;

Zhu, et al. Proteomics in Pathology: PCT-SWATH analysis of Hepatocellular carcinoma 7 / 26
7
biological process enrichment analysis was applied to each MCODE components independently
and the three best-scoring (by p-value) terms were retained as the functional description of the
corresponding components.
Statistics
In volcano plots, paired Student t test was used to compute p values followed by Benjamini &
Hochberg correction in R.
Data deposition
All the SWATH Data files, library and original OpenSWATH results are deposited in
PRIDE project 25: PXD004873. Reviewer account details: Username:
[email protected]; Password: WTpBL22V
(Note for reviewers: Prior to publication, this data set only be found in PRIDE after the
reviewer logs into PRIDE using the username and password provided above. This data set
cannot be found without logging in.)
peer-reviewed) is the author/funder. All rights reserved. No reuse allowed without permission. The copyright holder for this preprint (which was not. http://dx.doi.org/10.1101/300673doi: bioRxiv preprint first posted online Apr. 13, 2018;

Zhu, et al. Proteomics in Pathology: PCT-SWATH analysis of Hepatocellular carcinoma 8 / 26
8
Results and Discussion
Identification of peptides and proteins by PCT-SWATH
To start we extracted proteins from 38 biopsy-level liver tissue samples and produced
tryptic peptides using the PCT method 17,26. We measured the wet weight of each tissue sample
and the total amount of peptide mass generated from the tissue and computed the peptide yield in
weight percent per milligram of tissue. The results shown in Fig. 1A indicate that the peptide
yield for the 38 samples varied from 1.0% to 9.5%, with an average value of 6.0%. 59.6 µg of
total peptide mass per milligram wet liver tissue were obtained on average. The peptide yield in
tumor tissue (4.9% on average) was lower than that of normal tissue (8.1% on average, p value =
0.00037) (Fig. 1A). The results further showed that tumorous samples exhibited more variability
in terms of peptide yield compared to the normal tissue samples. The coefficient of variation
(CV) of peptide yield was 15.8% for normal tissue samples (n = 19), 40.7% for tumorous
samples (n = 19), and 32.9% overall (n = 38) (Fig. 1B), demonstrating the heterogeneity of liver
tumors.
Each peptide sample was then analyzed using SWATH-MS in technical duplicate, using
a 45-min LC gradient and a 67 variable SWATH window acquisition scheme (Supplementary
Table 1) which was optimized based on the ion density map of human proteins extracted from
HCC tissues. With this SWATH window setting, up to 20 samples were analyzed per MS
instrument per 24 hours. Mass calibration using beta-gal was performed every fourth injection.
The MS analysis of the 76 SWATH runs were completed in about 4 working days.
After searching the resulting raw data files against the pan-human SWATH assay library
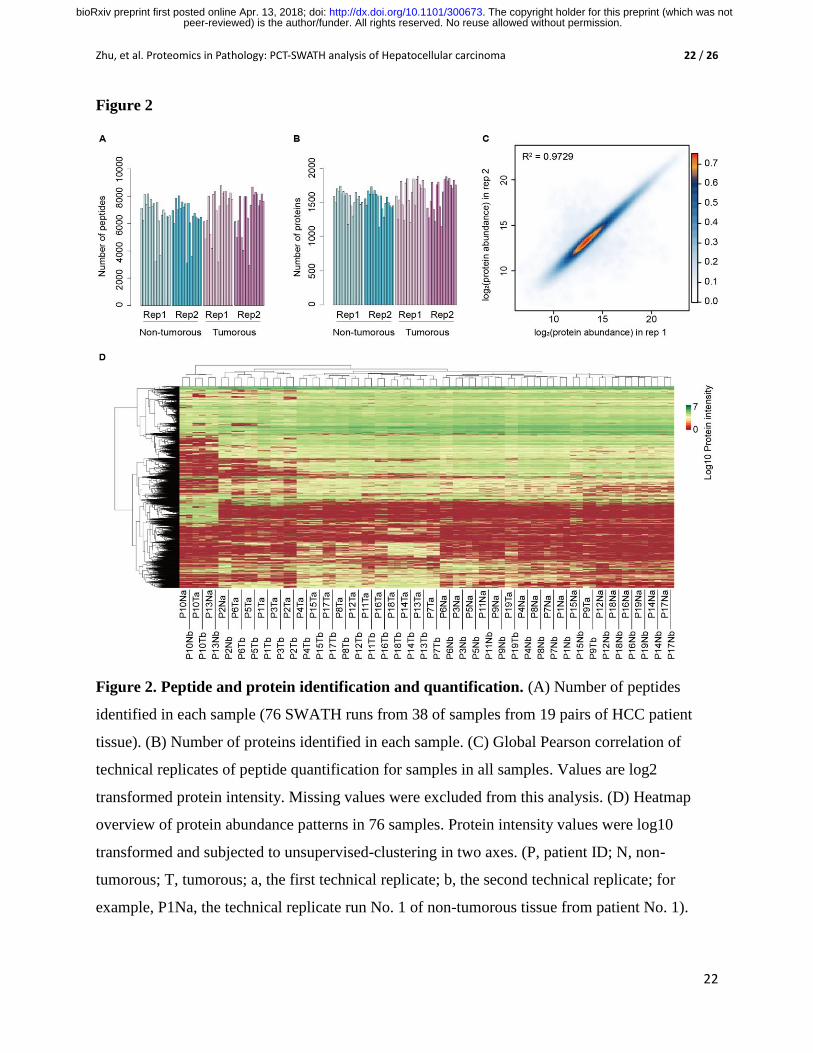
21, 2,579 unique proteotypic SwissProt proteins with 11,787 unique peptides were identified at a
false discovery rate (FDR) below 1% using OpenSWATH 21 (Supplementary Table 3).
Comparable numbers of proteins and peptides were quantified from both non-tumorous and
tumorous type of tissue samples (Fig. 2A and 2B). In this study, the PCT-SWATH throughput
was further increased compared to the previous work 17. The protein numbers identified per
sample was slightly higher than those obtained from human kidney tissues 17.
Variability of protein expression between tumor and non-tumorous tissues
peer-reviewed) is the author/funder. All rights reserved. No reuse allowed without permission. The copyright holder for this preprint (which was not. http://dx.doi.org/10.1101/300673doi: bioRxiv preprint first posted online Apr. 13, 2018;

Zhu, et al. Proteomics in Pathology: PCT-SWATH analysis of Hepatocellular carcinoma 9 / 26
9
To evaluate the quantitative accuracy of the method, we computed the global Pearson
correlation of the two technical replicates at the peptide level for all samples after removing
missing values. The R2 was 0.9729 (Fig. 2C), indicating that our label-free method could
quantify peptides with high degree of reproducibility. The global view of protein quantification
is shown in Fig. 2D. It shows that all the technical replicates were clustered together
respectively.
We then analyzed the overall variation of protein abundance for all 2,579 quantified
proteins from tumor tissues, adjacent non-tumorous (normal) tissues and all samples,
respectively (Fig. 3A). The data showed that the CV of tumorous tissue samples was slightly
greater than that of adjacent non-tumorous tissues, indicating more overall variability of protein
expression in tumors. We next checked the relationship between protein abundance and the
overall variation among these samples and observed that low abundance proteins exhibited a
higher degree of overall variability (Fig. 3B, 3C, 3D). In Fig. 2C, proteins of low abundance
demonstrated comparable reproducibility with high abundance proteins, therefore we mainly
attributed the higher variability in tumor tissue to biological causes.
Differentially regulated proteins characterized in the HCC cohort
We further explored differentially expressed proteins between tumorous and non-
tumorous samples. A total of 541 proteins showed significant differential abundance (Fig. 4A).
Of these, 381 proteins showed increased abundance and 160 proteins showed decreased
abundance in tumorous tissues compared to non-tumorous tissues. Pathway enrichment analysis
of the regulated proteins in HCC tumorous tissues was performed by Metascape. We found that
proteins with increased abundance were highly enriched in mRNA related processes including
mRNA metabolic process, peptide metabolic process, ribonucleoprotein complex biogenesis, and
nuclear transport. The proteins with decreased abundance were found to be mostly involved in
small molecule metabolic processes such as small molecule catabolic process, monocarboxylic
acid metabolic process, and carbon metabolism.
Next, we carried out protein-protein interaction network analysis using Metascape. The
resultant network contains the subset of proteins that form physical interactions with at least
another protein showing altered abundance. Heat shock proteins (HSP) were found to be
increased (Fig. 4B). HSP proteins constitute a family of highly conserved stress response
peer-reviewed) is the author/funder. All rights reserved. No reuse allowed without permission. The copyright holder for this preprint (which was not. http://dx.doi.org/10.1101/300673doi: bioRxiv preprint first posted online Apr. 13, 2018;

Zhu, et al. Proteomics in Pathology: PCT-SWATH analysis of Hepatocellular carcinoma 10 / 26
10
proteins that can protect cells and induce them to repair damage caused by a variety of stress 27.
Several members of the HSP family have been reported to be overexpressed in a wide range of
human cancers 28. The HSP70 family contains at least eight homologous chaperone proteins that
differ from each other by amino acid sequence, expression level and sub-cellular localization 29.
Hsp70-1 is an essential molecular chaperon upregulated in response to heat, stress, or cell
survival protection and its function is tightly controlled by heat shock factor-1 (HSF-1). It has
been demonstrated that 14-3-3σ protein induces HSP70 via a β-catenin/HSF-1-dependent
pathway, which consequentially modulates HCC. The HSF-1/Hsp70-1 protein complex is
therefore considered to be targeted for developing a prognostic tool for HCC 30.
We also observed that proteins related to mitochondrial translation, specifically the
mitochondrial ribosomal proteins (MRPs), were among the most strongly upregulated protein
clusters (Fig. 4C). Tumor initiation and progression in cancer cells involve the development of
mechanisms to inhibit apoptosis at multiple stages, whereas mitochondria play crucial roles in
the induction of apoptosis and programmed cell death. This paradigm is central to malignant
cellular transformation because altered mitochondrial function and defective apoptosis are well-
known hallmarks of cancer cells. It has also been reported that the expression of genes encoding
MRPs, mitoribosome assembly factors and mitochondrial translation factors is modulated in
multiple cancers, which is linked to tumorigenesis and metastasis 31. Mini-chromosome
maintenance complex component 7 (MCM7) was also found to be overexpressed (Fig. 4C).
MCM7 plays an essential role in initiating DNA replication. DNA replication is a central process
in cell proliferation, while aberrant DNA replication is a driving force of oncogenesis. It has
been reported that overexpressed MCM7 is associated with a poor prognosis of HCC patients,
and MCM7 promotes HCC cell proliferation via upregulating MAPK-cyclin D1 pathway both in
vitro and in vivo 32. In addition, the hallmark MYC targets proteins, and the cell cycle checkpoint
proteins involved in G2/M transitions, are also among the upregulated protein networks.
Small molecule catabolic processes define the group of proteins that showed the strongest
reduction of abundance in the HCC samples tested (Fig. 4D). Our data showed that proteins
involved in glycogen metabolism pathway were suppressed in HCC samples. These proteins
include the glycogen synthesis enzymes including phosphoglucomutase-1 (PGM1), and UTP-
glucose-1-phosphate uridylyltransferase (UGP2), as well as the glycogen degradation enzyme
liver glycogen phosphorylase (PYGL). They are downregulated in tumorous tissues compared to
peer-reviewed) is the author/funder. All rights reserved. No reuse allowed without permission. The copyright holder for this preprint (which was not. http://dx.doi.org/10.1101/300673doi: bioRxiv preprint first posted online Apr. 13, 2018;

Zhu, et al. Proteomics in Pathology: PCT-SWATH analysis of Hepatocellular carcinoma 11 / 26
11
their matched non-tumorous controls, indicating the reprogramming of glycogen metabolism in
HCC which suppresses the turn-over of glycogen. However, our data did not indicate whether
this reprogramming changed the direction of glycogen storage.
Both cystathionine β-synthase (CBS) and cystathionine-γ-lyase (CTH) were found at
decreased abundance in the HCC samples tested (Fig. 4D). CBS and CTH are abundant proteins
in the liver, endogenously produce hydrogen sulfide (H2S), a gasotransmitter modulating
synaptic transmission, vasorelaxation, angiogenesis, inflammation, and cellular bioenergetics.
Regulation of H2S influences lipid metabolism, glucose metabolism, oxidative stress, and
mitochondrial bioenergetics 33. Suppression of CBS transcripts has been reported in a study of
120 HCC patients compared to non-cancerous liver tissue 34. Reduced CBS transcripts
expression is significantly correlated with high tumor stage, high Edmondson grade, and high
AFP level 34. However, neither the CBS nor the CTH protein level has yet been investigated in
HCC tissue. Our data suggests downregulation of H2S production via suppressing CBS and CTH
in HCC tissues.
The ethanol metabolism was also found to be downregulated (Fig. 4D). Aldehyde
dehydrogenase (ALDH) is a gene superfamily that is responsible for the detoxification of
biogenic and xenogenic aldehydes. Both ALDH2 and ALDH1B1 proteins were significantly
downregulated. The ethanol detoxifying pathway in humans occurs mainly in the liver and is
carried out by two enzymatic steps. In the first step ethanol is metabolized quickly by alcohol
dehydrogenase (ADH) to generate acetaldehyde, and the latter is then metabolized by the
mitochondrial ALDH2 to acetate 35. ALDH2 is expressed ubiquitously in all tissues but is most
abundant in the liver and found in high amounts in organs that require high mitochondrial
oxidative phosphorylation. The downregulation of ALDH in tumorous liver tissue will likely
accumulate toxin acetaldehyde and promote tumorigenesis.
In summary, liver is the pivotal organ for molecular synthesis and the metabolic hub of
human beings. Our data show that the molecular synthesis related pathways are enhanced, while
most major metabolic processes were suppressed in the HCC tissues tested, suggesting a
biochemical imbalance in HCC cells.
Proteins with altered abundance in HCC patients with high serum AFP
peer-reviewed) is the author/funder. All rights reserved. No reuse allowed without permission. The copyright holder for this preprint (which was not. http://dx.doi.org/10.1101/300673doi: bioRxiv preprint first posted online Apr. 13, 2018;

Zhu, et al. Proteomics in Pathology: PCT-SWATH analysis of Hepatocellular carcinoma 12 / 26
12
Next, we explored the molecular pathogenesis of HCC by associating protein expression
with various clinic-pathological characteristics of HCC. AFP is the most widely used tumor
biomarker currently available for early detection of HCC, and the widely accepted threshold of
serum AFP is 20 ng/mL. It has been reported that at this threshold, serum AFP had a sensitivity
of 41-65% and specificity of 80-94% 36. We grouped the 19 HCC patients in our cohort into two
groups, according to an AFP-cutoff of 20 ng/mL (Table 1), computed the fold change of protein
expression between tumorous and non-tumorous tissues, and checked the protein regulation
pattern of 11 patients with high AFP level (> 20 ng/ml) and six patients with low AFP level (<
20 ng/ml), respectively. Two patients without serum AFP examination value at surgical
operation were excluded from these analyses. Although a considerable proportion of HCC
patients in the cohort do not have elevated serum AFP, and serum AFP can increase in patients
with diseases other than HCC 4, high expression of AFP in serum correlated with high cell
proliferation, high angiogenesis and low apoptosis and was associated with poor prognosis of
HCC patients 37. Indeed, we found in our data set that the low serum AFP level was closely
related to higher survival rate of the patients (5 out of 7 patients have recurrence free survival),
especially when there was no portal vein thrombosis detected by CT at diagnosis, as is shown in
Table 1. On the other hand, in the AFP-high patient group, 5 of 10 patients were dead and 2
patients suffered from tumor recurrence, displaying poorer survival (Table 1). Nevertheless,
statistical analysis was not feasible due to small sample size.
With respect to the AFP-high patient group, 419 proteins showed increased abundance
and 192 proteins showed decreased abundance (P value < 0.05) in tumorous samples compared
non-tumorous samples. Pathway enrichment and network analysis of these differentially
expressed proteins revealed similar results with the above 541 regulated proteins from all 19
HCC patients (Fig. 5A). In the AFP-low subgroup, our data showed no protein significantly
regulated between the tumorous and non-tumorous tissues, probably due to the small sample
size.
In the AFP-high subgroup (Fig. 5B), we identified additional downregulated proteins
including methylene tetrahydrofolate dehydrogenase 1 (MTHFD1), which is an enzyme
identified in the one-carbon (1C) metabolism pathway. Another enzyme in the pathway, i.e.
serine hydroxymethyltransferase (SHMT1), is also downregulated (Fig. 4D). The data suggest
reprogramming of one-carbon metabolism in HCC. This is consistent with the Liverome study
peer-reviewed) is the author/funder. All rights reserved. No reuse allowed without permission. The copyright holder for this preprint (which was not. http://dx.doi.org/10.1101/300673doi: bioRxiv preprint first posted online Apr. 13, 2018;

Zhu, et al. Proteomics in Pathology: PCT-SWATH analysis of Hepatocellular carcinoma 13 / 26
13
reporting that downregulation of MTHFD1 is prevalent in proliferative and poorly differentiated
HCCs38 .
We also observed downregulation of a tumor suppressor protein regucalcin (RGN) which
modulates multiple protein kinases and phosphatases in cancers including HCC 39. Transcripts
analysis reports that prolonged survival in HCC patients is associated with increased RGN gene
expression 40. Our data at protein level further consolidate the potential roles of RGN in HCC.
Two proteins involved in lipid metabolism showed decreased expression in the AFP-high
HCC tissues. ACAA2 is a mitochondrial enzyme involved in the fatty acid metabolism pathway.
ANXA6 is a lipid-binding protein highly expressed in the liver, regulating cholesterol
homeostasis and signaling pathways with a role in liver physiology. A recent study found that
ANXA6 was downregulated in HCC tissues compared to non-tumorous tissues in 18 HCC
patients 41. The data indicate dysfunction of lipid metabolism in HCC tissues.
Quantitative proteomics analysis of Hepatitis B virus positive (HBV+) HCC subgroup
Chronic HBV is the most common cause of HCC in China. Approximately 80% of HCC
develops from liver cirrhosis, which predominantly progresses from HBV in China 42. We found
that 106 and 75 proteins showed increased or decreased abundance, respectively, in 11 HCC
patients with HBV infection (Fig. 5C) compared to those without HBV infection. Subsequent
pathway and protein interaction analysis by Metascape revealed a number of interesting protein
clusters (Fig. 5D) that showed a close relationship to liver cirrhosis in patients with chronic HBV
infection. Pyruvate kinase M (PKM) was found to be upregulated in this HBV+ subgroup (Fig.
5D). PKM is a protein kinase that catalyzes the final step in glycolysis by transferring the
phosphate from phosphoenolpyruvate (PEP) to ADP, thereby generating pyruvate and ATP 43.
PKM has two isoforms, PKM1 and PKM2. PKM2 plays an important role in metabolic
alterations related to inflammation and cancer. The ATP generation by PKM2, unlike
mitochondrial respiration, is independent of oxygen and thus allows tumor cells to grow in
hypoxic conditions. Cancer cells are characterized by high glycolytic rates to support energy
regeneration and anabolic metabolism, along with the high expression of PKM2 44. It has been
shown in a recent report that the anti-apoptotic protein poly(ADP-ribose) polymerase (PARP)14
promotes aerobic glycolysis in HCC by maintaining low activity of PKM2, and that the
PARP14-JNK1-PKM2 regulatory axis links apoptosis and metabolism 45. In agreement with our
peer-reviewed) is the author/funder. All rights reserved. No reuse allowed without permission. The copyright holder for this preprint (which was not. http://dx.doi.org/10.1101/300673doi: bioRxiv preprint first posted online Apr. 13, 2018;

Zhu, et al. Proteomics in Pathology: PCT-SWATH analysis of Hepatocellular carcinoma 14 / 26
14
finding that HBV+ tumors expressed higher level of PKM, there is another report showing that
high PKM2 expression was more frequently found in cirrhotic liver caused by HBV infection
than in non-cirrhotic liver, and that PKM2 overexpression was associated with poor survival
rates in HCC patients with cirrhotic liver (CL) 46.
Cytidine triphosphate synthase 1 (CTPS1) is another example of a protein that showed
higher expression in the HBV+ HCC subgroup in this study compared to patients without HBV
infection (Fig. 5D). CTPS1 catalyzes the rate-limiting step in the de novo CTP synthetic
pathway, in which a UTP is converted into CTP with the consumption of glutamine and ATP. In
fact, upregulated CTPS1 activity has been observed in multiple human and rodent tumors 47,
promoting tumor transformation and progression 48. Recently, researchers focus on the CTPS
cytoophidium that is a filamentous intracellular macrostructure aggregated by CTPS, and is able
to promote the activity of CTPS 49. A recent study examined the presence of CTPS cytoophidia
in the tumorous and the adjacent non-tumorous tissues of HCC patients, and found that many
cytoophidia were observed in 28% of the HCC tumor samples but not the adjacent hepatocyte
population 50. In addition, they found that the high expression of HSP90 was correlated with the
presence of CTPS cytoophidia, which is consistent to our findings that heat shock proteins
(HSPA1L and HSPA8) and CTPS1 are all upregulated.
Fructose-bisphosphate aldolase B (ALDOB) is an enzyme for glucose and fructose
metabolism. In a cohort of 313 HCC patients, ALDOB was found downregulated in HCC tissue
using tissue microarray and immunohistochemistry (IHC) technologies, and its downregulation
was significantly correlated with HCC progression 51. Furthermore, ALDOB has been found to
be a binding protein of the S region of the HbsAg 52. Our data showed that ALDOB expression
suppressed in HBV+ HCC patients, suggesting a potentially interesting mechanistic linkage
between HCC and HBV infection, which might be utilized as therapeutic target.
Summary of regulated proteins in HCC samples
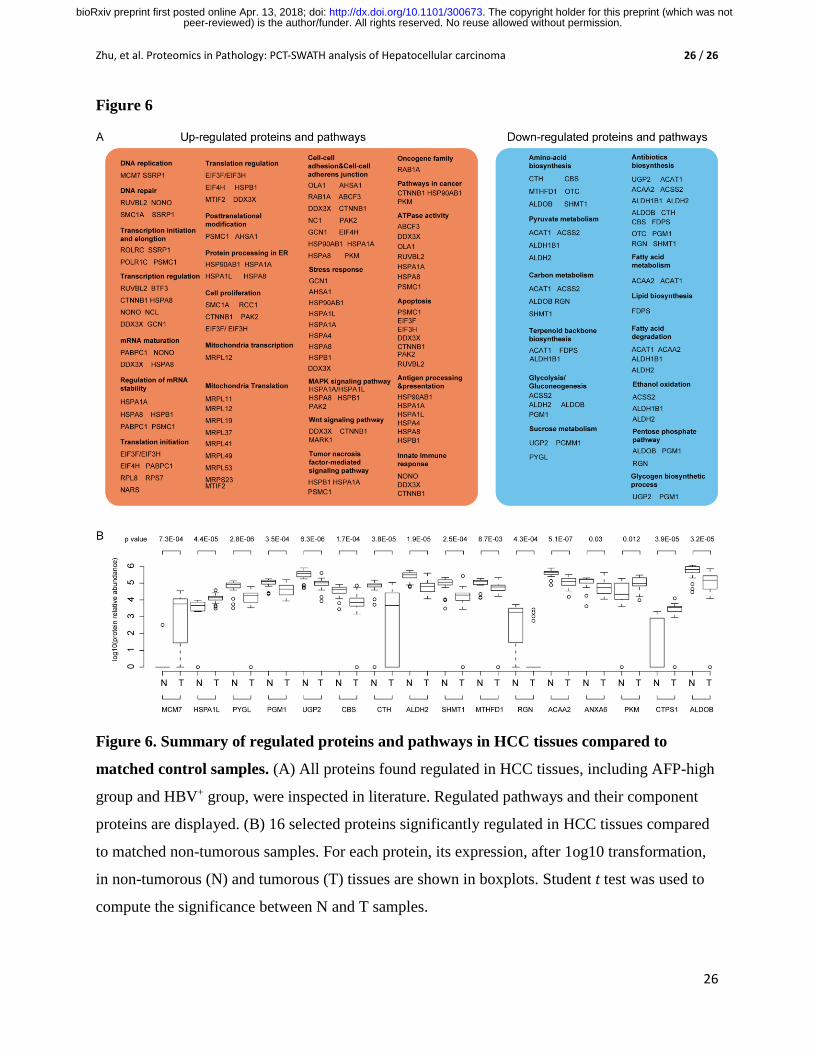
We summarize all differentially expressed proteins in HCC samples including the AFP-
high group and HBV+ group (Fig. 6A). Interestingly, the proteins with increased expression
concentrated in three types of pathways: a) production of DNA, mRNA and protein; b)
oncogenic signaling pathways and apoptosis; c) immune response. This suggests enhanced
proliferation of tumor cells in the malignant tissues. In contrast, proteins participated in various
peer-reviewed) is the author/funder. All rights reserved. No reuse allowed without permission. The copyright holder for this preprint (which was not. http://dx.doi.org/10.1101/300673doi: bioRxiv preprint first posted online Apr. 13, 2018;

Zhu, et al. Proteomics in Pathology: PCT-SWATH analysis of Hepatocellular carcinoma 15 / 26
15
metabolism pathways were down-regulated, indicating the suppression of metabolic functionality
in liver during oncogenesis. Compared to a previous report of HCC tissue proteome using
SWATH-MS 16, our data are acquired in a shorter time frame but identified similar protein
alternation. For instance, we also observed malignant tissue displayed increased abundance of
glucose-6-phophate dehydrogenase (G6PD) and perilipin 2 (PLIN2), as well as downregulation
of formimidoyltransferase cyclodeaminase (FTCD) and phosphoenolpyruvate carboxykinase 2
(PCK2, mitochondrial).
From literature review of all the regulated proteins in Fig. 6A, we identified 16 proteins
of clinical relevance to HCC (Fig. 6B). For instance, the overexpression of PKM2 was more
frequently found in cirrhotic liver resulted from HBV infection, and ALDOB, whose interaction
with HbsAg might be applied as a potential therapeutic target for HBV-related hepatitis or HCC.
We calculated the expression level of these 16 proteins between tumorous and the adjacent non-
tumorous (named as normal) tissue, as was shown in Fig. 6B, the log10 MS intensity, with the p
value for each pair of comparison between normal and tumor. Although this study is not the first
to identify the relevance of these proteins to liver cancer, our study further consolidates their
roles in HCC tissues, and more importantly, we demonstrate that this PCT-SWATH-based high-
throughput methodology allows measurement of clinically relevant proteins from biopsy-level
tissue samples.
Conclusion
In conclusion, here we report an optimized PCT-SWATH workflow enabling analysis of
clinical tissue specimens with unprecedented sample throughput without compromise of
quantitative accuracy and proteomic coverage. The entire process (from receiving 38 tissue
samples to completing the data acquisition of 76 SWATH files) took about 9 working days,
enabling timely measurement in a clinical scenario. Our study reveals a regulated protein
landscape in this HCC cohort. Remarkably, proteins with increased abundance are mainly related
to mass production, oncogenic signaling and immunity, where metabolic proteins show lower
expression. We identified 16 dysregulated proteins of high clinical relevance to HCC, as reported
by the literature and substantiated by our data. The study demonstrates that the PCT-SWATH
methodology has potential to be practically applied in clinical research to generate high quality
proteomic datasets and measure clinically relevant proteins from biopsy-level tissue samples.
peer-reviewed) is the author/funder. All rights reserved. No reuse allowed without permission. The copyright holder for this preprint (which was not. http://dx.doi.org/10.1101/300673doi: bioRxiv preprint first posted online Apr. 13, 2018;

Zhu, et al. Proteomics in Pathology: PCT-SWATH analysis of Hepatocellular carcinoma 16 / 26
16
Author contributions
T.G. conceived and coordinated the project. J.Z., C.L., W.X., P.S. performed the PCT-
based sample preparation. J.Z., Y.Z., Q.Z., T.Z., T.G. performed the data analysis. Y.Z., J.Z.,
R.A., S.H., T.G. wrote the manuscript with inputs from all co-authors. R.A., S.H. and T.G.
supervised the project.
Acknowledgements
This study was supported the National Natural Science Foundation, P.R China
(NNSF/81200348/2013), the Swiss National Science Foundation (SNF 166435 MitoModules to
R.A) ERC PROTEOMICS4D (project-no 670821), start-up package from Westlake Institute for
Advanced Study to T.G.. Y. Z. was supported by a fellowship from SignalX (SystemsX RTD
2013/156) and Eu PrECISE (project-no 668858).
Conflict of Interest
R.A. holds shares of Biognosys AG, which operates in the field covered by the article.
The research groups of R.A. and T.G. are supported by AB SCIEX, which provides access to
prototype instrumentation, and Pressure Biosciences, which provides access to advanced sample
preparation instrumentation.
peer-reviewed) is the author/funder. All rights reserved. No reuse allowed without permission. The copyright holder for this preprint (which was not. http://dx.doi.org/10.1101/300673doi: bioRxiv preprint first posted online Apr. 13, 2018;

Zhu, et al. Proteomics in Pathology: PCT-SWATH analysis of Hepatocellular carcinoma 17 / 26
17
References
1. El-Serag, H.B. & Rudolph, K.L. Hepatocellular carcinoma: epidemiology and molecular carcinogenesis. Gastroenterology 132, 2557-2576 (2007).
2. Yau, T., et al. Development of Hong Kong Liver Cancer staging system with treatment stratification for patients with hepatocellular carcinoma. Gastroenterology 146, 1691-1700 e1693 (2014).
3. Ferrin, G., Aguilar-Melero, P., Rodriguez-Peralvarez, M., Montero-Alvarez, J.L. & de la Mata, M. Biomarkers for hepatocellular carcinoma: diagnostic and therapeutic utility. Hepatic medicine : evidence and research 7, 1-10 (2015).
4. Schutte, K., Schulz, C., Link, A. & Malfertheiner, P. Current biomarkers for hepatocellular carcinoma: Surveillance, diagnosis and prediction of prognosis. World J Hepatol 7, 139-149 (2015).
5. Bruix, J., Sherman, M. & American Association for the Study of Liver, D. Management of hepatocellular carcinoma: an update. Hepatology 53, 1020-1022 (2011).
6. European Association For The Study Of The, L., European Organisation For, R. & Treatment Of, C. EASL-EORTC clinical practice guidelines: management of hepatocellular carcinoma. J Hepatol 56, 908-943 (2012).
7. Omata, M., et al. Asian Pacific Association for the Study of the Liver consensus recommendations on hepatocellular carcinoma. Hepatol Int 4, 439-474 (2010).
8. Saffroy, R., et al. New perspectives and strategy research biomarkers for hepatocellular carcinoma. Clin Chem Lab Med 45, 1169-1179 (2007).
9. Nie, W., et al. Advanced mass spectrometry-based multi-omics technologies for exploring the pathogenesis of hepatocellular carcinoma. Mass Spectrom Rev 35, 331-349 (2016).
10. Kimhofer, T., Fye, H., Taylor-Robinson, S., Thursz, M. & Holmes, E. Proteomic and metabonomic biomarkers for hepatocellular carcinoma: a comprehensive review. Br J Cancer 112, 1141-1156 (2015).
11. Abdalla, M.A. & Haj-Ahmad, Y. Promising Urinary Protein Biomarkers for the Early Detection of Hepatocellular Carcinoma among High-Risk Hepatitis C Virus Egyptian Patients. J Cancer 3, 390-403 (2012).
12. Zhang, J., et al. In-depth proteomic analysis of tissue interstitial fluid for hepatocellular carcinoma serum biomarker discovery. Br J Cancer 117, 1676-1684 (2017).
13. Li, C., et al. Quantitative proteomics reveal up-regulated protein expression of the SET complex associated with hepatocellular carcinoma. J Proteome Res 11, 871-885 (2012).
14. Megger, D.A., Naboulsi, W., Meyer, H.E. & Sitek, B. Proteome Analyses of Hepatocellular Carcinoma. J Clin Transl Hepatol 2, 23-30 (2014).
15. Naboulsi, W., et al. Quantitative Tissue Proteomics Analysis Reveals Versican as Potential Biomarker for Early-Stage Hepatocellular Carcinoma. J Proteome Res 15, 38-47 (2016).
16. Gao, Y., et al. Quantitative proteomics by SWATH-MS reveals sophisticated metabolic reprogramming in hepatocellular carcinoma tissues. Sci Rep 7, 45913 (2017).
17. Guo, T., et al. Rapid mass spectrometric conversion of tissue biopsy samples into permanent quantitative digital proteome maps. Nature medicine 21, 407-413 (2015).
18. Shao, S., et al. Reproducible Tissue Homogenization and Protein Extraction for Quantitative Proteomics Using MicroPestle-Assisted Pressure-Cycling Technology. J Proteome Res 15, 1821-1829 (2016).
19. Shao, S., et al. Minimal sample requirement for highly multiplexed protein quantification in cell lines and tissues by PCT-SWATH mass spectrometry. Proteomics 15, 3711-3721 (2015).
peer-reviewed) is the author/funder. All rights reserved. No reuse allowed without permission. The copyright holder for this preprint (which was not. http://dx.doi.org/10.1101/300673doi: bioRxiv preprint first posted online Apr. 13, 2018;

Zhu, et al. Proteomics in Pathology: PCT-SWATH analysis of Hepatocellular carcinoma 18 / 26
18
20. Gillet, L.C., et al. Targeted data extraction of the MS/MS spectra generated by data-independent acquisition: a new concept for consistent and accurate proteome analysis. Molecular & cellular proteomics : MCP 11, O111 016717 (2012).
21. Rosenberger, G., et al. A repository of assays to quantify 10,000 human proteins by SWATH-MS. Scientific data 1, 140031 (2014).
22. Rost, H.L., et al. OpenSWATH enables automated, targeted analysis of data-independent acquisition MS data. Nat Biotechnol 32, 219-223 (2014).
23. Peter Kunszt, et al. iPortal: the swiss grid proteomics portal: Requirements and new features based on experience and usability considerations. 10.1002/cpe.3294 (2014).
24. Bader, G.D. & Hogue, C.W. An automated method for finding molecular complexes in large protein interaction networks. BMC Bioinformatics 4, 2 (2003).
25. Vizcaino, J.A., et al. 2016 update of the PRIDE database and its related tools. Nucleic Acids Res 44, D447-456 (2016).
26. Zhu, Y. & Guo, T. High-Throughput Proteomic Analysis of Fresh-Frozen Biopsy Tissue Samples Using Pressure Cycling Technology Coupled with SWATH Mass Spectrometry. Methods Mol Biol (2017).
27. Zhao, Y.J., Ju, Q. & Li, G.C. Tumor markers for hepatocellular carcinoma. Mol Clin Oncol 1, 593-598 (2013).
28. Ciocca, D.R. & Calderwood, S.K. Heat shock proteins in cancer: diagnostic, prognostic, predictive, and treatment implications. Cell Stress Chaperones 10, 86-103 (2005).
29. Daugaard, M., Rohde, M. & Jaattela, M. The heat shock protein 70 family: Highly homologous proteins with overlapping and distinct functions. FEBS Lett 581, 3702-3710 (2007).
30. Fang, F., Chang, R. & Yang, L. Heat shock factor 1 promotes invasion and metastasis of hepatocellular carcinoma in vitro and in vivo. Cancer 118, 1782-1794 (2012).
31. Kim, H.J., Maiti, P. & Barrientos, A. Mitochondrial ribosomes in cancer. Semin Cancer Biol 47, 67-81 (2017).
32. Qu, K., et al. MCM7 promotes cancer progression through cyclin D1-dependent signaling and serves as a prognostic marker for patients with hepatocellular carcinoma. Cell Death Dis 8, e2603 (2017).
33. Mani, S., Cao, W., Wu, L. & Wang, R. Hydrogen sulfide and the liver. Nitric Oxide 41, 62-71 (2014). 34. Kim, J., et al. Expression of cystathionine beta-synthase is downregulated in hepatocellular
carcinoma and associated with poor prognosis. Oncol Rep 21, 1449-1454 (2009). 35. Chen, C.H., Ferreira, J.C., Gross, E.R. & Mochly-Rosen, D. Targeting aldehyde dehydrogenase 2:
new therapeutic opportunities. Physiol Rev 94, 1-34 (2014). 36. Lou, J., Zhang, L., Lv, S., Zhang, C. & Jiang, S. Biomarkers for Hepatocellular Carcinoma. Biomark
Cancer 9, 1-9 (2017). 37. Yokoo, H., et al. Proteomic signature corresponding to alpha fetoprotein expression in liver
cancer cells. Hepatology 40, 609-617 (2004). 38. Lee, L., et al. Liverome: a curated database of liver cancer-related gene signatures with self-
contained context information. BMC Genomics 12 Suppl 3, S3 (2011). 39. Yamaguchi, M. Involvement of regucalcin as a suppressor protein in human carcinogenesis:
insight into the gene therapy. Journal of cancer research and clinical oncology 141, 1333-1341 (2015).
40. Yamaguchi, M., et al. Prolonged survival in hepatocarcinoma patients with increased regucalcin gene expression: HepG2 cell proliferation is suppressed by overexpression of regucalcin in vitro. Int J Oncol 49, 1686-1694 (2016).
41. Meier, E.M., et al. Annexin A6 protein is downregulated in human hepatocellular carcinoma. Mol Cell Biochem 418, 81-90 (2016).
peer-reviewed) is the author/funder. All rights reserved. No reuse allowed without permission. The copyright holder for this preprint (which was not. http://dx.doi.org/10.1101/300673doi: bioRxiv preprint first posted online Apr. 13, 2018;

Zhu, et al. Proteomics in Pathology: PCT-SWATH analysis of Hepatocellular carcinoma 19 / 26
19
42. Zhang, Y., Zhang, H., Elizabeth, A. & Liu, X.Q. Epidemiology of hepatitis B and associated liver diseases in china. Chin Med Sci J 27, 243-248 (2013).
43. Dong, G., et al. PKM2 and cancer: The function of PKM2 beyond glycolysis. Oncol Lett 11, 1980-1986 (2016).
44. Iqbal, M.A., Gupta, V., Gopinath, P., Mazurek, S. & Bamezai, R.N. Pyruvate kinase M2 and cancer: an updated assessment. FEBS Lett 588, 2685-2692 (2014).
45. Iansante, V., et al. PARP14 promotes the Warburg effect in hepatocellular carcinoma by inhibiting JNK1-dependent PKM2 phosphorylation and activation. Nat Commun 6, 7882 (2015).
46. Liu, Y., et al. Clinicopathological and prognostic significance of PKM2 protein expression in cirrhotic hepatocellular carcinoma and non-cirrhotic hepatocellular carcinoma. Sci Rep 7, 15294 (2017).
47. Kizaki, H., Williams, J.C., Morris, H.P. & Weber, G. Increased cytidine 5'-triphosphate synthetase activity in rat and human tumors. Cancer research 40, 3921-3927 (1980).
48. Williams, J.C., Kizaki, H., Weber, G. & Morris, H.P. Increased CTP synthetase activity in cancer cells. Nature 271, 71-73 (1978).
49. Liu, J.L. The Cytoophidium and Its Kind: Filamentation and Compartmentation of Metabolic Enzymes. Annu Rev Cell Dev Biol 32, 349-372 (2016).
50. Chang, C.C., et al. CTP synthase forms the cytoophidium in human hepatocellular carcinoma. Exp Cell Res 361, 292-299 (2017).
51. Tao, Q.F., et al. Aldolase B inhibits metastasis through Ten-Eleven Translocation 1 and serves as a prognostic biomarker in hepatocellular carcinoma. Mol Cancer 14, 170 (2015).
52. Wu, J., et al. ALDOB acts as a novel HBsAg-binding protein and its coexistence inhibits cisplatin-induced HepG2 cell apoptosis. Crit Rev Eukaryot Gene Expr 24, 181-191 (2014).
peer-reviewed) is the author/funder. All rights reserved. No reuse allowed without permission. The copyright holder for this preprint (which was not. http://dx.doi.org/10.1101/300673doi: bioRxiv preprint first posted online Apr. 13, 2018;

Zhu, et al. Proteomics in Pathology: PCT-SWATH analysis of Hepatocellular carcinoma 20 / 26
20
Table 1. Clinicopathological data of the 19 HCC patients.Pati
ent
ID
Gende
r
Age
(year
)
AFP
(ng/ml)
Albumi
n (g/l)
Heptitis
Virus
Infectio
n
HBV DNA
copy or
HCV RNA
Load
Number
of
Tumors
Tumor
size (the
largest,
cm)
Portal
vein
thrombosi
s (CT)
Microscope
thrombus
(after
surgery)
Metastasis Pathologic type
Surgery time
(MM/DD/YY
)
Prognosis
(1st
time)
Prognosis
(Dec-
2017)
Date of
Death
1 F 50 1728.00 31.7 HCV-LC <1000 2 >5 NA NA Hepatic
membrane Moderately-poorly differentiated hepatocellular carcinoma 17-Sep-2015 Jan-2016
Tumor
recurrence
after
resection
2 M 59 13.20 28.1 HBV-LC <100 3 5.9*5 NA NA incisal edge Moderately-poorly differentiated hepatocellular carcinoma 21-Sep-2015 30-June-
2017
Recurrenc
e free
survival
3 M 53 1.00 32.5 HBV-LC 1.61*10^5 1 10*10 YES YES
Hepatic
membrane
,incisal
edge
Moderately-poorly differentiated hepatocellular carcinoma 21-Sep-2015 NA dead date
unknown
4 M 45 50347.40 36.7 HBV-LC 4.93*10^2 1 8*6 YES YES
Hepatic membrane
,incisal
edge
Poorly differentiated hepatocellular carcinoma 21-Sep-2015 NA dead Jul-16
5 M 67 81.70 33.6 HBV 6.11*10^5 1 5.4*4.2 NA NA lymph node Moderately-poorly differentiated hepatocellular carcinoma 23-Sep-2015 24-Dec-
2015 dead 19-Aug-16
6 M 62 20.90 32 HBV <100 2 16.6*13.
9 YES YES
Hepatic
membrane Moderately-poorly differentiated hepatocellular carcinoma 14-Oct-2015
23-Nov-
2015 dead 22-Aug-17
7 M 47 89.20 36.2 / / 1 8*6 NA NA Hepatic
membrane Moderately-highly differentiated hepatocellular carcinoma 19-Oct-2015 NA
Recurrenc
e free
survival
8 F 48 7185.30 38.1 HBV 1.76*10^5 1 3*3 NA NA Hepatic
membrane Moderately differentiated hepatocellular carcinoma 22-Oct-2015
16-March-
2016
Recurrenc
e free
survival
9 M 69 1.40 32.5 / / 1 3.5*3.3 NA NA NA Moderately differentiated hepatocellular carcinoma 26-Oct-2015 NA
Recurrenc
e free
survival
10 M 80 2.30 30 HBV 2.01*10^5 1 6*4 YES YES incisal edge Moderately-poorly differentiated hepatocellular carcinoma 5-Nov-2015 12-Dec-
2016
Recurrenc
e free
survival
11 M 63 4.70 40.7 / / 1 5 NA NA NA Moderately differentiated hepatocellular carcinoma 5-Nov-2015 16-May-
2017
Recurrenc
e free
survival
12 M 54 38.21 49.1 HBV 10.885*10^
3 1 4 NA NA NA Moderately differentiated hepatocellular carcinoma 11-Nov-2015 NA
Recurrenc
e free
survival
13 M 63 No data No data HCV,
cured / 1 12 YES YES not rule out differentiated hepatocellular carcinoma 9-Nov-2015
15-June-
2017
Tumor
recurrence
after
resection
14 M 67 4018.30 31.3 HBV / 3 6*7 NA NA Hepatic
membrane Mulifocality moderately differentiated hepatocellular carcinoma 16-Nov-2015 NA dead
9-Dec-
2016
15 M 49 74913.40 34.8 / / 2 3*5 YES YES Hepatic
membrane Poorly differentiated hepatocellular carcinoma 23-Nov-2015 NA dead
date
unknown
16 M 53 17305.70 44.9 HBV 5.24*10^4 1 11*11 NA NA NA Highly-moderately differentiated hepatocellular carcinoma 26-Nov-2015 2-Feb-2016
Tumor
recurrence
after
resection
17 M 43 No data No data HBV-LC <100 1 3*3 NA NA NA Moderately differentiated hepatocellular carcinoma 1-Dec-2015 9-Nov-
2016
Recurrenc
e free
survival
18 M 50 >80000 44 / / 1 10 NA YES gallbladder Poorly differentiated hepatocellular carcinoma 2-Dec-2015 4-March-
2016 dead
date
unknown
19 M 57 4.46 43.8 / / 1 3*4 NA NA NA Poorly differentiated hepatocellular carcinoma 2-Dec-2015 NA
Recurrenc
e free
survival
peer-reviewed) is the author/funder. All rights reserved. No reuse allowed without permission. The copyright holder for this preprint (which was not. http://dx.doi.org/10.1101/300673doi: bioRxiv preprint first posted online Apr. 13, 2018;

Zhu, et al. Proteomics in Pathology: PCT-SWATH analysis of Hepatocellular carcinoma 21 / 26
21
Figure 1
Figure 1. Performance of PCT-assisted peptide preparation. (A) Yield of peptide in two
types of liver tissue samples. Y-axis shows the peptide yield in percentage of peptide (µg) per
milligram (mg) tissue. (B) Coefficient of variation (CV) of peptide yield in two types of tissues
and all samples.
peer-reviewed) is the author/funder. All rights reserved. No reuse allowed without permission. The copyright holder for this preprint (which was not. http://dx.doi.org/10.1101/300673doi: bioRxiv preprint first posted online Apr. 13, 2018;
Zhu, et al. Proteomics in Pathology: PCT-SWATH analysis of Hepatocellular carcinoma 22 / 26
22
Figure 2
Figure 2. Peptide and protein identification and quantification. (A) Number of peptides
identified in each sample (76 SWATH runs from 38 of samples from 19 pairs of HCC patient
tissue). (B) Number of proteins identified in each sample. (C) Global Pearson correlation of
technical replicates of peptide quantification for samples in all samples. Values are log2
transformed protein intensity. Missing values were excluded from this analysis. (D) Heatmap
overview of protein abundance patterns in 76 samples. Protein intensity values were log10
transformed and subjected to unsupervised-clustering in two axes. (P, patient ID; N, non-
tumorous; T, tumorous; a, the first technical replicate; b, the second technical replicate; for
example, P1Na, the technical replicate run No. 1 of non-tumorous tissue from patient No. 1).
peer-reviewed) is the author/funder. All rights reserved. No reuse allowed without permission. The copyright holder for this preprint (which was not. http://dx.doi.org/10.1101/300673doi: bioRxiv preprint first posted online Apr. 13, 2018;

Zhu, et al. Proteomics in Pathology: PCT-SWATH analysis of Hepatocellular carcinoma 23 / 26
23
Figure 3
Figure 3. Variability of protein expression in liver tissues. (A) Distribution of protein
abundance variability, quantified as percentage of CV values, in tissue samples. B, C and D
show correlation of CV of protein abundance variability and protein abundance of all samples,
non-tumorous samples and tumorous samples, respectively.
peer-reviewed) is the author/funder. All rights reserved. No reuse allowed without permission. The copyright holder for this preprint (which was not. http://dx.doi.org/10.1101/300673doi: bioRxiv preprint first posted online Apr. 13, 2018;

Zhu, et al. Proteomics in Pathology: PCT-SWATH analysis of Hepatocellular carcinoma 24 / 26
24
Figure 4
Figure 4. Significantly regulated proteins in all tumorous tissues versus non-tumorous
tissues. (A) Volcano plot of proteins expressed in tumorous tissue samples and their matched
non-tumorous samples. Each data point represents the ratio of tumorous to adjacent non-
tumorous tissue observed for a protein. The horizontal line at −log10 (p-value) = 1.3 indicates p=
0.05. Data points above the line (p < 0.05) are considered to be significantly regulated. The two
vertical lines at log2 ratio (tumorous to non-tumorous) = ±1 where the fold change is equivalent
to 2 indicate the threshold for up-/down- regulation. The upper left quadrant (p < 0.05 and fold
change <0.5) represent the downregulated proteins whereas the upper right quadrant indicates the
upregulated proteins in tumorous tissue. N, non-tumorous; T, tumorous. (B) and (C) enriched
significantly upregulated protein networks. (D) enriched significantly downregulated protein
network.
peer-reviewed) is the author/funder. All rights reserved. No reuse allowed without permission. The copyright holder for this preprint (which was not. http://dx.doi.org/10.1101/300673doi: bioRxiv preprint first posted online Apr. 13, 2018;

Zhu, et al. Proteomics in Pathology: PCT-SWATH analysis of Hepatocellular carcinoma 25 / 26
25
Figure 5
Figure 5. Significantly regulated proteins in tumorous tissues versus non-tumorous tissues
grouped by the blood AFP level and HBV infection status. Volcano plots of proteins
expressed in tumorous tissue samples and their matched non-tumorous samples in AFP-high
patient group (A) and HBV infection status (C). (B) and (D) show the enriched significantly
downregulated protein network in the AFP-high patient group and the HBV+ group, respectively.
peer-reviewed) is the author/funder. All rights reserved. No reuse allowed without permission. The copyright holder for this preprint (which was not. http://dx.doi.org/10.1101/300673doi: bioRxiv preprint first posted online Apr. 13, 2018;
Zhu, et al. Proteomics in Pathology: PCT-SWATH analysis of Hepatocellular carcinoma 26 / 26
26
Figure 6
Figure 6. Summary of regulated proteins and pathways in HCC tissues compared to
matched control samples. (A) All proteins found regulated in HCC tissues, including AFP-high
group and HBV+ group, were inspected in literature. Regulated pathways and their component
proteins are displayed. (B) 16 selected proteins significantly regulated in HCC tissues compared
to matched non-tumorous samples. For each protein, its expression, after 1og10 transformation,
in non-tumorous (N) and tumorous (T) tissues are shown in boxplots. Student t test was used to
compute the significance between N and T samples.
peer-reviewed) is the author/funder. All rights reserved. No reuse allowed without permission. The copyright holder for this preprint (which was not. http://dx.doi.org/10.1101/300673doi: bioRxiv preprint first posted online Apr. 13, 2018;