zensar technologiesaceanalyser.com/analyst meet/104067_20120725.pdfzensar at a glance ranked amongst...
TRANSCRIPT
Zensar Technologies
Q1 -FY 13 Financial Results &
Business Update
Zensar at a glance
Ranked amongst India’s top 20 software companies by
NASSCOM
Ranked among top 12 in the latest ‘Global Outsourcing 100’ by
International Association of Outsourcing Professionals (IAOP)
Two exclusive Harvard Case Studies on Zensar Technologies -
Zensar: The Future of Vision Communities and Ganesh
Natarajan : Leading Innovation and Organizational Change at
Zensar
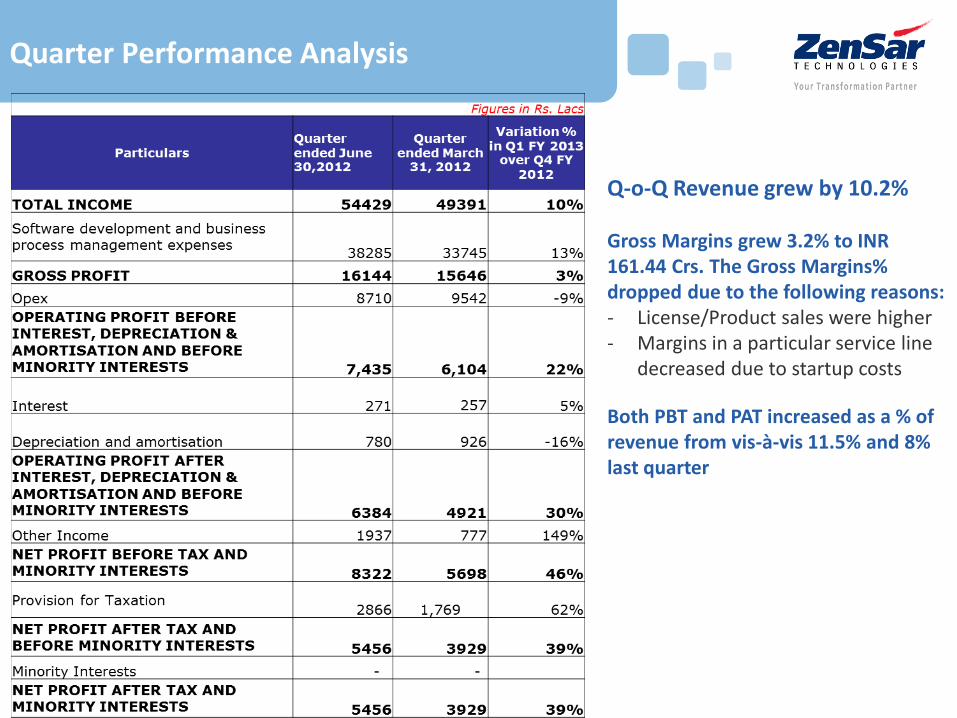
Quarter Performance Analysis
Q-o-Q Revenue grew by 10.2% Gross Margins grew 3.2% to INR 161.44 Crs. The Gross Margins% dropped due to the following reasons: - License/Product sales were higher - Margins in a particular service line
decreased due to startup costs
Both PBT and PAT increased as a % of revenue from vis-à-vis 11.5% and 8% last quarter
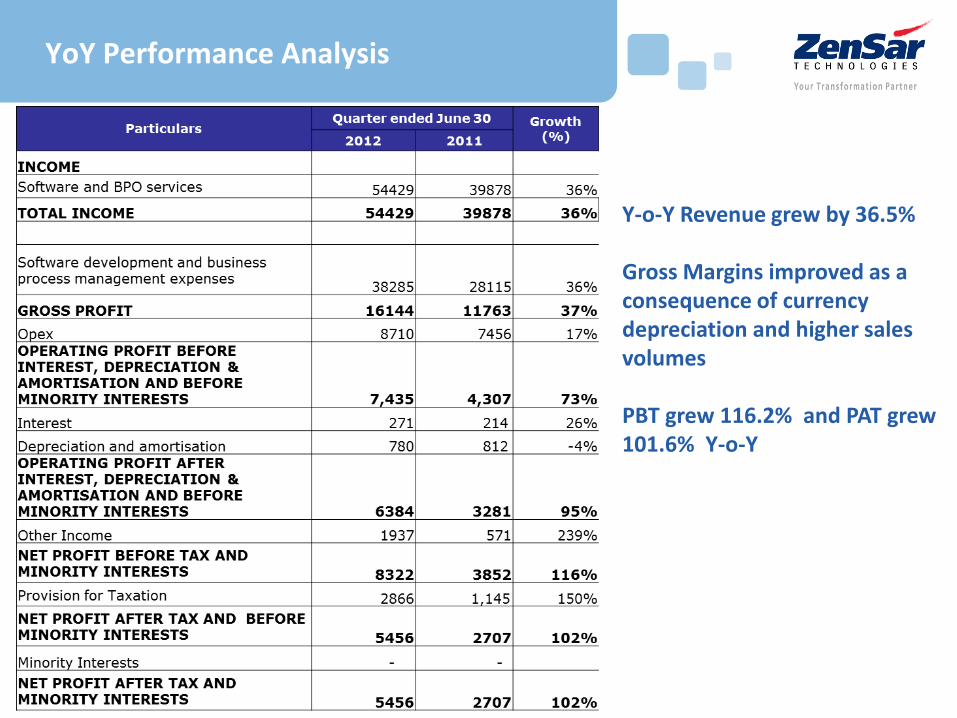
YoY Performance Analysis
Y-o-Y Revenue grew by 36.5% Gross Margins improved as a consequence of currency depreciation and higher sales volumes PBT grew 116.2% and PAT grew 101.6% Y-o-Y
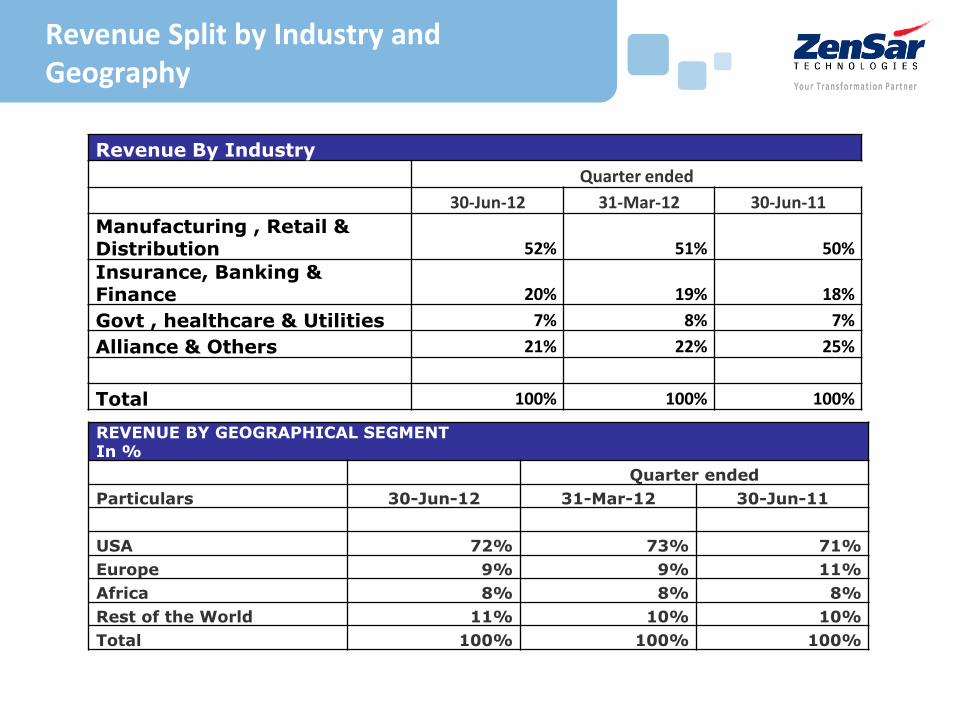
Revenue Split by Industry and Geography
REVENUE BY GEOGRAPHICAL SEGMENT In %
Quarter ended
Particulars 30-Jun-12 31-Mar-12 30-Jun-11
USA 72% 73% 71%
Europe 9% 9% 11%
Africa 8% 8% 8%
Rest of the World 11% 10% 10%
Total 100% 100% 100%
Revenue By Industry
Quarter ended
30-Jun-12 31-Mar-12 30-Jun-11
Manufacturing , Retail & Distribution 52% 51% 50%
Insurance, Banking & Finance 20% 19% 18%
Govt , healthcare & Utilities 7% 8% 7%
Alliance & Others 21% 22% 25%
Total 100% 100% 100%
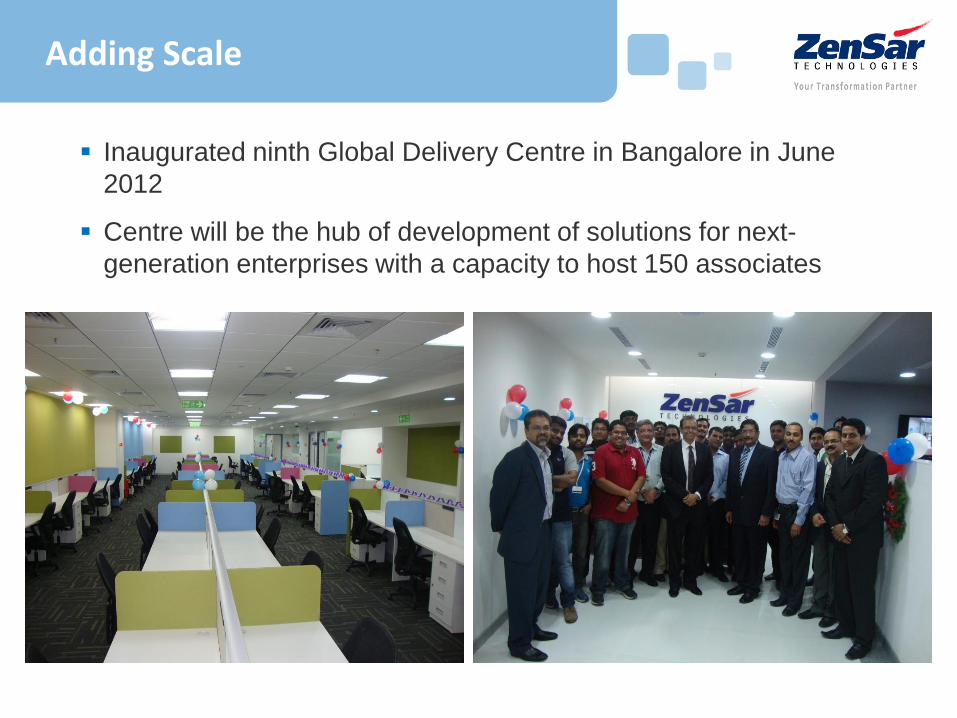
Adding Scale
Inaugurated ninth Global Delivery Centre in Bangalore in June
2012
Centre will be the hub of development of solutions for next-
generation enterprises with a capacity to host 150 associates

Our People Story
Employee Engagement Score at an all time high at 76%
Work from Home initiative launched in Q1
New strategies to develop, grow and retain talent : I Zen, Zen Points,
Excellence Initiatives
Retention rate stood at 87.39% (annualized)
Total associate count as of June 30th was 7293 including 315 associates
from Akibia
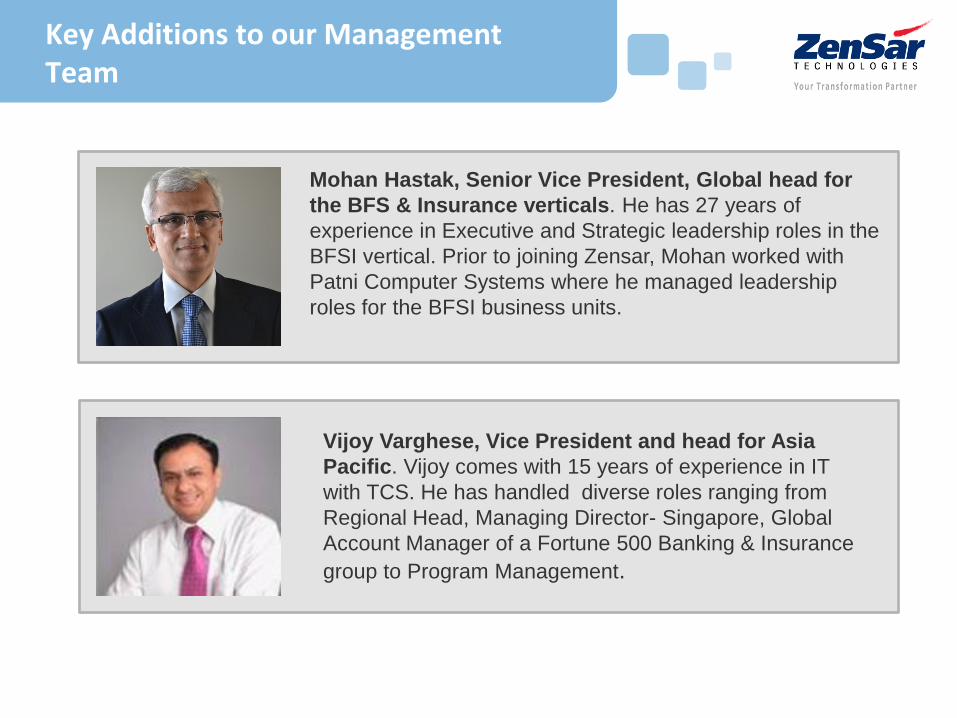
Key Additions to our Management Team
Vijoy Varghese, Vice President and head for Asia
Pacific. Vijoy comes with 15 years of experience in IT
with TCS. He has handled diverse roles ranging from
Regional Head, Managing Director- Singapore, Global
Account Manager of a Fortune 500 Banking & Insurance
group to Program Management.
Mohan Hastak, Senior Vice President, Global head for
the BFS & Insurance verticals. He has 27 years of
experience in Executive and Strategic leadership roles in the
BFSI vertical. Prior to joining Zensar, Mohan worked with
Patni Computer Systems where he managed leadership
roles for the BFSI business units.

Key Additions to our Management Team
Harish Gala, Senior Vice President and Global Head of
Enterprise Applications. He has handled several
leadership roles in the past 18 years which includes heading
the Oracle Service Line and ERP (SAP and Oracle) Integrity
(Security and Controls) practice for Deloitte US firm for their
offshore center in India since 2005.
Sandeep Suryavanshi, Chief Information Officer. He
comes with over 20 years of multi-sector experience in
organisations like PTC and D Link. He has worked
extensively in executing IT Strategy for business growth
in various organizations and implementing virtualization
strategy for worldwide R&D.
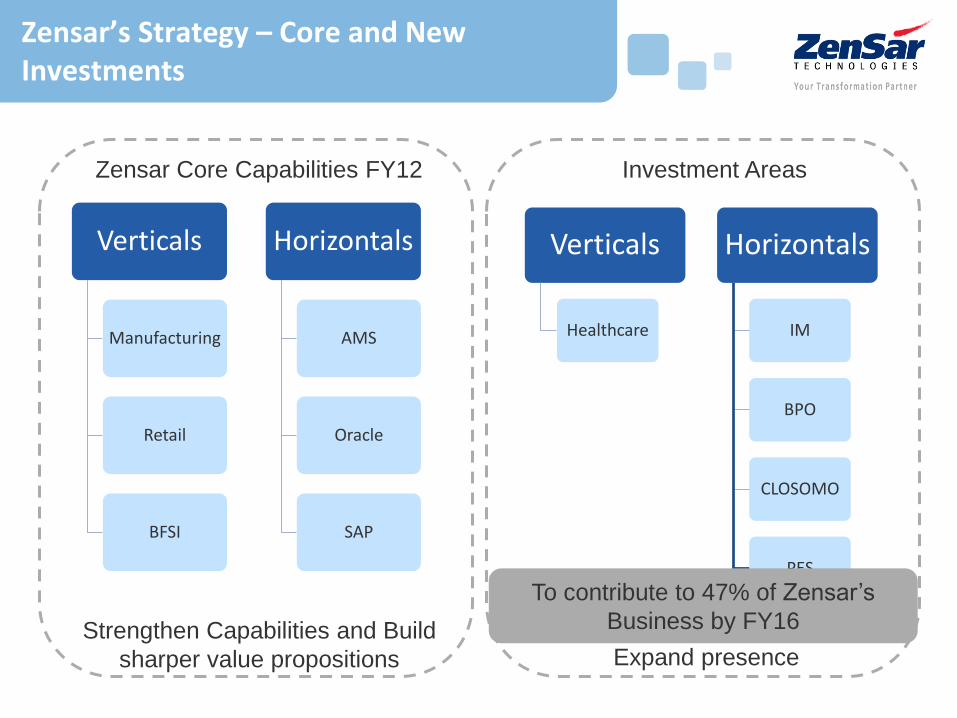
Zensar’s Strategy – Core and New Investments
Verticals
Manufacturing
Retail
BFSI
Horizontals
AMS
Oracle
SAP
Verticals
Healthcare
Horizontals
IM
BPO
CLOSOMO
PES
Strengthen Capabilities and Build
sharper value propositions
Build Capabilities and
Expand presence
To contribute to 47% of Zensar’s
Business by FY16
Zensar Core Capabilities FY12 Investment Areas
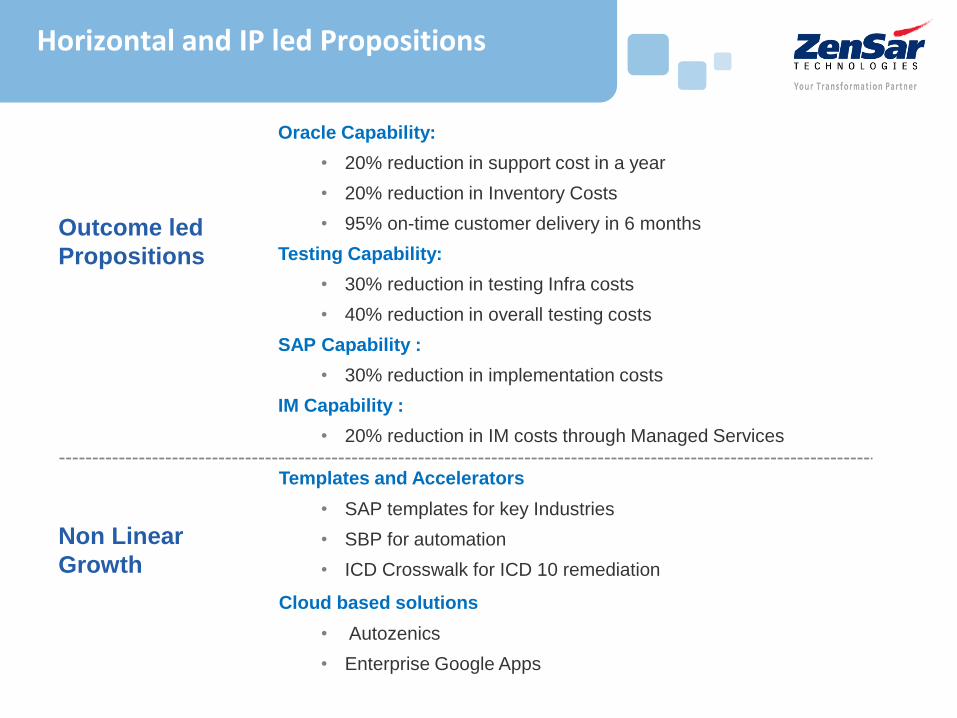
Horizontal and IP led Propositions
Outcome led
Propositions
Non Linear
Growth
Oracle Capability:
• 20% reduction in support cost in a year
• 20% reduction in Inventory Costs
• 95% on-time customer delivery in 6 months
Testing Capability:
• 30% reduction in testing Infra costs
• 40% reduction in overall testing costs
SAP Capability :
• 30% reduction in implementation costs
IM Capability :
• 20% reduction in IM costs through Managed Services
Templates and Accelerators
• SAP templates for key Industries
• SBP for automation
• ICD Crosswalk for ICD 10 remediation
Cloud based solutions
• Autozenics
• Enterprise Google Apps
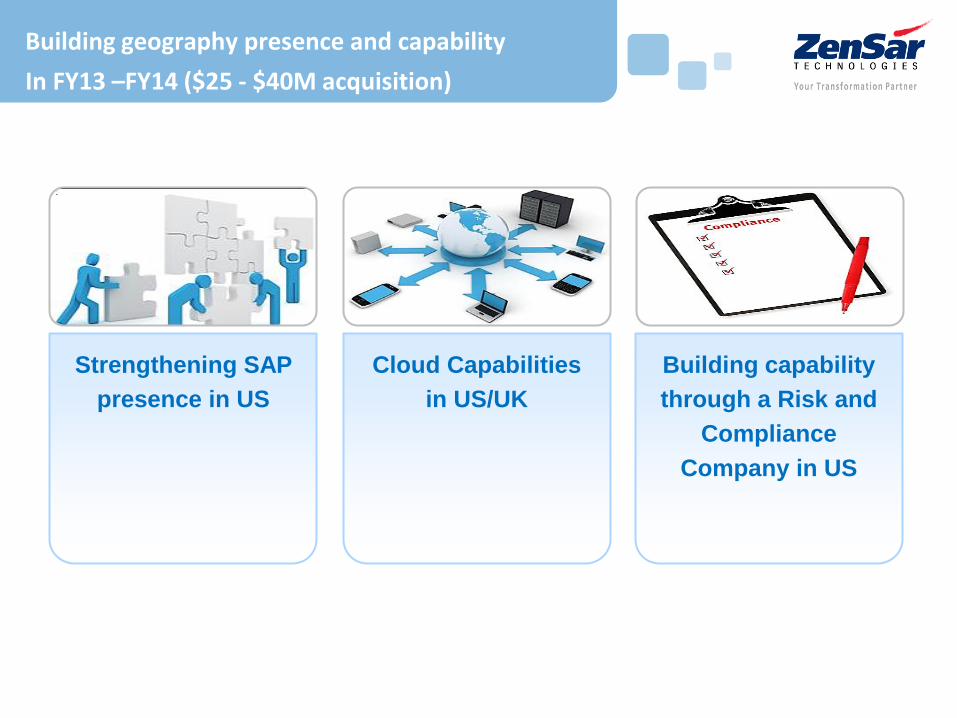
Building geography presence and capability
In FY13 –FY14 ($25 - $40M acquisition)
Strengthening SAP
presence in US
Cloud Capabilities
in US/UK
Building capability
through a Risk and
Compliance
Company in US
THANK YOU