zebrafish-bioassay guided microfractionation identifies ... · 1 zebrafish-bioassay guided...
TRANSCRIPT

1
Zebrafish-bioassay guided microfractionation identifies anticonvulsant
steroid glycosides from the Philippine medicinal plant Solanum torvum
Soura Challal1*, Olivia E. M. Buenafe2*, Emerson F. Queiroz1, Snezana Maljevic3, Laurence Marcourt1,
Werner Kloeti1, Fabian M. Dayrit3, Alan L. Harvey5, Holger Lerche3, Camila V. Esguerra1, Peter A. M.
de Witte2**, Jean-Luc Wolfender1**, Alexander D. Crawford2**
Affiliation
1 School of Pharmaceutical Sciences, University of Geneva, University of Lausanne, 30, quai Ernest-
Ansermet, CH-1211 Geneva 4, Switzerland.
2 Laboratory for Molecular Biodiscovery, Department of Pharmaceutical and Pharmacological Sciences,
KU Leuven - University of Leuven, Herestraat 49, 3000 Leuven, Belgium.
3 Department of Neurology and Epileptology, Hertie Institute for Clinical Brain Research, University of
Tübingen, Hoppe-Seyler-Strasse 3, 72076 Tübingen, Germany
4 Department of Chemistry, Ateneo de Manila University, Loyola Heights, 1108 Quezon City, Philippines
5 Strathclyde Institute of Pharmacy and Biomedical Sciences, University of Strathclyde, 161 Cathedral
Street, Glasgow G4 0RE, Scotland, UK
*equally contributing first authors
**equally contributing last authors
Correspondence
Prof. Jean Luc Wolfender. School of Pharmaceutical Sciences, University of Geneva, 30, quai Ernest-
Ansermet, CH-1211 Geneva 4, Switzerland.Tel: +41 22 379 33 85, Fax: +41 22 379 33 99. Email: jean-
2
Abstract
Medicinal plants used for the treatment of epilepsy are potentially a valuable source of novel
anti-epileptic small molecules. To identify anticonvulsant secondary metabolites, we performed
an in vivo, zebrafish-based screen of medicinal plants used in Southeast Asia for the treatment of
seizures. Solanum torvum Sw. (Solanaceae) was identified as having significant anticonvulsant
activity in zebrafish larvae with seizures induced by the GABAA antagonist pentylenetetrazol
(PTZ). This finding correlates well with the ethnomedical use of this plant in the Philippines,
where a water decoction of S. torvum leaves is used to treat epileptic seizures. HPLC
microfractionation in 96-well plates of the bioactive crude extract, in combination with the in
vivo zebrafish seizure assay, enabled the rapid localization of several bioactive compounds that
were partially identified on-line by UHPLC-TOF-MS as steroid glycosides. Targeted isolation of
the active constituents from the methanolic extract enabled the complete de novo structure
identification of the six main bioactive compounds that were also present in the traditional
preparation. In order to partially mimic the in vivo metabolism of these triterpene glycosides,
their common aglycone was generated by acid hydrolysis. The isolated molecules exhibited
significant anticonvulsant activity in zebrafish seizure assays. These results underscore the
potential of zebrafish bioassay-guided microfractionation to rapidly identify novel bioactive
small molecules of natural origin.
Key words
Zebrafish, HPLC microfractionation, Solanum torvum, Solanaceae, saponins, anti-epileptic
activity.

3
1. Introduction
Epilepsy is a common neurological disorder characterized by the manifestation of spontaneous
seizures as a result of abnormal neuronal activity in the brain. Currently known factors linked to
the emergence of epilepsy are stroke, brain injury, brain tumors, infections such meningitis, but
in 70% of cases the cause is not known (WHO, 2012). Epilepsy affects around 65 million people
worldwide, especially children, and has a higher prevalence in tropical countries, particularly in
Africa (Moshi et al., 2005; Thurman et al., 2011).
Currently, there are a large number of antiepileptic drugs (AEDs), each of them being
preferentially used depending on the type of seizure. Importantly, however, almost 30% of
patients suffering from epilepsy remain resistant to these existing treatments (Perucca, 1998).
Many currently available AEDs also exhibit serious neurological side effects such as depression,
cognitive impairment, and sedation, in addition to other drug-induced toxicities such as
gastrointestinal distress and hepatotoxicity (Arif et al., 2009; Arroyo and de la Morena, 2001;
Carpay et al., 2005; Schmidt, 2009). For these different reasons there is a clear need to identify
new AEDs with efficacy against pharmacoresistant epilepsy and ideally with minimal or no
adverse effects.
The identification of new AEDs is a significant challenge due to the heterogeneity and
complexity of epileptic seizures. The evaluation of antiepileptic drug leads requires numerious in
vitro and in vivo models which mimic the different mechanisms of action involved in epilepsy
(Schmidt and Rogawski, 2002). In several in vivo assays, epilepsy is induced after administration
of chemical proconvulsants such as the GABAA antagonist pentylenetetrazole (PTZ) in rodents
(Galanopoulou et al., 2013), and in zebrafish (Danio rerio) (Baraban et al., 2005; Afrikanova et
al., 2013).

4
In recent years, zebrafish have emerged as a novel experimental model for epilepsy (Baraban et
al., 2005). Pentylenetetrazole (PTZ), a proconvulsant widely used to induce absence seizures and
generalized tonic-clonic seizures in rodents, induces a dose-dependent series of stereotypical
behaviors in 7 day-old zebrafish larvae, including clonus-type convulsions resembling epileptic
seizures in mammals (Baraban et al., 2007). Epileptiform discharges were observed from
electrophysiological recordings from the brains of PTZ-treated zebrafish larvae, with these
discharges reduced by exposure to known anticonvulsant drugs such as valproate and diazepam.
In order to facilitate the discovery of novel anti-epileptic drugs, an automated tracking system
was developed to monitor the movement of zebrafish larvae in 96-well plates (Berghmans et al.,
2007; Orellana-Paucar et al., 2012; Afrikanova et al., 2013; Buenafe et al, 2013). Using this
system, we found that similar anti-epileptic drugs were found to suppress PTZ-induced seizure-
like behaviors and electrographic activity in both zebrafish and mice, thereby validating the
suitability of zebrafish for the high-throughput screening of potential anti-convulsant compounds
(Afrikanova et al., 2013).
The general paradigm of using zebrafish as a primary model organism for high-throughput
screening in the context of natural-products drug discovery has been gaining ground in the past
decade (Crawford et al, 2008, 2011). The advantages of zebrafish as a biological vertebrate
model (e.g., fecundity, rapid ex utero development, ease of husbandry, genetic similarities to
rodents and humans), when coupled with robust chromatographic and spectroscopic methods,
have contributed to discoveries and further development of hit compounds from various plant
extracts (Bohni et al., 2013; Buenafe et al., 2013; Orellana-Paucar et al., 2012).
The sharpening focus on exploring plant extracts as sources for novel anticonvulsant drug
candidates is not without compelling pretext, such as the historical use of medicinal plants to
treat epilepsy (Sucher, 2006; Schachter, 2009), supported by anticonvulsant natural-product

5
molecules isolated from such plants to date (Orellana-Paucar et al, 2012 ; Buenafe et al, 2013).
The impetus for such efforts can be attributed to the need to address drug-resistant epilepsy and
to develop improved AEDs or even botanical therapeutics with reduced neurological and
toxicological side effects (Schachter, 2009), especially since the potential of medicinal plants as
source of chemical diversity for modern AED discovery cannot be disputed.

6
2. Results and discussion
2.1 Zebrafish-based screen of Southeast Asian medicinal plant extracts
Pre-screening was performed on nine Southeast Asian plants from the University of
Strathclyde’s natural product library (data not shown), which were selected on the basis of
recorded ethnopharmacological use in Philippine pharmacopeia (Quisumbing, 1951). Solanum
torvum was chosen for more rigorous assessment. Solanum torvum L. (Solanaceae) is a plant
used in traditional medicine in South China and Southeast Asia as a sedative, digestive,
hemostatic and diuretic (Zhu et al., 2003). In the Philippines this plant is traditionally used as an
antiepileptic and antispasmodic (Quisumbing, 1951). The major constituents of this plant are
steroidal saponins, which exhibit various bioactivities including anti-viral, cytotoxic, anti-
microbial, and anti-inflammatory (Colmenares et al., 2013; Lee et al., 2013; Lu et al., 2009; Shu
et al., 2013). Anticonvulsant activity has previously been reported for solasodine, a steroidal
alkaloid isolated from another Solanum species (S. Sisymbriifolium*) (Chauhan et al., 2011).
Based on these findings, S. torvum was chosen for further bioactivity analysis, metabolite
profiling, and bioassay-guided microfractionation to identify its anticonvulsant constituents.
2.2 Bioactivity analysis of Solanum torvum
The aerial parts of S. torvum were successively extracted with solvents of increasing polarity
(hexane, dichloromethane, methanol and water) and concentrated under vacuum. The plant was
also extracted by water infusion according to the traditional preparation. Zebrafish larvae (at 6.5-
dpf) were exposed to different concentrations of S. torvum crude extracts for 18 h before
subsequent addition of PTZ, which induced seizure-like movement, such as swimming with
increasing agitation leading to “whirlpool” behavior, loss of posture and clonus-type movement.
The methanolic and water extracts that were likely to be close in composition to the traditional
usage of the plant exhibited significant reduction (35-40%) of PTZ-induced movement in 6/7-dpf

7
larvae at 50 g/ml (p < 0.05), with their maximum tolerated concentrations (MTC) well beyond
the highest tested concentration (200 µg/ml) (Figure 1A-D).
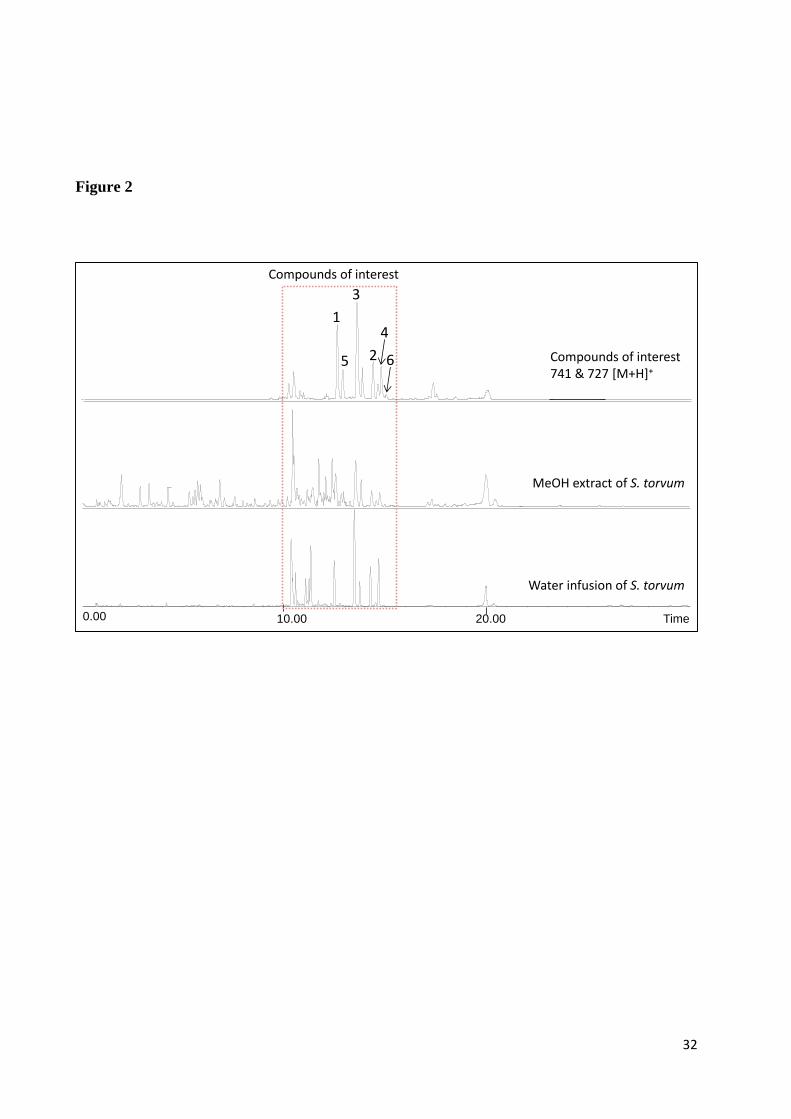
2.3 Metabolite profiling
The extracts were submitted to metabolite profiling by UHPLC-TOF-MS (Eugster et al., 2011)
and their composition was compared (Figure 2). The methanol extract was selected for further
chemical study, as it exhibited reduction in PTZ-induced activity in zebrafish larvae at a
comparable level to the aqueous extract, and presents a wider array of metabolites. Based on the
high resolution (HR)TOF-MS data obtained by metabolite profiling, the molecular formula of
the compounds detected in the water infusion could be retrieved. These dereplication data
revealed the presence of characteristic steroid glycosides isomers with a high molecular weight
as the main LC peaks in the methanolic extract which were previously isolated from this plant
(Colmenares et al., 2013; Lee et al., 2013; Lu et al., 2009; Shu et al., 2013). Because of the
presence of many isomers known to have various absolute configurations or glycoside
substitution patterns, a full structure assignment could not be performed based on such data
alone.
2.4 Bioactivity-guided microfractionation
In order to rapidly localize the chromatographic zones of the HPLC chromatogram holding the
anticonvulsant activity, reversed phase semi-preparative HPLC microfractionation of the crude
methanolic extract (122 mg) was performed for metabolite profiling affording nine fractions (F1-
F9) (Figure 3A) (Wolfender and Queiroz, 2012). Each fraction has been submitted to the
zebrafish anticonvulsant bioassay. Fraction 8 showed a significant reduction (35%) of PTZ-
induced movement at 50 g/mL (*) (Figure 3B). The UHPLC-TOF-MS analysis of this active
microfraction showed mostly the presence of LC peaks having either a protonated molecules
[M+H]+at m/z 741 or 727. This corresponded to isomeric compounds of molecular formula

8
C39H64O13 or C38H62O13. Such data matched well with previously isolated steroid glycosides
from this plant (Colmenares et al., 2013; Lee et al., 2013; Lu et al., 2009; Shu et al., 2013). A
differentiation of the various isomers present could however not be made based on MS data only.
This rapid fractionation with only a few tenth of mg of crude extract however indicated that the
steroid glycosides were responsible for the anticonvulsant activity of the extract measure in the
in vivo assays.
In order to fully characterize the active compounds and assess their activities quantitatively their
isolation at a larger scale was needed. The separation was optimized by HPLC-UV-ELSD-MS.
This procedure capitalizes on the HPLC modeling based on generic linear gradients at the
analytical level to maximize the separation of interest compounds. These optimized analytical
HPLC conditions were then transferred to medium pressure liquid chromatography (MPLC-UV-
ELSD) using the same C18 reverse stationary phase (Zeoprep®
) and the same particle size (15-25
m). Using this approach, 6 compounds were isolated in one step at the mg scale (Figure 4).
2.5 Structural elucidation of the bioactive compounds
Four compounds (1-4) displayed the same molecular formula (C39H64O13) assigned from their
ESI-HRMS positive ion at m/z 741.4446 (eg for Torvoside J) (calcd. for C39H65O13 [M+H]+:
741.4425). According to the Dictionary of Natural Products (The Chapman and Hall Dictionary
of Natural Products on DVD, CRC Chemical Database), seven compounds, with the same
spirostane skeleton, were found in the genus Solanum with this molecular formula. Namely,
Torvoside C (this one was revised to Torvoside K by Iida et al., 2005), Torvoside J-L,
Paniculonin B, Spirotorvoside and Melongoside E. The 1H NMR spectra of 1-4 showed a very
similar pattern in agreement with glycosylated spirostane: two methyl singlets (Me-18 and Me-
19), four methyl doublets, two belonging to the spirostane (Me-21 and Me-27) and two to the
sugars moieties (Me-6' and Me-6'') and two anomeric doublets at H 5.14 (J = 1.7 Hz, H-1') and
9
4.27 (J = 7.9 Hz, H-1''). The COSY, TOCSY and HSQC spectra allowed identifying the sugars
as a quinovose and a rhamnose. The long range HMBC correlations from H-3' of the quinovose
(H 3.42, t, J= 8.9 Hz) to C-1'' of the rhamnose (C 102.8) and from H-1' of the quinovose to C-6
of the spirostane (C 80.4) indicated that the four compounds belong to the following type:
3,6,23-trihydroxy-5-spirostane 6-O--D-rhamnopyranosyl-(1→3)-O--D-quinovopyranosyl.
Melongoside E and Spirotorvoside being spirostane 3-O-glycoside they were thus excluded from
the list of possible structures. At this stage, Torvoside J, K, L and Paniculonon B remain the four
possible structures which differ only from their configuration at C-22, C-23 and C-25. According
to Y. Iida et al. (Chem. Pharm. Bull. 2005) the C at C-20 and H at Me-21 (in pyridine-d5) are
diagnostic for the determination of the configuration at C-22: H 1.07-1.26 and C 35.0-36.2 for
22--O-spirostanol (22-S) and H 1.53-1.54 and C43.1-44.1 for 22--O-spirostanol (22-R). As
the NMR data have been recorded in CD3OD (the solvent used for the dereplication database) a
direct comparison with the reported data was not possible. However, compounds 1, 2, 3 and 4
could be split into two groups based on their chemical shift values at C-20 and Me-21. The 13
C
chemical shifts recorded in CD3OD being very close to those obtained in pyridine-d5, we
concluded that 1, 2 and 3 were 22-R with the following H(Me-21)/C(C-20): 1.10/41.6,
1.12/40.8 and 1.16/43.6 whereas 4 exhibited a 22-S configuration (H(Me-21)/C(C-20):
0.96/37.0). The configuration of C-23 could be deduced from the H-23 coupling constant (dd (J
= 10.3/5.2 Hz) when H-23 was in axial position and a triplet (J = 3Hz) when H-23 was in
equatorial position). The configuration at C-25 was usually determined by the signal pattern of
H-26 (brd (J = 11.0 Hz) and dd, (J = 11.0, 3.0 Hz) when H-25 is equatorial and t (J = 11.0 Hz)
and brd, (J = 11.0Hz) when H-25 is axial). The H of Me-27 was also characteristic as it appear
shifted downfield in axial position (1.10-1.16) compared to the equatorial position (0.77-0.82).
Based on these observations, compound 1 was unambiguously identified as Torvoside J (22R,
23S, 25S), 2 as Torvoside L (22R, 23R, 25S), 3 as Torvoside K (22R, 23S, 25R) (Y. Iida et al.

10
Chem. Phar. Bull. 2005) and 4 to Paniculonin B (22S, 23S, 25S) (C-L. Lee et al. Phytochem
1995).
The other isolated compounds (5 and 6) shared a same molecular [M+H]+
ion at (eg m/z
727.4302 for Paniculonin A) (calcd. for C38H63O13 [M+H]+: 727.4269) indicating a molecular
formulae of C38H62O13 shifted by 14 Da compare to 1-4. The 1H NMR spectrum of 5 was very
close to that of Torvoside J (1) at the exception of the sugar region. The missing methyl doublet
at H 1.25 (CH3-6'') in 1 and the lack of CH2 in the molecular formulae suggested the presence of
a pentose instead of a hexose. The second sugar was identified as a xylose (H/C 4.48/106.0 for
H/C-1'', 3.26/75.3 for H/C-2'', 3.33/77.7-3 for H/C-3'', 3.49/71.0 for H/C-4'' and 3.23,3.90/67.1
for H/C-5''). Compound 5 was thus (22R,23S,25S)-3,6,23-trihydroxy-5-spirostane 6-O--D-
xylopyranosyl-(1→3)-O--D-quinovopyranoside (Lu et al. Phytochem 2011). The 1H NMR of 6
displayed the same sugar pattern as 5 and the same spirostane pattern as Paniculonin B (4).
Compound 6 was elucidated as Paniculonin A (M. Gonzalez et al. J. Nat. Prod. 2004). The NMR
description of all these compounds have not yet been reported in CD3OD, which is a common
solvent used for at-line dereplication by micro-NMR methods, and they are thus detailed in the
experimental section.
2.6 Acid hydrolysis of the glycosides
Triterpene glycosides are known to have poor intestinal absorption mainly due to their
unfavorable physicochemical properties, such as large molecular mass (>500 Da), high
hydrogen-bonding capacity (>12), and high molecular flexibility (>10), that underlie poor
membrane permeability (Yu et al., 2012). Assuming that the isolated steroid glycosides from S.
torvum may be pro-drugs, the fraction containing the triterpene glycosides was submitted to a
mild acid hydrolysis (refluxed with 2% H2SO4/MeOH for 8 days at 37°C) to provide the
corresponding aglycones (Kesselmeier and Budzikiewicz, 1979) that could mimic an initial
11
degradation step in the stomach (Yu et al., 2012). The hydrolysis afforded mainly one compound
(C22H34O4) ([M+H]+ at m/z 363.2543 (calculated for C22H34O4, 363.2535, 2.2 Δppm)). The NMR
analysis of the HSQC spectrum of the hydrolyzed product revealed the absence of sugar signals
as well as the characteristic signals belonging to the spirostane ring (eg. the oxymethine CH-23
and oxymethylene CH2-26). Moreover, a careful analysis of signals indicated that the hydrolyzed
product consist of a 65/35 mixture of two aglycones as seen by the duplication of signals for H-
16 (H/C 5.03/84.6 and 4.83/84.1), H-20 (H/C 2.60/37.4 and 2.97/38.7), H-17 (H/C 1.98/59.9
and 22.31/56.6), Me-21 (H/C 1.28/17.9 and 1.30/10.3) and Me-18 (H/C 0.73/13.9 and
0.81/14.0). Despite these differences in chemical shifts, the HMBC correlations were the same in
both molecules: from Me-21 to C-17, C-20 and the ester carbonyl at C 183.9/182.2 and from
Me-18 to C1-2, C-13, C-14 and C-17. The two aglycones were thus epimers. Analysis of the
NOESY correlations indicated that the first one was solanolide (A.K. Chakravarty et al.
Phytochemistry, 1982) as seen by the dipolar correlation from H-16 to Me-21 and H-17 and from
H-20 and Me-18. For the second isomer, the NOE crosspeaks from H-16 to H-17 and H-20 and
from Me-21 to Me-18 showed that it was the epimer of solanolide at C-20. The mechanism for
production of these aglycones (7a and 7b) was already speculated for the study of similar
compounds in Solanum anguivi (Nafady et al., 2003).
2.7 Bioactivity analysis of isolated compounds in vivo
The six isolated S. torvum steroidal glycosides and the aglycone from acid-hydrolysis
(compounds 1-7) were subjected to further biological activity analyses. The selected compounds
were exposed to 6/7-dpf zebrafish larvae for 18 h in various concentrations, with their MTC
values beyond the highest concentration (280 µM, with the exception of compound 1, which was
at 140 µM), before subsequent exposure to 20 mM PTZ (Figure 5). Compounds 4 - 6 did not
show significant reduction in PTZ-induced locomotor activity in larvae (Figure 5-4, 5-5, 5-6).
Inconsistent reduction of PTZ-induced activity over the 30-minute exposure time was seen for

12
compounds 2 and 3 (Figure 5-2, 5-3), although they display reduction of total movement only at
70 µM (Figure 5-7). Compound 1 showed significant reduction of PTZ-induced activity from 70
µM (moderate, P < 0.05) until 140 µM (P < 0.001) (Figure 5-1). As these compounds have
similar structures, the slight difference in compound 1 (the stereochemical positions of –OH and
–CH3 in the spirostane ring) compared to the other identified torvosides (2,3) may play a role in
activity modulation, as well as the type of sugar moiety attached to the aglycone (5) (Figure 4).
However, significant reduction of PTZ-induced activity in larvae was also observed for acid-
hydrolysis aglycone 7 at its MTC value (140 µM) (Figure 6A), indicating that the presence of a
sugar moiety may not be necessary.
The structures of the steroidal glycosides isolated from S. torvum, especially their acid-
hydrolysis aglycone product, bear resemblance to neurosteroids (e.g., alphaxalone,
pregnanolone, allopregnanolone, ganaxolone) which are known to interact with GABA
receptors, and have been used as anesthetics and sedatives (Child et al, 1971; Lan, 1994). One
such neurosteroid, ganaxolone, a potent GABAA modulator, shows anticonvulsant properties
(Carter et al., 1997) and is now facing Phase III clinical trials (Bialer et al, 2013) on adult
patients suffering from partial seizures. Based on the similarity of structure to the isolated
compounds and its known pharmacology and mode of action, ganaxolone was selected as a
reference drug for comparison purposes in larval zebrafish PTZ assays. Upon exposure to larval
zebrafish prior to addition of PTZ, ganaxolone (8) has shown to significantly reduce the
influence of PTZ on the locomotor activity of 7-dpf zebrafish larvae at 0.3 nM (Figure 6B).
Comparing the reduction of PTZ-induced activity of ganaxolone with any of the isolated S.
torvum compounds (and aglycone), we observed that there is a large difference in the order of
magnitude in terms of potencies of the compounds.
13
2.8 Bioactivity analysis of isolated compounds in vitro
Since neurosteroids are known to be GABAA modulators and the aglycone (7) present a related
steroid structural type, we used Xenopus laevis oocyte expression system to test the effects of
different compounds on the activity of GABAA receptors comprising α1, β2, and γ2s subunits
(Abdullah and Zhang, 2013). To check the expression level a test pulse with 1mM GABA was
applied at the beginning of each recording. After thorough washing 10 µM ganaxolone,
pregnanolone, S. torvum crude extract or compound 7 were applied and the obtained response
normalized to the test pulse. Pregnanolone, the crude extract and the aglycone (7) produced
smaller currents compared to the currents generated by ganaxolone (8). All novel compounds
elicited currents resembling the ones induced by GABA (Figure 7A, B).
In a different set of experiments we examined the potentiation effect on GABAA receptor
response known for pregnanolone and allopregnanolone (Reddy, 2010). Here the first application
of 10 µM GABA was followed by application of 10µM GABA mixed with 10µM or 100µM of
each tested compound. Washing times in between applications was 5 minutes and all responses
were normalized to the current produced by 10 µM GABA in the same cell. Except for
application of 10 µM GABA together 100 µM pregnanolone, all other currents were 2-3 fold
reduced compared to the ones generated by 10 µM GABA. These results indicate that the
isolated compounds from S. torvum are weak modulators of GABA receptors compared to
ganaxolone or pregnanolone.
The disparate order of magnitude of difference in potencies (sub-nanomolar vs micromolar)
between ganaxolone and the S. torvum aglycone (or even the parent steroidal glycosides) in the
larval zebrafish assay may be accounted for the structural differences between them. The
fundamental criterion for a neurosteroid to be effective in modulating GABA receptors is that the
compound should possess a hydrogen bond donor at C-3 in the steroid skeleton (3α-OH),
coupled with a hydrogen bond acceptor at C-17 on the β plane of the skeleton (Covey, 2001;

14
Akk, 2007). Beside being of the same structural type as ganaxolone, the acid-hydrolyzed
aglycone (7) exhibited several main differences such as 3β-OH instead of the alpha
configuration, a furan-type ring fused at C16-C17 instead of a COCH3 at C.17 and altogether this
may explain a different mode of action for both molecules.
The results obtained indicate, based on the hypothesis of a possible link between the mode of
actions of ganoxolone and the steroids of S. torvum, that the isolated compounds are not equally
as potent as ganaxolone as GABAA modulators, as reflected by the larval zebrafish results as
well as from the X. laevis oocyte receptor overexpression system. It can thus be hypothesize that
the reduction of PTZ-induced activity of S. torvum extract and compounds may be due to
mechanisms other than the GABA inhibitory system.
15
3. Conclusion
This work presents a new strategy of combining HPLC micro-fractionation with at-line
bioactivity assessment on an in vivo zebrafish behavioral epilepsy assay. It has allowed an
efficient localization of bioactive steroid glycoside and served for an efficient targeted isolation
of the bioactive compounds.
The isolation procedure was performed by direct geometrical gradient transfer from analytical
HPLC-ELSD to preparative medium pressure liquid chromatography (MPLC-ELSD) and
allowed an efficient isolation of the active compounds at large amount. The bioguided isolation
afforded six spirostane glycosylated triterpenes that were responsible for the antiepileptic activity
of the infusion and methanolic extract of aerial parts of Solanum torvum. These compounds
presented anticonvulsant activity in the in vivo zebrafish model but no specificity was recorded
among the different glycoside tested. Since the presumed bioavailability of such compounds is
poor and they might undergo hydrolysis when taken orally, as it the case with the traditional
preparation, we demonstrated that these compounds could generate an active aglycone through a
skeleton rearrangement under mild hydrolysis conditions. Despite the structural resemblance to
neurosteroids such as ganaxolone, these isolated steroidal glycosides and aglycone offer only
weak GABA modulation, thus indicating that these compounds may act on a different
mechanism of action to significantly reduce PTZ-induced seizure activity in zebrafish.

16
4. Materials and methods
General Experimental Procedures. NMR spectroscopic data were recorded on a 500 MHz
Agilent/Varian Inova spectrometer. Chemical shifts are reported in parts per million (δ) using the
residual CD3OD signal (δH 3.31; δC 49.0) as internal standards for 1H and
13C NMR, and
coupling constants (J) are reported in Hz. Complete assignment was performed based on 2D
experiments (COSY, TOCSY, NOESY, edited-HSQC and HMBC). ESI-HRMS data were
obtained on a Micromass LCT Premier time-of-flight mass spectrometer from Waters with an
electrospray ionization (ESI) interface (Waters, Milford, MA, USA). Analytical HPLC was
performed using an HP 1100 system equipped with a photodiode array detector (Agilent
Technologies, Santa Clara, CA, USA). MPLC was performed using a Büchi 681 pump (Büchi,
Flawil, Switzerland) equipped with a Knauer UV detector (Knauer, Berlin, Germany) and a 920
x 49 mm i.d. column (Büchi, Flawil, Switzerland) loaded with ZEOprep® C18 as the stationary
phase 15-25 m (Zeochem, Uetikon am See, Switzerland).
Plant material. The aerial parts of Solanum torvum was collected in Infanta, Quezon in the
Philippines in 2011. The botanical material was properly identified, with voucher specimen
#2796, deposited in the Herbarium of the Institute of Biology of the University of the Philippines
(UP Diliman). A Material Transfer Agreement for the collection and transfer of S. torvum
material from the Philippines to Belgium, in concordance with the UN Convention on
Biodiversity, has been signed between KU Leuven and Ateneo de Manila University.
Preparation of extract. The dried aerial parts (102.24 g) were successively extracted under
maceration and agitation with increasing polarity extraction in a round-bottom flask using a
sequence of solvents of increasing polarity (hexane, dichloromethane, methanol and water) and
concentrated under vacuum to yield 2.15 g of hexane (2.1%), 1.73 g (1.7%) of dichloromethane,
and 13.59 g of methanol (13.3%). The aqueous extract was frozen and lyophilized yielding 1.83

17
g (1.8%) of water extract. Traditional decoction has been prepared using 10 g of dried aerial part
of S. torvum in 100 ml of hot water during 1 hour a comparison of the profile with simple
infusion for example revealed the presence of similar compounds. The solution is filtrate and
evaporated to dryness yield 1.6 g (16%).
HPLC-DAD-ELSD-MS Analysis.HPLC-DAD-ELSD-MS data were obtained with an Agilent
HP 1100 series system consisting of an autosampler, high-pressure mixing pump and DAD
detector (Agilent Technologies, Santa Clara, CA, USA) connected to a Finnigan MAT LCQ ion
trap mass spectrometer (Finnigan, San Jose, CA, USA) equipped with a Finnigan electrospray
interface (ESI) and a ELSD detector Sedex 85 (Sedere, Oliver, France). The HPLC conditions
were as follows: an Zeoprep® C-18 column (15-25 µm, 250 x 4.6 mm i.d. (this particle size was
selected for an optimum gradient transfert the MPLC) (Zeochem, Uetikon am See, Switzerland);
solvent system: A, H2O containing 0.1% formic acid and B, ACN containing 0.1% formic acid;
step gradient: 2 to 27% of B in 5 min followed by 27% of B for 20 min, then 27% B to 36% of B
in 5 min, followed by 36% B for 20 min and 36% to 95% of B in 10 min; flow rate: 1 ml min-1
;
injection volume: 10 µl; and sample concentration: 10 mg/ml in MeOH. The samples are
analysed with UV detection and the absorbance was measured at 280 nm and ELSD detection.
ESI-MS conditions were as follows: capillary voltage: 30 V; capillary temperature: 200 °C;
source voltage: 4.5 kV; source current: 80 µA; nitrogen as the sheath gas; and positive and
negative ion mode. Spectra (180-1200 mu) were recorded every 3 s.
UHPLC-TOF-HRMS analyses. HRMS metabolite fingerprint of the extracts was performed on
a Micromass-LCT Premier Time of Flight (TOF) mass spectrometer (Waters, Milford MA,
USA) equipped with an electrospray interface and coupled to an Acquity UPLC system (Waters,
Milford MA, USA). The ESI conditions were as follows: capillary voltage 2800 V, cone voltage
40 V, MCP detector voltage 2400 V, source temperature 120°C, desolvation temperature 300°C,
cone gas flow 20 L/h, and desolvation gas flow 600 L/h. Detection was performed in positive ion

18
mode (PI) with a m/z range of 100–1300 Da and a scan time of 0.5 s in the W-mode. The MS
was calibrated using sodium formate, and leucine encephalin (Sigma-Aldrich, Steinheim,
Germany) was used as an internal reference at 2 μg/mL and infused through a Lock Spray™
probe at a flow rate of 10 μL/min with the help of a second LC pump.
The general profiling of the extract was performed on a Acquity BEH C18 UPLC column (150
×2.1 mm i.d.; 1.7 µm, Waters, Milford, MA, USA) using a linear gradient from 5% ACN+0.1%
FA to 95% of B in 30 min, while for the separation of the isomers the following otpimised
conditions were used:Acquity BEH C18 UPLC column (50 ×2.1 mm i.d.; 1.7 µm, Waters,
Milford, MA, USA) using a stepgradient (solvent system: A= 0.1% formic acid–water, B= 0.1%
formic acid–acetonitrile; gradient: 5–36% B in 1 min, then 36% B to 36% B in 2 min, 36% B to
95% B in 1.5 min; flow rate 1.1 ml/min). The temperature was set to 40°C. The injected volume
was kept constant (1 µL).
Semi preparative HPLC-UV microfractionation. A first fractionation allowed the localisation
of the active area on the chromatogram. The fractionation was performed on a5 µm Xterra prep
Column C18 OBD (150x19mm, 5 µm). The gradient start with 100% of mobile phase A
(H2O+0.1% FA) to 60% of mobile phase B (ACN +0.1% FA) in 56 min.13 Fractions were
collected every 3 minutes were the separation couls be monitored by UV. Fraction 1 has been
obtained by pooling 3 successives fractions, F4 and F5 by pooling 2 successives fractions. The
non UV active part was pooled into two main fractions (F8 and F9).
Isolation of active compounds from the methanolic extract. The methanolic extract (4 g) was
first fractionated using MPLC with Zeoprep® C18 as the stationary phase (15-25 µm, 920 x 49
mm i.d.) (Zeochem, Uetikon am See, Switzerland) ACN and H2O containing 0.1% formic acid
as mobile phase in a step gradient as the following: 2-27% B for 9.5 hours, isocratic 27% B for
31.5 hours, 27-36% B for 8 hours, isocratic 36% for 32 hours, 36-95% B for 16 hours, isocratic

19
95% B for 16 hours for 113 hours as a total of purification time. The flow rate was 4 ml min-1
,
and the UV absorbance was detected at 280 nm. The ELSD detection was performed under the
following parameters: pressure 3.2 bars, 45°C, split to provide a 500 µl/min Flow rate, gain 8.
The MPLC yielded 182 fractions. All fractions were analysed by UHPLC-TOF-MS. Fraction 71
yielded compound 1, Torvoside J (9.4 mg), fraction 80 yielded 2, F80 (3.4 mg), fraction 88A
yielded 3, Torvoside K (7 mg), fraction 88B yielded 4, Torvoside L (7 mg), fraction 117 yielded
5 Paniculin B (2.2 mg), and fraction 128 yielded 6, Paniculin A (1.6 mg) all the other fractions
were selected for further purification.
Hydrolysis conditions for obtaining the aglycone 7. In order to obtain the aglycone from the
spirostane glycoside, a mild hydrolysis has been performed. Indeed, classical acidic hydrolysis
induces a destruction of the spirostane. The mild hydrolysis protocol was based on the one
described by Kesselmeier et al., in 1979 except the HCl has been replaced by H2SO4. Aglycone
was obtained by subjecting glycoside of interest to a solution 2% H2SO4 in MeOH at 37°C
during 8 days.
Spectral data of the isolated compounds
Compound 1, Torvoside J. H NMR (CD3OD, 500 MHz) 0.68 (1H, td, J=11.3, 3.6 Hz, H-9),
0.77 (3H, d, J=6.6 Hz, Me-27), 0.81 (3H, s, Me-18), 0.87 (3H, s, Me-19), 0.95 (1H, m, H-7b),
1.02 (1H, m, H-1b), 1.10 (3H, d, J=6.9 Hz, Me-21), 1.13 (1H, m, H-12b), 1.15 (2H, m, H-4b, H-
5), 1.16 (1H, m, H-14), 1.25 (3H, d, J=6.2 Hz, Me-6''), 1.27 (1H, m, H-15b), 1.28 (3H, d, J=6.2
Hz, Me-6'), 1.32 (1H, m, H-11b), 1.41 (1H, m, H-2b), 1.54 (1H, m, H-11a), 1.61 (1H, m, H-24b),
1.64 (1H, m, H-8), 1.66 (1H, m, H-24a), 1.69 (1H, m, H-17), 1.70 (1H, m, H-1a), 1.74 (1H, m,
H-12a), 1.75 (1H, m, H-2a), 1.98 (1H, m, H-15a), 2.04 (1H, m, H-25), 2.17 (1H, dt, J=12.5, 4.1
Hz, H-7a), 2.25 (1H, p, J=6.9 Hz, H-20), 2.38 (1H, m, H-4a), 3.02 (1H, t, J=8.9 Hz, H-4'), 3.28
(1H, dd, J=8.9, 7.9 Hz, H-2'), 3.31 (1H, m, H-5'), 3.36 (1H, m, H-26b), 3.38 (1H, m, H-6), 3.40
(1H, t, J=9.6 Hz, H-4''), 3.43 (1H, t, J=8.9 Hz, H-3'), 3.46 (2H, m, H-3, H-26a), 3.53 (1H, t,
J=3.0 Hz, H-23), 3.70 (1H, dd, J=9.6, 3.3 Hz, H-3''), 3.94 (1H, brs, H-2''), 3.99 (1H, dq, J=9.6,
6.2 Hz, H-5''), 4.27 (1H, d, J=7.9 Hz, H-1'), 4.46 (1H, q, J=6.9 Hz, H-16), 5.14 (1H, brs, H-

20
1'')13
C NMR (CD3OD, 126 MHz) 13.9 (C-19), 16.8 (C-18), 17.1 (C-21), 17.4 (C-27), 17.9 (C-
6''), 18.4 (C-6'), 22.0 (C-11), 24.9 (C-25), 31.8 (C-2), 32.7 (C-4), 32.9 (C-15), 35.2 (C-8), 37.5
(C-10), 37.6 (C-24), 38.4 (C-1), 40.7 (C-12), 41.6 (C-7, C-20), 42.0 (C-13), 51.7 (C-5), 55.0 (C-
9), 57.4 (C-14), 65.6 (C-17), 67.5 (C-26), 70.0 (C-5''), 71.0 (C-23), 71.8 (C-3), 72.2 (C-3''), 72.3
(C-2''), 72.9 (C-5'), 73.9 (C-4''), 75.7 (C-4'), 76.3 (C-2'), 80.3 (C-6), 82.3 (C-16), 84.2 (C-3'),
102.7 (C-1''), 105.1 (C-1'), 109.9 (C-22). ESI-HRMS m/z 741.4437 [M+H]+ (calculated for
C39H65O13, 741.4425, Δppm = 1.6)
Compound 2, Torvoside L. 1H NMR (CD3OD, 500 MHz) 0.69 (1H, m, H-9), 0.82 (3H, d,
J=6.4 Hz, Me-27), 0.87 (3H, s, Me-18), 0.88 (3H, s, Me-19), 0.94 (1H, q, J=12.2Hz, H-7b), 1.02
(1H, brt, J=12.7 Hz, H-1b), 1.12 (1H, m, H-14), 1.14 (1H, m, H-4b), 1.16 (2H, m, H-5, H-12b),
1.16 (3H, d, J=7.2 Hz, Me-21), 1.24 (3H, d, J=6.2 Hz, Me-6''), 1.28 (1H, m, H-15b), 1.28 (3H, d,
J=6.2 Hz, Me-6'), 1.35 (1H, m, H-11b), 1.41 (1H, m, H-2b), 1.48 (1H, q, J=11.8Hz, H-24b), 1.55
(1H, d, J=13.7 Hz, H-11a), 1.66 (1H, m, H-8), 1.71 (1H, m, H-1a), 1.74 (1H, m, H-12a), 1.75
(2H, m, H-2a, H-25), 1.79 (1H, m, H-24a), 1.84 (1H, dd, J=9.1, 6.3 Hz, H-17), 1.96 (1H, dq,
J=12.1, 6.5Hz, H-15a), 2.17 (1H, m, H-7a), 2.20 (1H, m, H-20), 2.38 (1H, m, H-4a), 3.02 (1H, t,
J=9.1Hz, H-4'), 3.26 (1H, dd, J=9.3, 8.0 Hz, H-2'), 3.30, (1H, m, H-26b), 3.31 (1H, m, H-5'),
3.39 (2H, m, H-6, H-4''), 3.42 (1H, m, H-3'), 3.43 (1H, m, H-26a), 3.45 (1H, m, H-3), 3.63 (1H,
dd, J=11.5, 4.6 Hz, H-23), 3.69 (1H, dd, J=9.5, 3.4 Hz, H-3''), 3.93 (1H, dd, J=3.4, 1.8 Hz, H-
2''), 3.99 (1H, m, H-5''), 4.27 (1H, d, J=8.0 Hz, H-1'), 4.71 (1H, q, J=7.6 Hz, H-16), 5.14 (1H, d,
J=1.8 Hz, H-1'')13
C NMR (CD3OD, 126 MHz) 13.6 (C-19), 16.2 (C-21), 16.6 (C-27), 17.0 (C-
18), 17.7 (C-6''), 18.2 (C-6'), 21.8 (C-11), 31.6 (C-25), 31.8 (C-2), 32.5 (C-4), 34.5 (C-15), 34.9
(C-8), 38.2 (C-1), 38.3 (C-24), 41.0 (C-12), 41.5 (C-7),43.6(C-20), 51.6 (C-5), 54.9 (C-9), 56.5
(C-14), 64.1 (C-17), 69.3 (C-26), 69.9 (C-5''), 70.6 (C-23), 71.7 (C-3), 72.1 (C-3''), 72.2 (C-2''),
72.8 (C-5'), 73.9 (C-4''), 75.5 (C-4'), 76.2 (C-2'), 80.2 (C-6), 84.2 (C-3'), 85.2 (C-16), 102.6 (C-
1''), 104.9 (C-1'). ESI-HRMS m/z 741.4446 [M+H]+ (calculated for C39H65O13, 741.4425,
Δppm = 2.8).
Compound 3, Torvoside K. 1H NMR (CD3OD, 500 MHz) 0.69 (1H, m, H-9), 0.82 (3H, s,
Me-18), 0.87 (3H, s, Me-19), 0.95 (1H, m, H-7b), 1.02 (1H, m, H-1b), 1.12 (3H, d, J=7.0 Hz,
Me-21), 1.14 (2H, m, H-4b, H-12b), 1.16 (1H, m, H-5), 1.17 (1H, m, H-14), 1.21 (3H, d, J=7.3
Hz, Me-27), 1.24 (3H, d, J=6.2 Hz, Me-6''), 1.27 (1H, m, H-15b), 1.28 (3H, d, J=6.1 Hz, Me-6'),
1.32 (1H, m, H-11b), 1.40 (1H, m, H-2b), 1.52 (1H, m, H-24b), 1.55 (1H, m, H-11a), 1.65 (1H,
21
m , H-8), 1.67 (1H, m, H-25), 1.70 (1H, m, H-17), 1.71 (1H, m, H-1a), 1.75 (2H, m, H-2a, H-
12a), 1.96 (1H, m, H-15a), 2.06 (1H, m, H-24a), 2.17 (1H, m, H-7a), 2.35 (1H, m, H-20), 2.38
(1H, m, H-4a), 3.01 (1H, t, J=9.0 Hz, H-4'), 3.26 (1H, dd, J=9.0, 7.9 Hz, H-2'), 3.31 (2H, m, H-
26b, H-5'), 3.39 (2H, m, H-6, H-4''), 3.42 (1H, t, J=9.0 Hz, H-3'), 3.45 (1H, m, H-3), 3.57 (1H, t,
J=3.9 Hz, H-23), 3.69 (1H, dd, J=9.5, 3.4 Hz, H-3''), 3.93 (1H, dd, J=3.4, 1.7 Hz, H-2''), 3.96
(1H, dd, J=11.2, 3.8 Hz, H-26a), 3.99 (1H, dq, J=9.5, 6.2 Hz, H-5''), 4.27 (1H, d, J=7.9 Hz, H-
1'), 4.47 (1H, q, J=7.8 Hz, H-16), 5.14 (1H, d, J=1.7 Hz, H-1'')13
C NMR (CD3OD, 126 MHz)
13.6 (C-19), 16.6 (C-18), 16.7 (C-21), 17.7 (C-6''), 18.1 (C-6'), 20.0 (C-27), 21.9 (C-11), 27.7
(C-25), 31.6 (C-2), 32.4 (C-4), 32.7 (C-15), 34.3 (C-24), 35.0 (C-8), 38.3 (C-1), 40.7 (C-12),
40.8 (C-20), 41.5 (C-7), 51.6 (C-5), 54.9 (C-9), 57.3 (C-14), 65.2 (C-17), 66.0 (C-26), 69.8 (C-
5''), 71.0 (C-23), 71.6 (C-3), 72.0 (C-3''), 72.2 (C-2''), 72.8 (C-5'), 73.9 (C-4''), 75.5 (C-4'), 76.2
(C-2'), 80.2 (C-6), 82.4 (C-16), 84.0 (C-3'), 102.7 (C-1''), 105.0 (C-1'). ESI-HRMS m/z 741.4453
[M+H]+ (calculated for C39H65O13, 741.4425, Δppm = 3.8).
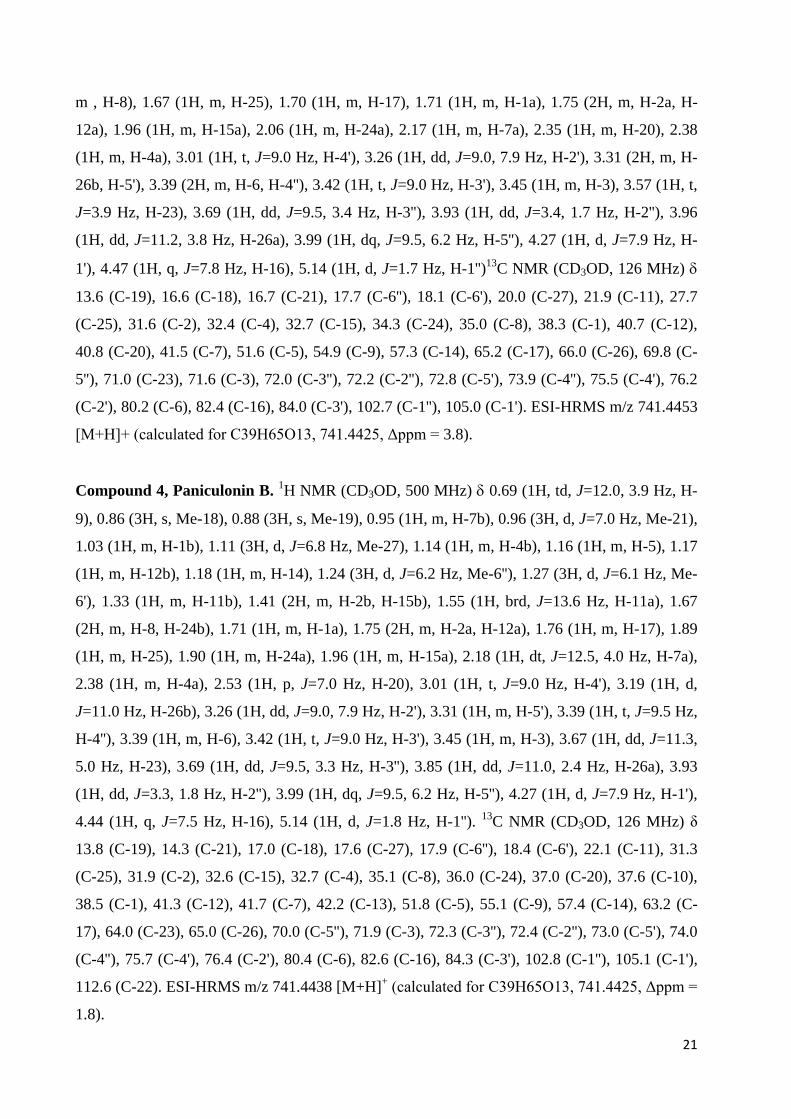
Compound 4, Paniculonin B. 1H NMR (CD3OD, 500 MHz) 0.69 (1H, td, J=12.0, 3.9 Hz, H-
9), 0.86 (3H, s, Me-18), 0.88 (3H, s, Me-19), 0.95 (1H, m, H-7b), 0.96 (3H, d, J=7.0 Hz, Me-21),
1.03 (1H, m, H-1b), 1.11 (3H, d, J=6.8 Hz, Me-27), 1.14 (1H, m, H-4b), 1.16 (1H, m, H-5), 1.17
(1H, m, H-12b), 1.18 (1H, m, H-14), 1.24 (3H, d, J=6.2 Hz, Me-6''), 1.27 (3H, d, J=6.1 Hz, Me-
6'), 1.33 (1H, m, H-11b), 1.41 (2H, m, H-2b, H-15b), 1.55 (1H, brd, J=13.6 Hz, H-11a), 1.67
(2H, m, H-8, H-24b), 1.71 (1H, m, H-1a), 1.75 (2H, m, H-2a, H-12a), 1.76 (1H, m, H-17), 1.89
(1H, m, H-25), 1.90 (1H, m, H-24a), 1.96 (1H, m, H-15a), 2.18 (1H, dt, J=12.5, 4.0 Hz, H-7a),
2.38 (1H, m, H-4a), 2.53 (1H, p, J=7.0 Hz, H-20), 3.01 (1H, t, J=9.0 Hz, H-4'), 3.19 (1H, d,
J=11.0 Hz, H-26b), 3.26 (1H, dd, J=9.0, 7.9 Hz, H-2'), 3.31 (1H, m, H-5'), 3.39 (1H, t, J=9.5 Hz,
H-4''), 3.39 (1H, m, H-6), 3.42 (1H, t, J=9.0 Hz, H-3'), 3.45 (1H, m, H-3), 3.67 (1H, dd, J=11.3,
5.0 Hz, H-23), 3.69 (1H, dd, J=9.5, 3.3 Hz, H-3''), 3.85 (1H, dd, J=11.0, 2.4 Hz, H-26a), 3.93
(1H, dd, J=3.3, 1.8 Hz, H-2''), 3.99 (1H, dq, J=9.5, 6.2 Hz, H-5''), 4.27 (1H, d, J=7.9 Hz, H-1'),
4.44 (1H, q, J=7.5 Hz, H-16), 5.14 (1H, d, J=1.8 Hz, H-1''). 13
C NMR (CD3OD, 126 MHz) δ
13.8 (C-19), 14.3 (C-21), 17.0 (C-18), 17.6 (C-27), 17.9 (C-6''), 18.4 (C-6'), 22.1 (C-11), 31.3
(C-25), 31.9 (C-2), 32.6 (C-15), 32.7 (C-4), 35.1 (C-8), 36.0 (C-24), 37.0 (C-20), 37.6 (C-10),
38.5 (C-1), 41.3 (C-12), 41.7 (C-7), 42.2 (C-13), 51.8 (C-5), 55.1 (C-9), 57.4 (C-14), 63.2 (C-
17), 64.0 (C-23), 65.0 (C-26), 70.0 (C-5''), 71.9 (C-3), 72.3 (C-3''), 72.4 (C-2''), 73.0 (C-5'), 74.0
(C-4''), 75.7 (C-4'), 76.4 (C-2'), 80.4 (C-6), 82.6 (C-16), 84.3 (C-3'), 102.8 (C-1''), 105.1 (C-1'),
112.6 (C-22). ESI-HRMS m/z 741.4438 [M+H]+ (calculated for C39H65O13, 741.4425, Δppm =
1.8).
22
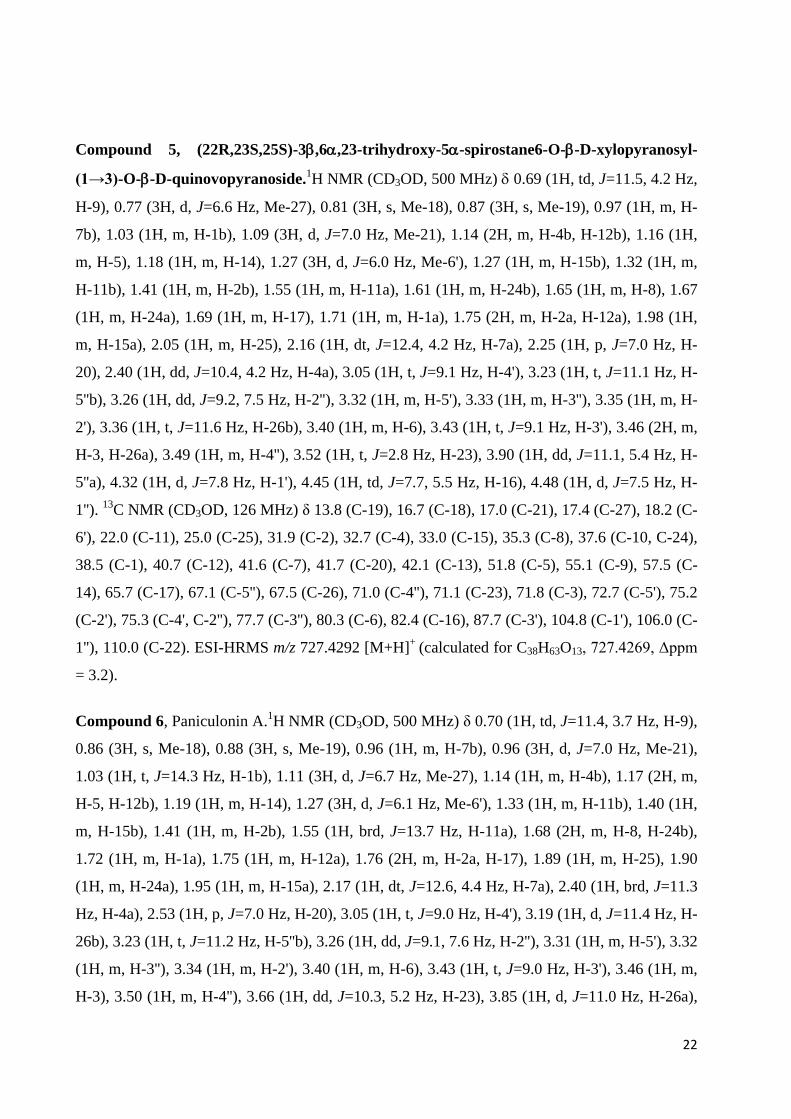
Compound 5, (22R,23S,25S)-3,6,23-trihydroxy-5-spirostane6-O--D-xylopyranosyl-
(1→3)-O--D-quinovopyranoside.1H NMR (CD3OD, 500 MHz) 0.69 (1H, td, J=11.5, 4.2 Hz,
H-9), 0.77 (3H, d, J=6.6 Hz, Me-27), 0.81 (3H, s, Me-18), 0.87 (3H, s, Me-19), 0.97 (1H, m, H-
7b), 1.03 (1H, m, H-1b), 1.09 (3H, d, J=7.0 Hz, Me-21), 1.14 (2H, m, H-4b, H-12b), 1.16 (1H,
m, H-5), 1.18 (1H, m, H-14), 1.27 (3H, d, J=6.0 Hz, Me-6'), 1.27 (1H, m, H-15b), 1.32 (1H, m,
H-11b), 1.41 (1H, m, H-2b), 1.55 (1H, m, H-11a), 1.61 (1H, m, H-24b), 1.65 (1H, m, H-8), 1.67
(1H, m, H-24a), 1.69 (1H, m, H-17), 1.71 (1H, m, H-1a), 1.75 (2H, m, H-2a, H-12a), 1.98 (1H,
m, H-15a), 2.05 (1H, m, H-25), 2.16 (1H, dt, J=12.4, 4.2 Hz, H-7a), 2.25 (1H, p, J=7.0 Hz, H-
20), 2.40 (1H, dd, J=10.4, 4.2 Hz, H-4a), 3.05 (1H, t, J=9.1 Hz, H-4'), 3.23 (1H, t, J=11.1 Hz, H-
5''b), 3.26 (1H, dd, J=9.2, 7.5 Hz, H-2''), 3.32 (1H, m, H-5'), 3.33 (1H, m, H-3''), 3.35 (1H, m, H-
2'), 3.36 (1H, t, J=11.6 Hz, H-26b), 3.40 (1H, m, H-6), 3.43 (1H, t, J=9.1 Hz, H-3'), 3.46 (2H, m,
H-3, H-26a), 3.49 (1H, m, H-4''), 3.52 (1H, t, J=2.8 Hz, H-23), 3.90 (1H, dd, J=11.1, 5.4 Hz, H-
5''a), 4.32 (1H, d, J=7.8 Hz, H-1'), 4.45 (1H, td, J=7.7, 5.5 Hz, H-16), 4.48 (1H, d, J=7.5 Hz, H-
1''). 13
C NMR (CD3OD, 126 MHz) δ 13.8 (C-19), 16.7 (C-18), 17.0 (C-21), 17.4 (C-27), 18.2 (C-
6'), 22.0 (C-11), 25.0 (C-25), 31.9 (C-2), 32.7 (C-4), 33.0 (C-15), 35.3 (C-8), 37.6 (C-10, C-24),
38.5 (C-1), 40.7 (C-12), 41.6 (C-7), 41.7 (C-20), 42.1 (C-13), 51.8 (C-5), 55.1 (C-9), 57.5 (C-
14), 65.7 (C-17), 67.1 (C-5''), 67.5 (C-26), 71.0 (C-4''), 71.1 (C-23), 71.8 (C-3), 72.7 (C-5'), 75.2
(C-2'), 75.3 (C-4', C-2''), 77.7 (C-3''), 80.3 (C-6), 82.4 (C-16), 87.7 (C-3'), 104.8 (C-1'), 106.0 (C-
1''), 110.0 (C-22). ESI-HRMS m/z 727.4292 [M+H]+
(calculated for C38H63O13, 727.4269, Δppm
= 3.2).
Compound 6, Paniculonin A.1H NMR (CD3OD, 500 MHz) δ 0.70 (1H, td, J=11.4, 3.7 Hz, H-9),
0.86 (3H, s, Me-18), 0.88 (3H, s, Me-19), 0.96 (1H, m, H-7b), 0.96 (3H, d, J=7.0 Hz, Me-21),
1.03 (1H, t, J=14.3 Hz, H-1b), 1.11 (3H, d, J=6.7 Hz, Me-27), 1.14 (1H, m, H-4b), 1.17 (2H, m,
H-5, H-12b), 1.19 (1H, m, H-14), 1.27 (3H, d, J=6.1 Hz, Me-6'), 1.33 (1H, m, H-11b), 1.40 (1H,
m, H-15b), 1.41 (1H, m, H-2b), 1.55 (1H, brd, J=13.7 Hz, H-11a), 1.68 (2H, m, H-8, H-24b),
1.72 (1H, m, H-1a), 1.75 (1H, m, H-12a), 1.76 (2H, m, H-2a, H-17), 1.89 (1H, m, H-25), 1.90
(1H, m, H-24a), 1.95 (1H, m, H-15a), 2.17 (1H, dt, J=12.6, 4.4 Hz, H-7a), 2.40 (1H, brd, J=11.3
Hz, H-4a), 2.53 (1H, p, J=7.0 Hz, H-20), 3.05 (1H, t, J=9.0 Hz, H-4'), 3.19 (1H, d, J=11.4 Hz, H-
26b), 3.23 (1H, t, J=11.2 Hz, H-5''b), 3.26 (1H, dd, J=9.1, 7.6 Hz, H-2''), 3.31 (1H, m, H-5'), 3.32
(1H, m, H-3''), 3.34 (1H, m, H-2'), 3.40 (1H, m, H-6), 3.43 (1H, t, J=9.0 Hz, H-3'), 3.46 (1H, m,
H-3), 3.50 (1H, m, H-4''), 3.66 (1H, dd, J=10.3, 5.2 Hz, H-23), 3.85 (1H, d, J=11.0 Hz, H-26a),

23
3.90 (1H, dd, J=11.2, 5.4 Hz, H-5''a), 4.32 (1H, d, J=7.8 Hz, H-1'), 4.44 (1H, q, J=7.4 Hz, H-16),
4.48 (1H, d, J=7.6 Hz, H-1''). 13
C NMR (CD3OD, 126 MHz) δ 13.3 (C-19), 13.8 (C-21), 16.5 (C-
18), 17.1 (C-27), 17.7 (C-6'), 21.6 (C-11), 30.9 (C-25), 31.4 (C-2), 32.0 (C-15), 32.1 (C-4), 34.5
(C-8), 35.5 (C-24), 36.6 (C-20), 37.2 (C-10), 37.9 (C-1), 40.8 (C-12), 41.2 (C-7), 42.0 (C-13),
51.2 (C-5), 54.6 (C-9), 56.9 (C-14), 62.6 (C-17), 63.5 (C-23), 64.7 (C-26), 66.5 (C-5''), 70.6 (C-
4''), 71.3 (C-3), 72.3 (C-5'), 74.6 (C-2'), 74.8 (C-2''), 74.9 (C-4'), 77.1 (C-3''), 79.7 (C-6), 82.1 (C-
16), 87.2 (C-3'), 104.3 (C-1'), 105.5 (C-1''), 112.0 (C-22). ESI-HRMS m/z 727.4302 [M+H]+
(calculated for C38H63O13, 727.4269, Δppm = 4.5)
Aglycone 7a/7b
Solanolide 7a. 1H NMR (CD3OD, 500 MHz) 0.73 (1H, m, H-9), 0.73 (3H, s, Me-18), 0.85 (3H,
s, Me-19), 0.95 (1H, m, H-7b), 1.03 (2H, m, H-1b, H-5), 1.17 (2H, m, H-4b, H-12b), 1.21 (1H,
m, H-14), 1.28 (3H, d, J=8.0 Hz, Me-21), 1.36 (1H, m, H-11b), 1.41 (1H, m, H-2b), 1.47 (1H, m,
H-15b), 1.58 (1H, m, H-11a), 1.63 (1H, m, H-8), 1.72 (1H, m, H-1a), 1.76 (1H, m, H-2a), 1.81
(1H, m, H-12a), 1.97 (1H, m, H-7a), 1.98 (1H, m, H-17), 2.18 (1H, m, H-4a), 2.30 (1H, m, H-
15a), 2.61 (1H, m, H-20), 3.34 (1H, m, H-6), 3.49 (1H, m, H-3), 5.03 (1H, td, J=7.8, 4.6 Hz, H-
16). 13
C NMR (CD3OD, 126 MHz) δ 13.6 (C-19), 13.9 (C-18), 17.9 (C-21), 21.4 (C-11), 31.6
(C-2), 32.8 (C-4), 33.8 (C-15), 34.7 (C-8), 37.4 (C-20), 37.6 (C-10), 38.3 (C-1), 38.7 (C-12),
42.2 (C-13), 42.3 (C-7), 52.6 (C-5), 54.9 (C-9), 55.4 (C-14), 59.9 (C-17), 69.6 (C-6), 71.7 (C-3),
84.6 (C-16), 183.9 (C-22). ESI-HRMS m/z 363.2530 [M+H]+ (calculated for C22H3543, 363.2535, Δppm =
1.4).
Solanolide-20-epimer 7b. 1H NMR (CD3OD, 500 MHz) 0.73 (1H, m, H-9), 0.81 (3H, s, Me-
18), 0.85 (3H, s, Me-19), 0.95 (1H, m, H-7b), 1.03 (2H, m, H-1b, H-5), 1.17 (2H, m, H-4b, H-
12b), 1.21 (1H, m, H-14), 1.30 (3H, d, J=8.1 Hz, Me-21), 1.36 (1H, m, H-11b), 1.41 (1H, m, H-
2b), 1.47 (1H, m, H-15b), 1.58 (1H, m, H-11a), 1.63 (1H, m, H-8), 1.72 (1H, m, H-1a), 1.76 (1H,
m, H-2a), 1.81 (1H, m, H-12a), 1.97 (1H, m, H-7a), 2.18 (1H, m, H-4a), 2.30 (1H, m, H-15a),
2.31 (1H, m, H-17), 2.97 (1H, m, H-20), 3.34 (1H, m, H-6), 3.49 (1H, m, H-3), 4.83 (1H, td,
J=7.3, 3.7 Hz, H-16). 13
C NMR (CD3OD, 126 MHz) δ 10.3 (C-21), 13.5 (C-19), 14.0 (C-18),
21.4 (C-11), 31.6 (C-2), 32.8 (C-4), 33.8 (C-15), 34.7 (C-8), 37.6 (C-10), 38.3 (C-1), 38.7 (C-
20), 38.7 (C-12), 42.2 (C-13), 42.3 (C-7), 52.6 (C-5), 54.9 (C-9), 55.4 (C-14), 56.6 (C-17), 69.6
(C-6), 71.7 (C-3), 84.1 (C-16), 182.2 (C-22). ESI-HRMS m/z 363.2522 [M+H]+ (calculated for C22H3543,
363.2535, Δppm = 3.6).

24
Animals
Zebrafish. Adult zebrafish (AB strain) were reared at 28°C on a 14/10-hour light/dark cycle
according to standard aquaculture conditions. Eggs were collected following natural spawning,
sorted and raised in 0.3x Danieau’s solution (1.5 mM HEPES, pH 7.6, 17.4 mM NaCl, 0.21 mM
KCl, 0.12 mM MgSO4, and 0.18 mM Ca(NO3)2) under constant light conditions in an incubator
set at 28°C until 6 or 7 dpf. All zebrafish experiments carried out were approved by the Ethics
Committee of the University of Leuven.
Evaluation of anticonvulsant activity
Automated larval zebrafish-PTZ assay. One 7-dpf zebrafish larva was placed per well in a 96-
well plate. Excess larval medium was removed and replaced with 100 µL of either control or
sample solution. The prepared plate was placed in a dark box inside an incubator, set at 28°C, for
1 or 18 hours, and subsequently inspected per well for signs of toxicity (e.g., irregular heart-rate,
loss of posture, edema, necrosis, delayed startle or touch response). The maximum tolerated
concentration (MTC) was designated as the highest sample concentration that did not elicit any
signs of toxicity in 6/7-dpf larvae after 18 hours of exposure (Afrikanova, 2013). Upon addition
of 100 µL of 40 mM PTZ per well, the plate was positioned in the zebrafish tracking box
(Viewpoint, Lyon, France), and the larvae allowed to habituate for 5 minutes before recording
for 30 minutes, with movement values determined at 5 minute intervals. Tracking data was
exported into Excel format and processed as such before statistical analysis via GraphPad™
Prism v.5 for Windows. Each tracking data set was normalized against the PTZ-only control
values (set at 100%) within each set, with each subsequent replicate set pooled before two-way
ANOVA with Bonferroni post hoc analysis.

25
Xenopus laevis GABAA receptor overexpression system
Oocyte preparation and injection. The use of animals and all experimental procedures were
approved by local authorities (Regierungspraesidium Tuebingen, Tuebingen, Germany). Oocytes
were obtained from the Institute of Physiology I, Tübingen. Preparation of oocytes for recordings
included treatment with collagenase (1mg/ml of type CLS II collagenase, Biochrom KG, Berlin,
Germany) in OR2 solution (mM: 82.5 NaCl, 2.5 KCl, 1 MgCl2 and 5 HEPES, pH 7.6), followed
by thorough washing and storing at 16 °C in Barth solution (mM:88 NaCl, 2.4 NaHCO3, 1 KCl,
0.33 Ca(NO3)2, 0.41 CaCl2, 0.82 MgSO4 and 5 Tris/HCl, pH 7.4 with NaOH) supplemented with
50 Lg/ml gentamicin (Biochrom KG, Germany). For injection and recording oocytes were plated
in 96 well plates. All cRNA concentrations were adjusted to 800 ng/subunit and 70nl of the
α1β2γ2s cRNA mixed in a 1:1:2 ratio were injected in each oocyte using robooinject® (Multi
Channel Systems, Reutlingen, Germany). Recordings were done at day 3 after injection.
Amplitudes of interest for all currents recorded from the same oocyte were normalized to the
first GABA pulse.
Automated oocyte two-microelectrode voltage clamp. The currents in oocytes were recorded at
room temperature (20-22°C) using roboocyte2® (Multi Channel Systems, Reutlingen,
Germany). Prepulled and prepositioned intracellular glass microelectrodes had a resistance of
0.3–1 MO when filled with 1 M KCl/ 1.5 M KAc. The bath solution was ND96 (im mM: 93.5
NaCl, 2 KCl, 1.8 CaCl2, 2 MgCl2 and 5 Hepes; pH 7.5). All compounds were applied for 15sec
followed by 5 minutes washout with ND96.
26
5. Acknowledgements
OEB is a recipient of a PhD fellowship from the IRO (Interfacultaire Raad voor
Ontwikkelingssamenwerking) program of KU Leuven.
27
6. References
Abdullah, J.M., Zhang, J., 2013. The GABA A receptor subunits heterologously expressed in Xenopus oocytes. Mini Rev Med Chem 13, 744-748.
Arif, H., Buchsbaum, R., Weintraub, D., Pierro, J., Resor, S.R., Hirsch, L.J., 2009. Patient-reported
cognitive side effects of antiepileptic drugs: Predictors and comparison of all commonly used
antiepileptic drugs. Epilepsy & Behavior 14, 202-209.
Arroyo, S., de la Morena, A., 2001. Life-threatening adverse events of antiepileptic drugs. Epilepsy Res
47, 155-174.
Bohni, N., Cordero-Maldonado, M.L., Maes, J., Siverio-Mota, D., Marcourt, L., Munck, S., Kamuhabwa,
A.R., Moshi, M.J., Esguerra, C.V., de Witte, P.A., Crawford, A.D., Wolfender, J.L., 2013. Integration of
Microfractionation, qNMR and zebrafish screening for the in vivo bioassay-guided isolation and
quantitative bioactivity analysis of natural products. PloS one 8, e64006.
Buenafe, O.E., Orellana-Paucar, A., Maes, J., Huang, H., Ying, X., De Borggraeve, W., Crawford, A.D.,
Luyten, W., Esguerra, C.V., de Witte, P., 2013. Tanshinone IIA Exhibits Anticonvulsant Activity in
Zebrafish and Mouse Seizure Models. ACS chemical neuroscience 4, 1479-1487.
Carpay, J.A., Aldenkamp, A.P., van Donselaar, C.A., 2005. Complaints associated with the use of
antiepileptic drugs: results from a community-based study. Seizure-Eur J Epilep 14, 198-206.
Chauhan, K., Sheth, N., Ranpariya, V., Parmar, S., 2011. Anticonvulsant activity of solasodine isolated
from Solanum sisymbriifolium fruits in rodents. Pharm Biol 49, 194-199.
Colmenares, A.P., Rojas, L.B., Mitaine-Offer, A.C., Pouysegu, L., Quideau, S., Miyamoto, T., Tanaka, C.,
Paululat, T., Usubillaga, A., Lacaille-Dubois, M.A., 2013. Steroidal saponins from the fruits of Solanum
torvum. Phytochemistry 86, 137-143.
Eugster, P.J., Guillarme, D., Rudaz, S., Veuthey, J.L., Carrupt, P.A., Wolfender, J.L., 2011. Ultra high
pressure liquid chromatography for crude plant extract profiling. J AOAC Int 94, 51-70.
Galanopoulou, A.S., Kokaia, M., Loeb, J.A., Nehlig, A., Pitkanen, A., Rogawski, M.A., Staley, K.J.,
Whittemore, V.H., Dudek, F.E., 2013. Epilepsy therapy development: Technical and methodologic issues
in studies with animal models. Epilepsia 54, 13-23.
Kesselmeier, J., Budzikiewicz, H., 1979. Identification of saponins as structural building units in isolated
prolamellar bodies from etioplasts of Avena sativa L. Z Pflanzenphysiol 91, 333-344.
Lee, C.L., Hwang, T.L., He, W.J., Tsai, Y.H., Yen, C.T., Yen, H.F., Chen, C.J., Chang, W.Y., Wu, Y.C., 2013.
Anti-neutrophilic inflammatory steroidal glycosides from Solanum torvum. Phytochemistry 95, 315-321.
Lu, Y.Y., Luo, J.G., Huang, X.F., Kong, L.Y., 2009. Four new steroidal glycosides from Solanum torvum and
their cytotoxic activities. Steroids 74, 95-101.
Moshi, M.J., Kagashe, G.A., Mbwambo, Z.H., 2005. Plants used to treat epilepsy by Tanzanian traditional
healers. J Ethnopharmacol 97, 327-336.
Nafady, A.M., El-Shanawany, M.A., Mohamed, M.F., Hassanean, H.A.H., Zhu, X.H., Yoshihara, T., Okawa,
M., Ikeda, T., Nohara, T., 2003. Peculiar side-chain fission of steroidal glycosides. Tetrahedron Lett 44,
3509-3511.

28
Orellana-Paucar, A.M., Serruys, A.S., Afrikanova, T., Maes, J., De Borggraeve, W., Alen, J., Leon-Tamariz,
F., Wilches-Arizabala, I.M., Crawford, A.D., de Witte, P.A., Esguerra, C.V., 2012. Anticonvulsant activity of
bisabolene sesquiterpenoids of Curcuma longa in zebrafish and mouse seizure models. Epilepsy &
behavior : E&B 24, 14-22.
Perucca, E., 1998. Pharmacoresistance in epilepsy - How should it be defined? Cns Drugs 10, 171-179.
Quisumbing, E., 1951. Medicinal plants of the Philippines. Bureau of Printing,, Manila.
Schmidt, D., 2009. Drug treatment of epilepsy: options and limitations. Epilepsy & behavior : E&B 15, 56-
65.
Schmidt, D., Rogawski, M.A., 2002. New strategies for the identification of drugs to prevent the
development or progression of epilepsy. Epilepsy Res 50, 71-78.
Shu, W., Wu, C., Zhang, Y., Ye, W.C., Zhou, G., 2013. Two new steroidal glycosides isolated from the
aerial part of Solanum torvum Swartz. Nat Prod Res 27, 1982-1986.
Thurman, D.J., Beghi, E., Begley, C.E., Berg, A.T., Buchhalter, J.R., Ding, D., Hesdorffer, D.C., Hauser,
W.A., Kazis, L., Kobau, R., Kroner, B., Labiner, D., Liow, K., Logroscino, G., Medina, M.T., Newton, C.R.,
Parko, K., Paschal, A., Preux, P.M., Sander, J.W., Selassie, A., Theodore, W., Tomson, T., Wiebe, S.,
Epidemiology, I.C.o., 2011. Standards for epidemiologic studies and surveillance of epilepsy. Epilepsia 52
Suppl 7, 2-26.
Wolfender, J.L., Queiroz, E.F., 2012. New approaches for studying the chemical diversity of natural
resources and the bioactivity of their constituents. Chimia 66, 324-329.
Yu, K., Chen, F., Li, C., 2012. Absorption, Disposition, and Pharmacokinetics of Saponins from Chinese
Medicinal Herbs: What Do We Know and What Do We Need to Know More? Curr Drug Metab 13, 577-
598.
Zhu, Z.Y., Gao, L., Wang, J.K., 2003. Illustrated Handbook for Medicinal Materials from Nature in Yunnan.
Yunnan Science and Technology Press, Kunming.

29
Figure 1. (A-C) PTZ-induced activity curve for a 30-minute tracking period of 7-dpf zebrafish
larvae after 18-hour pre-treatment with different concentrations of (A) S. torvum aqueous extract
(from serial extractions of increasing polarity), (B) S. torvum methanol crude extract, (C) S.
torvum decoction. (D) Total movement after 30-minute tracking period (expressed in %activity)
of A-C, represented in a bar graph. All results were normalized against PTZ controls (set at
100%). Analysis of the activity curves was done by two-way ANOVA, with P values < 0.05 (*),
< 0.01 (**) and < 0.001 (***) indicated per 5-minute time slice. For the bar graph, statistical
analysis was done by one-way ANOVA with Dunnett’s Test to assess the samples vs. PTZ-only
controls, with P values < 0.05 (*), < 0.01 (**) and < 0.001 (***).
Figure 2. UHPLC-TOF-MS analysis of the methanolic and water extracts of S. torvum.
Figure 3. A) HPLC-microfractionation of the methanolic extract of S. torvum. B) Active zone
contain antiepileptic compounds. C) MS spectra of the main compounds present in the active
zone.
Figure 4. Isolated compounds from the methanolic extract of S. torvum, the common aglycone
obtained by acid hydrolysis of the extract, and the structure of the ganaxolone.
Figure 5. PTZ-induced activity curve for a 30-minute tracking period of 7-dpf zebrafish larvae
after 18-hour pre-treatment with different concentrations of compounds 1-6 (number labels on
each graph correspond to compound). Total movement after 30-minute tracking period
(expressed in %activity) represented in a bar graph (7) below. All results were normalized
against PTZ controls (set at 100%). Analysis of the activity curves was done by two-way
ANOVA, with P values < 0.05 (*), < 0.01 (**) and < 0.001 (***) indicated per time period. For
the bar graph, statistical analysis was done by one-way ANOVA with Dunnett’s Test to assess
the samples vs. PTZ-only controls, with P values < 0.05 (*), < 0.01 (**) and < 0.001 (***).

30
Figure 6. PTZ-induced activity curve for a 30-minute tracking period of 7-dpf zebrafish larvae
after 18-hour pre-treatment with different concentrations of (A) compound 7 (solanolide), and
(B) 8 (ganaxolone). All results were normalized against PTZ controls (set at 100%). Analysis
was done by two-way ANOVA, with P values < 0.05 (*), < 0.01 (**) and < 0.001 (***)
indicated per time period.
Figure 7. (A) Representative current traces generated in response to 1mM GABA or 10µM of
indicated compounds applied for 15 seconds on Xenopus laevis oocytes expressing α1β2γ2s
receptors. (B) Responses to application of indicated compounds normalized to 1mM GABA
applied at the beginning of each recording; n= 4-6. (C) Responses to compounds applied together
with 10µM GABA in 10µM or 100µM concentrations and normalized to the response to 10µM
GABA applied at the beginning of each recording. Washing time between applications was 5
min; n=4

31
Figure 1
0
50
100
150PTZ
50 µg/ml
100 µg/ml
200 µg/ml
0-5 5-10 10-15 15-20 20-25 25-30
** ******
*** **
+ PTZ
time elapsed (min)
%P
TZ
-in
du
ce
d a
cti
vit
y
0
50
100
150PTZ
50 µg/ml
100 µg/ml
200 µg/ml
0-5 5-10 10-15 15-20 20-25 25-30
**** **
***
+ PTZ
time elapsed (min)
%P
TZ
-in
du
ce
d a
cti
vit
y
0
50
100
150PTZ
50 µg/ml
100 µg/ml
200 µg/ml
*** * *
0-5 5-10 10-15 15-20 20-25 25-30
+ PTZ
time elapsed (min)
%P
TZ
-in
du
ced
acti
vit
y
50
µg
/ml
10
0 µ
g/m
l
20
0 µ
g/m
l0
20
40
60
80
100aqueous
MeOH
decoction
** **
***
***
**
*
%a
cti
vit
y
A
B
C
D
32
Figure 2
Time10.00 20.000.00
Compounds of interest
Compounds of interest741 & 727 [M+H]+
MeOH extract of S. torvum
Water infusion of S. torvum
1
3
2
4
65

33
Figure 3
VH
CP
TZ
F1
F1
+P
TZ
F2
F2
+P
TZ
F3
F3
+P
TZ
F4
F4
+P
TZ
F5
F5
+P
TZ
F6
F6
+P
TZ
F7
F7
+P
TZ
F8
F8
+P
TZ
F9
F9
+P
TZ W
W+
PT
Z
0
50
100
150
%P
TZ
-in
du
ce
d a
cti
vit
y
Figure 4
0
20
40
60
80
100
120
140
160
0 10 20 30 40 50 60 70 90 100
Time (min)
F1 F2 F3 F4 F5 F6 F8
UV 254 nm
%
0
100 741.46
742.46
743.46
m/z%
0
100 771.44
772.44
773.45
F7 F9
A
B

34

35
Figure 5
0
50
100
150PTZ
35 µM
70 µM
140 µM
*** *** **
*
0-5 5-10 10-15 15-20 20-25 25-30
+ PTZ
time elapsed (min)
%P
TZ
-in
du
ce
d a
cti
vit
y
0
50
100
150PTZ
70 µM
140 µM
280 µM
0-5 5-10 10-15 15-20 20-25 25-30
+ PTZ
time elapsed (min)
%P
TZ
-in
du
ce
d a
cti
vit
y
0
50
100
150PTZ
70 µM
140 µM
280 µM
0-5 5-10 10-15 15-20 20-25 25-30
*
+ PTZ
time elapsed (min)
%P
TZ
-in
du
ce
d a
cti
vit
y
0
50
100
150PTZ
70 µM
140 µM
280 µM
0-5 5-10 10-15 15-20 20-25 25-30
+ PTZ
time elapsed (min)
%P
TZ
-in
du
ce
d a
cti
vit
y
0
50
100
150PTZ
70 µM
140 µM
280 µM
*
0-5 5-10 10-15 15-20 20-25 25-30
+ PTZ
time elapsed (min)
%P
TZ
-in
du
ce
d a
cti
vit
y
0
50
100
150PTZ
70 µM
140 µM
280 µM
0-5 5-10 10-15 15-20 20-25 25-30
+ PTZ
time elapsed (min)
%P
TZ
-in
du
ce
d a
cti
vit
y
1 2
3 4
5 6
torv
osid
e J
torv
osid
e L
torv
osid
e K
pan
icu
lon
in B
F80
pan
icu
lon
in A
0
50
100
15070 µM
140 µM
280 µM
* ***
%acti
vit
y
*
7

36
Figure 6
0
50
100
150PTZ
70 µM
140 µM
* ****** ***
*** ***
0-5 5-10 10-15 15-20 20-25 25-30
+ PTZ
time elapsed (min)
%P
TZ
-in
du
ce
d a
cti
vit
y
0
50
100
150PTZ
0.3 nM
3 nM
30 nM
*****
* *
0-5 5-10 10-15 15-20 20-25 25-30
+ PTZ
time elapsed (min)
%P
TZ
-in
du
ce
d a
cti
vit
y
A B
Figure 7