zbigniew rymarczyk, paweł purgał – the institute of heating and sanitary technology in radom...
TRANSCRIPT
Zbigniew Rymarczyk, Paweł Purgał – The Institute of Heating and Sanitary Technology in Radom
Mieczysław Dzierzgowski – The Warsaw University of Technology
2
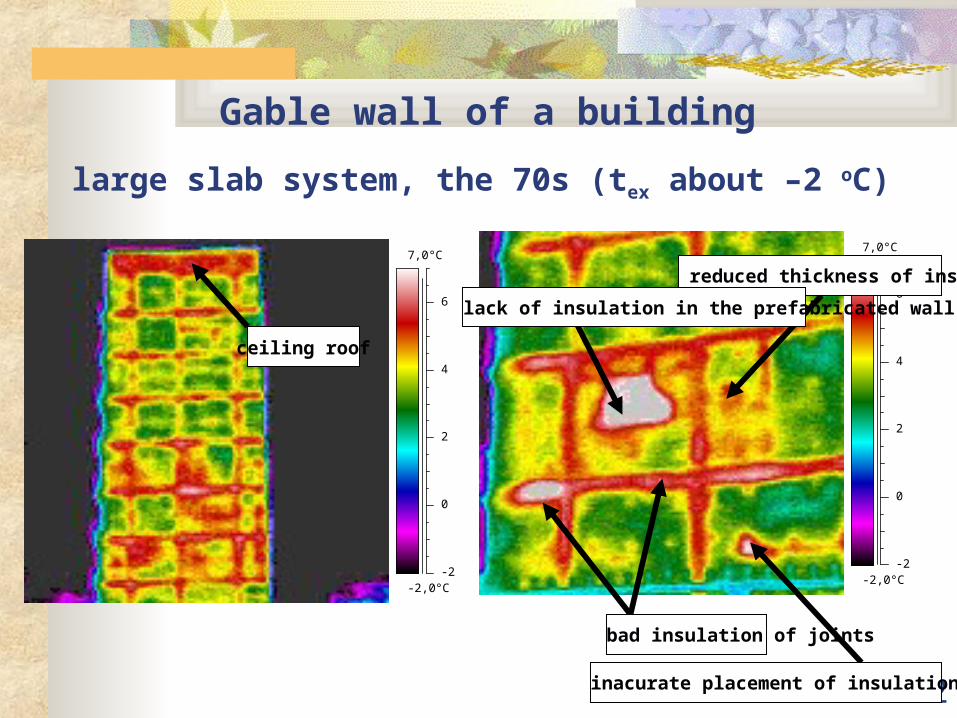
Gable wall of a building
large slab system, the 70s (tex about –2 oC)
-2,0°C
7,0°C
-2
0
2
4
6
-2,0°C
7,0°C
-2
0
2
4
6
bad insulation of joints
reduced thickness of insulation
ceiling roof
lack of insulation in the prefabricated wall
inacurate placement of insulation material
3
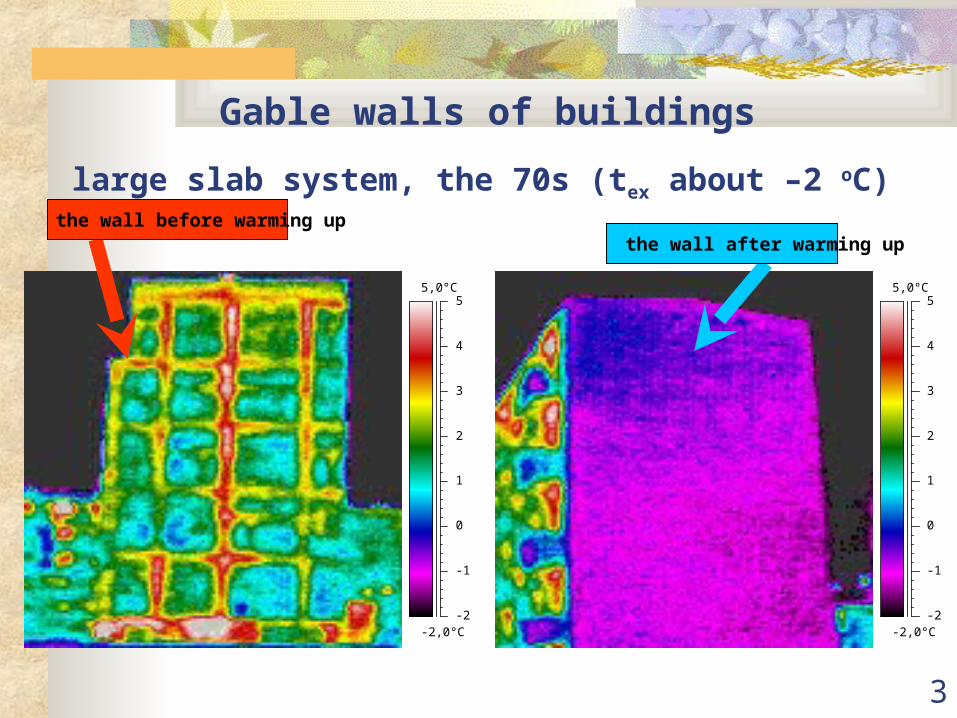
Gable walls of buildings
large slab system, the 70s (tex about –2 oC)
-2,0°C
5,0°C
-2
-1
0
1
2
3
4
5
-2,0°C
5,0°C
-2
-1
0
1
2
3
4
5
the wall before warming up the wall after warming up

4
Test requirements– building envelopes of light construction, the Scandinavian conditions PN-EN 13 187-2001 standard: Thermal characteristics of buildings – Quality detection of heat faults in building walling – Infrared Method
The air temperature outside may change not more then 10 oC in comparison temperature at the beginning of the check for at least 24 hours since the beginning of tests,
The difference in air temperature on both sides of the building should not be smaller than 3/U, where U is a theoretical value of coefficient of heat permeability of building element, this difference cannot be smaller than 5º for at least 24 hrs before the beginning of tests and during it
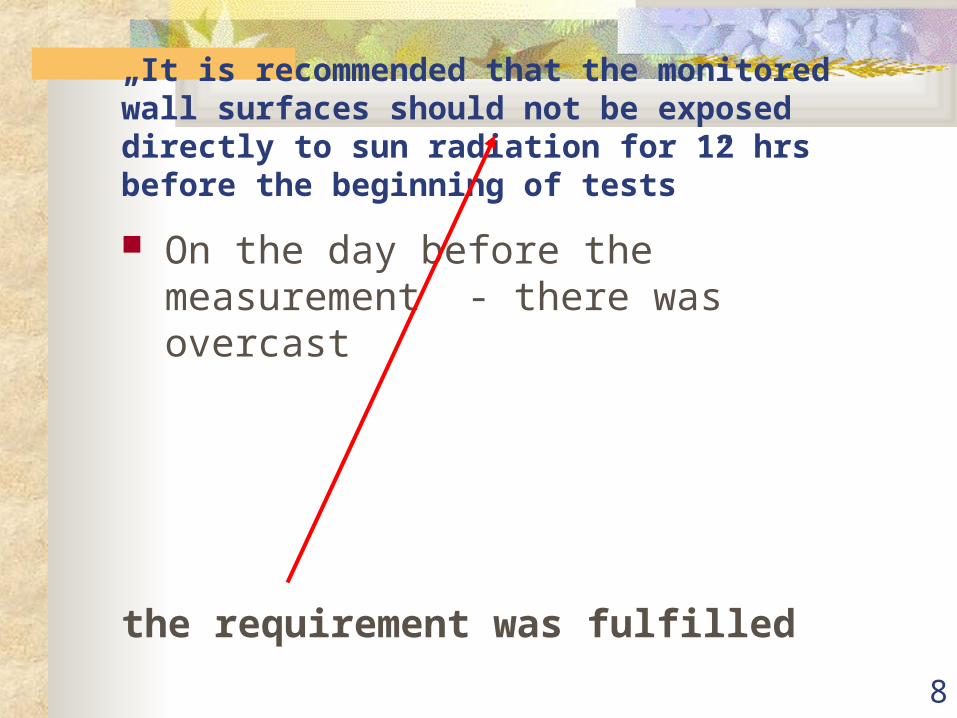
It is recommended that the monitored wall surfaces should not be exposed directly to sun radiation for 12 hrs before the beginning of tests ,
During the check the air temperature outside should not change more than ± 5 º and the temperature inside not more than ± 2º in comparison to appropriate values at the beginning of tests

5
Air temperature inside and outside and difference between these two temperatures
Temperature of the air
-5,00
0,00
5,00
10,00
15,00
20,00
25,00
30,00
35,00
14:1
022
:55
0:10
1:25
2:40
3:55
5:10
6:25
7:40
8:55
10:1
011
:25
12:4
013
:55
15:1
016
:25
17:4
018
:55
20:1
021
:25
time
tem
pe
ratu
re [o
C]
tin oC
tex oC
Dt

6
„the air temperature outside may change not more than ± 10º in comparison to the temperature at the beginning of
the check for at least 24 hours since the beginning of tests”
The minimum temperature of the air outside in the period before the measurements was 1.8º C
The maximum temperature of the air outside in the period before the measurements was 10.8ºC
The temperature at the beginning of the measurements was 2.8ºC
The requirement was fulfilled

7
„The difference of air temperature on both sides of the building should not be smaller than 3/U, for at least 24 hrs
before the beginning of tests and during it”
The designed value of the coefficient of heat permeability = 0.55 W/m²K,
The difference between the air temperature inside and outside changed from 20.0ºC to 30.5ºC
The difference at the beginning of the test 27,4 oC
The requirement was fulfilled
8
„It is recommended that the monitored wall surfaces should not be exposed directly to sun radiation for 12 hrs before the beginning of tests ”
On the day before the measurement - there was overcast
the requirement was fulfilled
9
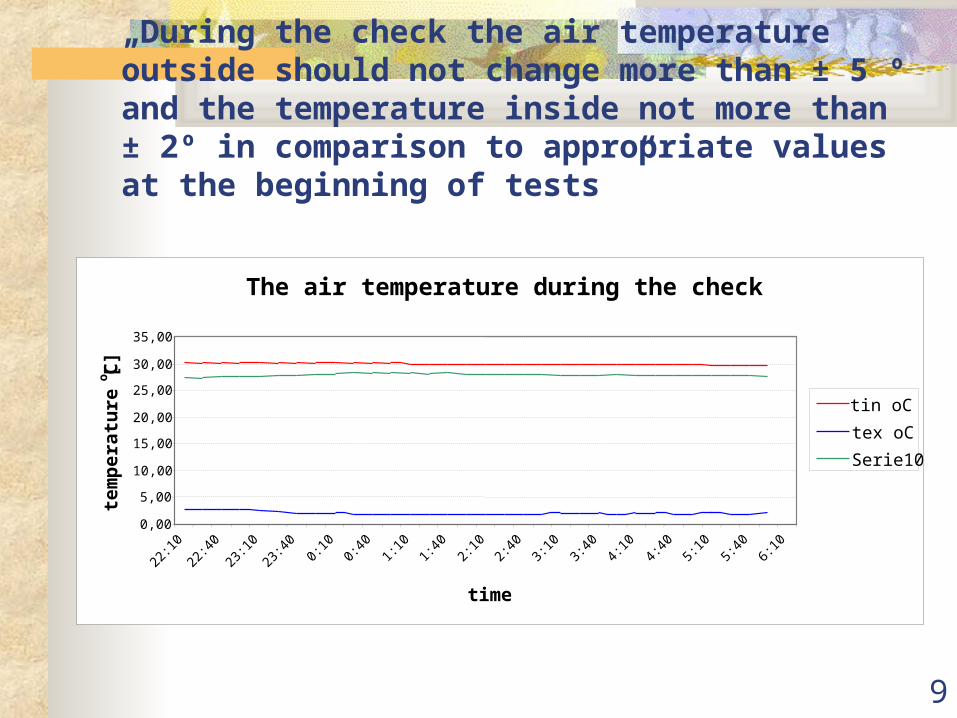
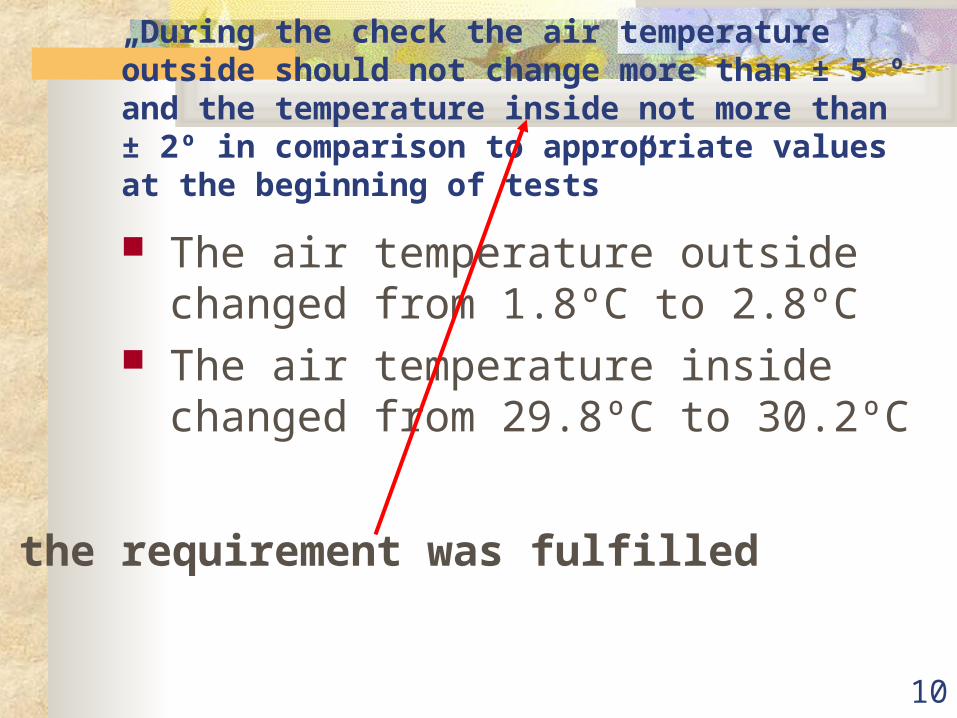
„During the check the air temperature outside should not change more than ± 5 º and the temperature inside not more than ± 2º in comparison to appropriate values at the beginning of tests ”
The air temperature during the check
0,00
5,00
10,00
15,00
20,00
25,00
30,00
35,00
22:1
022
:40
23:1
023
:40
0:10
0:40
1:10
1:40
2:10
2:40
3:10
3:40
4:10
4:40
5:10
5:40
6:10
time
tem
per
atu
re [o
C]
tin oC
tex oC
Serie10
10
„During the check the air temperature outside should not change more than ± 5 º and the temperature inside not more than ± 2º in comparison to appropriate values at the beginning of tests ”
The air temperature outside changed from 1.8ºC to 2.8ºC
The air temperature inside changed from 29.8ºC to 30.2ºC
the requirement was fulfilled

11
The device enabling the determination of heat resistance
of building envelopes
12
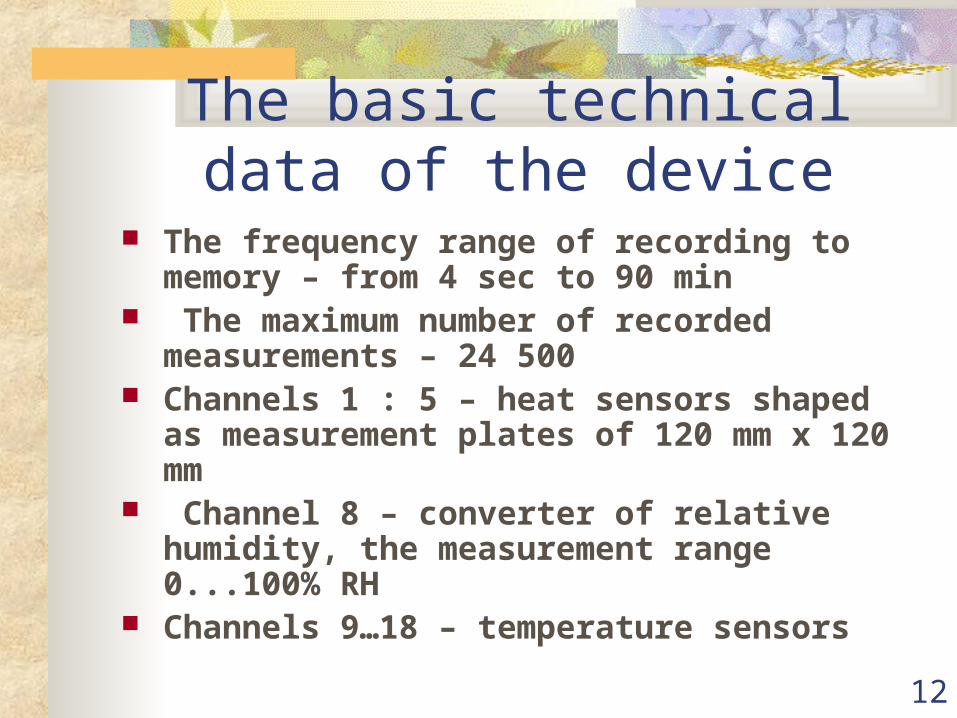
The basic technical data of the device
The frequency range of recording to memory – from 4 sec to 90 min
The maximum number of recorded measurements – 24 500
Channels 1 : 5 – heat sensors shaped as measurement plates of 120 mm x 120 mm
Channel 8 – converter of relative humidity, the measurement range 0...100% RH
Channels 9…18 – temperature sensors
13
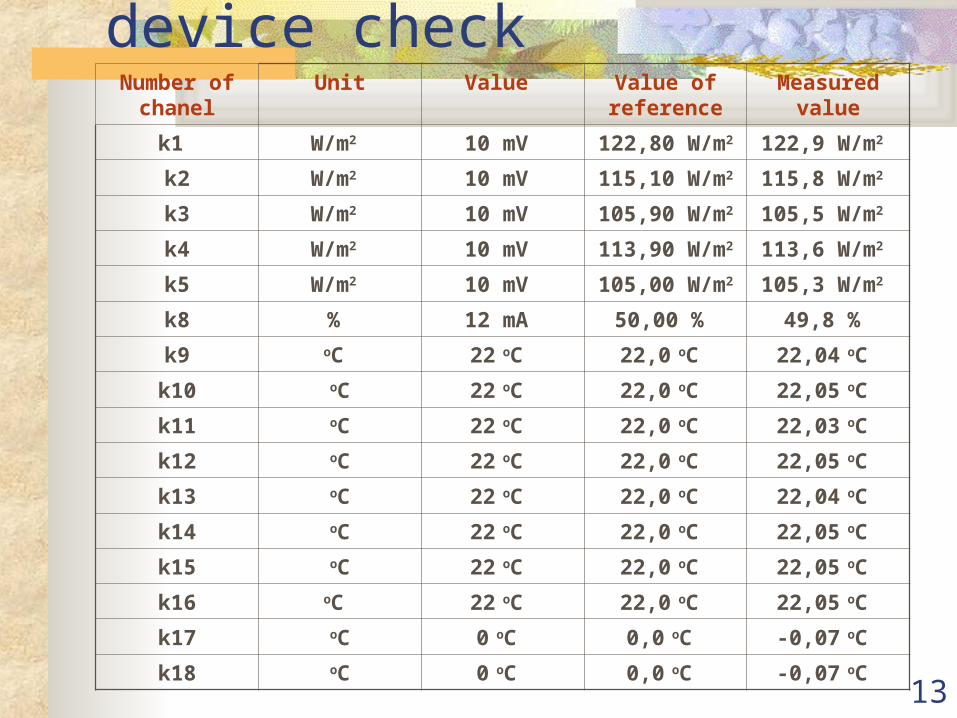
The results of the device checkNumber of
chanelUnit Value Value of
referenceMeasured
value
k1 W/m2 10 mV 122,80 W/m2 122,9 W/m2
k2 W/m2 10 mV 115,10 W/m2 115,8 W/m2
k3 W/m2 10 mV 105,90 W/m2 105,5 W/m2
k4 W/m2 10 mV 113,90 W/m2 113,6 W/m2
k5 W/m2 10 mV 105,00 W/m2 105,3 W/m2
k8 % 12 mA 50,00 % 49,8 %
k9 oC 22 oC 22,0 oC 22,04 oC
k10 oC 22 oC 22,0 oC 22,05 oC
k11 oC 22 oC 22,0 oC 22,03 oC
k12 oC 22 oC 22,0 oC 22,05 oC
k13 oC 22 oC 22,0 oC 22,04 oC
k14 oC 22 oC 22,0 oC 22,05 oC
k15 oC 22 oC 22,0 oC 22,05 oC
k16 oC 22 oC 22,0 oC 22,05 oC
k17 oC 0 oC 0,0 oC -0,07 oC
k18 oC 0 oC 0,0 oC -0,07 oC

14
A photo and thermograms of a part of the wall with fitted sensors monitoring the heat flux density and the temperature on the inside
U3
U1 U4 U5
24,0°C
30,0°C
24
25
26
27
28
29
30

15
A photo and thermogram a part of the wall on the outside
7,5°C
16,2°C
8
10
12
14
16

16
The changes of the heat flux density during the measurement
Changes heat flux density
0
5
10
15
20
25
30
35
40
45
50
22:1
022
:40
23:1
023
:40
0:10
0:40
1:10
1:40
2:10
2:40
3:10
3:40
4:10
4:40
5:10
Time
Hea
t fl
ux
den
sity
[W
/m2]
q1
q3
q4
q5
17
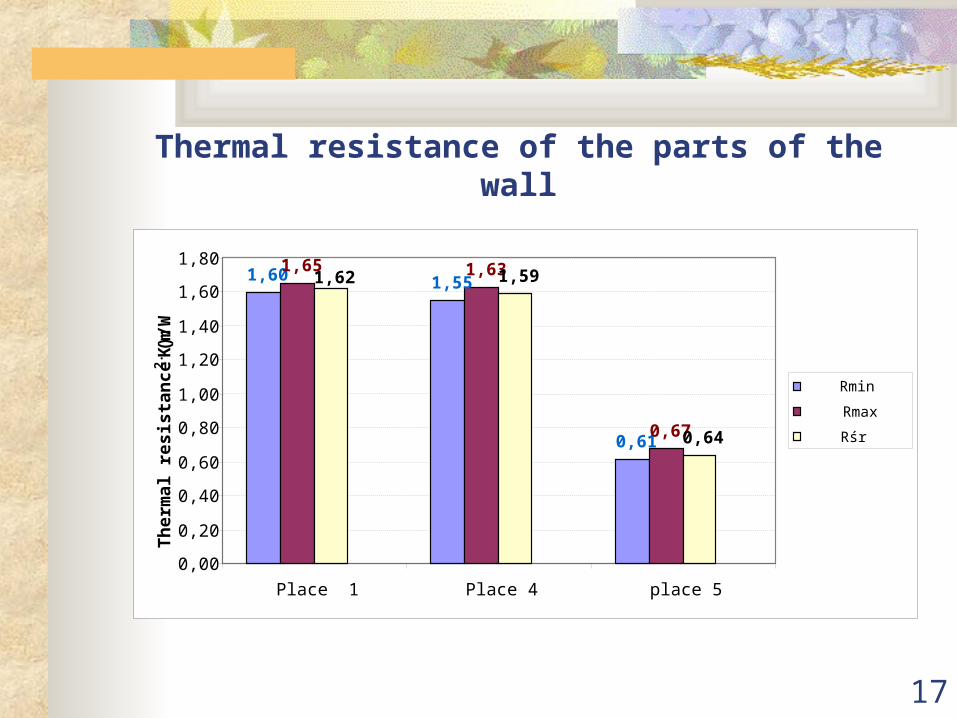
Thermal resistance of the parts of the wall
1,60 1,55
0,61
1,65 1,63
0,67
1,59
0,64
1,62
0,00
0,20
0,40
0,60
0,80
1,00
1,20
1,40
1,60
1,80
Place 1 Place 4 place 5
Th
erm
al r
esis
tan
ce (
m2. K
)/W
Rmin
Rmax
Rśr
18
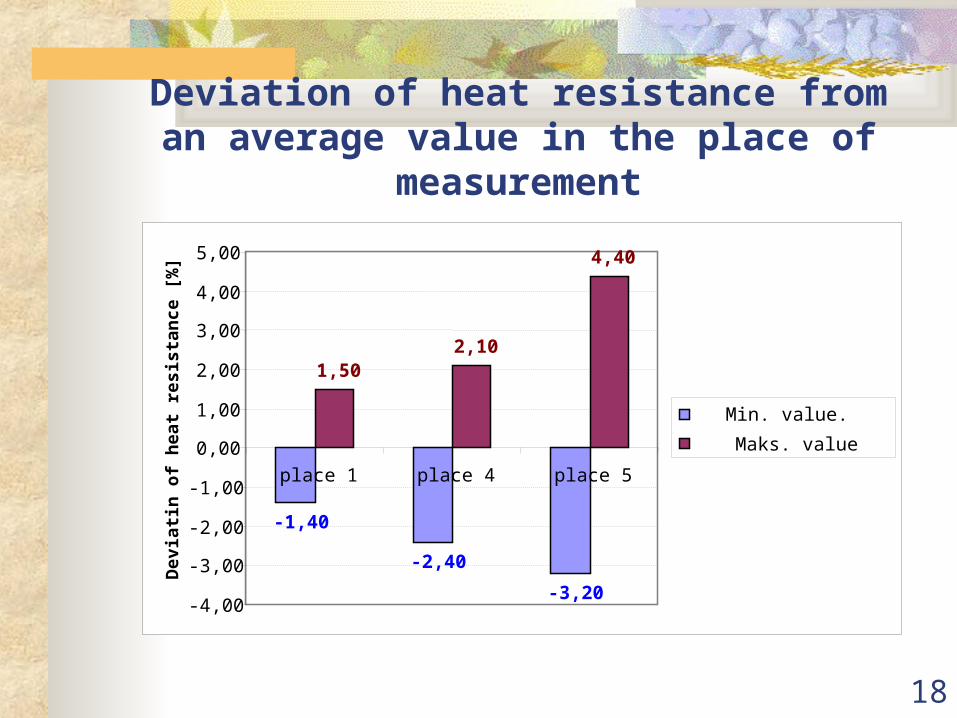
Deviation of heat resistance from an average value in the place of measurement
-1,40
-2,40
-3,20
1,502,10
4,40
-4,00
-3,00
-2,00
-1,00
0,00
1,00
2,00
3,00
4,00
5,00
place 1 place 4 place 5
Dev
iati
n o
f h
eat
resi
stan
ce [
%]
Min. value.
Maks. value
19
Final remarks as regards the assessment of thermal insulation:
The research into thermal insulation of an object have practical significance for new erected and older buildings thermally modernized
It is recommended to combine classical measurement methods of the heat flux density and temperature with the thermography

20
Is it worth measuring the thermal resistance of building envelopes in real conditions? In the view of the C1152
standard: ”Determining heat resistance of building partitions on the basis of measurements conducted in situ” the answer
is positive:
For newly erected buildings — „the knowledge of thermal resistance of new buildings is important to determine whether the quality of constructin satisfies criteria set by the designer, by the owner, or by regulatory agency. Differences in quality of materials or workmanship may cause building components not to achieve design performance”

21
Is it worth measuring the thermal resistance of building envelopes in real conditions? In the view of the C1152
standard: ”Determining heat resistance of building partitions on the basis of measurements conducted in situ” the answer
is positive:
For the existing buildings – „knowledge of thermal resistance is important to the owners of older buildings to determine wheter the buildings should receive insulation or other energy – conserving improvements. Inadequate knowledge of the thermal properties of materials or heat flow paths within the construction or degradation of materials may cause inaccurate assumptions in calculations that use published date”

22
The use of thermography in the diagnosis of the central heating
installation
Determining the flow of water mass Other applications (pollution, the air
infection, hydraulic maladjustment, leak of heating element from the installation)
23
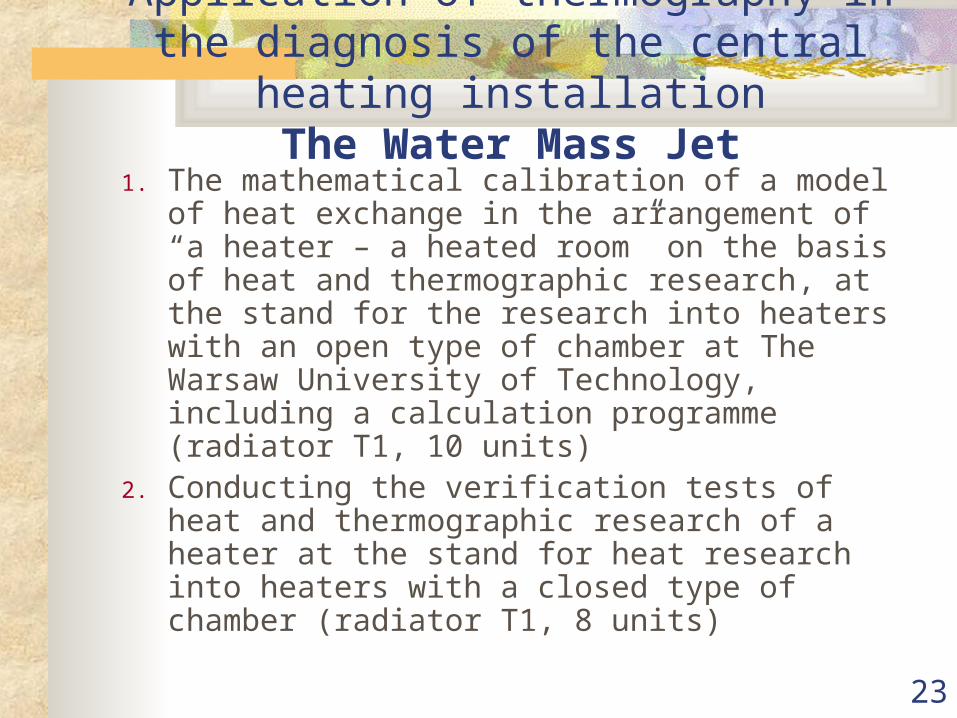
Application of thermography in the diagnosis of the central heating installation
The Water Mass Jet1. The mathematical calibration of a model of heat
exchange in the arrangement of “a heater – a heated room” on the basis of heat and thermographic research, at the stand for the research into heaters with an open type of chamber at The Warsaw University of Technology, including a calculation programme (radiator T1, 10 units)
2. Conducting the verification tests of heat and thermographic research of a heater at the stand for heat research into heaters with a closed type of chamber (radiator T1, 8 units)
24
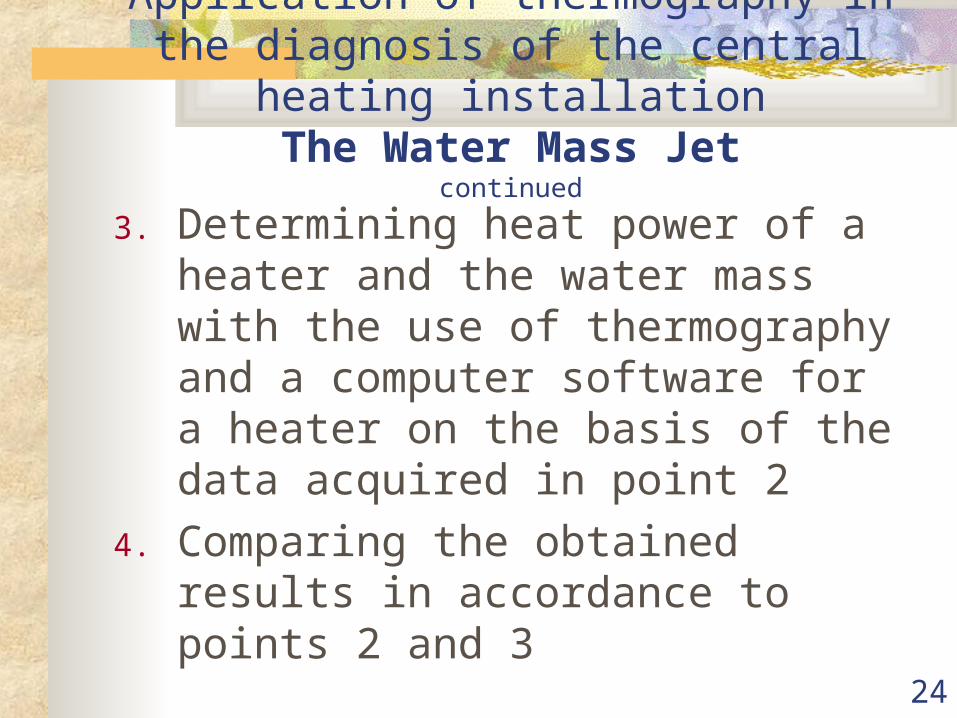
3. Determining heat power of a heater and the water mass with the use of thermography and a computer software for a heater on the basis of the data acquired in point 2
4. Comparing the obtained results in accordance to points 2 and 3
Application of thermography in the diagnosis of the central heating installation
The Water Mass Jetcontinued

25
T-1 Heater – a photograph and construction

26
Technical data of T-1 heaterTotal height in mm 588
Fitting height between axis joints in mm
500
Width of a heater unit in mm 79,7
Building depth in mm 140
Outside surface area of 1 unit in m²
0,24
Water capacity of one cell in dm³ 1,18
Nominal mass of one cell in kilos 5,70
Number of units in the examined heater
8
27
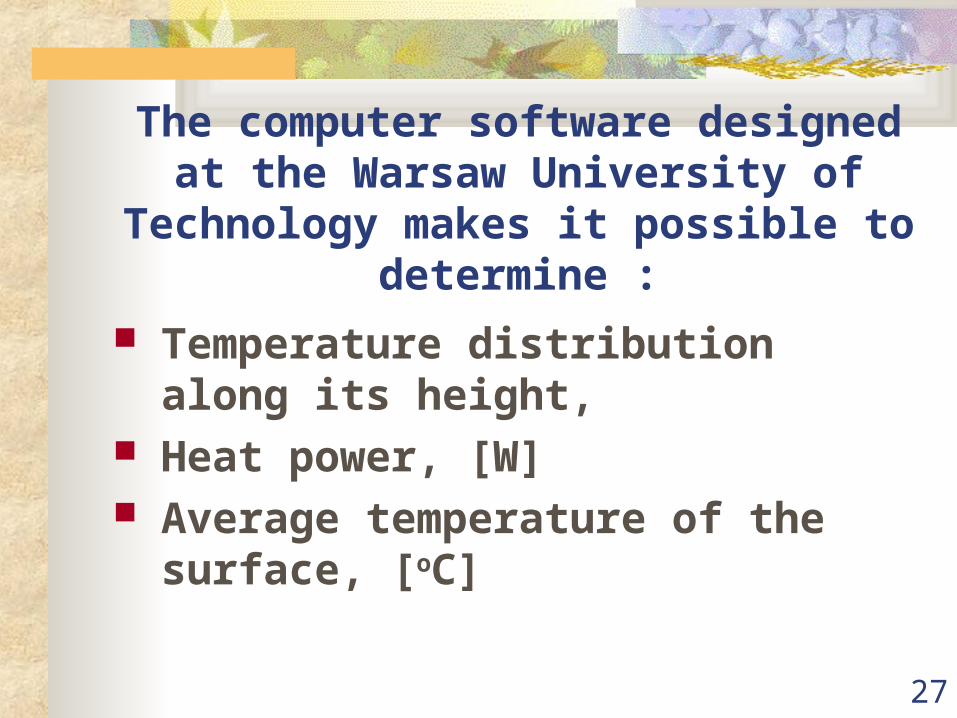
The computer software designed at the Warsaw University of Technology makes it
possible to determine :
Temperature distribution along its height,
Heat power, [W] Average temperature of the surface, [oC]

28
Temperature of supply, return, air and mass jet in the function of time for a T1
heater in a chamber of an open type
0,0
10,0
20,0
30,0
40,0
50,0
60,0
70,0
80,0
90,0
00:00
:00
00:20
:00
00:40
:00
01:00
:00
01:20
:00
01:40
:00
02:00
:00
02:20
:00
02:40
:00
03:00
:00
03:20
:00
03:40
:00
04:00
:00
04:20
:00
04:40
:00
05:00
:00
05:20
:00
05:40
:00
06:00
:00
06:20
:00
06:40
:00
07:00
:00
07:20
:00
07:40
:00
08:00
:00
Time [h]
t[oC
]
0,000
0,005
0,010
0,015
0,020
0,025
0,030
0,035
M [
kg/
s]
t1
t2
ti
M
29
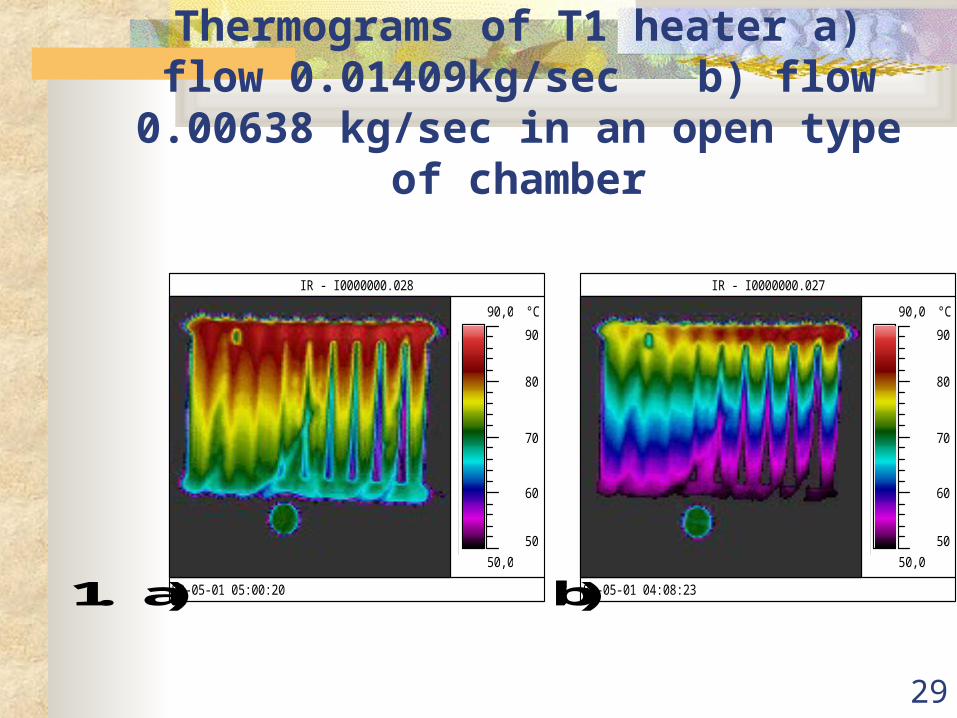
Thermograms of T1 heater a) flow 0.01409kg/sec b) flow 0.00638 kg/sec in an
open type of chamber
1. a)
IR - I0000000.028
89-05-01 05:00:20
50,0
90,0 °C
50
60
70
80
90
b)
IR - I0000000.027
89-05-01 04:08:23
50,0
90,0 °C
50
60
70
80
90
30
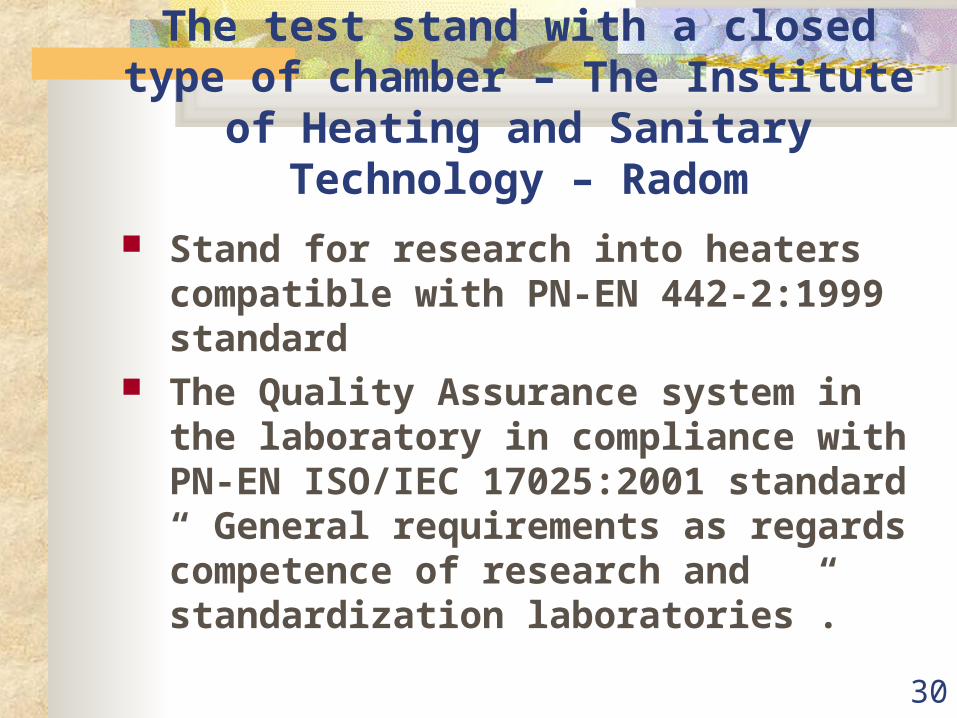
The test stand with a closed type of chamber – The Institute of Heating and
Sanitary Technology – Radom
Stand for research into heaters compatible with PN-EN 442-2:1999 standard
The Quality Assurance system in the laboratory in compliance with PN-EN ISO/IEC 17025:2001 standard “ General requirements as regards competence of research and standardization laboratories”.
31
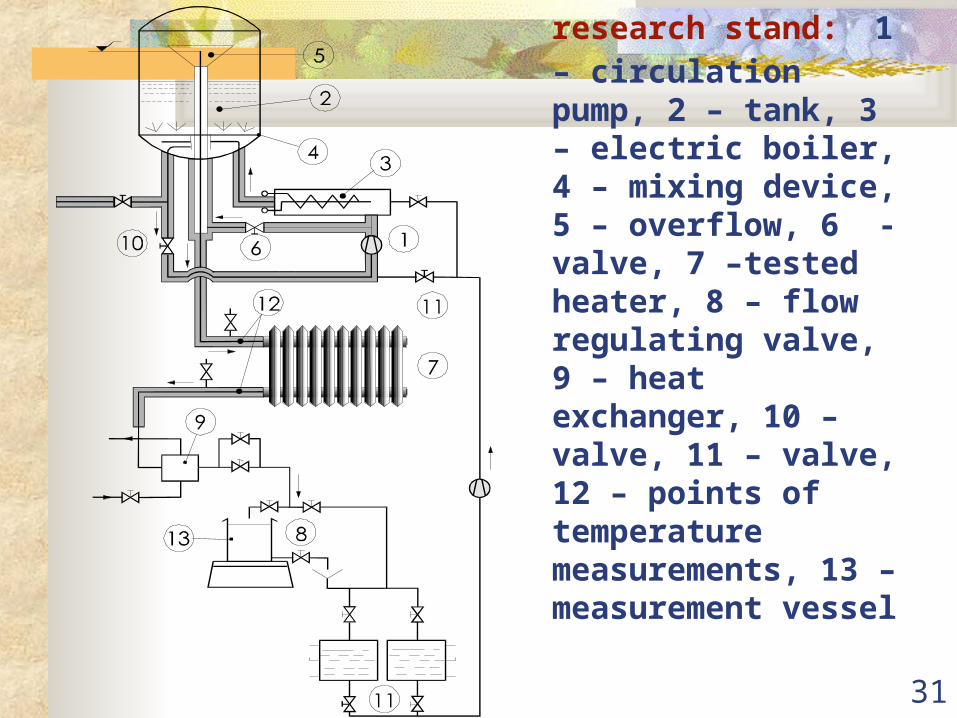
The chart of a research
stand: 1 – circulation pump, 2 – tank, 3 – electric boiler, 4 – mixing device, 5 – overflow, 6 -valve, 7 –tested heater, 8 – flow regulating valve, 9 – heat exchanger, 10 –valve, 11 – valve, 12 – points of temperature measurements, 13 – measurement vessel
32
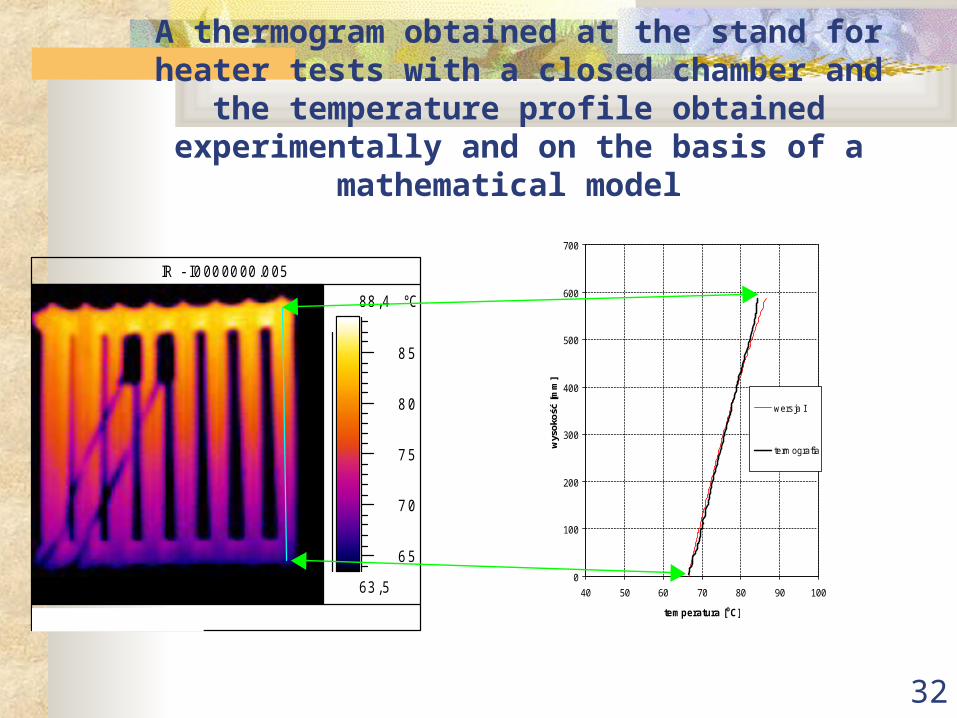
A thermogram obtained at the stand for heater tests with a closed chamber and the temperature profile obtained
experimentally and on the basis of a mathematical model
IR - I0 00 00 00 .0 05
1 90 0-02 -13 1 7:4 5:16
63 ,5
88 ,4 °C
6 5
7 0
7 5
8 0
8 5
0
100
200
300
400
500
600
700
40 50 60 70 80 90 100
temperatura [oC]
wys
oko
ść [
mm
]
wers ja I
termografia
33
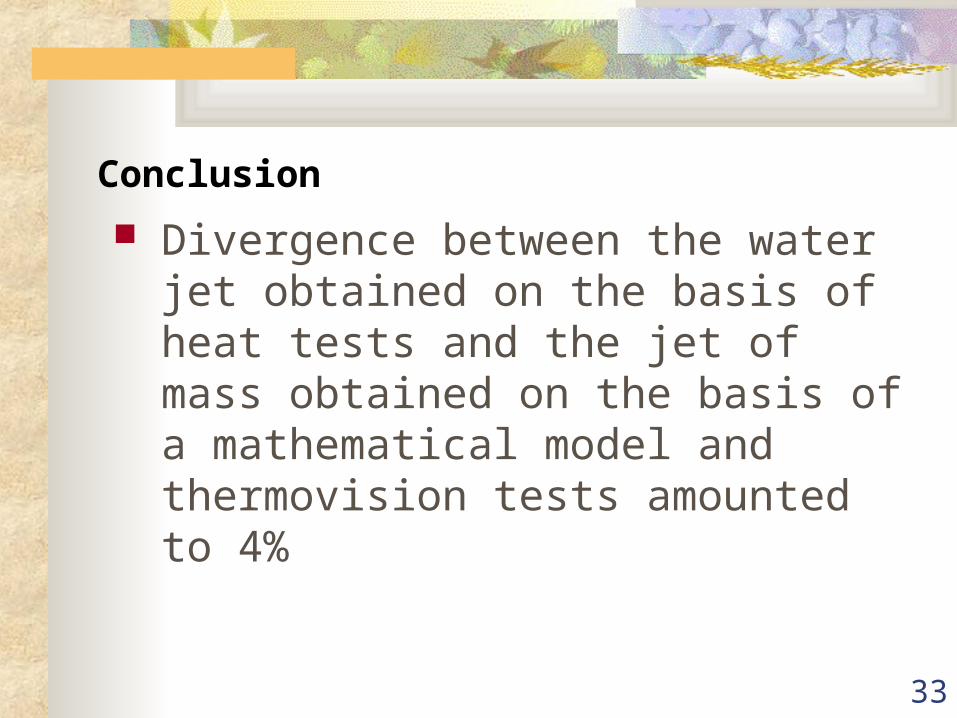
Conclusion
Divergence between the water jet obtained on the basis of heat tests and the jet of mass obtained on the basis of a mathematical model and thermovision tests amounted to 4%

34
Heating – the water mass jet – real conditions
0,00485 kg/s – beafore cleaning 0,0435kg/s – after cleaning
1
2
3
4
IR - I0000000.004
97-02-05 20:57:48
20,0
50,0 °C
20
25
30
35
40
45
50
1
2
3
4
IR - I0000000.054
97-01-09 22:18:02
20,0
50,0 °C
20
25
30
35
40
45
50

35
35,0°C
55,0°C
36
38
40
42
44
46
48
50
52
54
35,0°C
55,0°C
36
38
40
42
44
46
48
50
52
54
SP01SP02
51,6 oC 40,9 oC
Heating – diagnostic of the central heating components - pollution

36
Heating – temperature distribution on the heater surface in the conditions of air infection of the central heating
installation
IR - I0 0 0 0 0 0 0 .0 2 6
2 4 -0 1 -9 7 1 5 :4 2 :2 1
4 0 , 0
9 0 , 0 ° C
4 0
5 0
6 0
7 0
8 0
9 0
IR - I0 0 0 0 0 0 0 .0 2 4
2 4 -0 1 -9 7 1 4 :2 8 :1 9
4 0 , 0
9 0 , 0 ° C
4 0
5 0
6 0
7 0
8 0
9 0
Heater with air infectonHeater after the process of
air removal

37
IR - I0000000.004
08-01-97 14:28:23
30,0
60,0 °C
30
35
40
45
50
55
60
30
35
40
45
50
55
60
0,0 0,2 0,4 0,6 0,8 1,0 1,2 1,4
długość grzejnika [m]
tem
pera
tura
[oC
]
IR - I0 0 0 0 0 0 0 .0 0 2
0 8 -0 1 -9 7 1 4 :2 4 :1 4
3 0 , 0
6 0 , 0 ° C
3 0
3 5
4 0
4 5
5 0
5 5
6 0
30
35
40
45
50
55
60
0,0 0,2 0,4 0,6 0,8 1,0
długość grzejnika [m]
tem
pera
tura
[oC
]
Heating – the distribution of temperature occurs in the
case of hydraulic deregulation

38
Heating- the central heating lines cause local increase in the surface temperature of the floor
IR - I0000000.013
97-01-08 15:26:23
23,0
33,0 °C
24
26
28
30
32
23,0
24,0
25,0
26,0
27,0
28,0
29,0
30,0
31,0
32,0
0 10 20 30 40 50 60 70
odległość [cm]
tem
per
atu
ra [
oC
]

39
Heating – leakage of the central heating components
out flow from the central heating installation

40
Final conclusion:
Simultaneously with insulation tests of building envelopes the theromgraphic method may be applied in heating for :
Estimating the water mass jet Preliminary diagnosis of units of the
central heating installation ( air infection, pollution, hydraulic deregulation, detection of installation leakage)