zambia: debt sustainability analysis; imf country … · 1 a debt sustainability analysis update...
TRANSCRIPT
ZAMBIA STAFF REPORT ON THE 2017 ARTICLE IV CONSULTATION—DEBT SUSTAINABILITY ANALYSIS
Risk of external debt distress (current policies): High
Augmented by significant risks stemming from domestic public and/or private external debt? Yes
This full Debt Sustainability Analysis1 (DSA) indicates that Zambia is at high risk of debt distress, which represents a downgrade from the moderate rating of the previous DSA reported in the 2015 Article IV consultation (IMF Country Report No. 15/152). The present value (PV) of the public and publicly guaranteed external debt breaches the 40 percent of GDP threshold; it rises from 37 percent in 2016 to 42.6 percent by 2019 and to a peak of 44.3 percent in 2022. The debt-service-to-revenue ratio temporarily breaches its 20 percent threshold in 2022 and 2024 when Eurobond payments fall due. All indicators breach their respective thresholds in the case of extreme shocks. Overall public sector debt vulnerabilities are also elevated; the fixed primary balance scenario, which keeps the primary deficit-to-GDP ratio unchanged from 2016 (at 2.2 percent), shows the debt ratio rising throughout the forecast period, highlighting the urgent need for fiscal consolidation. Reducing the risk of debt distress requires strong and sustained fiscal consolidation, including measures to increase domestic revenue, strengthen public investment management, and contain fiscal risks (especially contingent liabilities of state-owned enterprises). Adoption and implementation of an appropriate debt management strategy is also critical.
1 A Debt Sustainability Analysis Update was prepared in April 2015 in the context of the last (2015) Article IV consultation (IMF Country Report No. 15/152). Zambia’s three-year average score of the Country Policy and Institutional Assessment (CPIA) for 2014–16 was 3.38, which is within the band for medium performance. Therefore, the current DSA uses the policy-dependent thresholds for medium policy performers.
Approved By Michael Atingi Ego and Bob Traa (IMF) and Paloma Anos-Casero (IDA)
Prepared by the staffs of the International Monetary Fund and the International Development Association
September 25, 2017
ZAMBIA
2 INTERNATIONAL MONETARY FUND
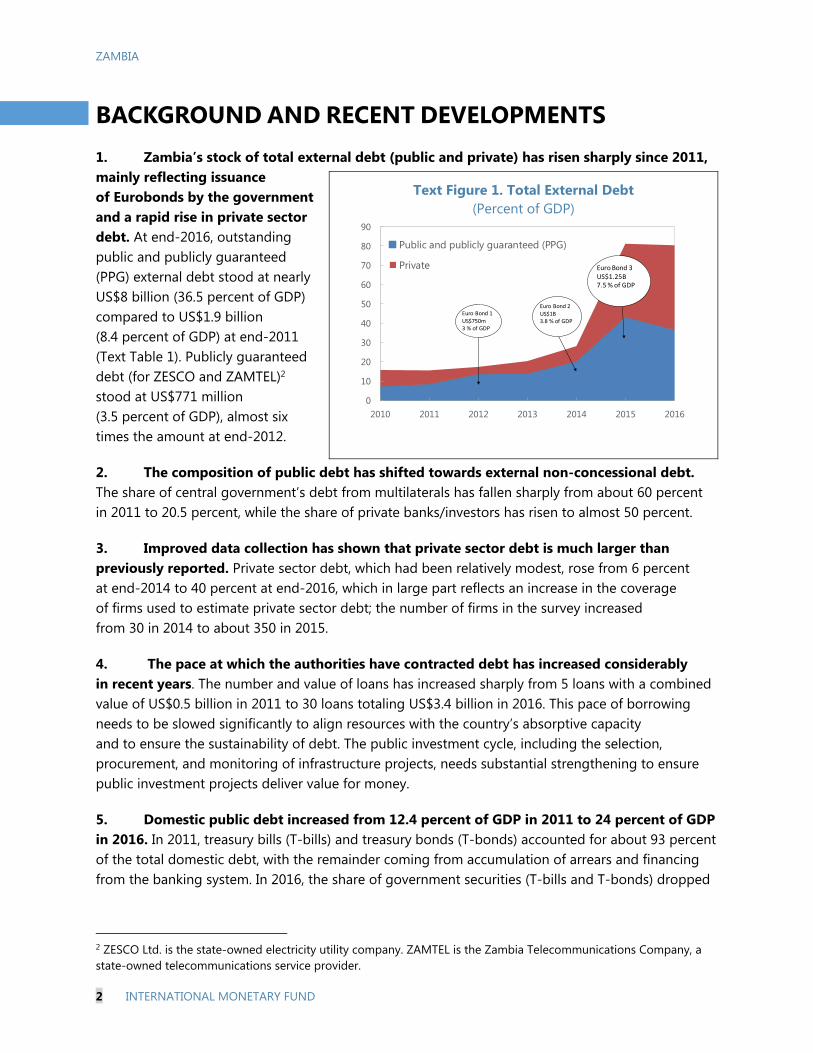
BACKGROUND AND RECENT DEVELOPMENTS 1. Zambia’s stock of total external debt (public and private) has risen sharply since 2011, mainly reflecting issuance of Eurobonds by the government and a rapid rise in private sector debt. At end-2016, outstanding public and publicly guaranteed (PPG) external debt stood at nearly US$8 billion (36.5 percent of GDP) compared to US$1.9 billion (8.4 percent of GDP) at end-2011 (Text Table 1). Publicly guaranteed debt (for ZESCO and ZAMTEL)2 stood at US$771 million (3.5 percent of GDP), almost six times the amount at end-2012.
2. The composition of public debt has shifted towards external non-concessional debt. The share of central government’s debt from multilaterals has fallen sharply from about 60 percent in 2011 to 20.5 percent, while the share of private banks/investors has risen to almost 50 percent.
3. Improved data collection has shown that private sector debt is much larger than previously reported. Private sector debt, which had been relatively modest, rose from 6 percent at end-2014 to 40 percent at end-2016, which in large part reflects an increase in the coverage of firms used to estimate private sector debt; the number of firms in the survey increased from 30 in 2014 to about 350 in 2015.
4. The pace at which the authorities have contracted debt has increased considerably in recent years. The number and value of loans has increased sharply from 5 loans with a combined value of US$0.5 billion in 2011 to 30 loans totaling US$3.4 billion in 2016. This pace of borrowing needs to be slowed significantly to align resources with the country’s absorptive capacity and to ensure the sustainability of debt. The public investment cycle, including the selection, procurement, and monitoring of infrastructure projects, needs substantial strengthening to ensure public investment projects deliver value for money.
5. Domestic public debt increased from 12.4 percent of GDP in 2011 to 24 percent of GDP in 2016. In 2011, treasury bills (T-bills) and treasury bonds (T-bonds) accounted for about 93 percent of the total domestic debt, with the remainder coming from accumulation of arrears and financing from the banking system. In 2016, the share of government securities (T-bills and T-bonds) dropped
2 ZESCO Ltd. is the state-owned electricity utility company. ZAMTEL is the Zambia Telecommunications Company, a state-owned telecommunications service provider.
Text Figure 1. Total External Debt (Percent of GDP)
0
10
20
30
40
50
60
70
80
90
2010 2011 2012 2013 2014 2015 2016
Public and publicly guaranteed (PPG)
Private
Euro Bond 1US$750m3 % of GDP
Euro Bond 2
US$1B3.8 % of GDP
Euro Bond 3US$1.25B7.5 % of GDP
ZAMBIA
INTERNATIONAL MONETARY FUND 3
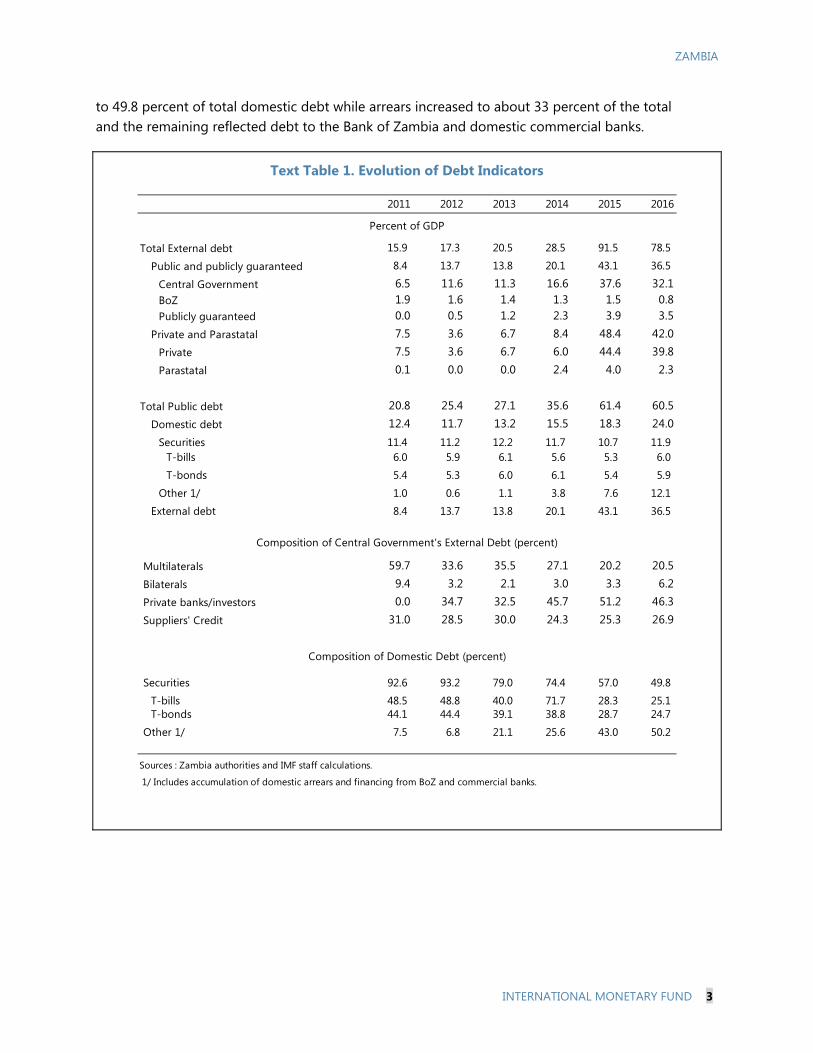
to 49.8 percent of total domestic debt while arrears increased to about 33 percent of the total and the remaining reflected debt to the Bank of Zambia and domestic commercial banks.
Text Table 1. Evolution of Debt Indicators
2011 2012 2013 2014 2015 2016
Total External debt 15.9 17.3 20.5 28.5 91.5 78.5
Public and publicly guaranteed 8.4 13.7 13.8 20.1 43.1 36.5
Central Government 6.5 11.6 11.3 16.6 37.6 32.1BoZ 1.9 1.6 1.4 1.3 1.5 0.8Publicly guaranteed 0.0 0.5 1.2 2.3 3.9 3.5
Private and Parastatal 7.5 3.6 6.7 8.4 48.4 42.0Private 7.5 3.6 6.7 6.0 44.4 39.8Parastatal 0.1 0.0 0.0 2.4 4.0 2.3
Total Public debt 20.8 25.4 27.1 35.6 61.4 60.5Domestic debt 12.4 11.7 13.2 15.5 18.3 24.0
Securities 11.4 11.2 12.2 11.7 10.7 11.9T-bills 6.0 5.9 6.1 5.6 5.3 6.0
T-bonds 5.4 5.3 6.0 6.1 5.4 5.9
Other 1/ 1.0 0.6 1.1 3.8 7.6 12.1
External debt 8.4 13.7 13.8 20.1 43.1 36.5
Multilaterals 59.7 33.6 35.5 27.1 20.2 20.5Bilaterals 9.4 3.2 2.1 3.0 3.3 6.2Private banks/investors 0.0 34.7 32.5 45.7 51.2 46.3Suppliers' Credit 31.0 28.5 30.0 24.3 25.3 26.9
Securities 92.6 93.2 79.0 74.4 57.0 49.8
T-bills 48.5 48.8 40.0 71.7 28.3 25.1T-bonds 44.1 44.4 39.1 38.8 28.7 24.7
Other 1/ 7.5 6.8 21.1 25.6 43.0 50.2
Sources : Zambia authorities and IMF staff calculations.
Percent of GDP
Composition of Central Government's External Debt (percent)
Composition of Domestic Debt (percent)
1/ Includes accumulation of domestic arrears and financing from BoZ and commercial banks.
ZAMBIA
4 INTERNATIONAL MONETARY FUND
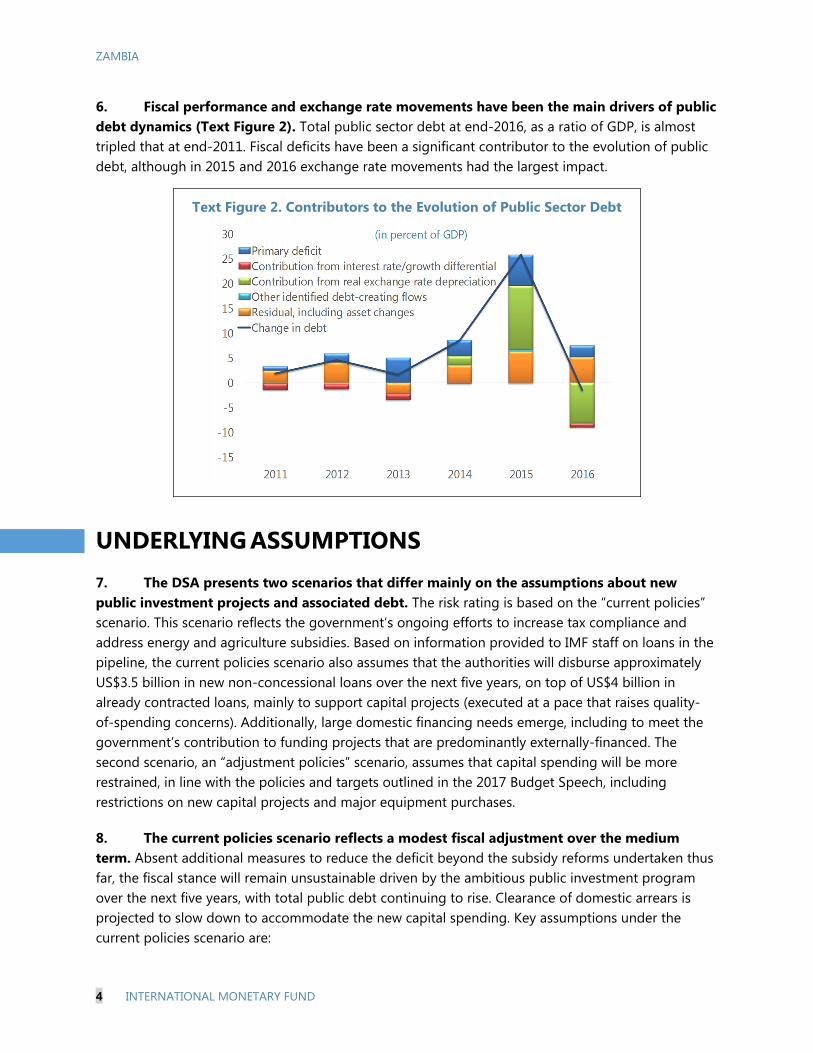
6. Fiscal performance and exchange rate movements have been the main drivers of public debt dynamics (Text Figure 2). Total public sector debt at end-2016, as a ratio of GDP, is almost tripled that at end-2011. Fiscal deficits have been a significant contributor to the evolution of public debt, although in 2015 and 2016 exchange rate movements had the largest impact.
UNDERLYING ASSUMPTIONS
7. The DSA presents two scenarios that differ mainly on the assumptions about new public investment projects and associated debt. The risk rating is based on the “current policies” scenario. This scenario reflects the government’s ongoing efforts to increase tax compliance and address energy and agriculture subsidies. Based on information provided to IMF staff on loans in the pipeline, the current policies scenario also assumes that the authorities will disburse approximately US$3.5 billion in new non-concessional loans over the next five years, on top of US$4 billion in already contracted loans, mainly to support capital projects (executed at a pace that raises quality-of-spending concerns). Additionally, large domestic financing needs emerge, including to meet the government’s contribution to funding projects that are predominantly externally-financed. The second scenario, an “adjustment policies” scenario, assumes that capital spending will be more restrained, in line with the policies and targets outlined in the 2017 Budget Speech, including restrictions on new capital projects and major equipment purchases.
8. The current policies scenario reflects a modest fiscal adjustment over the medium term. Absent additional measures to reduce the deficit beyond the subsidy reforms undertaken thus far, the fiscal stance will remain unsustainable driven by the ambitious public investment program over the next five years, with total public debt continuing to rise. Clearance of domestic arrears is projected to slow down to accommodate the new capital spending. Key assumptions under the current policies scenario are:
Text Figure 2. Contributors to the Evolution of Public Sector Debt
ZAMBIA
INTERNATIONAL MONETARY FUND 5
Economic growth will remain subdued over the medium-term mainly reflecting a crowding out of private sector investment due to the significant reliance on domestic debt to finance the budget deficit, which will affect domestic interest rates and access to credit by the private sector.
The external sector current account will remain in deficit up to 2022, primarily reflecting higher imports related to government’s capital outlays over the next five years. Nonetheless, a pickup in copper exports and less dependence on imported electricity will help to narrow the deficit.
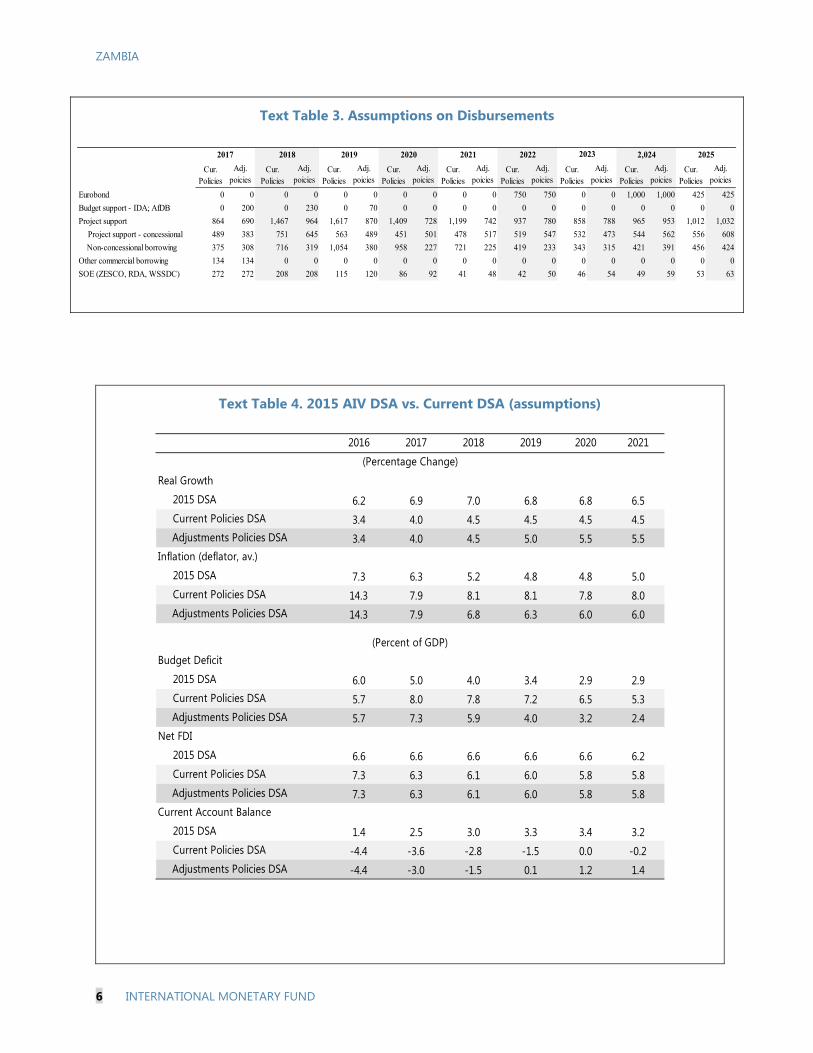
A total of US$7.5 billion in external debt will be disbursed over the next five years. This assumes US$4.2 billion in non-concessional loans and US$3.3 billion concessional. Additionally, it is assumed that the three Eurobonds will be rolled over as they become due starting in 2022, and that there are no new Eurobond issuances prior to this.
The authorities implement the fiscal consolidation measures in line with the 2017 Budget Speech. These include measures to strengthen tax enforcement and compliance, and removing obstacles to the full implementation of measures already approved by parliament, including on land titling, road-user charges, and the introduction new technology to enhance the monitoring of taxpayers’ activity reporting, including in the telecommunication sector. On the expenditure side, it assumes: (i) the streamlining of the Farmer Input Support Program and full migration to the e-voucher system; (ii) keeping Food Reserve Agency (FRA) operations in line with its core mandate (in contrast to a large role in the marketing of maize in some recent years); and (iii) cost-reflective pricing of petroleum products and electricity. However, higher capital expenditure along with higher interest payments will limit the authorities’ consolidation efforts.
9. Under the adjustment policies scenario, the authorities are assumed to implement more moderate public investment program aimed at restoring debt sustainability over the medium term. This scenario assumes that the authorities halt the contracting of new non-concessional external loans except for a US$282 million communications project and debt to rollover the Eurobonds as they mature.
10. Compared to the 2015 DSA, the current policies scenario shows a much lower growth path, largely reflecting lower copper prices and production than was projected in the 2015 exercise. Larger budget deficits are projected over the medium term, given looser fiscal policy in 2015–16 and the larger investment program than assumed at the time of the 2015 DSA. The current account balance has been revised down mainly because of lower exports (particularly of copper), higher energy imports (fuel and electricity), and the larger import of capital goods associated with the government public investment plan, which were not envisaged in 2015. The adjustment scenario shows a steady pick-up in growth driven by increased confidence in government policies and lower inflation and improvements in the external sector current account due to more coherent fiscal consolidation policies.
ZAMBIA
6 INTERNATIONAL MONETARY FUND
Text Table 4. 2015 AIV DSA vs. Current DSA (assumptions)
2016 2017 2018 2019 2020 2021
Real Growth
2015 DSA 6.2 6.9 7.0 6.8 6.8 6.5 Current Policies DSA 3.4 4.0 4.5 4.5 4.5 4.5
Adjustments Policies DSA 3.4 4.0 4.5 5.0 5.5 5.5Inflation (deflator, av.)
2015 DSA 7.3 6.3 5.2 4.8 4.8 5.0 Current Policies DSA 14.3 7.9 8.1 8.1 7.8 8.0
Adjustments Policies DSA 14.3 7.9 6.8 6.3 6.0 6.0
Budget Deficit
2015 DSA 6.0 5.0 4.0 3.4 2.9 2.9 Current Policies DSA 5.7 8.0 7.8 7.2 6.5 5.3
Adjustments Policies DSA 5.7 7.3 5.9 4.0 3.2 2.4Net FDI
2015 DSA 6.6 6.6 6.6 6.6 6.6 6.2 Current Policies DSA 7.3 6.3 6.1 6.0 5.8 5.8
Adjustments Policies DSA 7.3 6.3 6.1 6.0 5.8 5.8Current Account Balance
2015 DSA 1.4 2.5 3.0 3.3 3.4 3.2 Current Policies DSA -4.4 -3.6 -2.8 -1.5 0.0 -0.2
Adjustments Policies DSA -4.4 -3.0 -1.5 0.1 1.2 1.4
(Percentage Change)
(Percent of GDP)
Text Table 3. Assumptions on Disbursements
Cur. Policies
Adj. poicies
Cur. Policies
Adj. poicies
Cur. Policies
Adj. poicies
Cur. Policies
Adj. poicies
Cur. Policies
Adj. poicies
Cur. Policies
Adj. poicies
Cur. Policies
Adj. poicies
Cur. Policies
Adj. poicies
Cur. Policies
Adj. poicies
Eurobond 0 0 0 0 0 0 0 0 0 0 750 750 0 0 1,000 1,000 425 425
Budget support - IDA; AfDB 0 200 0 230 0 70 0 0 0 0 0 0 0 0 0 0 0 0
Project support 864 690 1,467 964 1,617 870 1,409 728 1,199 742 937 780 858 788 965 953 1,012 1,032
Project support - concessional 489 383 751 645 563 489 451 501 478 517 519 547 532 473 544 562 556 608
Non-concessional borrowing 375 308 716 319 1,054 380 958 227 721 225 419 233 343 315 421 391 456 424
Other commercial borrowing 134 134 0 0 0 0 0 0 0 0 0 0 0 0 0 0 0 0
SOE (ZESCO, RDA, WSSDC) 272 272 208 208 115 120 86 92 41 48 42 50 46 54 49 59 53 63
20222017 2018 2019 2020 2021 2023 2,024 2025
ZAMBIA
INTERNATIONAL MONETARY FUND 7
EXTERNAL DSA
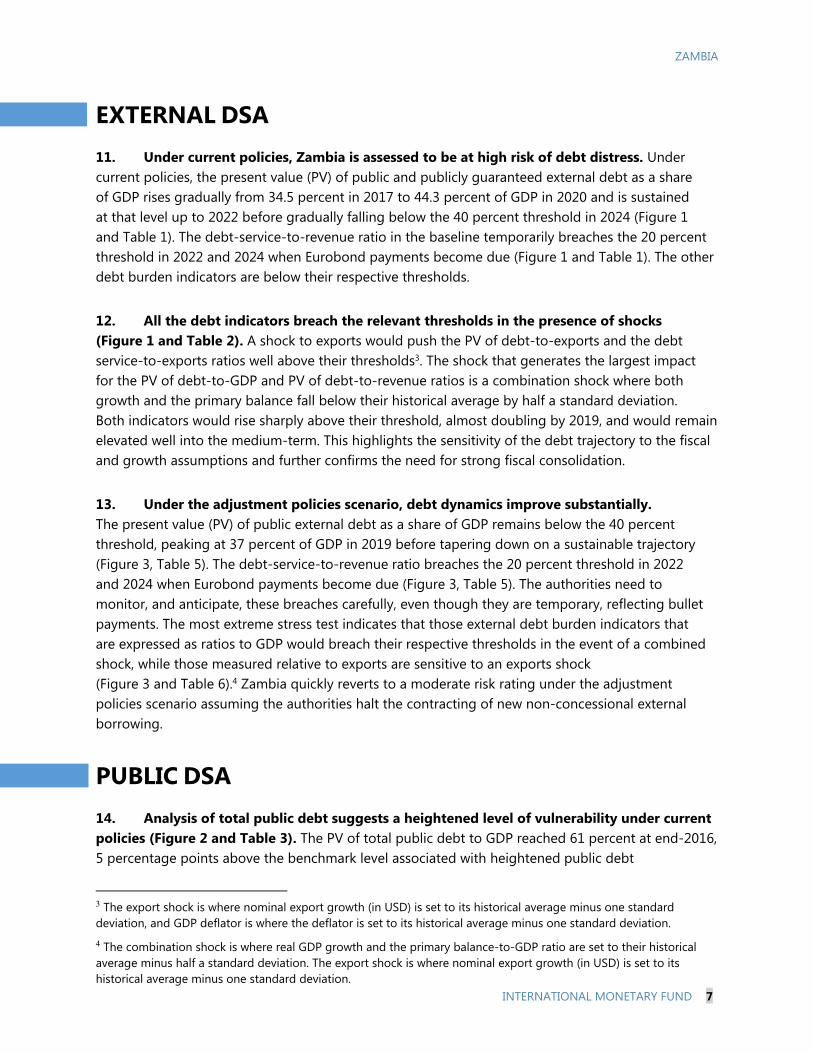
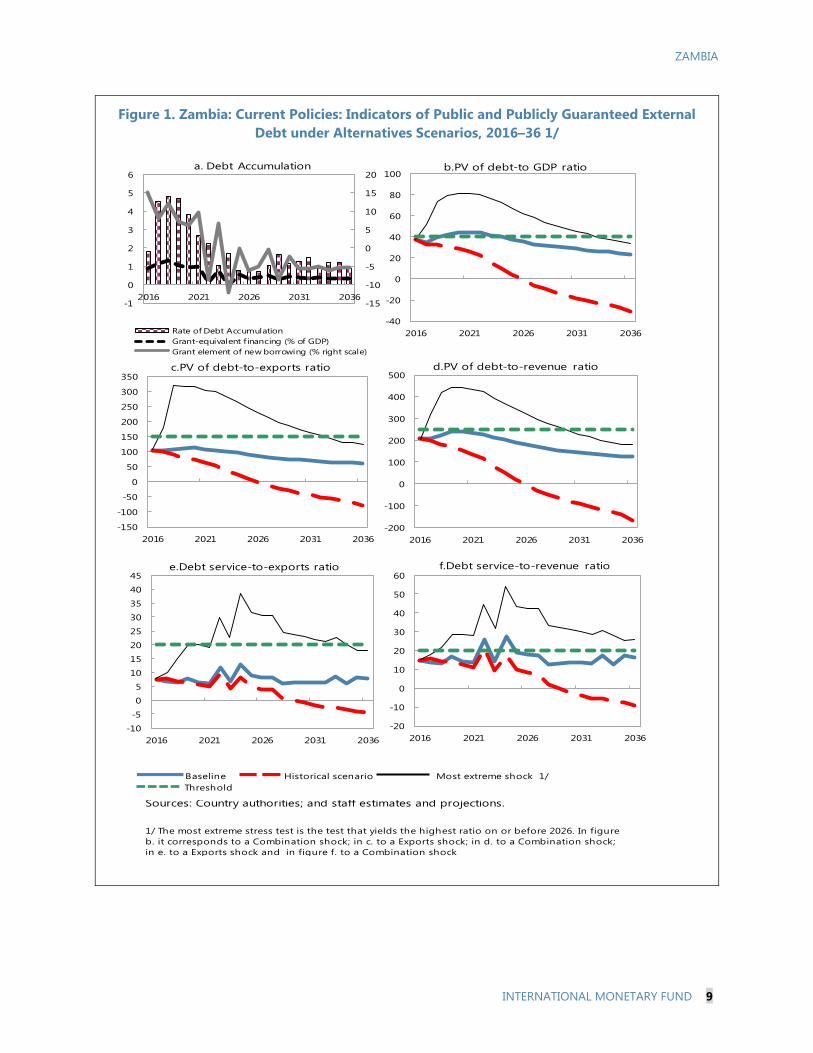
11. Under current policies, Zambia is assessed to be at high risk of debt distress. Under current policies, the present value (PV) of public and publicly guaranteed external debt as a share of GDP rises gradually from 34.5 percent in 2017 to 44.3 percent of GDP in 2020 and is sustained at that level up to 2022 before gradually falling below the 40 percent threshold in 2024 (Figure 1 and Table 1). The debt-service-to-revenue ratio in the baseline temporarily breaches the 20 percent threshold in 2022 and 2024 when Eurobond payments become due (Figure 1 and Table 1). The other debt burden indicators are below their respective thresholds.
12. All the debt indicators breach the relevant thresholds in the presence of shocks (Figure 1 and Table 2). A shock to exports would push the PV of debt-to-exports and the debt service-to-exports ratios well above their thresholds3. The shock that generates the largest impact for the PV of debt-to-GDP and PV of debt-to-revenue ratios is a combination shock where both growth and the primary balance fall below their historical average by half a standard deviation. Both indicators would rise sharply above their threshold, almost doubling by 2019, and would remain elevated well into the medium-term. This highlights the sensitivity of the debt trajectory to the fiscal and growth assumptions and further confirms the need for strong fiscal consolidation.
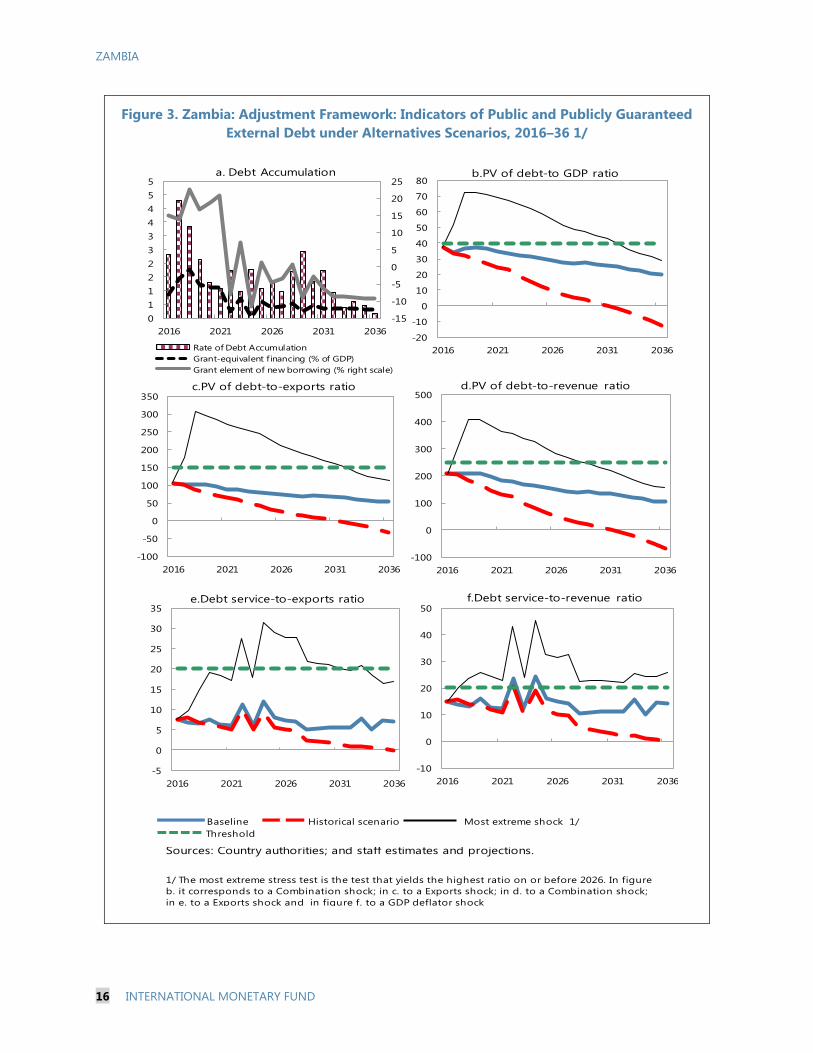
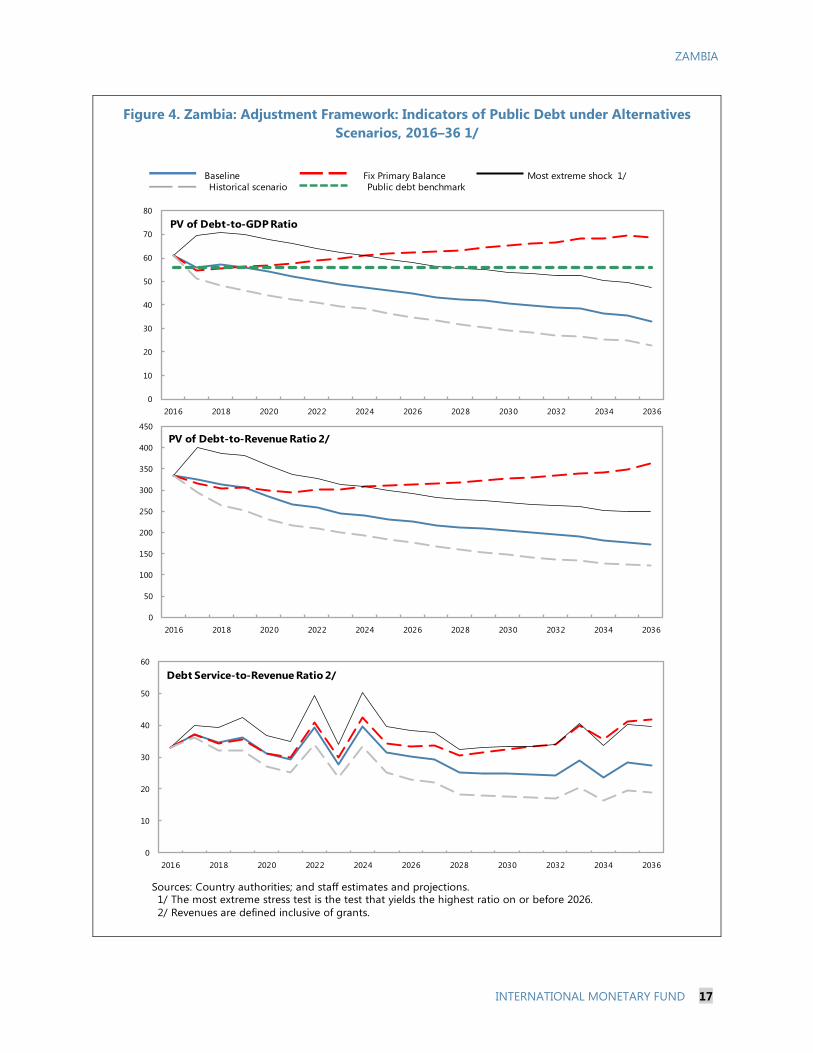
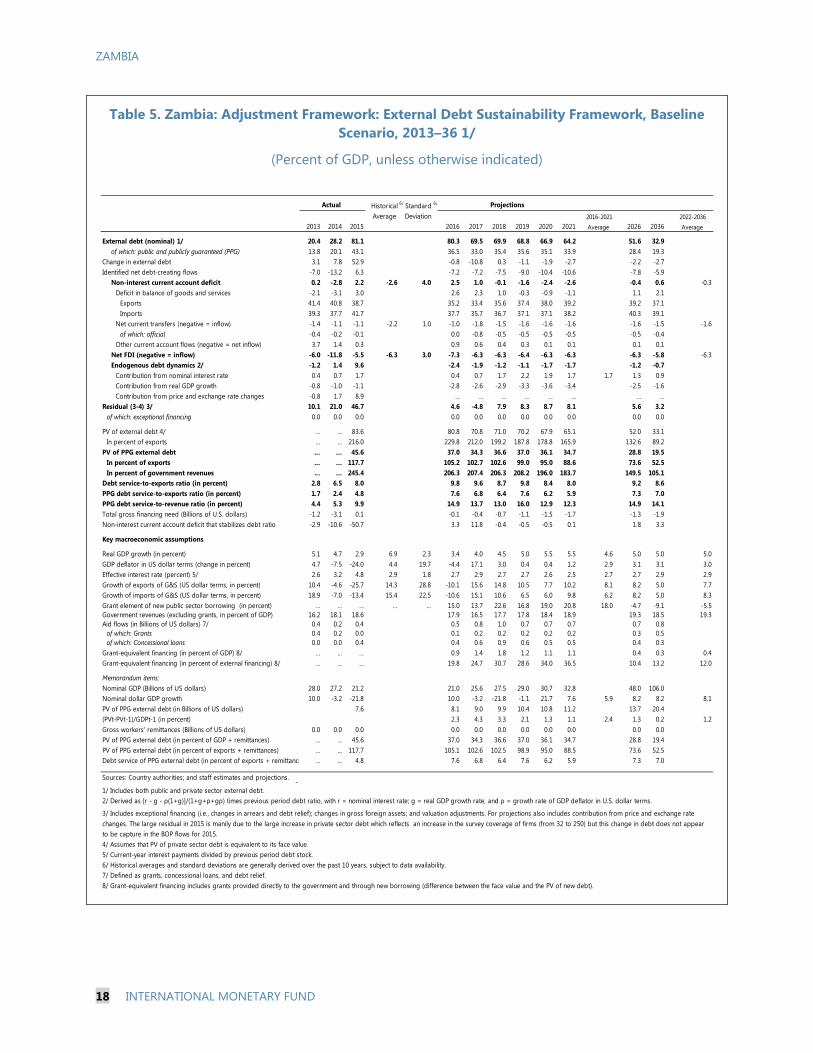
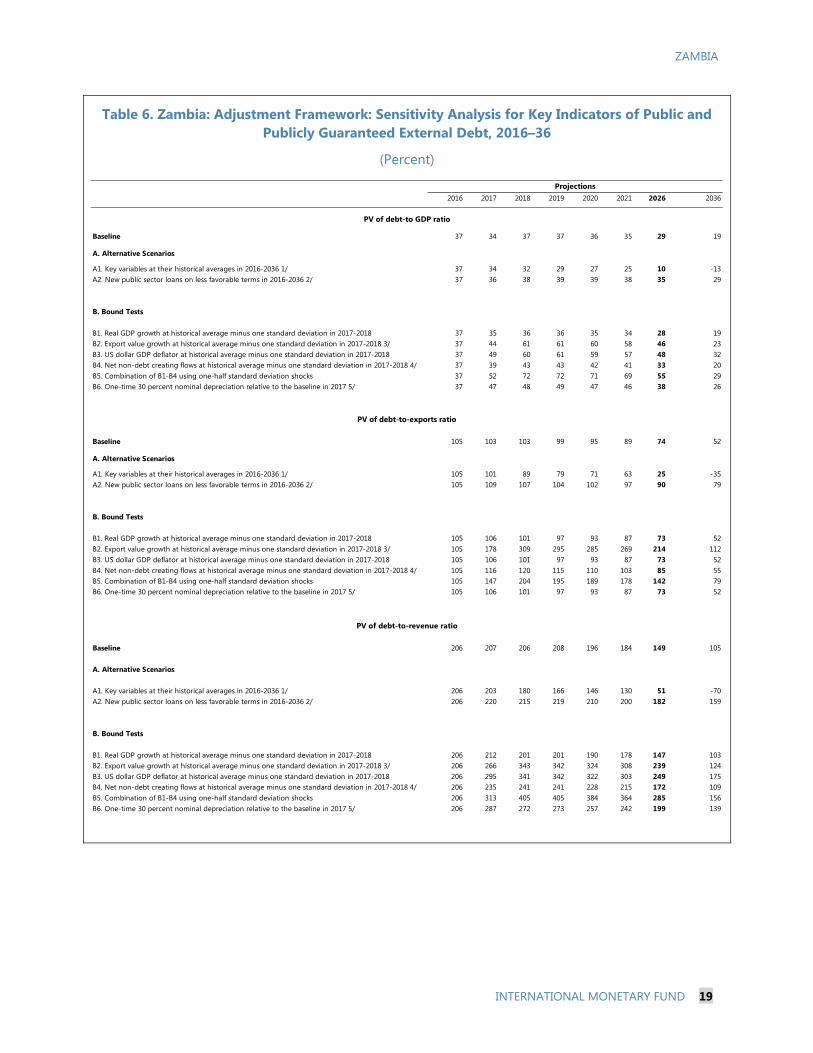
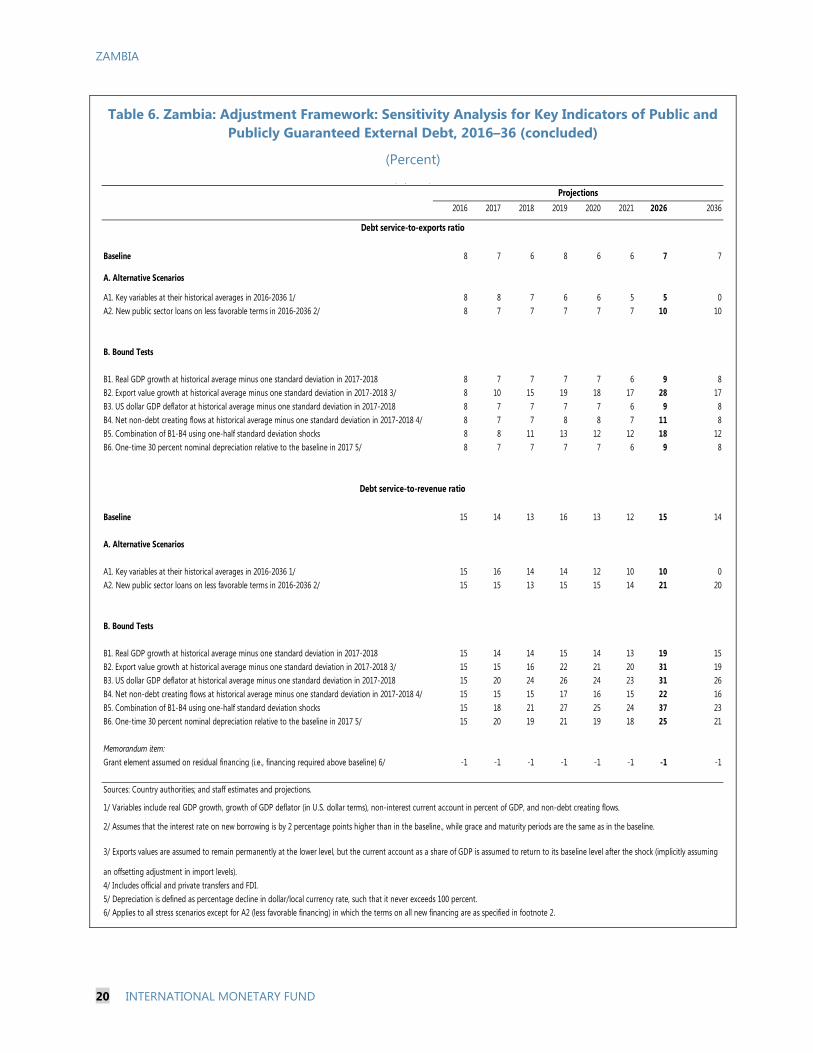
13. Under the adjustment policies scenario, debt dynamics improve substantially. The present value (PV) of public external debt as a share of GDP remains below the 40 percent threshold, peaking at 37 percent of GDP in 2019 before tapering down on a sustainable trajectory (Figure 3, Table 5). The debt-service-to-revenue ratio breaches the 20 percent threshold in 2022 and 2024 when Eurobond payments become due (Figure 3, Table 5). The authorities need to monitor, and anticipate, these breaches carefully, even though they are temporary, reflecting bullet payments. The most extreme stress test indicates that those external debt burden indicators that are expressed as ratios to GDP would breach their respective thresholds in the event of a combined shock, while those measured relative to exports are sensitive to an exports shock (Figure 3 and Table 6).4 Zambia quickly reverts to a moderate risk rating under the adjustment policies scenario assuming the authorities halt the contracting of new non-concessional external borrowing.
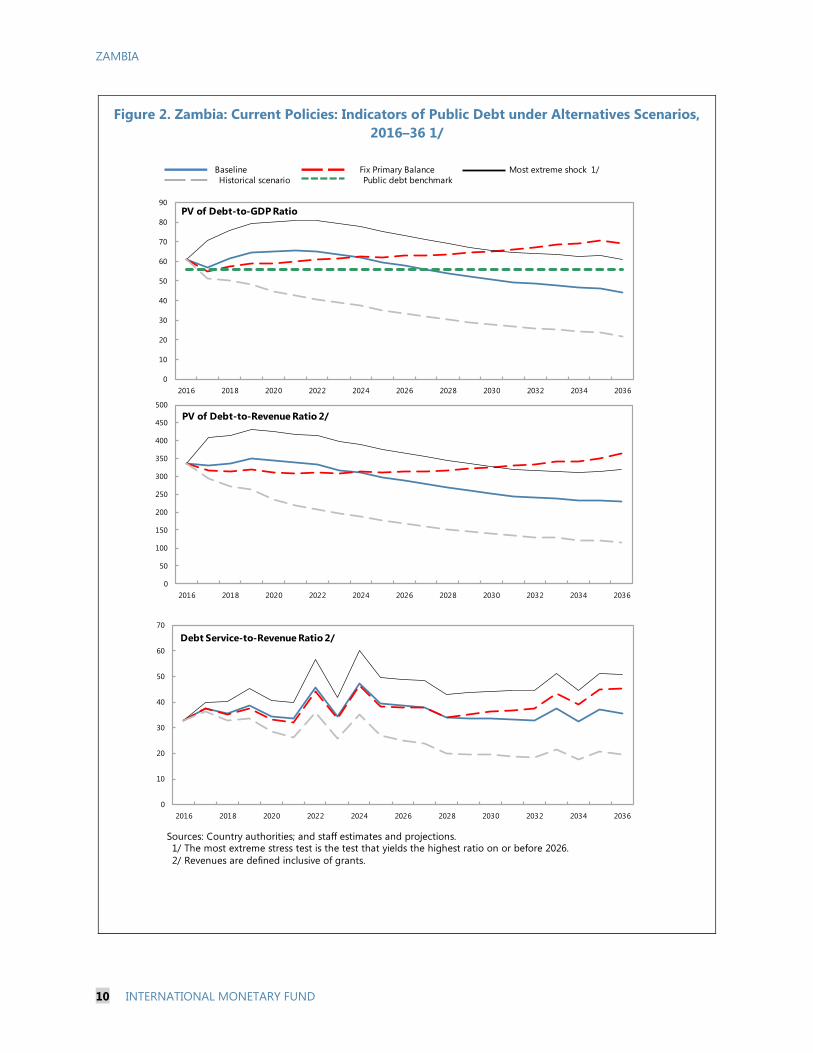
PUBLIC DSA 14. Analysis of total public debt suggests a heightened level of vulnerability under current policies (Figure 2 and Table 3). The PV of total public debt to GDP reached 61 percent at end-2016, 5 percentage points above the benchmark level associated with heightened public debt
3 The export shock is where nominal export growth (in USD) is set to its historical average minus one standard deviation, and GDP deflator is where the deflator is set to its historical average minus one standard deviation. 4 The combination shock is where real GDP growth and the primary balance-to-GDP ratio are set to their historical average minus half a standard deviation. The export shock is where nominal export growth (in USD) is set to its historical average minus one standard deviation.
ZAMBIA
8 INTERNATIONAL MONETARY FUND
vulnerabilities for medium performers. Following a projected temporary improvement in 2017 driven by the strengthening of the exchange rate relative to 2016, this indicator will continue to rise through 2022. Similarly, under the fixed primary balance scenario, this indicator is above the threshold and is projected to continue rising, underscoring the need for an improved fiscal position (Figure 2).
15. Debt metrics improve under the adjustment scenario. If the authorities were to take additional consolidation measures and slow down on the contracting of new non-concessional external loans, this would improve the fiscal position and the public debt dynamics (Figure 4 and Table 7).
CONCLUSION
16. Zambia faces a high risk of external debt distress, and heightened vulnerabilities on total public debt. Under current policies, the PV of the external debt-to-GDP ratio breaches the 40 percent threshold during 2019-23, while the debt-service-to-revenue ratio temporarily breaches its threshold in 2022 and 2024 when Eurobonds mature. All indicators breach their thresholds for extensive periods under a variety of shocks, underscoring the sensitivity of the external debt burden to fiscal performance and developments in exports, growth and the exchange rate. The ratio of total public debt to GDP breaches the benchmark level associated with heightened vulnerabilities. Debt dynamics improve substantially under the adjustment policies scenario. Fiscal consolidation, restraint on non-concessional borrowing, and strengthened debt and public investment management capacities are needed to put debt on a sustainable path.
17. The authorities broadly agreed with the DSA assessment. They indicated that they will soon be publishing the Medium-Term Debt Strategy which will guide government borrowing, with a view to ensuring that public debt remains at sustainable levels. In this context, they will seek to maximize concessional loans. They also plan to strengthen parliamentary over-sight of public borrowing through an amendment to the Loans and Guarantees Act.
ZAMBIA
INTERNATIONAL MONETARY FUND 9
Figure 1. Zambia: Current Policies: Indicators of Public and Publicly Guaranteed External Debt under Alternatives Scenarios, 2016–36 1/
Sources: Country authorities; and staff estimates and projections.
1/ The most extreme stress test is the test that yields the highest ratio on or before 2026. In figure b. it corresponds to a Combination shock; in c. to a Exports shock; in d. to a Combination shock; in e. to a Exports shock and in figure f. to a Combination shock
Baseline Historical scenario Most extreme shock 1/ Threshold
-20
-10
0
10
20
30
40
50
60
2016 2021 2026 2031 2036
f.Debt service-to-revenue ratio
-15
-10
-5
0
5
10
15
20
-1
0
1
2
3
4
5
6
2016 2021 2026 2031 2036
Rate of Debt AccumulationGrant-equivalent f inancing (% of GDP)Grant element of new borrowing (% right scale)
a. Debt Accumulation
-150
-100
-50
0
50
100
150
200
250
300
350
2016 2021 2026 2031 2036
c.PV of debt-to-exports ratio
-40
-20
0
20
40
60
80
100
2016 2021 2026 2031 2036
b.PV of debt-to GDP ratio
-200
-100
0
100
200
300
400
500
2016 2021 2026 2031 2036
d.PV of debt-to-revenue ratio
-10
-5
0
5
10
15
20
25
30
35
40
45
2016 2021 2026 2031 2036
e.Debt service-to-exports ratio
ZAMBIA
10 INTERNATIONAL MONETARY FUND
Figure 2. Zambia: Current Policies: Indicators of Public Debt under Alternatives Scenarios, 2016–36 1/
Sources: Country authorities; and staff estimates and projections.1/ The most extreme stress test is the test that yields the highest ratio on or before 2026. 2/ Revenues are defined inclusive of grants.
BaselinePublic debt benchmark
Most extreme shock 1/Historical scenario
Fix Primary Balance
0
50
100
150
200
250
300
350
400
450
500
2016 2018 2020 2022 2024 2026 2028 2030 2032 2034 2036
PV of Debt-to-Revenue Ratio 2/
0
10
20
30
40
50
60
70
80
90
2016 2018 2020 2022 2024 2026 2028 2030 2032 2034 2036
PV of Debt-to-GDP Ratio
0
10
20
30
40
50
60
70
2016 2018 2020 2022 2024 2026 2028 2030 2032 2034 2036
Debt Service-to-Revenue Ratio 2/
ZAMBIA
INTERNATIONAL MONETARY FUND 11
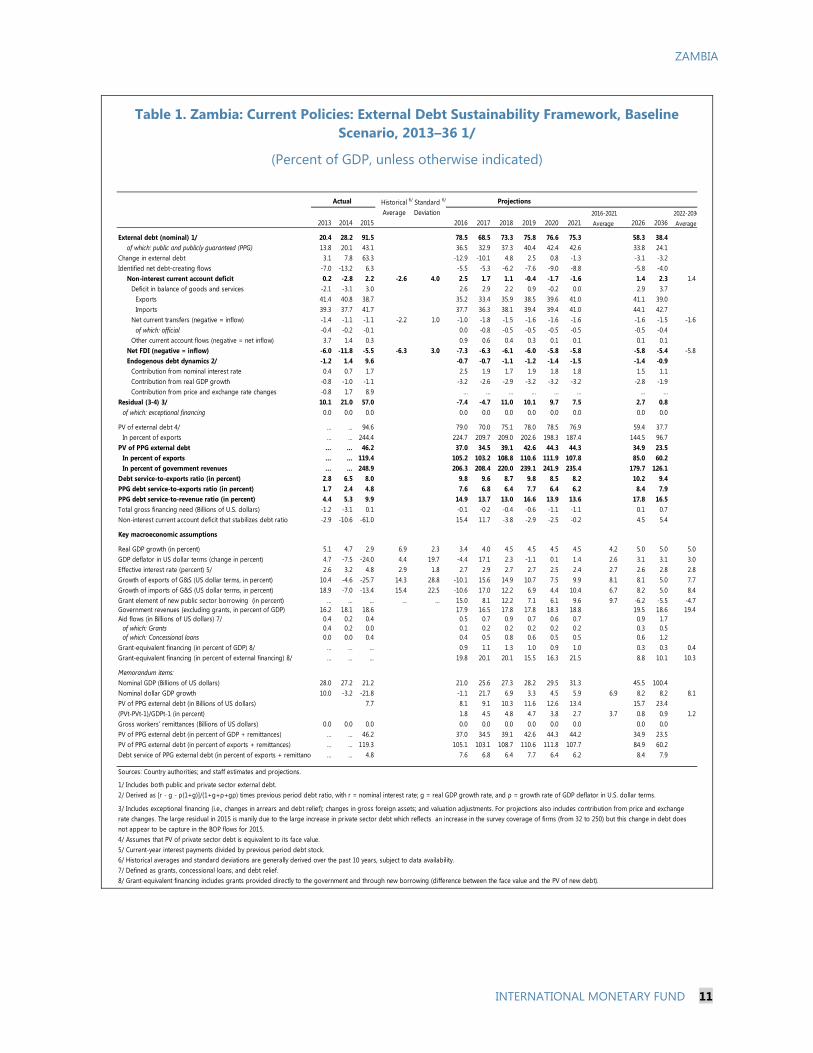
Table 1. Zambia: Current Policies: External Debt Sustainability Framework, Baseline Scenario, 2013–36 1/
(Percent of GDP, unless otherwise indicated)
Historical 6/ Standard 6/
Average Deviation 2016-2021 2022-20362013 2014 2015 2016 2017 2018 2019 2020 2021 Average 2026 2036 Average
External debt (nominal) 1/ 20.4 28.2 91.5 78.5 68.5 73.3 75.8 76.6 75.3 58.3 38.4of which: public and publicly guaranteed (PPG) 13.8 20.1 43.1 36.5 32.9 37.3 40.4 42.4 42.6 33.8 24.1
Change in external debt 3.1 7.8 63.3 -12.9 -10.1 4.8 2.5 0.8 -1.3 -3.1 -3.2Identified net debt-creating flows -7.0 -13.2 6.3 -5.5 -5.3 -6.2 -7.6 -9.0 -8.8 -5.8 -4.0
Non-interest current account deficit 0.2 -2.8 2.2 -2.6 4.0 2.5 1.7 1.1 -0.4 -1.7 -1.6 1.4 2.3 1.4Deficit in balance of goods and services -2.1 -3.1 3.0 2.6 2.9 2.2 0.9 -0.2 0.0 2.9 3.7
Exports 41.4 40.8 38.7 35.2 33.4 35.9 38.5 39.6 41.0 41.1 39.0Imports 39.3 37.7 41.7 37.7 36.3 38.1 39.4 39.4 41.0 44.1 42.7
Net current transfers (negative = inflow) -1.4 -1.1 -1.1 -2.2 1.0 -1.0 -1.8 -1.5 -1.6 -1.6 -1.6 -1.6 -1.5 -1.6of which: official -0.4 -0.2 -0.1 0.0 -0.8 -0.5 -0.5 -0.5 -0.5 -0.5 -0.4
Other current account flows (negative = net inflow) 3.7 1.4 0.3 0.9 0.6 0.4 0.3 0.1 0.1 0.1 0.1Net FDI (negative = inflow) -6.0 -11.8 -5.5 -6.3 3.0 -7.3 -6.3 -6.1 -6.0 -5.8 -5.8 -5.8 -5.4 -5.8Endogenous debt dynamics 2/ -1.2 1.4 9.6 -0.7 -0.7 -1.1 -1.2 -1.4 -1.5 -1.4 -0.9
Contribution from nominal interest rate 0.4 0.7 1.7 2.5 1.9 1.7 1.9 1.8 1.8 1.5 1.1Contribution from real GDP growth -0.8 -1.0 -1.1 -3.2 -2.6 -2.9 -3.2 -3.2 -3.2 -2.8 -1.9Contribution from price and exchange rate changes -0.8 1.7 8.9 … … … … … … … …
Residual (3-4) 3/ 10.1 21.0 57.0 -7.4 -4.7 11.0 10.1 9.7 7.5 2.7 0.8of which: exceptional financing 0.0 0.0 0.0 0.0 0.0 0.0 0.0 0.0 0.0 0.0 0.0
PV of external debt 4/ ... ... 94.6 79.0 70.0 75.1 78.0 78.5 76.9 59.4 37.7In percent of exports ... ... 244.4 224.7 209.7 209.0 202.6 198.3 187.4 144.5 96.7
PV of PPG external debt ... ... 46.2 37.0 34.5 39.1 42.6 44.3 44.3 34.9 23.5In percent of exports ... ... 119.4 105.2 103.2 108.8 110.6 111.9 107.8 85.0 60.2In percent of government revenues ... ... 248.9 206.3 208.4 220.0 239.1 241.9 235.4 179.7 126.1
Debt service-to-exports ratio (in percent) 2.8 6.5 8.0 9.8 9.6 8.7 9.8 8.5 8.2 10.2 9.4PPG debt service-to-exports ratio (in percent) 1.7 2.4 4.8 7.6 6.8 6.4 7.7 6.4 6.2 8.4 7.9PPG debt service-to-revenue ratio (in percent) 4.4 5.3 9.9 14.9 13.7 13.0 16.6 13.9 13.6 17.8 16.5Total gross financing need (Billions of U.S. dollars) -1.2 -3.1 0.1 -0.1 -0.2 -0.4 -0.6 -1.1 -1.1 0.1 0.7Non-interest current account deficit that stabilizes debt ratio -2.9 -10.6 -61.0 15.4 11.7 -3.8 -2.9 -2.5 -0.2 4.5 5.4
Key macroeconomic assumptions
Real GDP growth (in percent) 5.1 4.7 2.9 6.9 2.3 3.4 4.0 4.5 4.5 4.5 4.5 4.2 5.0 5.0 5.0GDP deflator in US dollar terms (change in percent) 4.7 -7.5 -24.0 4.4 19.7 -4.4 17.1 2.3 -1.1 0.1 1.4 2.6 3.1 3.1 3.0Effective interest rate (percent) 5/ 2.6 3.2 4.8 2.9 1.8 2.7 2.9 2.7 2.7 2.5 2.4 2.7 2.6 2.8 2.8Growth of exports of G&S (US dollar terms, in percent) 10.4 -4.6 -25.7 14.3 28.8 -10.1 15.6 14.9 10.7 7.5 9.9 8.1 8.1 5.0 7.7Growth of imports of G&S (US dollar terms, in percent) 18.9 -7.0 -13.4 15.4 22.5 -10.6 17.0 12.2 6.9 4.4 10.4 6.7 8.2 5.0 8.4Grant element of new public sector borrowing (in percent) ... ... ... ... ... 15.0 8.1 12.2 7.1 6.1 9.6 9.7 -6.2 -5.5 -4.7Government revenues (excluding grants, in percent of GDP) 16.2 18.1 18.6 17.9 16.5 17.8 17.8 18.3 18.8 19.5 18.6 19.4Aid flows (in Billions of US dollars) 7/ 0.4 0.2 0.4 0.5 0.7 0.9 0.7 0.6 0.7 0.9 1.7
of which: Grants 0.4 0.2 0.0 0.1 0.2 0.2 0.2 0.2 0.2 0.3 0.5of which: Concessional loans 0.0 0.0 0.4 0.4 0.5 0.8 0.6 0.5 0.5 0.6 1.2
Grant-equivalent financing (in percent of GDP) 8/ ... ... ... 0.9 1.1 1.3 1.0 0.9 1.0 0.3 0.3 0.4Grant-equivalent financing (in percent of external financing) 8/ ... ... ... 19.8 20.1 20.1 15.5 16.3 21.5 8.8 10.1 10.3
Memorandum items:Nominal GDP (Billions of US dollars) 28.0 27.2 21.2 21.0 25.6 27.3 28.2 29.5 31.3 45.5 100.4Nominal dollar GDP growth 10.0 -3.2 -21.8 -1.1 21.7 6.9 3.3 4.5 5.9 6.9 8.2 8.2 8.1PV of PPG external debt (in Billions of US dollars) 7.7 8.1 9.1 10.3 11.6 12.6 13.4 15.7 23.4(PVt-PVt-1)/GDPt-1 (in percent) 1.8 4.5 4.8 4.7 3.8 2.7 3.7 0.8 0.9 1.2Gross workers' remittances (Billions of US dollars) 0.0 0.0 0.0 0.0 0.0 0.0 0.0 0.0 0.0 0.0 0.0PV of PPG external debt (in percent of GDP + remittances) ... ... 46.2 37.0 34.5 39.1 42.6 44.3 44.2 34.9 23.5PV of PPG external debt (in percent of exports + remittances) ... ... 119.3 105.1 103.1 108.7 110.6 111.8 107.7 84.9 60.2Debt service of PPG external debt (in percent of exports + remittance ... ... 4.8 7.6 6.8 6.4 7.7 6.4 6.2 8.4 7.9
Sources: Country authorities; and staff estimates and projections. 01/ Includes both public and private sector external debt.2/ Derived as [r - g - ρ(1+g)]/(1+g+ρ+gρ) times previous period debt ratio, with r = nominal interest rate; g = real GDP growth rate, and ρ = growth rate of GDP deflator in U.S. dollar terms.
4/ Assumes that PV of private sector debt is equivalent to its face value.5/ Current-year interest payments divided by previous period debt stock. 6/ Historical averages and standard deviations are generally derived over the past 10 years, subject to data availability. 7/ Defined as grants, concessional loans, and debt relief.8/ Grant-equivalent financing includes grants provided directly to the government and through new borrowing (difference between the face value and the PV of new debt).
Actual Projections
3/ Includes exceptional financing (i.e., changes in arrears and debt relief); changes in gross foreign assets; and valuation adjustments. For projections also includes contribution from price and exchange rate changes. The large residual in 2015 is manily due to the large increase in private sector debt which reflects an increase in the survey coverage of firms (from 32 to 250) but this change in debt does not appear to be capture in the BOP flows for 2015.
ZAMBIA
12 INTERNATIONAL MONETARY FUND
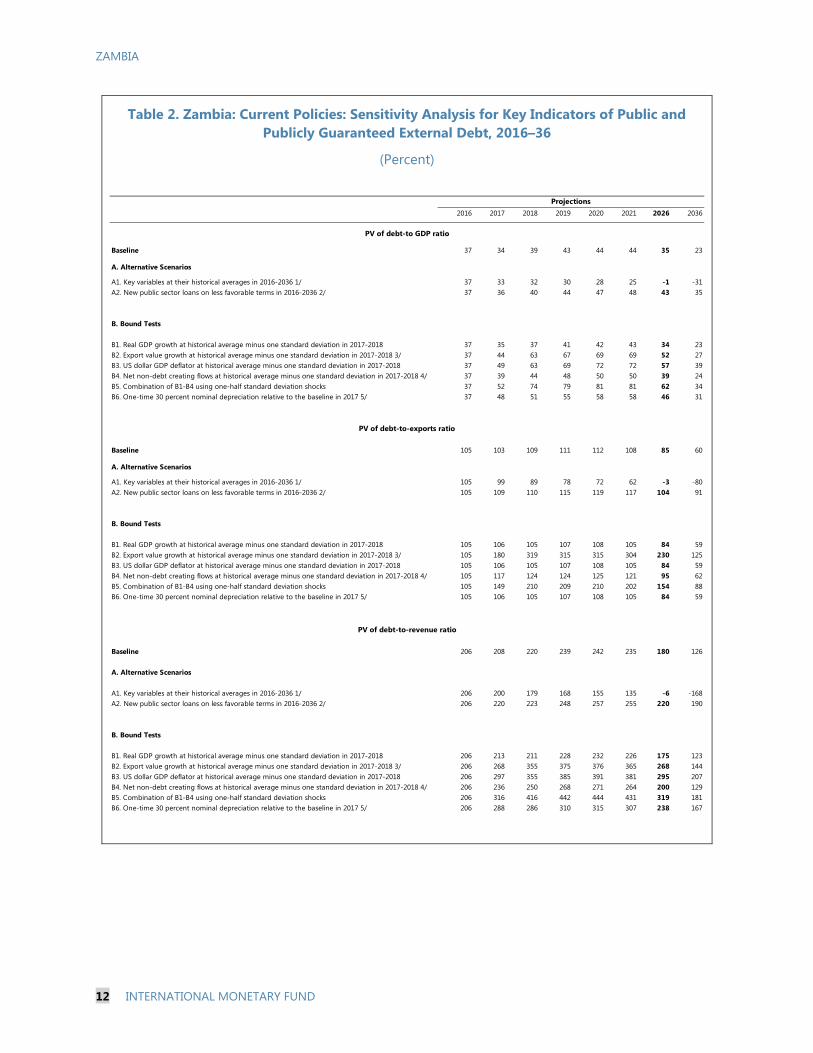
Table 2. Zambia: Current Policies: Sensitivity Analysis for Key Indicators of Public and Publicly Guaranteed External Debt, 2016–36
(Percent)
2016 2017 2018 2019 2020 2021 2026 2036
Baseline 37 34 39 43 44 44 35 23
A. Alternative Scenarios
A1. Key variables at their historical averages in 2016-2036 1/ 37 33 32 30 28 25 -1 -31A2. New public sector loans on less favorable terms in 2016-2036 2/ 37 36 40 44 47 48 43 35
B. Bound Tests
B1. Real GDP growth at historical average minus one standard deviation in 2017-2018 37 35 37 41 42 43 34 23B2. Export value growth at historical average minus one standard deviation in 2017-2018 3/ 37 44 63 67 69 69 52 27B3. US dollar GDP deflator at historical average minus one standard deviation in 2017-2018 37 49 63 69 72 72 57 39B4. Net non-debt creating flows at historical average minus one standard deviation in 2017-2018 4/ 37 39 44 48 50 50 39 24B5. Combination of B1-B4 using one-half standard deviation shocks 37 52 74 79 81 81 62 34B6. One-time 30 percent nominal depreciation relative to the baseline in 2017 5/ 37 48 51 55 58 58 46 31
Baseline 105 103 109 111 112 108 85 60
A. Alternative Scenarios
A1. Key variables at their historical averages in 2016-2036 1/ 105 99 89 78 72 62 -3 -80A2. New public sector loans on less favorable terms in 2016-2036 2/ 105 109 110 115 119 117 104 91
B. Bound Tests
B1. Real GDP growth at historical average minus one standard deviation in 2017-2018 105 106 105 107 108 105 84 59B2. Export value growth at historical average minus one standard deviation in 2017-2018 3/ 105 180 319 315 315 304 230 125B3. US dollar GDP deflator at historical average minus one standard deviation in 2017-2018 105 106 105 107 108 105 84 59B4. Net non-debt creating flows at historical average minus one standard deviation in 2017-2018 4/ 105 117 124 124 125 121 95 62B5. Combination of B1-B4 using one-half standard deviation shocks 105 149 210 209 210 202 154 88B6. One-time 30 percent nominal depreciation relative to the baseline in 2017 5/ 105 106 105 107 108 105 84 59
Baseline 206 208 220 239 242 235 180 126
A. Alternative Scenarios
A1. Key variables at their historical averages in 2016-2036 1/ 206 200 179 168 155 135 -6 -168A2. New public sector loans on less favorable terms in 2016-2036 2/ 206 220 223 248 257 255 220 190
B. Bound Tests
B1. Real GDP growth at historical average minus one standard deviation in 2017-2018 206 213 211 228 232 226 175 123B2. Export value growth at historical average minus one standard deviation in 2017-2018 3/ 206 268 355 375 376 365 268 144B3. US dollar GDP deflator at historical average minus one standard deviation in 2017-2018 206 297 355 385 391 381 295 207B4. Net non-debt creating flows at historical average minus one standard deviation in 2017-2018 4/ 206 236 250 268 271 264 200 129B5. Combination of B1-B4 using one-half standard deviation shocks 206 316 416 442 444 431 319 181B6. One-time 30 percent nominal depreciation relative to the baseline in 2017 5/ 206 288 286 310 315 307 238 167
PV of debt-to-exports ratio
PV of debt-to-revenue ratio
PV of debt-to GDP ratio
Projections
ZAMBIA
INTERNATIONAL MONETARY FUND 13
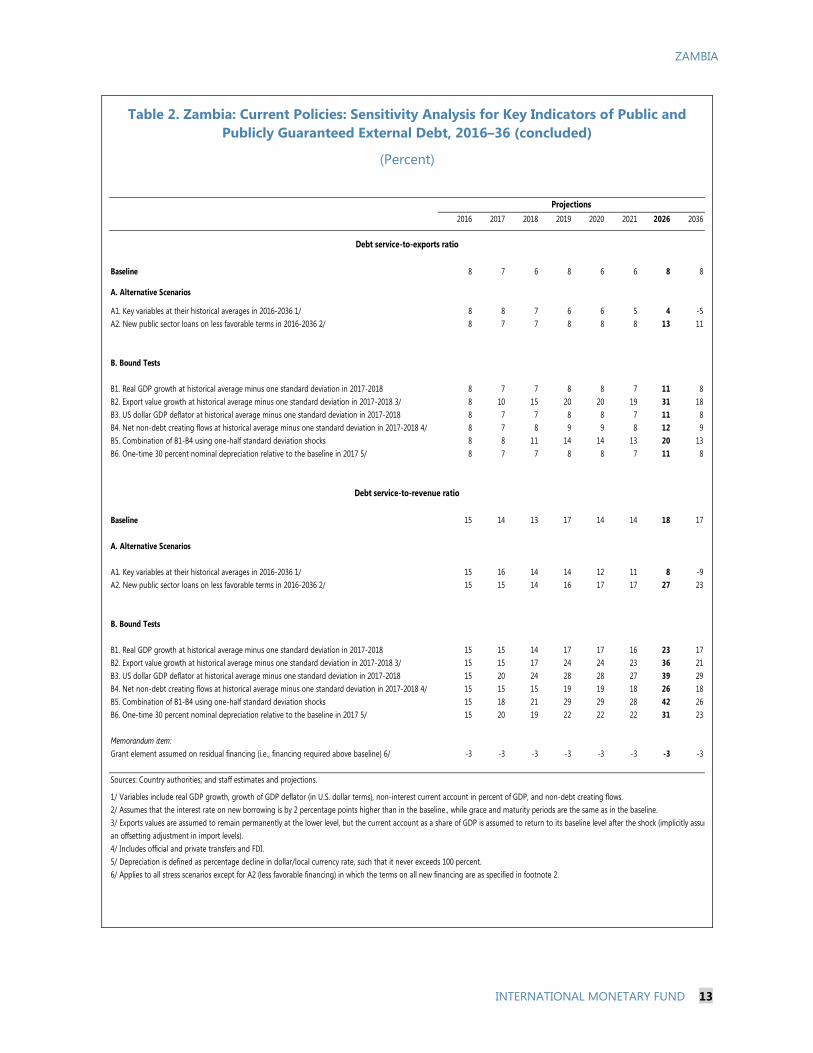
Table 2. Zambia: Current Policies: Sensitivity Analysis for Key Indicators of Public and Publicly Guaranteed External Debt, 2016–36 (concluded)
(Percent)
2016 2017 2018 2019 2020 2021 2026 2036
Baseline 8 7 6 8 6 6 8 8
A. Alternative Scenarios
A1. Key variables at their historical averages in 2016-2036 1/ 8 8 7 6 6 5 4 -5A2. New public sector loans on less favorable terms in 2016-2036 2/ 8 7 7 8 8 8 13 11
B. Bound Tests
B1. Real GDP growth at historical average minus one standard deviation in 2017-2018 8 7 7 8 8 7 11 8B2. Export value growth at historical average minus one standard deviation in 2017-2018 3/ 8 10 15 20 20 19 31 18B3. US dollar GDP deflator at historical average minus one standard deviation in 2017-2018 8 7 7 8 8 7 11 8B4. Net non-debt creating flows at historical average minus one standard deviation in 2017-2018 4/ 8 7 8 9 9 8 12 9B5. Combination of B1-B4 using one-half standard deviation shocks 8 8 11 14 14 13 20 13B6. One-time 30 percent nominal depreciation relative to the baseline in 2017 5/ 8 7 7 8 8 7 11 8
Baseline 15 14 13 17 14 14 18 17
A. Alternative Scenarios
A1. Key variables at their historical averages in 2016-2036 1/ 15 16 14 14 12 11 8 -9A2. New public sector loans on less favorable terms in 2016-2036 2/ 15 15 14 16 17 17 27 23
B. Bound Tests
B1. Real GDP growth at historical average minus one standard deviation in 2017-2018 15 15 14 17 17 16 23 17B2. Export value growth at historical average minus one standard deviation in 2017-2018 3/ 15 15 17 24 24 23 36 21B3. US dollar GDP deflator at historical average minus one standard deviation in 2017-2018 15 20 24 28 28 27 39 29B4. Net non-debt creating flows at historical average minus one standard deviation in 2017-2018 4/ 15 15 15 19 19 18 26 18B5. Combination of B1-B4 using one-half standard deviation shocks 15 18 21 29 29 28 42 26B6. One-time 30 percent nominal depreciation relative to the baseline in 2017 5/ 15 20 19 22 22 22 31 23
Memorandum item:Grant element assumed on residual financing (i.e., financing required above baseline) 6/ -3 -3 -3 -3 -3 -3 -3 -3
Sources: Country authorities; and staff estimates and projections.
1/ Variables include real GDP growth, growth of GDP deflator (in U.S. dollar terms), non-interest current account in percent of GDP, and non-debt creating flows. 2/ Assumes that the interest rate on new borrowing is by 2 percentage points higher than in the baseline., while grace and maturity periods are the same as in the baseline.3/ Exports values are assumed to remain permanently at the lower level, but the current account as a share of GDP is assumed to return to its baseline level after the shock (implicitly assuman offsetting adjustment in import levels). 4/ Includes official and private transfers and FDI.5/ Depreciation is defined as percentage decline in dollar/local currency rate, such that it never exceeds 100 percent.6/ Applies to all stress scenarios except for A2 (less favorable financing) in which the terms on all new financing are as specified in footnote 2.
Debt service-to-revenue ratio
Debt service-to-exports ratio
Projections
ZAMBIA
14 INTERNATIONAL MONETARY FUND
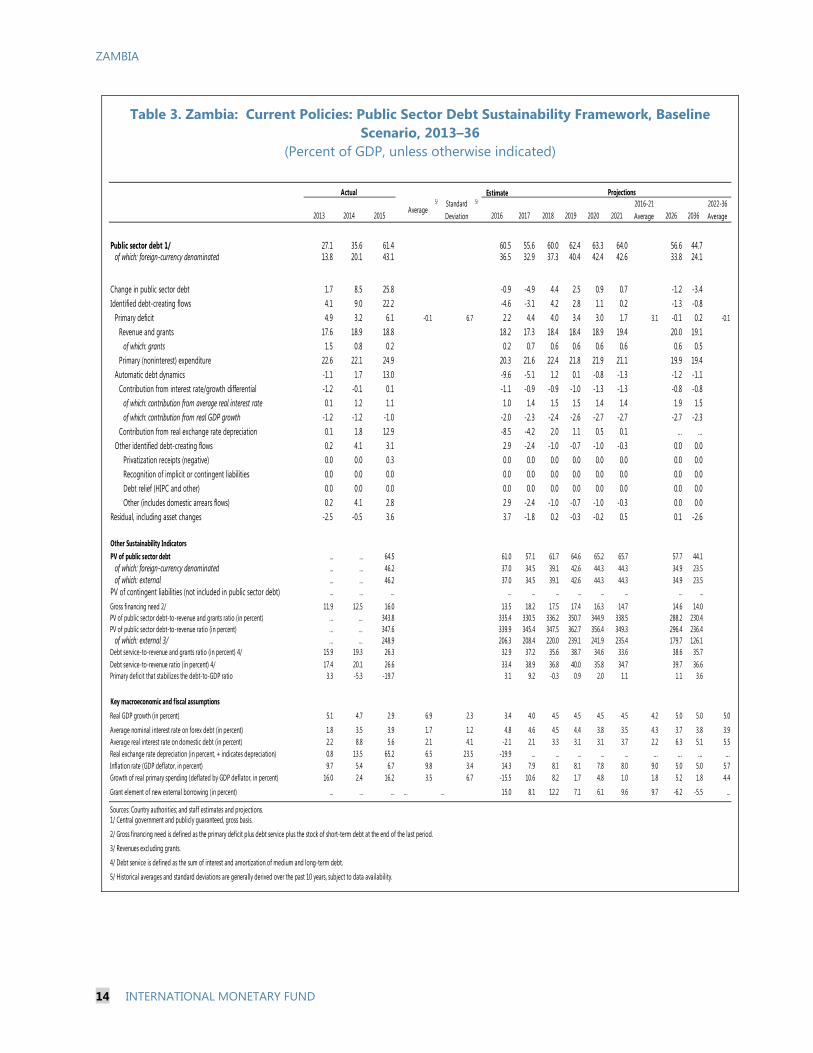
Table 3. Zambia: Current Policies: Public Sector Debt Sustainability Framework, Baseline Scenario, 2013–36
(Percent of GDP, unless otherwise indicated)
Estimate
2013 2014 2015Average
5/ Standard Deviation
5/
2016 2017 2018 2019 2020 20212016-21 Average 2026 2036
2022-36 Average
Public sector debt 1/ 27.1 35.6 61.4 60.5 55.6 60.0 62.4 63.3 64.0 56.6 44.7of which: foreign-currency denominated 13.8 20.1 43.1 36.5 32.9 37.3 40.4 42.4 42.6 33.8 24.1
Change in public sector debt 1.7 8.5 25.8 -0.9 -4.9 4.4 2.5 0.9 0.7 -1.2 -3.4Identified debt-creating flows 4.1 9.0 22.2 -4.6 -3.1 4.2 2.8 1.1 0.2 -1.3 -0.8
Primary deficit 4.9 3.2 6.1 -0.1 6.7 2.2 4.4 4.0 3.4 3.0 1.7 3.1 -0.1 0.2 -0.1
Revenue and grants 17.6 18.9 18.8 18.2 17.3 18.4 18.4 18.9 19.4 20.0 19.1of which: grants 1.5 0.8 0.2 0.2 0.7 0.6 0.6 0.6 0.6 0.6 0.5
Primary (noninterest) expenditure 22.6 22.1 24.9 20.3 21.6 22.4 21.8 21.9 21.1 19.9 19.4Automatic debt dynamics -1.1 1.7 13.0 -9.6 -5.1 1.2 0.1 -0.8 -1.3 -1.2 -1.1
Contribution from interest rate/growth differential -1.2 -0.1 0.1 -1.1 -0.9 -0.9 -1.0 -1.3 -1.3 -0.8 -0.8of which: contribution from average real interest rate 0.1 1.2 1.1 1.0 1.4 1.5 1.5 1.4 1.4 1.9 1.5of which: contribution from real GDP growth -1.2 -1.2 -1.0 -2.0 -2.3 -2.4 -2.6 -2.7 -2.7 -2.7 -2.3
Contribution from real exchange rate depreciation 0.1 1.8 12.9 -8.5 -4.2 2.0 1.1 0.5 0.1 ... ...Other identified debt-creating flows 0.2 4.1 3.1 2.9 -2.4 -1.0 -0.7 -1.0 -0.3 0.0 0.0
Privatization receipts (negative) 0.0 0.0 0.3 0.0 0.0 0.0 0.0 0.0 0.0 0.0 0.0Recognition of implicit or contingent liabilities 0.0 0.0 0.0 0.0 0.0 0.0 0.0 0.0 0.0 0.0 0.0Debt relief (HIPC and other) 0.0 0.0 0.0 0.0 0.0 0.0 0.0 0.0 0.0 0.0 0.0Other (includes domestic arrears flows) 0.2 4.1 2.8 2.9 -2.4 -1.0 -0.7 -1.0 -0.3 0.0 0.0
Residual, including asset changes -2.5 -0.5 3.6 3.7 -1.8 0.2 -0.3 -0.2 0.5 0.1 -2.6
Other Sustainability IndicatorsPV of public sector debt ... ... 64.5 61.0 57.1 61.7 64.6 65.2 65.7 57.7 44.1
of which: foreign-currency denominated ... ... 46.2 37.0 34.5 39.1 42.6 44.3 44.3 34.9 23.5of which: external ... ... 46.2 37.0 34.5 39.1 42.6 44.3 44.3 34.9 23.5
PV of contingent liabilities (not included in public sector debt) ... ... ... ... ... ... ... ... ... ... ...
Gross financing need 2/ 11.9 12.5 16.0 13.5 18.2 17.5 17.4 16.3 14.7 14.6 14.0PV of public sector debt-to-revenue and grants ratio (in percent) … … 343.8 335.4 330.5 336.2 350.7 344.9 338.5 288.2 230.4PV of public sector debt-to-revenue ratio (in percent) … … 347.6 339.9 345.4 347.5 362.7 356.4 349.3 296.4 236.4
of which: external 3/ … … 248.9 206.3 208.4 220.0 239.1 241.9 235.4 179.7 126.1Debt service-to-revenue and grants ratio (in percent) 4/ 15.9 19.3 26.3 32.9 37.2 35.6 38.7 34.6 33.6 38.6 35.7Debt service-to-revenue ratio (in percent) 4/ 17.4 20.1 26.6 33.4 38.9 36.8 40.0 35.8 34.7 39.7 36.6Primary deficit that stabilizes the debt-to-GDP ratio 3.3 -5.3 -19.7 3.1 9.2 -0.3 0.9 2.0 1.1 1.1 3.6
Key macroeconomic and fiscal assumptions
Real GDP growth (in percent) 5.1 4.7 2.9 6.9 2.3 3.4 4.0 4.5 4.5 4.5 4.5 4.2 5.0 5.0 5.0
Average nominal interest rate on forex debt (in percent) 1.8 3.5 3.9 1.7 1.2 4.8 4.6 4.5 4.4 3.8 3.5 4.3 3.7 3.8 3.9Average real interest rate on domestic debt (in percent) 2.2 8.8 5.6 2.1 4.1 -2.1 2.1 3.3 3.1 3.1 3.7 2.2 6.3 5.1 5.5Real exchange rate depreciation (in percent, + indicates depreciation) 0.8 13.5 65.2 6.5 23.5 -19.9 ... ... ... ... ... ... ... ... ...Inflation rate (GDP deflator, in percent) 9.7 5.4 6.7 9.8 3.4 14.3 7.9 8.1 8.1 7.8 8.0 9.0 5.0 5.0 5.7Growth of real primary spending (deflated by GDP deflator, in percent) 16.0 2.4 16.2 3.5 6.7 -15.5 10.6 8.2 1.7 4.8 1.0 1.8 5.2 1.8 4.4
Grant element of new external borrowing (in percent) ... ... ... … … 15.0 8.1 12.2 7.1 6.1 9.6 9.7 -6.2 -5.5 ...
Sources: Country authorities; and staff estimates and projections.1/ Central government and publicly guaranteed, gross basis.
2/ Gross financing need is defined as the primary deficit plus debt service plus the stock of short-term debt at the end of the last period.
3/ Revenues excluding grants.
4/ Debt service is defined as the sum of interest and amortization of medium and long-term debt.
5/ Historical averages and standard deviations are generally derived over the past 10 years, subject to data availability.
Actual Projections
ZAMBIA
INTERNATIONAL MONETARY FUND 15
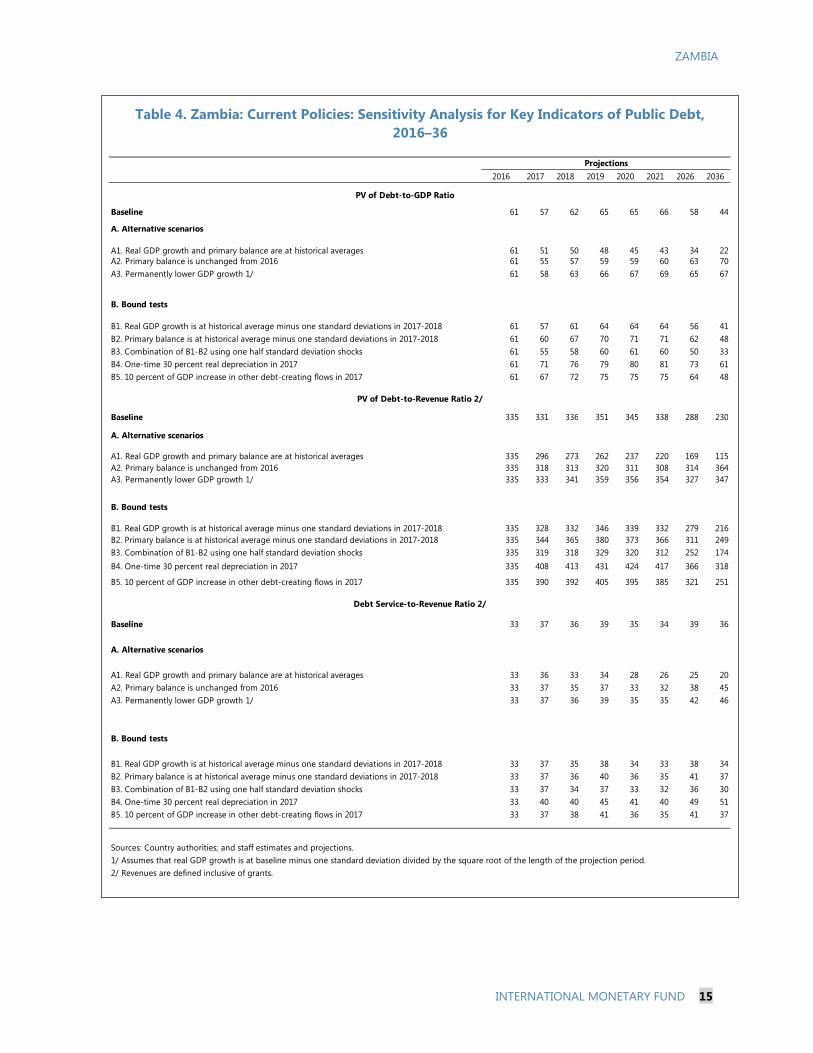
Table 4. Zambia: Current Policies: Sensitivity Analysis for Key Indicators of Public Debt, 2016–36
2016 2017 2018 2019 2020 2021 2026 2036
Baseline 61 57 62 65 65 66 58 44
A. Alternative scenarios
A1. Real GDP growth and primary balance are at historical averages 61 51 50 48 45 43 34 22A2. Primary balance is unchanged from 2016 61 55 57 59 59 60 63 70A3. Permanently lower GDP growth 1/ 61 58 63 66 67 69 65 67
B. Bound tests
B1. Real GDP growth is at historical average minus one standard deviations in 2017-2018 61 57 61 64 64 64 56 41B2. Primary balance is at historical average minus one standard deviations in 2017-2018 61 60 67 70 71 71 62 48B3. Combination of B1-B2 using one half standard deviation shocks 61 55 58 60 61 60 50 33B4. One-time 30 percent real depreciation in 2017 61 71 76 79 80 81 73 61B5. 10 percent of GDP increase in other debt-creating flows in 2017 61 67 72 75 75 75 64 48
Baseline 335 331 336 351 345 338 288 230
A. Alternative scenarios
A1. Real GDP growth and primary balance are at historical averages 335 296 273 262 237 220 169 115A2. Primary balance is unchanged from 2016 335 318 313 320 311 308 314 364A3. Permanently lower GDP growth 1/ 335 333 341 359 356 354 327 347
B. Bound tests
B1. Real GDP growth is at historical average minus one standard deviations in 2017-2018 335 328 332 346 339 332 279 216B2. Primary balance is at historical average minus one standard deviations in 2017-2018 335 344 365 380 373 366 311 249B3. Combination of B1-B2 using one half standard deviation shocks 335 319 318 329 320 312 252 174B4. One-time 30 percent real depreciation in 2017 335 408 413 431 424 417 366 318
B5. 10 percent of GDP increase in other debt-creating flows in 2017 335 390 392 405 395 385 321 251
Baseline 33 37 36 39 35 34 39 36
A. Alternative scenarios
A1. Real GDP growth and primary balance are at historical averages 33 36 33 34 28 26 25 20A2. Primary balance is unchanged from 2016 33 37 35 37 33 32 38 45A3. Permanently lower GDP growth 1/ 33 37 36 39 35 35 42 46
B. Bound tests
B1. Real GDP growth is at historical average minus one standard deviations in 2017-2018 33 37 35 38 34 33 38 34B2. Primary balance is at historical average minus one standard deviations in 2017-2018 33 37 36 40 36 35 41 37B3. Combination of B1-B2 using one half standard deviation shocks 33 37 34 37 33 32 36 30B4. One-time 30 percent real depreciation in 2017 33 40 40 45 41 40 49 51B5. 10 percent of GDP increase in other debt-creating flows in 2017 33 37 38 41 36 35 41 37
Sources: Country authorities; and staff estimates and projections.1/ Assumes that real GDP growth is at baseline minus one standard deviation divided by the square root of the length of the projection period.2/ Revenues are defined inclusive of grants.
PV of Debt-to-GDP Ratio
Projections
PV of Debt-to-Revenue Ratio 2/
Debt Service-to-Revenue Ratio 2/
ZAMBIA
16 INTERNATIONAL MONETARY FUND
Figure 3. Zambia: Adjustment Framework: Indicators of Public and Publicly Guaranteed External Debt under Alternatives Scenarios, 2016–36 1/
Sources: Country authorities; and staff estimates and projections.
1/ The most extreme stress test is the test that yields the highest ratio on or before 2026. In figure b. it corresponds to a Combination shock; in c. to a Exports shock; in d. to a Combination shock; in e. to a Exports shock and in figure f. to a GDP deflator shock
Baseline Historical scenario Most extreme shock 1/ Threshold
-10
0
10
20
30
40
50
2016 2021 2026 2031 2036
f.Debt service-to-revenue ratio
-15
-10
-5
0
5
10
15
20
25
01122334455
2016 2021 2026 2031 2036
Rate of Debt AccumulationGrant-equivalent f inancing (% of GDP)Grant element of new borrowing (% right scale)
a. Debt Accumulation
-100
-50
0
50
100
150
200
250
300
350
2016 2021 2026 2031 2036
c.PV of debt-to-exports ratio
-20
-10
0
10
20
30
40
50
60
70
80
2016 2021 2026 2031 2036
b.PV of debt-to GDP ratio
-100
0
100
200
300
400
500
2016 2021 2026 2031 2036
d.PV of debt-to-revenue ratio
-5
0
5
10
15
20
25
30
35
2016 2021 2026 2031 2036
e.Debt service-to-exports ratio
ZAMBIA
INTERNATIONAL MONETARY FUND 17
Figure 4. Zambia: Adjustment Framework: Indicators of Public Debt under Alternatives Scenarios, 2016–36 1/
Sources: Country authorities; and staff estimates and projections.1/ The most extreme stress test is the test that yields the highest ratio on or before 2026. 2/ Revenues are defined inclusive of grants.
BaselinePublic debt benchmark
Most extreme shock 1/Historical scenario
Fix Primary Balance
0
50
100
150
200
250
300
350
400
450
2016 2018 2020 2022 2024 2026 2028 2030 2032 2034 2036
PV of Debt-to-Revenue Ratio 2/
0
10
20
30
40
50
60
70
80
2016 2018 2020 2022 2024 2026 2028 2030 2032 2034 2036
PV of Debt-to-GDP Ratio
0
10
20
30
40
50
60
2016 2018 2020 2022 2024 2026 2028 2030 2032 2034 2036
Debt Service-to-Revenue Ratio 2/
ZAMBIA
18 INTERNATIONAL MONETARY FUND
Table 5. Zambia: Adjustment Framework: External Debt Sustainability Framework, Baseline Scenario, 2013–36 1/
(Percent of GDP, unless otherwise indicated)
Historical 6/ Standard 6/
Average Deviation 2016-2021 2022-20362013 2014 2015 2016 2017 2018 2019 2020 2021 Average 2026 2036 Average
External debt (nominal) 1/ 20.4 28.2 81.1 80.3 69.5 69.9 68.8 66.9 64.2 51.6 32.9of which: public and publicly guaranteed (PPG) 13.8 20.1 43.1 36.5 33.0 35.4 35.6 35.1 33.9 28.4 19.3
Change in external debt 3.1 7.8 52.9 -0.8 -10.8 0.3 -1.1 -1.9 -2.7 -2.2 -2.7Identified net debt-creating flows -7.0 -13.2 6.3 -7.2 -7.2 -7.5 -9.0 -10.4 -10.6 -7.8 -5.9
Non-interest current account deficit 0.2 -2.8 2.2 -2.6 4.0 2.5 1.0 -0.1 -1.6 -2.4 -2.6 -0.4 0.6 -0.3Deficit in balance of goods and services -2.1 -3.1 3.0 2.6 2.3 1.0 -0.3 -0.9 -1.1 1.1 2.1
Exports 41.4 40.8 38.7 35.2 33.4 35.6 37.4 38.0 39.2 39.2 37.1Imports 39.3 37.7 41.7 37.7 35.7 36.7 37.1 37.1 38.2 40.3 39.1
Net current transfers (negative = inflow) -1.4 -1.1 -1.1 -2.2 1.0 -1.0 -1.8 -1.5 -1.6 -1.6 -1.6 -1.6 -1.5 -1.6of which: official -0.4 -0.2 -0.1 0.0 -0.8 -0.5 -0.5 -0.5 -0.5 -0.5 -0.4
Other current account flows (negative = net inflow) 3.7 1.4 0.3 0.9 0.6 0.4 0.3 0.1 0.1 0.1 0.1Net FDI (negative = inflow) -6.0 -11.8 -5.5 -6.3 3.0 -7.3 -6.3 -6.3 -6.4 -6.3 -6.3 -6.3 -5.8 -6.3Endogenous debt dynamics 2/ -1.2 1.4 9.6 -2.4 -1.9 -1.2 -1.1 -1.7 -1.7 -1.2 -0.7
Contribution from nominal interest rate 0.4 0.7 1.7 0.4 0.7 1.7 2.2 1.9 1.7 1.7 1.3 0.9Contribution from real GDP growth -0.8 -1.0 -1.1 -2.8 -2.6 -2.9 -3.3 -3.6 -3.4 -2.5 -1.6Contribution from price and exchange rate changes -0.8 1.7 8.9 … … … … … … … …
Residual (3-4) 3/ 10.1 21.0 46.7 4.6 -4.8 7.9 8.3 8.7 8.1 5.6 3.2of which: exceptional financing 0.0 0.0 0.0 0.0 0.0 0.0 0.0 0.0 0.0 0.0 0.0
PV of external debt 4/ ... ... 83.6 80.8 70.8 71.0 70.2 67.9 65.1 52.0 33.1In percent of exports ... ... 216.0 229.8 212.0 199.2 187.8 178.8 165.9 132.6 89.2
PV of PPG external debt ... ... 45.6 37.0 34.3 36.6 37.0 36.1 34.7 28.8 19.5In percent of exports ... ... 117.7 105.2 102.7 102.6 99.0 95.0 88.6 73.6 52.5In percent of government revenues ... ... 245.4 206.3 207.4 206.3 208.2 196.0 183.7 149.5 105.1
Debt service-to-exports ratio (in percent) 2.8 6.5 8.0 9.8 9.6 8.7 9.8 8.4 8.0 9.2 8.6PPG debt service-to-exports ratio (in percent) 1.7 2.4 4.8 7.6 6.8 6.4 7.6 6.2 5.9 7.3 7.0PPG debt service-to-revenue ratio (in percent) 4.4 5.3 9.9 14.9 13.7 13.0 16.0 12.9 12.3 14.9 14.1Total gross financing need (Billions of U.S. dollars) -1.2 -3.1 0.1 -0.1 -0.4 -0.7 -1.1 -1.5 -1.7 -1.3 -1.9Non-interest current account deficit that stabilizes debt ratio -2.9 -10.6 -50.7 3.3 11.8 -0.4 -0.5 -0.5 0.1 1.8 3.3
Key macroeconomic assumptions
Real GDP growth (in percent) 5.1 4.7 2.9 6.9 2.3 3.4 4.0 4.5 5.0 5.5 5.5 4.6 5.0 5.0 5.0GDP deflator in US dollar terms (change in percent) 4.7 -7.5 -24.0 4.4 19.7 -4.4 17.1 3.0 0.4 0.4 1.2 2.9 3.1 3.1 3.0Effective interest rate (percent) 5/ 2.6 3.2 4.8 2.9 1.8 2.7 2.9 2.7 2.7 2.6 2.5 2.7 2.7 2.9 2.9Growth of exports of G&S (US dollar terms, in percent) 10.4 -4.6 -25.7 14.3 28.8 -10.1 15.6 14.8 10.5 7.7 10.2 8.1 8.2 5.0 7.7Growth of imports of G&S (US dollar terms, in percent) 18.9 -7.0 -13.4 15.4 22.5 -10.6 15.1 10.6 6.5 6.0 9.8 6.2 8.2 5.0 8.3Grant element of new public sector borrowing (in percent) ... ... ... ... ... 15.0 13.7 22.6 16.8 19.0 20.8 18.0 -4.7 -9.1 -5.5Government revenues (excluding grants, in percent of GDP) 16.2 18.1 18.6 17.9 16.5 17.7 17.8 18.4 18.9 19.3 18.5 19.3Aid flows (in Billions of US dollars) 7/ 0.4 0.2 0.4 0.5 0.8 1.0 0.7 0.7 0.7 0.7 0.8
of which: Grants 0.4 0.2 0.0 0.1 0.2 0.2 0.2 0.2 0.2 0.3 0.5of which: Concessional loans 0.0 0.0 0.4 0.4 0.6 0.9 0.6 0.5 0.5 0.4 0.3
Grant-equivalent financing (in percent of GDP) 8/ ... ... ... 0.9 1.4 1.8 1.2 1.1 1.1 0.4 0.3 0.4Grant-equivalent financing (in percent of external financing) 8/ ... ... ... 19.8 24.7 30.7 28.6 34.0 36.5 10.4 13.2 12.0
Memorandum items:Nominal GDP (Billions of US dollars) 28.0 27.2 21.2 21.0 25.6 27.5 29.0 30.7 32.8 48.0 106.0Nominal dollar GDP growth 10.0 -3.2 -21.8 10.0 -3.2 -21.8 -1.1 21.7 7.6 5.9 8.2 8.2 8.1PV of PPG external debt (in Billions of US dollars) 7.6 8.1 9.0 9.9 10.4 10.8 11.2 13.7 20.4(PVt-PVt-1)/GDPt-1 (in percent) 2.3 4.3 3.3 2.1 1.3 1.1 2.4 1.3 0.2 1.2Gross workers' remittances (Billions of US dollars) 0.0 0.0 0.0 0.0 0.0 0.0 0.0 0.0 0.0 0.0 0.0PV of PPG external debt (in percent of GDP + remittances) ... ... 45.6 37.0 34.3 36.6 37.0 36.1 34.7 28.8 19.4PV of PPG external debt (in percent of exports + remittances) ... ... 117.7 105.1 102.6 102.5 98.9 95.0 88.5 73.6 52.5Debt service of PPG external debt (in percent of exports + remittance ... ... 4.8 7.6 6.8 6.4 7.6 6.2 5.9 7.3 7.0
Sources: Country authorities; and staff estimates and projections. 01/ Includes both public and private sector external debt.2/ Derived as [r - g - ρ(1+g)]/(1+g+ρ+gρ) times previous period debt ratio, with r = nominal interest rate; g = real GDP growth rate, and ρ = growth rate of GDP deflator in U.S. dollar terms.
4/ Assumes that PV of private sector debt is equivalent to its face value.5/ Current-year interest payments divided by previous period debt stock. 6/ Historical averages and standard deviations are generally derived over the past 10 years, subject to data availability. 7/ Defined as grants, concessional loans, and debt relief.8/ Grant-equivalent financing includes grants provided directly to the government and through new borrowing (difference between the face value and the PV of new debt).
Actual Projections
3/ Includes exceptional financing (i.e., changes in arrears and debt relief); changes in gross foreign assets; and valuation adjustments. For projections also includes contribution from price and exchange rate changes. The large residual in 2015 is manily due to the large increase in private sector debt which reflects an increase in the survey coverage of firms (from 32 to 250) but this change in debt does not appear to be capture in the BOP flows for 2015.
ZAMBIA
INTERNATIONAL MONETARY FUND 19
Table 6. Zambia: Adjustment Framework: Sensitivity Analysis for Key Indicators of Public and Publicly Guaranteed External Debt, 2016–36
(Percent)
2016 2017 2018 2019 2020 2021 2026 2036
Baseline 37 34 37 37 36 35 29 19
A. Alternative Scenarios
A1. Key variables at their historical averages in 2016-2036 1/ 37 34 32 29 27 25 10 -13A2. New public sector loans on less favorable terms in 2016-2036 2/ 37 36 38 39 39 38 35 29
B. Bound Tests
B1. Real GDP growth at historical average minus one standard deviation in 2017-2018 37 35 36 36 35 34 28 19B2. Export value growth at historical average minus one standard deviation in 2017-2018 3/ 37 44 61 61 60 58 46 23B3. US dollar GDP deflator at historical average minus one standard deviation in 2017-2018 37 49 60 61 59 57 48 32B4. Net non-debt creating flows at historical average minus one standard deviation in 2017-2018 4/ 37 39 43 43 42 41 33 20B5. Combination of B1-B4 using one-half standard deviation shocks 37 52 72 72 71 69 55 29B6. One-time 30 percent nominal depreciation relative to the baseline in 2017 5/ 37 47 48 49 47 46 38 26
Baseline 105 103 103 99 95 89 74 52
A. Alternative Scenarios
A1. Key variables at their historical averages in 2016-2036 1/ 105 101 89 79 71 63 25 -35A2. New public sector loans on less favorable terms in 2016-2036 2/ 105 109 107 104 102 97 90 79
B. Bound Tests
B1. Real GDP growth at historical average minus one standard deviation in 2017-2018 105 106 101 97 93 87 73 52B2. Export value growth at historical average minus one standard deviation in 2017-2018 3/ 105 178 309 295 285 269 214 112B3. US dollar GDP deflator at historical average minus one standard deviation in 2017-2018 105 106 101 97 93 87 73 52B4. Net non-debt creating flows at historical average minus one standard deviation in 2017-2018 4/ 105 116 120 115 110 103 85 55B5. Combination of B1-B4 using one-half standard deviation shocks 105 147 204 195 189 178 142 79B6. One-time 30 percent nominal depreciation relative to the baseline in 2017 5/ 105 106 101 97 93 87 73 52
Baseline 206 207 206 208 196 184 149 105
A. Alternative Scenarios
A1. Key variables at their historical averages in 2016-2036 1/ 206 203 180 166 146 130 51 -70A2. New public sector loans on less favorable terms in 2016-2036 2/ 206 220 215 219 210 200 182 159
B. Bound Tests
B1. Real GDP growth at historical average minus one standard deviation in 2017-2018 206 212 201 201 190 178 147 103B2. Export value growth at historical average minus one standard deviation in 2017-2018 3/ 206 266 343 342 324 308 239 124B3. US dollar GDP deflator at historical average minus one standard deviation in 2017-2018 206 295 341 342 322 303 249 175B4. Net non-debt creating flows at historical average minus one standard deviation in 2017-2018 4/ 206 235 241 241 228 215 172 109B5. Combination of B1-B4 using one-half standard deviation shocks 206 313 405 405 384 364 285 156B6. One-time 30 percent nominal depreciation relative to the baseline in 2017 5/ 206 287 272 273 257 242 199 139
PV of debt-to GDP ratio
Projections
PV of debt-to-exports ratio
PV of debt-to-revenue ratio
ZAMBIA
20 INTERNATIONAL MONETARY FUND
Table 6. Zambia: Adjustment Framework: Sensitivity Analysis for Key Indicators of Public and Publicly Guaranteed External Debt, 2016–36 (concluded)
(Percent)
2016 2017 2018 2019 2020 2021 2026 2036
Baseline 8 7 6 8 6 6 7 7
A. Alternative Scenarios
A1. Key variables at their historical averages in 2016-2036 1/ 8 8 7 6 6 5 5 0A2. New public sector loans on less favorable terms in 2016-2036 2/ 8 7 7 7 7 7 10 10
B. Bound Tests
B1. Real GDP growth at historical average minus one standard deviation in 2017-2018 8 7 7 7 7 6 9 8B2. Export value growth at historical average minus one standard deviation in 2017-2018 3/ 8 10 15 19 18 17 28 17B3. US dollar GDP deflator at historical average minus one standard deviation in 2017-2018 8 7 7 7 7 6 9 8B4. Net non-debt creating flows at historical average minus one standard deviation in 2017-2018 4/ 8 7 7 8 8 7 11 8B5. Combination of B1-B4 using one-half standard deviation shocks 8 8 11 13 12 12 18 12B6. One-time 30 percent nominal depreciation relative to the baseline in 2017 5/ 8 7 7 7 7 6 9 8
Baseline 15 14 13 16 13 12 15 14
A. Alternative Scenarios
A1. Key variables at their historical averages in 2016-2036 1/ 15 16 14 14 12 10 10 0A2. New public sector loans on less favorable terms in 2016-2036 2/ 15 15 13 15 15 14 21 20
B. Bound Tests
B1. Real GDP growth at historical average minus one standard deviation in 2017-2018 15 14 14 15 14 13 19 15B2. Export value growth at historical average minus one standard deviation in 2017-2018 3/ 15 15 16 22 21 20 31 19B3. US dollar GDP deflator at historical average minus one standard deviation in 2017-2018 15 20 24 26 24 23 31 26B4. Net non-debt creating flows at historical average minus one standard deviation in 2017-2018 4/ 15 15 15 17 16 15 22 16B5. Combination of B1-B4 using one-half standard deviation shocks 15 18 21 27 25 24 37 23B6. One-time 30 percent nominal depreciation relative to the baseline in 2017 5/ 15 20 19 21 19 18 25 21
Memorandum item:Grant element assumed on residual financing (i.e., financing required above baseline) 6/ -1 -1 -1 -1 -1 -1 -1 -1
Sources: Country authorities; and staff estimates and projections.
1/ Variables include real GDP growth, growth of GDP deflator (in U.S. dollar terms), non-interest current account in percent of GDP, and non-debt creating flows.
an offsetting adjustment in import levels). 4/ Includes official and private transfers and FDI.5/ Depreciation is defined as percentage decline in dollar/local currency rate, such that it never exceeds 100 percent.6/ Applies to all stress scenarios except for A2 (less favorable financing) in which the terms on all new financing are as specified in footnote 2.
2/ Assumes that the interest rate on new borrowing is by 2 percentage points higher than in the baseline., while grace and maturity periods are the same as in the baseline.
3/ Exports values are assumed to remain permanently at the lower level, but the current account as a share of GDP is assumed to return to its baseline level after the shock (implicitly assuming
Debt service-to-exports ratio
( p )
Debt service-to-revenue ratio
Projections
ZAMBIA
INTERNATIONAL MONETARY FUND 21
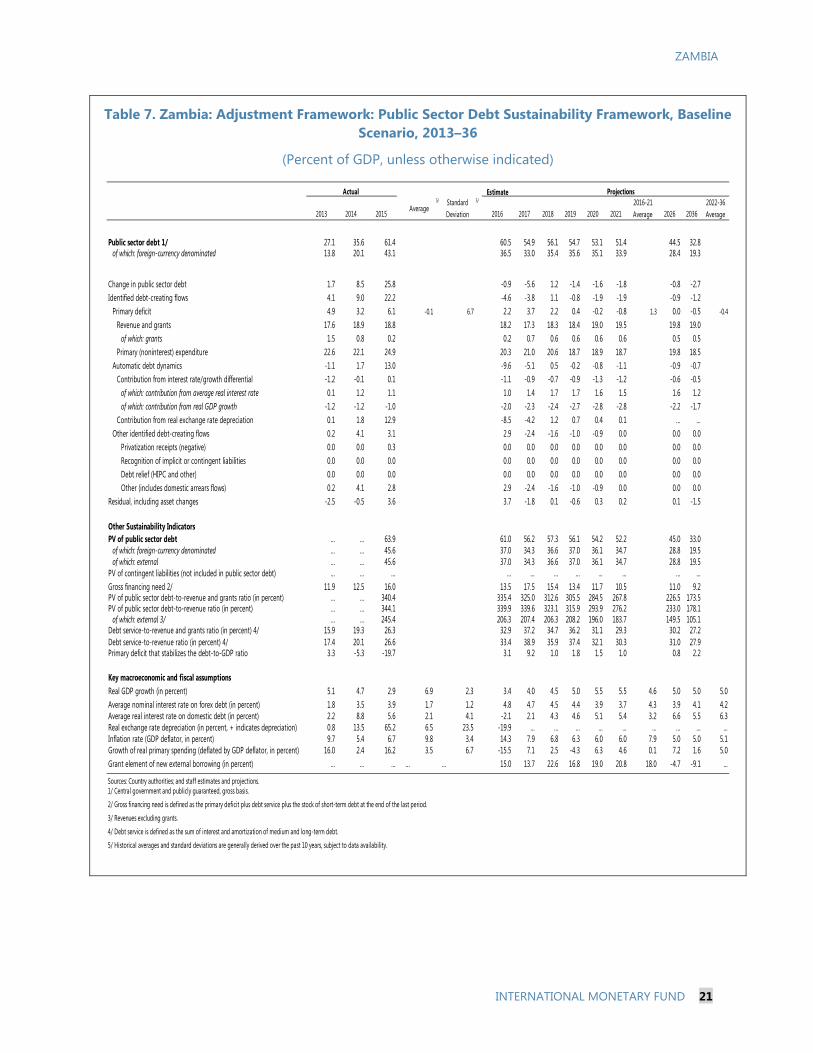
Table 7. Zambia: Adjustment Framework: Public Sector Debt Sustainability Framework, Baseline Scenario, 2013–36
(Percent of GDP, unless otherwise indicated)
Estimate
2013 2014 2015Average
5/ Standard Deviation
5/
2016 2017 2018 2019 2020 20212016-21 Average 2026 2036
2022-36 Average
Public sector debt 1/ 27.1 35.6 61.4 60.5 54.9 56.1 54.7 53.1 51.4 44.5 32.8of which: foreign-currency denominated 13.8 20.1 43.1 36.5 33.0 35.4 35.6 35.1 33.9 28.4 19.3
Change in public sector debt 1.7 8.5 25.8 -0.9 -5.6 1.2 -1.4 -1.6 -1.8 -0.8 -2.7Identified debt-creating flows 4.1 9.0 22.2 -4.6 -3.8 1.1 -0.8 -1.9 -1.9 -0.9 -1.2
Primary deficit 4.9 3.2 6.1 -0.1 6.7 2.2 3.7 2.2 0.4 -0.2 -0.8 1.3 0.0 -0.5 -0.4
Revenue and grants 17.6 18.9 18.8 18.2 17.3 18.3 18.4 19.0 19.5 19.8 19.0of which: grants 1.5 0.8 0.2 0.2 0.7 0.6 0.6 0.6 0.6 0.5 0.5
Primary (noninterest) expenditure 22.6 22.1 24.9 20.3 21.0 20.6 18.7 18.9 18.7 19.8 18.5Automatic debt dynamics -1.1 1.7 13.0 -9.6 -5.1 0.5 -0.2 -0.8 -1.1 -0.9 -0.7
Contribution from interest rate/growth differential -1.2 -0.1 0.1 -1.1 -0.9 -0.7 -0.9 -1.3 -1.2 -0.6 -0.5of which: contribution from average real interest rate 0.1 1.2 1.1 1.0 1.4 1.7 1.7 1.6 1.5 1.6 1.2of which: contribution from real GDP growth -1.2 -1.2 -1.0 -2.0 -2.3 -2.4 -2.7 -2.8 -2.8 -2.2 -1.7
Contribution from real exchange rate depreciation 0.1 1.8 12.9 -8.5 -4.2 1.2 0.7 0.4 0.1 ... ...Other identified debt-creating flows 0.2 4.1 3.1 2.9 -2.4 -1.6 -1.0 -0.9 0.0 0.0 0.0
Privatization receipts (negative) 0.0 0.0 0.3 0.0 0.0 0.0 0.0 0.0 0.0 0.0 0.0Recognition of implicit or contingent liabilities 0.0 0.0 0.0 0.0 0.0 0.0 0.0 0.0 0.0 0.0 0.0Debt relief (HIPC and other) 0.0 0.0 0.0 0.0 0.0 0.0 0.0 0.0 0.0 0.0 0.0Other (includes domestic arrears flows) 0.2 4.1 2.8 2.9 -2.4 -1.6 -1.0 -0.9 0.0 0.0 0.0
Residual, including asset changes -2.5 -0.5 3.6 3.7 -1.8 0.1 -0.6 0.3 0.2 0.1 -1.5
Other Sustainability IndicatorsPV of public sector debt ... ... 63.9 61.0 56.2 57.3 56.1 54.2 52.2 45.0 33.0
of which: foreign-currency denominated ... ... 45.6 37.0 34.3 36.6 37.0 36.1 34.7 28.8 19.5of which: external ... ... 45.6 37.0 34.3 36.6 37.0 36.1 34.7 28.8 19.5
PV of contingent liabilities (not included in public sector debt) ... ... ... ... ... ... ... ... ... ... ...Gross financing need 2/ 11.9 12.5 16.0 13.5 17.5 15.4 13.4 11.7 10.5 11.0 9.2PV of public sector debt-to-revenue and grants ratio (in percent) … … 340.4 335.4 325.0 312.6 305.5 284.5 267.8 226.5 173.5PV of public sector debt-to-revenue ratio (in percent) … … 344.1 339.9 339.6 323.1 315.9 293.9 276.2 233.0 178.1
of which: external 3/ … … 245.4 206.3 207.4 206.3 208.2 196.0 183.7 149.5 105.1Debt service-to-revenue and grants ratio (in percent) 4/ 15.9 19.3 26.3 32.9 37.2 34.7 36.2 31.1 29.3 30.2 27.2Debt service-to-revenue ratio (in percent) 4/ 17.4 20.1 26.6 33.4 38.9 35.9 37.4 32.1 30.3 31.0 27.9Primary deficit that stabilizes the debt-to-GDP ratio 3.3 -5.3 -19.7 3.1 9.2 1.0 1.8 1.5 1.0 0.8 2.2
Key macroeconomic and fiscal assumptionsReal GDP growth (in percent) 5.1 4.7 2.9 6.9 2.3 3.4 4.0 4.5 5.0 5.5 5.5 4.6 5.0 5.0 5.0Average nominal interest rate on forex debt (in percent) 1.8 3.5 3.9 1.7 1.2 4.8 4.7 4.5 4.4 3.9 3.7 4.3 3.9 4.1 4.2Average real interest rate on domestic debt (in percent) 2.2 8.8 5.6 2.1 4.1 -2.1 2.1 4.3 4.6 5.1 5.4 3.2 6.6 5.5 6.3Real exchange rate depreciation (in percent, + indicates depreciation) 0.8 13.5 65.2 6.5 23.5 -19.9 ... ... ... ... ... ... ... ... ...Inflation rate (GDP deflator, in percent) 9.7 5.4 6.7 9.8 3.4 14.3 7.9 6.8 6.3 6.0 6.0 7.9 5.0 5.0 5.1Growth of real primary spending (deflated by GDP deflator, in percent) 16.0 2.4 16.2 3.5 6.7 -15.5 7.1 2.5 -4.3 6.3 4.6 0.1 7.2 1.6 5.0Grant element of new external borrowing (in percent) ... ... ... … … 15.0 13.7 22.6 16.8 19.0 20.8 18.0 -4.7 -9.1 ...
Sources: Country authorities; and staff estimates and projections.1/ Central government and publicly guaranteed, gross basis.
2/ Gross financing need is defined as the primary deficit plus debt service plus the stock of short-term debt at the end of the last period.
3/ Revenues excluding grants.
4/ Debt service is defined as the sum of interest and amortization of medium and long-term debt.
5/ Historical averages and standard deviations are generally derived over the past 10 years, subject to data availability.
Actual Projections
ZAMBIA
22 INTERNATIONAL MONETARY FUND
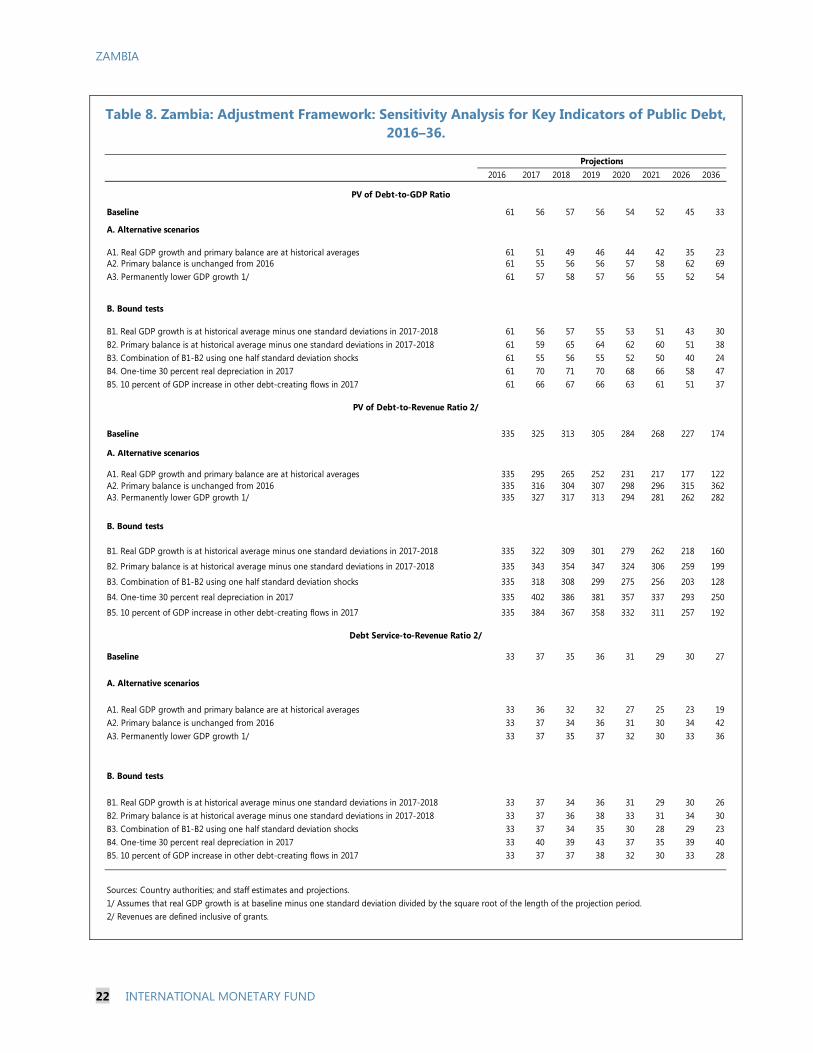
Table 8. Zambia: Adjustment Framework: Sensitivity Analysis for Key Indicators of Public Debt, 2016–36.
2016 2017 2018 2019 2020 2021 2026 2036
Baseline 61 56 57 56 54 52 45 33
A. Alternative scenarios
A1. Real GDP growth and primary balance are at historical averages 61 51 49 46 44 42 35 23A2. Primary balance is unchanged from 2016 61 55 56 56 57 58 62 69A3. Permanently lower GDP growth 1/ 61 57 58 57 56 55 52 54
B. Bound tests
B1. Real GDP growth is at historical average minus one standard deviations in 2017-2018 61 56 57 55 53 51 43 30B2. Primary balance is at historical average minus one standard deviations in 2017-2018 61 59 65 64 62 60 51 38B3. Combination of B1-B2 using one half standard deviation shocks 61 55 56 55 52 50 40 24B4. One-time 30 percent real depreciation in 2017 61 70 71 70 68 66 58 47B5. 10 percent of GDP increase in other debt-creating flows in 2017 61 66 67 66 63 61 51 37
Baseline 335 325 313 305 284 268 227 174
A. Alternative scenarios
A1. Real GDP growth and primary balance are at historical averages 335 295 265 252 231 217 177 122A2. Primary balance is unchanged from 2016 335 316 304 307 298 296 315 362A3. Permanently lower GDP growth 1/ 335 327 317 313 294 281 262 282
B. Bound tests
B1. Real GDP growth is at historical average minus one standard deviations in 2017-2018 335 322 309 301 279 262 218 160
B2. Primary balance is at historical average minus one standard deviations in 2017-2018 335 343 354 347 324 306 259 199
B3. Combination of B1-B2 using one half standard deviation shocks 335 318 308 299 275 256 203 128
B4. One-time 30 percent real depreciation in 2017 335 402 386 381 357 337 293 250
B5. 10 percent of GDP increase in other debt-creating flows in 2017 335 384 367 358 332 311 257 192
Baseline 33 37 35 36 31 29 30 27
A. Alternative scenarios
A1. Real GDP growth and primary balance are at historical averages 33 36 32 32 27 25 23 19A2. Primary balance is unchanged from 2016 33 37 34 36 31 30 34 42A3. Permanently lower GDP growth 1/ 33 37 35 37 32 30 33 36
B. Bound tests
B1. Real GDP growth is at historical average minus one standard deviations in 2017-2018 33 37 34 36 31 29 30 26B2. Primary balance is at historical average minus one standard deviations in 2017-2018 33 37 36 38 33 31 34 30B3. Combination of B1-B2 using one half standard deviation shocks 33 37 34 35 30 28 29 23B4. One-time 30 percent real depreciation in 2017 33 40 39 43 37 35 39 40B5. 10 percent of GDP increase in other debt-creating flows in 2017 33 37 37 38 32 30 33 28
Sources: Country authorities; and staff estimates and projections.1/ Assumes that real GDP growth is at baseline minus one standard deviation divided by the square root of the length of the projection period.2/ Revenues are defined inclusive of grants.
PV of Debt-to-GDP Ratio
Projections
PV of Debt-to-Revenue Ratio 2/
Debt Service-to-Revenue Ratio 2/