zabbix – accessible solution for it infrastructure … · zabbix is a comprehensive open-source...
TRANSCRIPT
Zabbix is a comprehensive open-source software solution for monitoring the availability and performance of IT infrastructure accessible for free.
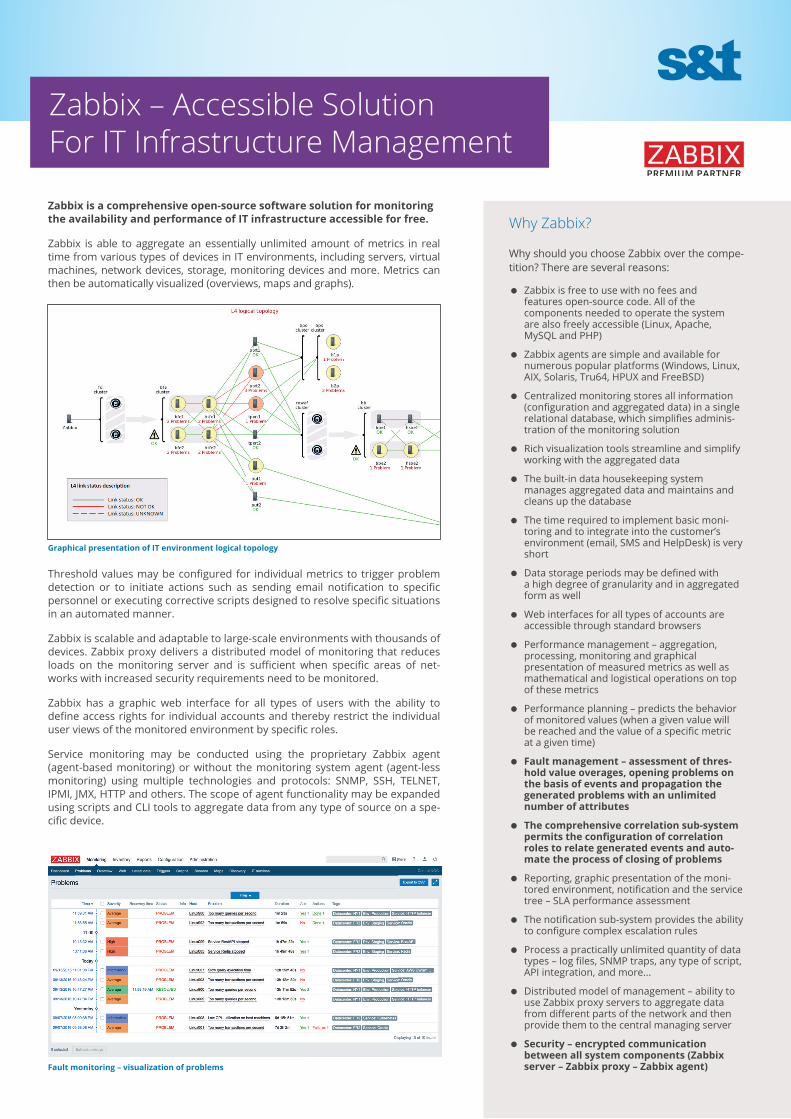
Zabbix is able to aggregate an essentially unlimited amount of metrics in real time from various types of devices in IT environments, including servers, virtual machines, network devices, storage, monitoring devices and more. Metrics can then be automatically visualized (overviews, maps and graphs).
Threshold values may be confi gured for individual metrics to trigger problem detection or to initiate actions such as sending email notifi cation to specifi c personnel or executing corrective scripts designed to resolve specifi c situations in an automated manner.
Zabbix is scalable and adaptable to large-scale environments with thousands of devices. Zabbix proxy delivers a distributed model of monitoring that reduces loads on the monitoring server and is suffi cient when specifi c areas of net-works with increased security requirements need to be monitored.
Zabbix has a graphic web interface for all types of users with the ability to defi ne access rights for individual accounts and thereby restrict the individual user views of the monitored environment by specifi c roles.
Service monitoring may be conducted using the proprietary Zabbix agent (agent-based monitoring) or without the monitoring system agent (agent-less monitoring) using multiple technologies and protocols: SNMP, SSH, TELNET, IPMI, JMX, HTTP and others. The scope of agent functionality may be expanded using scripts and CLI tools to aggregate data from any type of source on a spe-cifi c device.
Zabbix – Accessible SolutionFor IT Infrastructure Management
Why Zabbix?
Why should you choose Zabbix over the compe-tition? There are several reasons:
Zabbix is free to use with no fees and features open-source code. All of the components needed to operate the system are also freely accessible (Linux, Apache, MySQL and PHP)
Zabbix agents are simple and available for numerous popular platforms (Windows, Linux, AIX, Solaris, Tru64, HPUX and FreeBSD)
Centralized monitoring stores all information (confi guration and aggregated data) in a single relational database, which simplifi es adminis-tration of the monitoring solution
Rich visualization tools streamline and simplify working with the aggregated data
The built-in data housekeeping system manages aggregated data and maintains and cleans up the database
The time required to implement basic moni-toring and to integrate into the customer’s environment (email, SMS and HelpDesk) is very short
Data storage periods may be defi ned with a high degree of granularity and in aggregated form as well
Web interfaces for all types of accounts are accessible through standard browsers
Performance management – aggregation, processing, monitoring and graphical presentation of measured metrics as well as mathematical and logistical operations on top of these metrics
Performance planning – predicts the behavior of monitored values (when a given value will be reached and the value of a specifi c metric at a given time)
Fault management – assessment of thres-hold value overages, opening problems on the basis of events and propagation the generated problems with an unlimited number of attributes
The comprehensive correlation sub-system permits the confi guration of correlation roles to relate generated events and auto-mate the process of closing of problems
Reporting, graphic presentation of the moni-tored environment, notifi cation and the service tree – SLA performance assessment
The notifi cation sub-system provides the ability to confi gure complex escalation rules
Process a practically unlimited quantity of data types – log fi les, SNMP traps, any type of script, API integration, and more...
Distributed model of management – ability to use Zabbix proxy servers to aggregate data from diff erent parts of the network and then provide them to the central managing server
Security – encrypted communication between all system components (Zabbix server – Zabbix proxy – Zabbix agent)Fault monitoring – visualization of problems
Graphical presentation of IT environment logical topology
Why Zabbix from S&T?S&T has years of experience in the implementation of IT infrastruc-ture management solutions for extensive environments with a lar-ge number of servers, active network elements and devices. Zabbix is a part of a diverse portfolio of solutions provided as a service or on-premises implementation in the customer’s environment.
S&T is a certified Zabbix partner, and is the first and currently the only company in Slovakia to hold its highest Premium Partner certificate.
S&T offers up the services of its team of Zabbix Certified Professional consultants, the highest level of personal certification available.
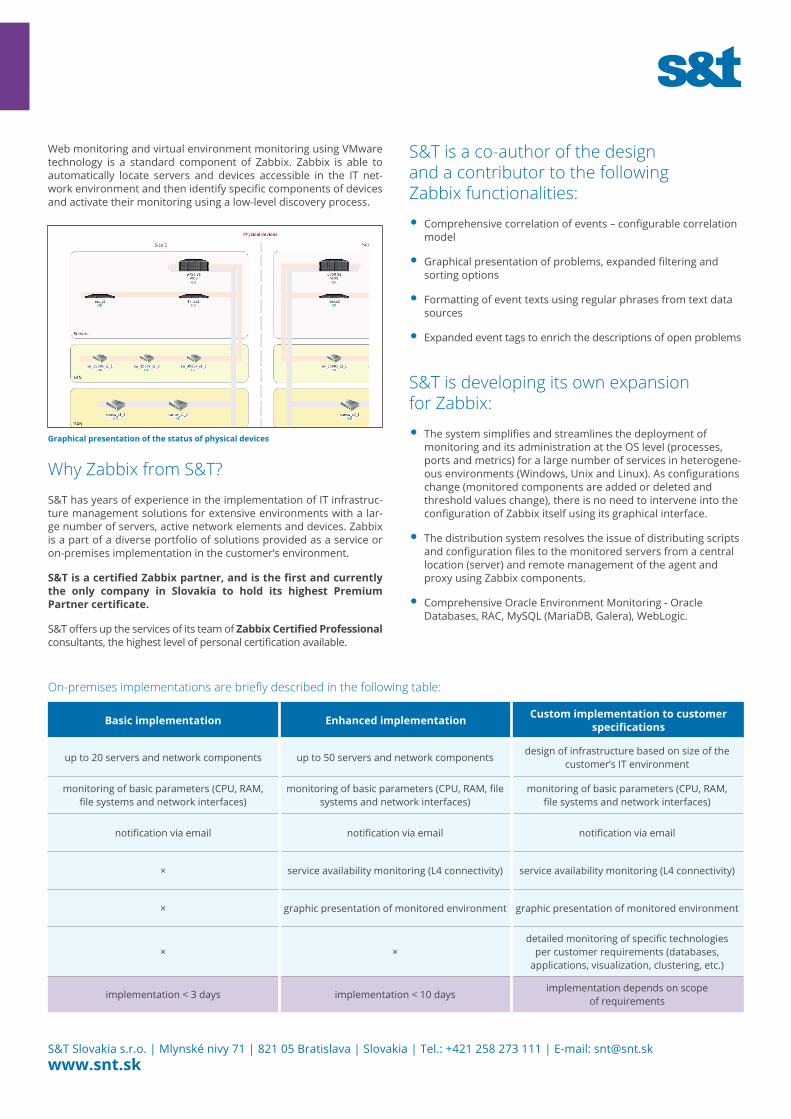
Web monitoring and virtual environment monitoring using VMware technology is a standard component of Zabbix. Zabbix is able to automatically locate servers and devices accessible in the IT net-work environment and then identify specific components of devices and activate their monitoring using a low-level discovery process.
Graphical presentation of the status of physical devices
S&T is a co-author of the design and a contributor to the following Zabbix functionalities:
Comprehensive correlation of events – configurable correlation model
Graphical presentation of problems, expanded filtering and sorting options
Formatting of event texts using regular phrases from text data sources
Expanded event tags to enrich the descriptions of open problems
S&T is developing its own expansion for Zabbix:
The system simplifies and streamlines the deployment of monitoring and its administration at the OS level (processes, ports and metrics) for a large number of services in heterogene-ous environments (Windows, Unix and Linux). As configurations change (monitored components are added or deleted and threshold values change), there is no need to intervene into the configuration of Zabbix itself using its graphical interface.
The distribution system resolves the issue of distributing scripts and configuration files to the monitored servers from a central location (server) and remote management of the agent and proxy using Zabbix components.
Comprehensive Oracle Environment Monitoring - Oracle Databases, RAC, MySQL (MariaDB, Galera), WebLogic.
On-premises implementations are briefly described in the following table:
Basic implementation Enhanced implementation Custom implementation to customer specifications
up to 20 servers and network components up to 50 servers and network componentsdesign of infrastructure based on size of the
customer’s IT environment
monitoring of basic parameters (CPU, RAM, file systems and network interfaces)
monitoring of basic parameters (CPU, RAM, file systems and network interfaces)
monitoring of basic parameters (CPU, RAM, file systems and network interfaces)
notification via email notification via email notification via email
× service availability monitoring (L4 connectivity) service availability monitoring (L4 connectivity)
× graphic presentation of monitored environment graphic presentation of monitored environment
× ×detailed monitoring of specific technologies
per customer requirements (databases, applications, visualization, clustering, etc.)
implementation < 3 days implementation < 10 daysimplementation depends on scope
of requirements
S&T Slovakia s.r.o. | Mlynské nivy 71 | 821 05 Bratislava | Slovakia | Tel.: +421 258 273 111 | E-mail: [email protected]