z beta s.à.r.l. consolidated financial statements for the
TRANSCRIPT
Z Beta S.à.r.l. CONSOLIDATED FINANCIAL STATEMENTS For the years ended December 31, 2012 and 2011

2
3
CONTENTS page
5
15
17
22
Audit Report
Business Rewiew 2012
Consolidated Financial Statement for the year endend December 31, 2012
Notes to Consolidated Financial Statement for the year endend December 31, 2012

4
Z Beta S.à.r.l.
BUSINESS REVIEW 2012
5
BUSINESS REVIEW 2012
Principal Activities
We are the leading global supplier of air care and insecticide devices by revenue. We primarily sell our products to blue chip fast-moving consumer goods (“FMCG”) companies, and the average length of our relationships with our key customers is 24 years. We operate as a “one-stop-shop,” offering customers global solutions and services covering the entire value chain from product innovation and development to manufacturing and delivery. We leverage a common technology platform relating to dispensing devices, such as electric plug-ins and powered aerosol devices, across our product categories. Historically, we have grown our business and increased profits through our wide range of products, long-standing customer relationships, strong product innovation and development capabilities and our global industrial footprint. We have manufacturing plants in Mexico, China, Italy, Bulgaria, Brazil and India.
Economy and market conditions
The end markets for our Air Care Products and Insecticide Products have been proven in the past years to be resilient during the global downturn as a result of the relatively low price points of such products in the retail end markets and, in the case of Insecticide Products, the relatively non-discretionary nature of such products. According to Euromonitor, the global air care and insecticide markets that make up Zobele’s addressable markets was planned to grow at approximately 10.4% and 10.8%, respectively, during 2012, although at different rates in the different regions (flat market in Europe, double digit growth in North America and Asia). During the same period, our net sales of Air Care Products and Insecticide Products grew at rates of 14.0% and 2.4%, respectively. We have significantly exceeded the overall air care market growth as a result of our entry into new sub-categories of Air Care Products (with existing customers) and our expansion (with our customers) into higher growth emerging markets however we have underperformed the global growth in Insecticides Products because of our significant exposure to Europe (region with flat growth) for this product category. Our relentless focus on products innovation, on customer service, and on investment in our people, together with the execution of the strategic initiatives defined together with our Board, will provide a solid platform for profitable growth.
Results 2012
Highlights from the Group’s financial performance for the year 2012 in comparison with the previous full year were as follows:
Trading Performance
Sales
Sales for the year 2012 were €337,6 million, an increase of €24,3 million, or 7.8% compared to 2011. This sales growth came largely through strong growth in orders from Global FMCG customers who were able to perform well in our product categories despite the uncertain world economic conditions. Global FMCG customers category represented 81.1% of total sales and this sales category recorded a growth of 10.3% during the year. The growth came largely through strong demand for air freshener devices across global markets, driven by the success of various key products launched by our customers in these markets. The growth in Global FMCG customer sales was partially offset by a decline in volumes sold to Regional FMCG and Retailer customers of 2.2%, mainly reflecting a difficult market in Europe during 2012 in these business areas.
In milion of Euro 2012 2011 ∆∆∆∆ ∆∆∆∆%
2012/2011 2012/2011
Net Sales 337.6 313.3 24.3 7.8%
EBITDA before non-recurring transactions 43.0 40.4 2.6 6.4%
EBITDA before non-recurring transactions % 12.7% 12.9%
Net Financial Position (138.0) (153.8) (15.8) -10.3%
Z Beta S.à.r.l.
BUSINESS REVIEW 2012
6
EBITDA before non-recurring transactions
EBITDA before non-recurring transactions increased by €2,6 million during 2012. The higher level of EBITDA before non-recurring transactions reflects the higher sales volumes, net of the impact of capitalization of Research & Development costs in line with the implementation of IAS 38, for €3,6 million. During the year, profitability was impacted by product mix, an increased weighting of Global FMCG sales, and some industrial inefficiencies in the first part of the year, occurring mainly in the Mexico plant.
Net Financial Position
The Group’s Net Financial Position improved by €15,8 million during 2012 and at 31 December was €138,0 million compared to €153,8 million at 31 December 2011. This improvement came through a strong focus on cash generation, and strong attention to the detail of Working Capital management at operational level, with particular attention and success in the reduction of inventory levels in our plants. In 2012, the Group generated €10,0 million from Working Capital compared to a consumption of €8.6 million in 2011. The Net Financial Position was also positively impacted by the injection of €10 million as equity from the Group’s shareholders during 2012.
Strategy
The four components of the Group’s strategy have continued to remain a major focus during 2012. The development of our strategy during 2012 in these areas can be summarized as follows:
Continue to grow our product categories.
We have continued to grow our share of the market in our core product categories by driving further product innovation, leveraging our previous successful product launches to expand our product portfolios with our existing customers and improving our customer service levels. In addition, we have captured growth resulting from the continued globalization of the FMCG market and the focus by our global FMCG customers on consolidating their suppliers, out-sourcing and product innovation.
These strategic factors have been seen in our successful development of sales with global FMCG customers during 2012. Overall, total sales to these customers increased from €247,9 million in 2011 to €273,6 million in 2012 through new product launches, strong promotion of existing products and development of products in Emerging Markets.
We have continued to consistently develop and launch new products with the global FMCG customers and this has been recognized by these customers. During 2012 we were awarded the James N. Gamble Product Innovation Award from Procter & Gamble.
Capture growth in emerging markets.
During 2012 our sales in emerging markets, which we consider to be countries in Asia Pacific, South America, Africa and the Middle East were €63,2 million. This was an increase of €17,5 million or 38.4% compared to sales of €45,7 recorded in 2011,clearly demonstrating the growth potential in these markets. During 2012 we made further investments in our manufacturing capacity in Brazil and India by moving our production to larger plants and increasing the number of production lines at these plants, which became fully operational in 2012. In addition, we have made investments in our injection molding capacities at our manufacturing plants in Mexico and China. Furthermore, we recently opened an innovation center in Singapore, a major innovation hub for FMCG companies, and have invested in localized design and development capabilities in China, Mexico and Bulgaria in an effort to further cater for our customers’ requirements, who are increasingly focusing on product development capabilities closer to end markets.
Broaden our customer base.
During 2012 we have been successful in developing our relationships with our global FMCG customers. In addition, during 2012, we set up a new business unit to target regional FMCG customers and leading European retailer customers.
Z Beta S.à.r.l.
BUSINESS REVIEW 2012
7
Focus on profitable growth, operational efficiency and cash flow generation.
Industrial efficiency, cost control and cash generation have been the focus of major attention during 2012.
In the area of Industrial efficiency, the Group has concentrated its main efforts in the plant in Mexico. The implementation of the Zobele Production System, based on Lean Manufacturing practices, secured a partial recovery of efficiency during the second part of 2012.
Cash generation has been positive. Cash generated from operations was €42,4 million for 2012, with strong cash generation from Working Capital as management focused on all areas of Working Capital across the group. In particular good progress was made in reducing inventory levels in most plants.
Products
We leverage a common technology platform relating to dispensing devices, such as electric plug-ins and powered aerosol devices, across our product categories. Our product offerings are organized into three product categories: Air Care Products, which generated €245,6 million, or 72.8% of our net sales, for the twelve months ended December 31, 2012; Insecticide Products, which generated €77,8 million, or 23.1% of our net sales, for the twelve months ended December 31, 2012; and Home, Health and Personal Care Products, which generated €14.0 million, or 4.2% of our net sales, for the twelve months ended December 31, 2012. Nearly all of our products are labeled with our customers’ brands. A very small percentage of our sales are sold under our own brands, Vulcano, Spira, Bengal, Nexis and Sirio.
The following table sets forth our net sales by product category for the years ended December 31, 2011 and 2012:
(1) Predominantly represents sales of our Home, Health and Personal Care Products, although also contains sales of
product components for all categories and negligible amounts of sales of molds by our Chinese subsidiary.
The following table sets forth net sales by geographic area for the years ended December 31, 2011 and 2012:
Customers
Our customers consist of global and regional FMCG companies, as well as retailers.
Global FMCG Companies
We primarily sell our products to global FMCG companies. Sales to these companies accounted for 81.1 % of our net sales for the twelve months ended December 31, 2012 compared to 79.2% for the twelve months ended December 31 2011.
In milion of Euro As of As of
December 31, December 31, % change
2012 2011
Net sales by product category
Air Care 245,6 215,4 14.0%
Insecticide 77,8 76,0 2.4%
Home, Health and Personal Care(1)
14,2 21,9 -35.0%
Total net sales 337,6 313,3 7.8%
In milion of Euro As of As of
December 31, December 31, % change
2012 2011
Net sales by geographic area
North America 155.8 154.4 0.9%
Europe 118.6 113.2 4.8%
Asia Pacific 41.3 29.3 41.3%
South America 14.0 9.4 48.9%
Africa and Middle East 7.9 7.0 12.8%
Total net sales 337.6 313.3 7.8%
Z Beta S.à.r.l.
BUSINESS REVIEW 2012
8
Regional FMCG Companies
We also sell products to regional FMCG companies. Sales to regional FMCG companies accounted for 12.2% of our net sales for the twelve months ended December 31, 2012 compared to 13.8% for the twelve months ended December 31 2011.
Retailers
We also sell products to retailers. Sales to retailers accounted for 6.7% of our net sales for the twelve months ended December 31, 2012 compared to 7.0% for the twelve months ended December 31 2011.
Product Innovation and Development
During 2012 several new important development activities outside the core business have been carried out, following the company’s strategic move towards growing our product categories. These new projects target areas such as Surface and Personal Care and Health and Home Care.
This development has been made possible by a joint effort between our development and innovation teams to secure several technological partnerships with some strategic suppliers. These new technologies will be the drivers for the enlargement of our product and customer portfolio.
An important product cost improvement activity program has been launched during 2012 involving the development, industrialization, manufacturing and purchasing teams in all plants in order to maximize the product value and cost competitiveness of our product portfolio. This has been done by integrating and focusing on reengineering our products and processes using efficient designs, new and more automated production processes, a better developed supply chain, and purchased materials.
This program will be part of the continuous improvement process of the company and has been centrally coordinated and locally developed to ensure the fastest and most effective implementation.
Manufacturing
Our manufacturing plants are well maintained with ample capacity for growth. We believe that we are currently in substantial compliance with all applicable laws and regulations affecting our manufacturing plants and maintain all material permits and licenses relating to our operations. We have recently made significant investments in our manufacturing capacity by increasing the size of several of our manufacturing plants, enabling us to further grow our business. The following table details, in respect of each country where we have operations, the approximate size of the manufacturing plant, the percentage that it contributed to our net sales in the year ended December 31, 2012 and the primary regions served:
(1) Percentage of net sales does not total 100% due to certain sales being attributed to Spain, as the sales were invoiced by our
Spanish subsidiary. However, the products represented by these sales are manufactured at our other manufacturing plants,
primarily in Italy and China.
(2) Primary regions represent the majority of sales, although each plant serves multiple regions, both in relation to the supply of
finished products and the supply of components to our other manufacturing plants, particularly by our manufacturing plant in
China.
CountryApproximate size of
manufacturing plant (m2)
% of net sales for the year
ended December 31, 2012(1) Primary regions served
(2)
Mexico 29,219 43.1% Americas
China 18,550 21.3% North America, Europe, Asia, Intercompany production
Italy (Trento) 22,855 15.3% Europe
Italy (Palma) 2,800 Not material Europe
Bulgaria 8,512 10.3% Europe
Brazil 3,030 2.1% South America
India 8,752 1.8% Asia, North America

Z Beta S.à.r.l.
BUSINESS REVIEW 2012
9
During 2012, major projects have been:
• development of a new greenfield facility in India to locate production closer to Mumbai's international port and provide additional shopfloor space for growth
• relocation of the Brazil operations to a larger site with further expansion potential
• investment in both China and Mexico in injection molding equipment to increase the percentage of in-house production and improve margins
• investment in Mexico to implement Zobele Production System and increase efficiencies
• investment in additional SAP modules to support Demand Planning and provide IT support to the complete S&OP (“Sales and Operations Planning”) process- piloted in “Zobele Retail Solution Business Unit” in 2012 and to be rolled out to the rest of the group during 2013/14; and
• full roll-out of a weekly KPI (Key Performance Indicator) process to monitor and drive operational performance. This is supported by a more rigorous definition of metrics and procedures to extract the KPIs from SAP.
Sourcing
For the twelve months ended December 31, 2012, our total materials purchases were €216,9 million, which represented 64.2% of our net sales for the same period. The majority of our materials by expense for the year ended December 31, 2012 consisted of fragrances, plastics, electronics and packaging materials, representing 26.9%, 18.0%, 12.6% and 11.3%, of our total costs of materials purchased, respectively. While these are the most significant materials used in our business, we also use other materials, including chemicals, glass and metals (principally copper). We do not produce any chemicals ourselves, but we purchase chemicals for use in the manufacture of our products. During 2012 our main referential commodities (plastic, copper, paper) continued to oscillate close to the levels recorded since the start of the year.
Intellectual Property
The Zobele Group currently owns 73 operational patent families, comprising the following: (i) 49 patent families relating to methods for handling certain volatile substances (mostly fragrances and insecticides); (ii) 14 patent families relating to Air Care Products; (iii) 6 patent families relating to Insecticide Products; and (iv) 4 patent families relating to Home Care Products. We consider new patent development to be central to the success of our business. Our most important operational patents are for electrical evaporation and the diffusion of fragrances and insecticides, a method and a device for evaporating volatile substances through a membrane, a diffuser for evaporating volatile substances with multiple fragrances, a system for regulating evaporation intensity in insecticide devices, a device for evaporating volatile substances containing a built-in light, and a container for volatile substances. In addition, we currently own 111 design patent families. Our most important design patents are for our volatile substance evaporators and the caps and containers for our air fresheners, insecticides and other products. These patents have been registered predominantly in the countries in which the relevant products are being sold by our major customers. None of our key patents expire in the near future.
Information Technology and Data
With the exception of our manufacturing plant in Brazil, all our employees have access to a worldwide standardized system of IT hardware and software, which allows for the complete integration of the companies within our Group. During 2012 the email system was consolidated group wide, enabling a multi-device access. Moreover, Microsoft System Center 2012 platform was implemented to monitor the IT infrastructure.
Our single most critical business system is the SAP software used for our commercial activities, including purchasing, sales, production planning and control, quality control, warehouse management, finance and controlling. The SAP software system provides full financial reporting and integration across all of our operations, with the exception of our operations in Brazil, where it is not cost effective to roll out, and India, where it is expected to be rolled out at end of 2013. We support our SAP systems through an in-house team of SAP specialists, who are mainly located in our headquarters in Italy and serve more than 400 users across most of our manufacturing plants. In addition, with the exception of our operations in Brazil, we have adopted several integrated systems designed to facilitate unified communications, transmission of orders and invoicing, and managing the process of product development. For product
Z Beta S.à.r.l.
BUSINESS REVIEW 2012
10
development and in general for the management of all the Projects, an internal platform called PPMS (“Project & Portfolio Management System”) was implemented worldwide during 2012.
We have taken appropriate measures to secure our systems and data by using standard IT security capability products. We have two centralized backup data storage facilities, as well as business continuity plans in place. We have not experienced any significant IT problems in recent years.
During 2012 we successfully implemented the process of Demand Planning using the SAP SCM software within the Zobele Retail Solutions Business Unit. This process allows Zobele to have a more accurate 15 months rolling forecast for Sales demand for retailers and regional FMCG companies.
2012 was also a year focused on the business process reengineering of some critical processes such as SAP access management and intercompany transfer management.
Our IT organization is moving towards ITIL Service operation and 2012 was focused in certifying all the headquarter resources.
Employees
As of December 31, 2012, the Group had 5,012 employees worldwide. These employees are mainly located in low cost countries. As shown in the table below, our average total number of employees is substantially stable even though with some significant change in the distribution among the different countries.
As an effect of restructuring initiatives Spain reduced the headcount at year end to 37 employees versus the 52 of December 2012. Competence mix change was made in Italy with cost reduction of overhead personnel. Mexico confirmed its growth and China reduced the number of employees. Bulgaria for some month suffered due to lower demand and consequently reduced headcount.
The following tables show, for the last three financial years, our average headcounts by each country in which we operate:
The organization of work is impacted to some extent by seasonality and peaks of demand, in particular in the production of Insecticide Products, with a consequent fluctuation in employee numbers during the year.
We are well aware that our most valuable asset is in our people. We are committed to helping all our employees to make the most of their talents through our continuing programs of training and development.
The success of the Group depends significantly on its ability to attract and retain a competent workforce that includes experienced sales, product design and production personnel and to retain members of its senior management team, many of whom have significant experience in the Group’s business and industry. Employee remuneration is structured
As of As of As of
Country December 31, December 31, December 31,
2012 2011 2010
Employees average summary
Italy 290 292 283
Spain 43 52 52
Mexico 1,740 1,348 1,030
Brazil 25 26 29
China 2,108 2,391 2,537
India 44 21 20
Bulgaria 298 424 316
Total 4,548 4,554 4,266
The figures above includes temporary workers enroled by Zobele but not contracted workers
Z Beta S.à.r.l.
BUSINESS REVIEW 2012
11
to be at attractive levels and to incentivize employees towards results that are aligned with the objectives of the Group through a Balanced Score Card system.
To secure the continuous rejuvenation of our talent pools, we have established a program of “Young High Potential Talents” aiming at recruiting every year 5 young graduates and having them go through a well-designed development program covering 24 months and several functions in the Group.
Legal Proceedings
At any given time, we may be a party to litigation or be subject to non-litigated claims arising out of the normal operations of our business. We are not currently involved in any legal proceedings which, either individually or in the aggregate, are expected to have a material adverse effect on our financial position or results of operations.
Properties
We are headquartered in Italy, operate manufacturing plants in six countries (Mexico, China, Italy Bulgaria, Brazil and India), have design and development centers in five countries (Italy, Spain, Mexico, China and Bulgaria) and have innovation centers in Spain and Singapore. The table below details, in respect of each country where we have operations, the types of facilities we have at each property, the size of our properties and whether the property is owned or leased.
Chemical Safety Regulations
Our products and the materials we use in our manufacturing processes are subject to various regulations related to chemical safety, including the European Biocidal Products Directive 98/8/EC (the “Biocidal Products Directive”) and the European Registration, Evaluation, Authorization and Restriction of Chemicals (“REACH”) Regulation. The Biocidal Products Directive governs the authorization and the placing on the market of biocidal products in the European Union. A basic provision of the Biocidal Products Directive is the establishment of a positive list of active substances that may be used in biocidal products without unacceptable effects on the environment, human or animal health. In addition, the Biocidal Products Directive establishes a two-tier system where the EU evaluates and approves active substances, whilst thereafter individual Member States authorize products containing these substances. From September 1, 2013, the Biocidal Products Directive will be replaced by Regulation (EU) No. 528/2012 (the “2012 Biocides Regulation”), which will introduce some changes to the current regulatory framework, including providing for the authorization at the EU level of certain additional biocidal products, improving the functioning of national authorizations and mutual recognition of product authorizations, and harmonizing the fee structure across EU Member States for substance evaluations and product authorizations. In order to comply with the new regulatory framework for the marketing and use of biocidal products and to minimize the impact of the new regulation on our business, in 2010
Country Facilities Land Area (m2) Owned / Leased
Mexico Design and Development Center (Hermosillo) 88,866 Leased
Manufacturing Plant (Hermosillo)
China Design and Development Center (Shenzhen) 20,453 Leased
Manufacturing Plant (Shenzhen)
Italy Headquarters (Trento) (Trento) 36,947 Owned
Design and Development Center (Trento) (Palma) 9,400
Manufacturing Plant (Trento and Palma)
Bulgaria Design and Development Center (Rakovski) 16,440 Leased
Manufacturing Plant (Rakovski)
Brazil Manufacturing Plant (Porto Alegre) 15,583 Leased
India Manufacturing Plant (Daman) 12,440 Leased
Spain Innovation center (Barcelona) Office only Leased
Design and Development Center (Barcelona)
Singapore Innovation center Office only Leased

Z Beta S.à.r.l.
BUSINESS REVIEW 2012
12
we adopted a specific protocol for reviewing and rationalizing the formulations used in our Insecticide Products, as well as identifying strategies to address potential cost increases and preserve our profit margins relating to our Insecticide Products. We believe that the 2012 Biocides Regulation will benefit reputable suppliers such as Zobele, because it will further incentivize our customers to avoid the risk of potential problems with product quality associated with less reputable suppliers.
In 2012 a significant effort has been initiated to put in place the necessary steps toward compliance with Biocidal regulations of our product portfolio, with a coordinated team of development, purchasing, sales, and legal resources. Risks and opportunities are continuously evaluated and several actions have been put in place to deliver the goal at the best conditions. Meetings have been held during 2012 with our strategic Insecticide Active Ingredient suppliers to achieve conformity. Results of these meetings have been translated into formal or informal frame agreement to optimize the Biocide Directive strategic approach of the company
Electrical Safety Regulations
Our products and the materials we use in our manufacturing processes are also subject to various regulations related to electrical safety. Since June 1, 2006, Directive 2002/95/EC (the “RoHS Directive”) restricts the use of certain hazardous substances in electric and electronic equipment, such as lead, cadmium, mercury, hexavalent chromium, polybrominated biphenyls and polybrominated diphenylethers. We ask our suppliers to provide certain compliance letters and other certificates for the material sourced, and we utilize a database system that allows us to track and monitor the RoHS Directive compliance status of our suppliers and the materials used at each of our facilities. From January 2, 2013, the RoHS Directive will be replaced by Directive 2011/65/EU (the “RoHS II Directive”), which will introduce a more stringent regime for manufacturers, including a requirement to provide specific technical documentation in relation to the examinations and tests performed on the manufacturer’s products and a requirement to draw up certain conformity assessment procedures. In order to comply with the new regulatory framework of the RoHS II Directive, and to minimize its impact on our business, in 2012, we began asking each of our suppliers to provide a report describing all elements present in the materials provided by such supplier and an analytical verification where one or more restricted substances are detected. In addition, we are adopting specific protocols for chemical analysis of samples taken from products representing 80% of our net sales and of all components of products for which it was not possible to collect sufficient data from our suppliers. The database set up necessary to cope with the ROHS Directive is on the way to completion and a significant shared effort done by our development and purchasing teams have been put in place in 2012 to assure its completion in time and the necessary process to assure it’s continuous update During 2012 our testing and certification laboratory structure has been reviewed and rationalized. The Spanish laboratory has been reduced in capability, transferring equipment to China , Italy and India where this kind of activity will be concentrated in the future. A testing certification program application have been initiated in China and Italy to assure an optimal approach for UL Testing.
Several activities have been put in place by our development team to ensure that the new testing laboratory in the Indian Plant in Daman Lab will have similar capabilities and know-how of the other labs in China , Italy and Mexico . These effort to enhance the local testing capability aim to the reduction of cost and improving of timing in qualification and validation of new products by localizing these facilities close to the main plants.
Employee Health and Safety and Environmental Regulations
Our past and present operations are subject to environmental laws and regulations in a number of jurisdictions pertaining to the discharge of materials into the environment and the handling and disposal of waste or otherwise relating to the protection of the environment (energy and resources utilization, emissions, etc.). We seek to identify, monitor and manage environmental risks arising from our operations and have site environmental management systems in place to ensure appropriate focus on environmental issues in our business. Additionally, we have an effective employee health and safety leadership model and have embedded processes at board, divisional and site level to produce safe products while maintaining an incident-free workplace. HSE Management systems are designed according to the most advanced international standard and in several cases are certified according to ISO14001 and OHSAS18001 norms and are controlled and improved by local internal HSE departments to be continuously maintained to the highest level. Ongoing employee training with respect to product, work and site safety and environment is key to this process.
During 2012 we have worked to consolidate the improvements achieved in the previous years and to introduce new actions aimed to reduce the environmental impact and increase the social fingerprint. China has strongly worked to increase the employees and workers awareness and control of energy consumption, introducing a program to turn off all
Z Beta S.à.r.l.
BUSINESS REVIEW 2012
13
unnecessary electric appliances during break/off work/holiday. Additionally several actions have been made to reduce accidents impact (-30% lost hours). Italy has continued its path to year-to-year CO2 emissions reduction through the installation of LED lamps. Ergonomic studies and improvements have been carried out to prevent employee injuries. Brazil moved to a new, bigger facility. Special systems have been installed for water treatment for domestic effluents: once treated, remaining water is used for garden irrigation. Recycling activities have been reinforced, dedicating two areas to waste differentiation and protected storage of contaminated waste before disposal. The offices in Spain were moved to a new, more environmentally friendly building, where several features were installed (air conditioning with automatic switch off, automatic taps in toilets, timer devices to switch off lights automatically in toilets, low energy lights). Recycling was made easier with new collecting points, closer to the users. Bulgaria achieved good results in accident control, rating 0 in both Frequency and Severity rate. The process is on-going to achieve ISO14001 certification soon. Employee retention initiatives (dedicated training programs, variable compensation, career path) have been introduced. Finally, Mexico improved in the areas of water consumption (more than 50% improvement compared to the previous year) and workers retention programs, although it did incur a higher level of accidents compared to the previous year. Actions have been set to change the trend. Local reinforcement of incident prevention systems through near miss reporting and analysis has involved the whole Group.
Labeling Regulations
Our products and the materials we use in our manufacturing processes are also subject to Regulation (EC) No. 1272/2008 on the classification, labeling and packaging of substances and mixtures (the “CLP Regulation”). The CLP Regulation ensures that hazardous substances are clearly communicated to workers and consumers in the European Union through classification and labeling. In particular, substances or mixtures contained in packaging must be labeled according to a standardized system before being placed on the market when either (a) a substance is classified as hazardous, or (b) a mixture contains one or more substances classified as hazardous above a certain threshold. The CLP regulation specifies what the label must contain and how the various elements of the label must be organized. In addition, the CLP Regulation provides certain exemptions for substances and mixtures contained in small packaging or which are otherwise difficult to label, which often apply to us as many of our products are less than 125 ml in size.
The CLP Regulation became effective on January 20, 2009 and replaced two previous directives, the Dangerous Substances Directive 67/548/EEC and the Dangerous Preparations Directive 1999/45/EC. The provisions of the CLP Regulation are being phased in over a period ending on June 1, 2015. In order to remain in compliance with the applicable regulatory framework during this transition period, we have adopted a specific protocol for reviewing and rationalizing the formulations used in our products, as well as identifying strategies to conform our classification, labeling and packaging processes.
During 2012 a joint effort with some of our key customers has been started to analyze, design and select best approaches to cope with the new directive. This Cooperation will assure a well-timed and coordinated approach by maximizing efforts and know how and optimizing the associated cost .
Approved by Approved by
Director Chief Executive Officer
Mr. Cedric Stébel Mr. Roberto Schianchi
__________________________________ ____________________________________
Luxembourg, 18 April 2013 Luxembourg, 18 April 2013

14
15
AUDIT REPORT
To the Partners of Z Beta S.à r.l.
Report on the consolidated financial statements
We have audited the accompanying consolidated financial statements of Z Beta S,à r.l. and its subsidiaries (the “Group”), which comprise the consolidated balance sheet as at 31 December 2012, the consolidated income statement, the consolidated statement of comprehensive income, the consolidated statement of changes in shareholders’ equity and the consolidated statement of cash flows for the year then ended and a summary of significant accounting policies and other explanatory information. Board of Managers’ responsibility for the consolidated financial statements
The Board of Managers is responsible for the preparation and fair presentation of these consolidated financial statements in accordance with International Financial Reporting Standards as adopted by the European Union, and for such internal control as the Board of Managers determines is necessary to enable the preparation of consolidated financial statements that are free from material misstatement, whether due to fraud or error. Responsibility of the “Réviseur d’entreprises agréé”
Our responsibility is to express an opinion on these consolidated financial statements based on our audit. We conducted our audit in accordance with International Standards on Auditing as adopted for Luxembourg by the “Commission de Surveillance du Secteur Financier”. Those standards require that we comply with ethical requirements and plan and perform the audit to obtain reasonable assurance about whether the consolidated financial statements are free from material misstatement. An audit involves performing procedures to obtain audit evidence about the amounts and disclosures in the consolidated financial statements. The procedures selected depend on the judgment of the “Réviseur d’entreprises agréé”, including the assessment of the risks of material misstatement of the consolidated financial statements, whether due to fraud or error. In making those risk assessments, the “Réviseur d’entreprises agréé” considers internal control relevant to the entity’s preparation and fair presentation of the consolidated financial statements in order to design audit procedures that are appropriate in the circumstances, but not for the purpose of expressing an opinion on the effectiveness of the entity’s internal control. An audit also includes evaluating the appropriateness of accounting policies used and the reasonableness of accounting estimates made by the Board of Managers, as well as evaluating the overall presentation of the consolidated financial statements. We believe that the audit evidence we have obtained is sufficient and appropriate to provide a basis for our audit opinion. Opinion
In our opinion, the consolidated financial statements give a true and fair view of the consolidated financial position of the Group as of 31 December 2012, and of the results of its consolidated operations for the year then ended in accordance with International Financial Reporting Standards as adopted by the European Union. Report on other legal and regulatory requirements
The management report, which is the responsibility of the Board of Managers, is consistent with the consolidated financial statements. PricewaterhouseCoopers, Société coopérative Luxembourg, 24 April 2013 Represented by Véronique Lefebvre

16
Z Beta S.à.r.l.
CONSOLIDATED BALANCE SHEET
For the year ended December 31, 2012 and 2011
17
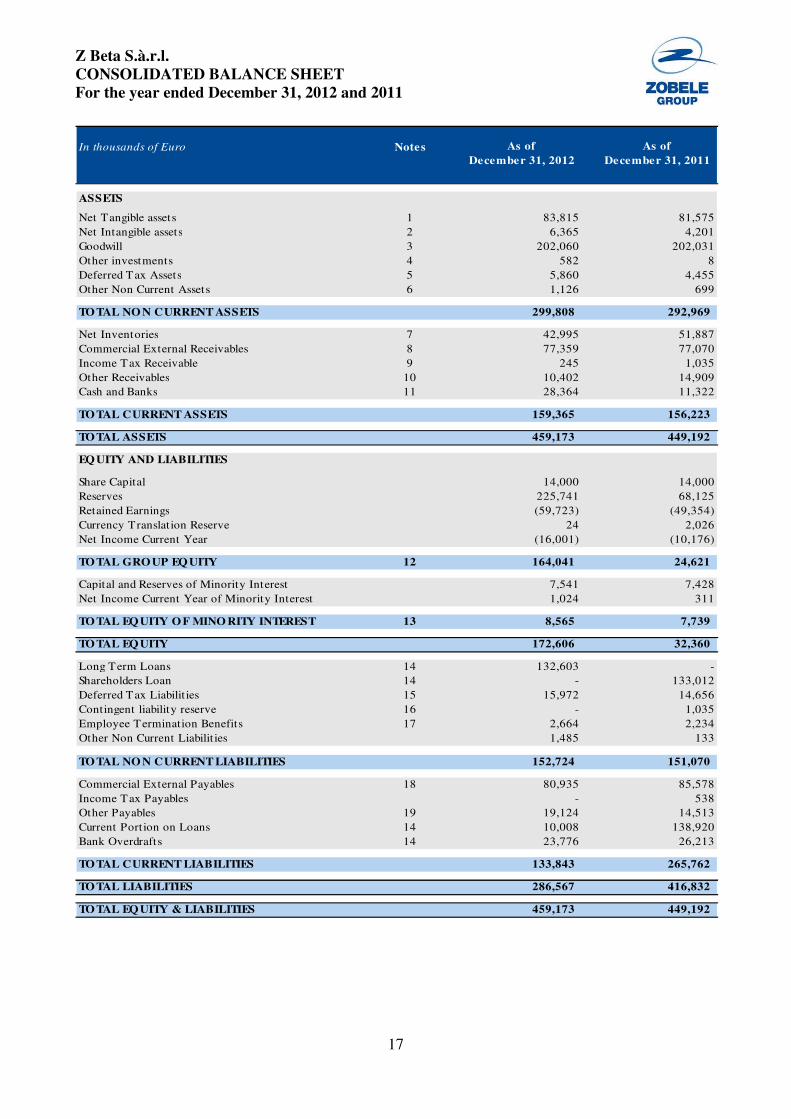
In thousands of Euro Notes As of As of
December 31, 2012 December 31, 2011
ASSETS
Net Tangible assets 1 83,815 81,575
Net Intangible assets 2 6,365 4,201
Goodwill 3 202,060 202,031
Other investments 4 582 8
Deferred Tax Assets 5 5,860 4,455
Other Non Current Assets 6 1,126 699
TOTAL NO N CURRENT ASSETS 299,808 292,969
Net Inventories 7 42,995 51,887
Commercial External Receivables 8 77,359 77,070
Income Tax Receivable 9 245 1,035
Other Receivables 10 10,402 14,909
Cash and Banks 11 28,364 11,322
TOTAL CURRENT ASSETS 159,365 156,223
TOTAL ASSETS 459,173 449,192
EQUITY AND LIABILITIES
Share Capital 14,000 14,000
Reserves 225,741 68,125
Retained Earnings (59,723) (49,354)
Currency Translat ion Reserve 24 2,026
Net Income Current Year (16,001) (10,176)
TOTAL GROUP EQUITY 12 164,041 24,621
Capital and Reserves of Minority Interest 7,541 7,428
Net Income Current Year of Minority Interest 1,024 311
TOTAL EQUITY OF MINO RITY INTEREST 13 8,565 7,739
TOTAL EQUITY 172,606 32,360
Long Term Loans 14 132,603 -
Shareholders Loan 14 - 133,012
Deferred Tax Liabilit ies 15 15,972 14,656
Contingent liability reserve 16 - 1,035
Employee Termination Benefits 17 2,664 2,234
Other Non Current Liabilit ies 1,485 133
TOTAL NO N CURRENT LIABILITIES 152,724 151,070
Commercial External Payables 18 80,935 85,578
Income Tax Payables - 538
Other Payables 19 19,124 14,513
Current Port ion on Loans 14 10,008 138,920
Bank Overdrafts 14 23,776 26,213
TOTAL CURRENT LIABILITIES 133,843 265,762
TOTAL LIABILITIES 286,567 416,832
TOTAL EQUITY & LIABILITIES 459,173 449,192

Z Beta S.à.r.l.
CONSOLIDATED INCOME STATEMENT
For the year ended December 31, 2012 and 2011
18
In thousands of Euro Notes Year Ended Year Ended
December 31, 2012 December 31, 2011
NET SALES 20 337,637 313,293
Cost of sales 21-23 273,453 250,231
GROSS PRO FIT 64,184 63,062
Gross Profit % 19.0% 20.1%
Overheads 22-23 23,787 24,967
Other Expense/(Income) 24 (2,649) (2,296)
EBITDA BEFO RE NO N-RECURRING TRANSACTIONS 43,046 40,391
Ebitda before non recurring transactions % 12.7% 12.9%
Depreciation, amortization and write-downs 25 14,698 12,781
EARNINGS BEFO RE INTEREST & TAXES & NON
RECURRING TRANSACTIO NS 28,348 27,610
Ebit and non recurring transactions % 8.4% 8.8%
Cost (Income) from Non-recurring transactions 26 6,837 1,520
Restructuring Costs - -
EARNINGS BEFO RE INTEREST & TAXES 21,511 26,090
Financial (Income)/Expenses 27 30,546 28,687
PRO FIT BEFO RE TAXES (9,035) (2,597)
Income Taxes 28 5,941 7,268
NET INCO ME (14,976) (9,865)
Net Income % -4.4% -3.1%
Minority Interest 29-13 1,024 311
GROUP NET INCO ME (16,001) (10,176)
EARNING PER SHARE
Basic (Euro) 30 (28.6) (18.2)
Diluted (Euro) 30 (28.6) (18.2)
Z Beta S.à.r.l.
CONSOLIDATED STATEMENT OF COMPREHENSIVE INCOME
For the year ended December 31, 2012 and 2011
19
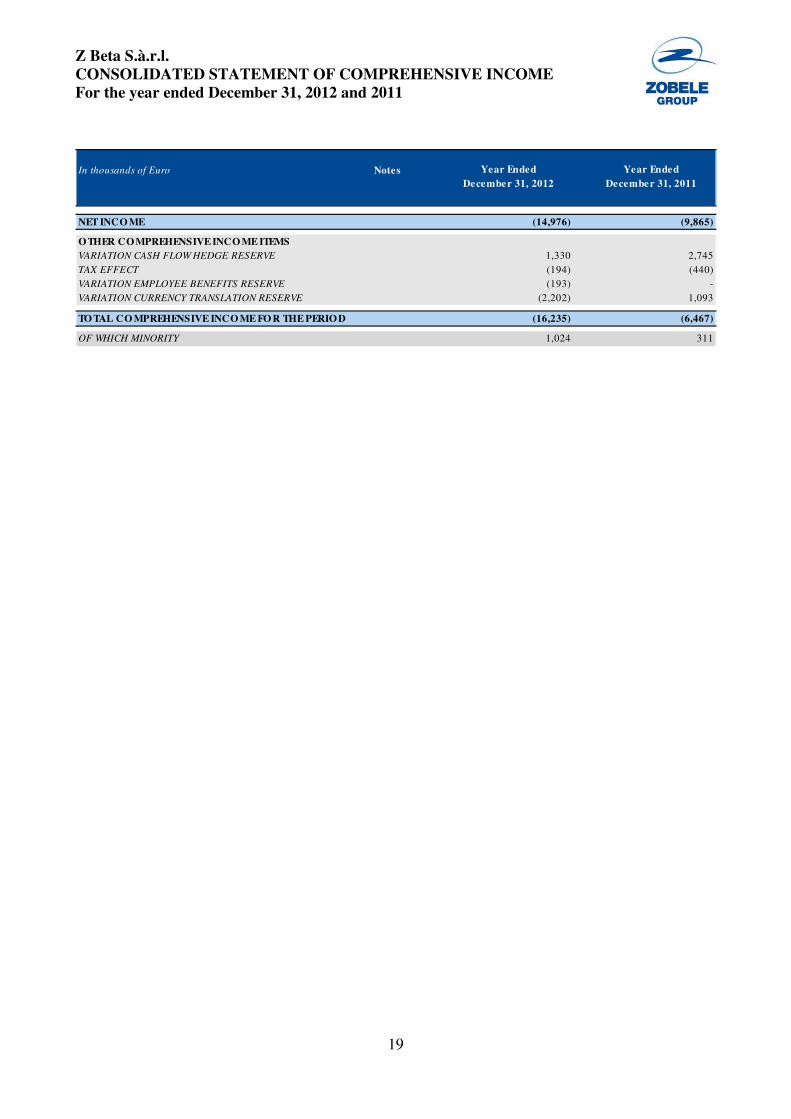
In thousands of Euro Notes Year Ended Year Ended
December 31, 2012 December 31, 2011
NET INCO ME (14,976) (9,865)
OTHER COMPREHENSIVE INCO ME ITEMS
VARIATION CASH FLOW HEDGE RESERVE 1,330 2,745
TAX EFFECT (194) (440)
VARIATION EMPLOYEE BENEFITS RESERVE (193) -
VARIATION CURRENCY TRANSLATION RESERVE (2,202) 1,093
TO TAL CO MPREHENSIVE INCO ME FO R THE PERIOD (16,235) (6,467)
OF WHICH MINORITY 1,024 311
Z Beta S.à.r.l.
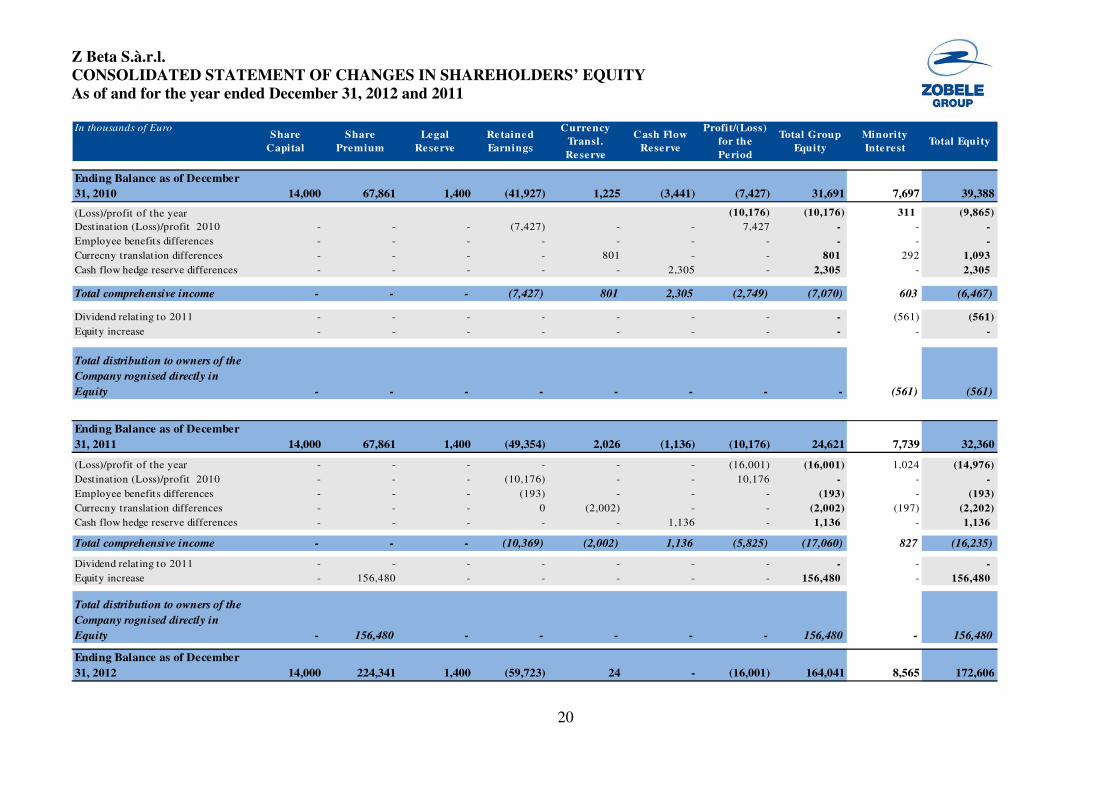
CONSOLIDATED STATEMENT OF CHANGES IN SHAREHOLDERS’ EQUITY
As of and for the year ended December 31, 2012 and 2011
20
In thousands of EuroShare
Capital
Share
Premium
Legal
Reserve
Retained
Earnings
Currency
Transl.
Reserve
Cash Flow
Reserve
Profit/(Loss)
for the
Period
Total Group
Equity
Minority
InterestTotal Equity
Ending Balance as of December
31, 2010 14,000 67,861 1,400 (41,927) 1,225 (3,441) (7,427) 31,691 7,697 39,388
(Loss)/profit of the year (10,176) (10,176) 311 (9,865)
Destination (Loss)/profit 2010 - - - (7,427) - - 7,427 - - -
Employee benefits differences - - - - - - - - - -
Currecny translation differences - - - - 801 - - 801 292 1,093
Cash flow hedge reserve differences - - - - - 2,305 - 2,305 - 2,305
Total comprehensive income - - - (7,427) 801 2,305 (2,749) (7,070) 603 (6,467)
Dividend relating to 2011 - - - - - - - - (561) (561)
Equity increase - - - - - - - - - -
Total distribution to owners of the
Company rognised directly in
Equity - - - - - - - - (561) (561)
Ending Balance as of December
31, 2011 14,000 67,861 1,400 (49,354) 2,026 (1,136) (10,176) 24,621 7,739 32,360
(Loss)/profit of the year - - - - - - (16,001) (16,001) 1,024 (14,976)
Destination (Loss)/profit 2010 - - - (10,176) - - 10,176 - - -
Employee benefits differences - - - (193) - - - (193) - (193)
Currecny translation differences - - - 0 (2,002) - - (2,002) (197) (2,202)
Cash flow hedge reserve differences - - - - - 1,136 - 1,136 - 1,136
Total comprehensive income - - - (10,369) (2,002) 1,136 (5,825) (17,060) 827 (16,235)
Dividend relating to 2011 - - - - - - - - - -
Equity increase - 156,480 - - - - - 156,480 - 156,480
Total distribution to owners of the
Company rognised directly in
Equity - 156,480 - - - - - 156,480 - 156,480
Ending Balance as of December
31, 2012 14,000 224,341 1,400 (59,723) 24 - (16,001) 164,041 8,565 172,606
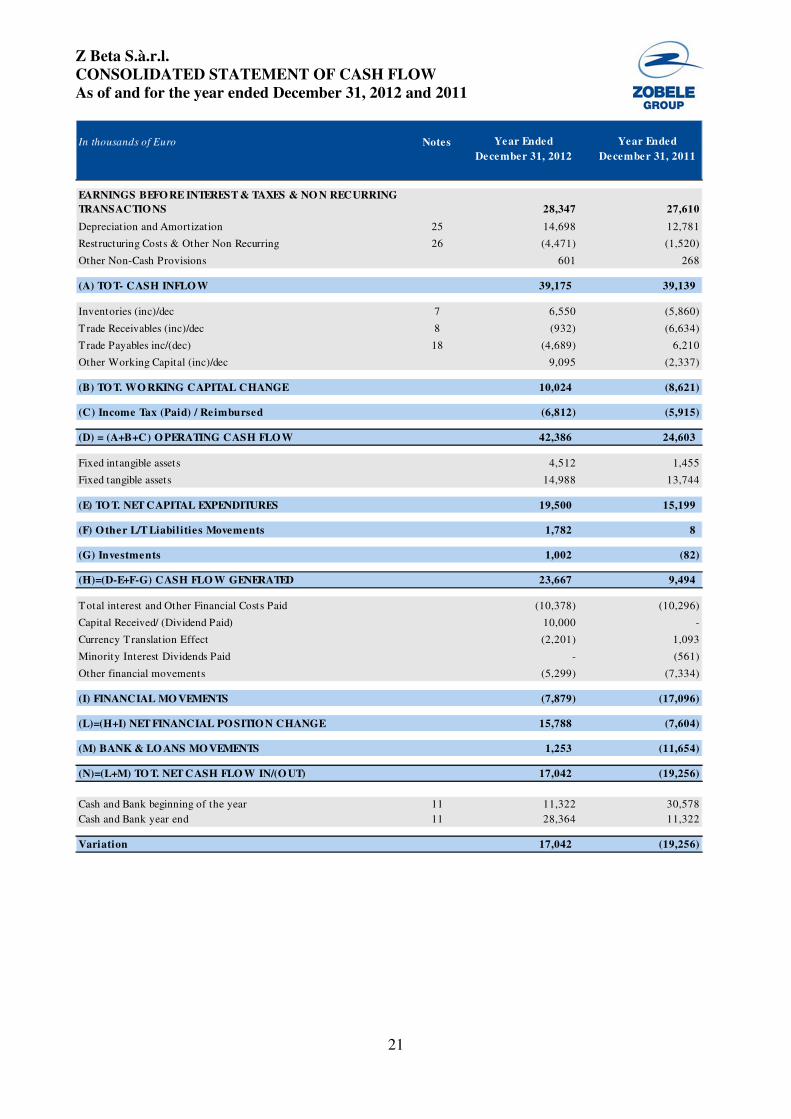
Z Beta S.à.r.l.
CONSOLIDATED STATEMENT OF CASH FLOW
As of and for the year ended December 31, 2012 and 2011
21
In thousands of Euro Notes Year Ended Year Ended
December 31, 2012 December 31, 2011
EARNINGS BEFORE INTEREST & TAXES & NO N RECURRING
TRANSACTIONS 28,347 27,610
Depreciation and Amortization 25 14,698 12,781
Restructuring Costs & Other Non Recurring 26 (4,471) (1,520)
Other Non-Cash Provisions 601 268
(A) TOT- CASH INFLOW 39,175 39,139
Inventories (inc)/dec 7 6,550 (5,860)
Trade Receivables (inc)/dec 8 (932) (6,634)
Trade Payables inc/(dec) 18 (4,689) 6,210
Other Working Capital (inc)/dec 9,095 (2,337)
(B) TOT. WO RKING CAPITAL CHANGE 10,024 (8,621)
(C) Income Tax (Paid) / Reimbursed (6,812) (5,915)
(D) = (A+B+C) OPERATING CASH FLOW 42,386 24,603
Fixed intangible assets 4,512 1,455
Fixed tangible assets 14,988 13,744
(E) TO T. NET CAPITAL EXPENDITURES 19,500 15,199
(F) Other L/T Liabilities Movements 1,782 8
(G) Investments 1,002 (82)
(H)=(D-E+F-G) CASH FLO W GENERATED 23,667 9,494
Total interest and Other Financial Costs Paid (10,378) (10,296)
Capital Received/ (Dividend Paid) 10,000 -
Currency Translation Effect (2,201) 1,093
Minority Interest Dividends Paid - (561)
Other financial movements (5,299) (7,334)
(I) FINANCIAL MO VEMENTS (7,879) (17,096)
(L)=(H+I) NET FINANCIAL POSITION CHANGE 15,788 (7,604)
(M) BANK & LO ANS MOVEMENTS 1,253 (11,654)
(N)=(L+M) TO T. NET CASH FLO W IN/(O UT) 17,042 (19,256)
Cash and Bank beginning of the year 11 11,322 30,578
Cash and Bank year end 11 28,364 11,322
Variation 17,042 (19,256)
Z Beta S.à.r.l.
NOTES TO CONSOLIDATED FINANCIAL STATEMENTS
As of December 31, 2012 and for the year ended December 31, 2012 and 2011
22
I) INTRODUCTION
Z Beta S.à r.l. (hereinafter the “Company” and, together with its subsidiaries, the “Group”) is a Luxembourg holding company incorporated on October 11, 2006 as a “société à responsabilité limitée” for an unlimited period of time, subject to the general company law. It is controlled by Z Alpha S.A., a Luxembourg holding company incorporated on October 11, 2006. The registered office of the Company is 28, boulevard Royal, L-2449 Luxembourg. Z Beta S.à.r.l., is included in the consolidated accounts of DH Z S.à r.l, a Luxembourg holding company incorporated on November 15, 2006 as a “société à responsabilité limitée” for an unlimited period of time, subject to the general company law. The registered office of DH Z. S.à r.l. is 28, boulevard Royal, L-2449 Luxembourg and the consolidated accounts can be obtained at such address. The Group is a leading global supplier of air care and insecticide devices by revenue and it primarily sells its products to fast-moving consumer goods companies. The Group operates as a "one-stop-shop," offering its customers global solutions and services covering the entire value chain from product innovation and development to manufacturing and delivery. The Group leverages a common technology platform relating to dispensing devices, such as electric plug-ins and aerosol devices, across our product categories.
II) BASIS OF PREPARATION
These consolidated financial statements as of and for the year ended December 31, 2012 have been prepared in compliance with IFRS, issued by the International Accounting Standards Board and approved by the European Commission, which are in force at the date of preparation of the financial statements. They include the balance sheet, income statement, statements of comprehensive income, statement of cash flow, statement of changes in shareholders’ equity and the explanatory notes and are presented in thousands of Euro, unless otherwise stated. The balance sheet presents current and non-current assets and liabilities separately, based on the expectation of the realisation of the asset or extinction of the liability within the normal business operating cycle, assumed to be 12 months from the balance sheet date . The income statement is presented classifying the costs by destination. The statement of cash flow has been prepared using the indirect method. The preparation of consolidated financial statements in conformity with IFRS requires the use of certain critical accounting estimates. It also requires management to exercise its judgement in the process of applying the Group’s accounting policies. The areas involving a higher degree of judgement or complexity, or areas where assumptions and estimates are significant to the consolidated financial statements, are disclosed in note 3. The main accounting standards applied, consistently with the standards applied for the preparation of the original consolidated financial statements, are explained in note 3. These consolidate financial statements are prepared for the period ending 31 December 2012 and were approved by the Board of Directors of the company on 18 April 2013.
III) GOING CONCERN
In determining the appropriate basis of preparation of the financial statements, the Directors are required to consider whether the Group can continue in operational existence for the foreseeable future. The financial performance of the Group can be impacted by many factors, including market conditions, exchange rates, weather conditions and overall demand from key customers. Management has determined that there are no circumstances which would indicate that the Company could not continue to operate as a going concern for at least the twelve months from the balance sheet date.
Z Beta S.à.r.l.
NOTES TO CONSOLIDATED FINANCIAL STATEMENTS
As of December 31, 2012 and for the year ended December 31, 2012 and 2011
23
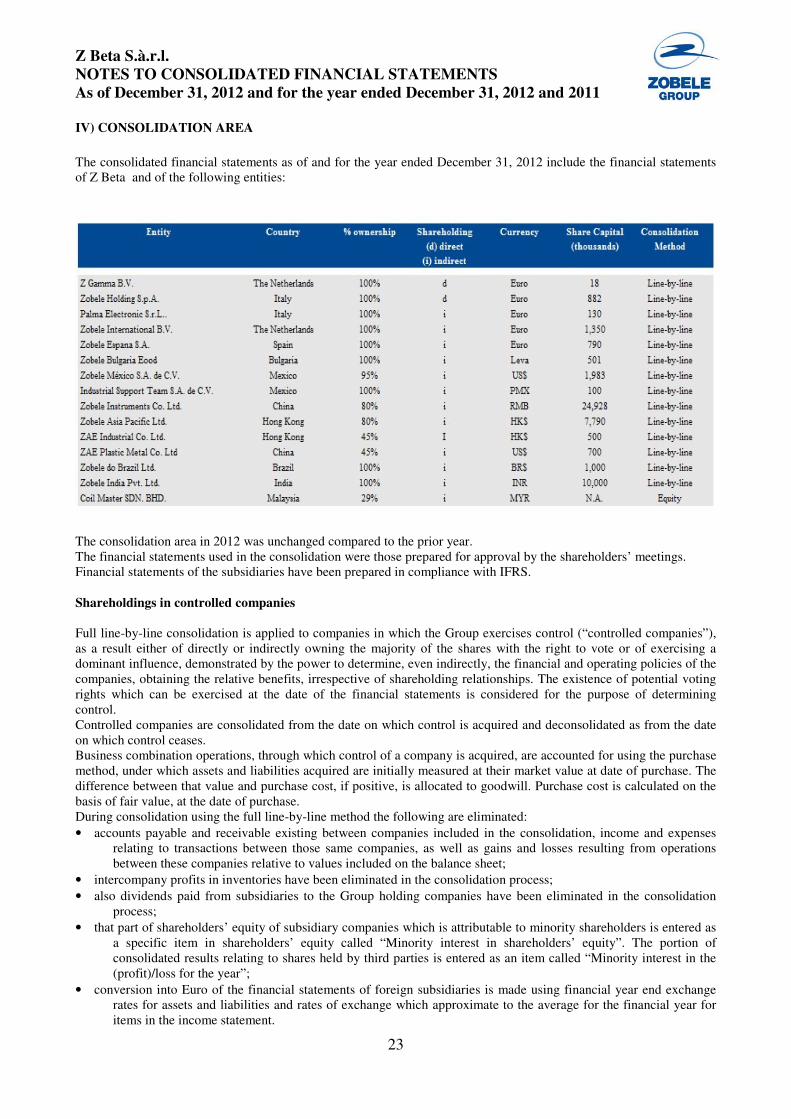
IV) CONSOLIDATION AREA
The consolidated financial statements as of and for the year ended December 31, 2012 include the financial statements of Z Beta and of the following entities:
The consolidation area in 2012 was unchanged compared to the prior year. The financial statements used in the consolidation were those prepared for approval by the shareholders’ meetings. Financial statements of the subsidiaries have been prepared in compliance with IFRS. Shareholdings in controlled companies Full line-by-line consolidation is applied to companies in which the Group exercises control (“controlled companies”), as a result either of directly or indirectly owning the majority of the shares with the right to vote or of exercising a dominant influence, demonstrated by the power to determine, even indirectly, the financial and operating policies of the companies, obtaining the relative benefits, irrespective of shareholding relationships. The existence of potential voting rights which can be exercised at the date of the financial statements is considered for the purpose of determining control. Controlled companies are consolidated from the date on which control is acquired and deconsolidated as from the date on which control ceases. Business combination operations, through which control of a company is acquired, are accounted for using the purchase method, under which assets and liabilities acquired are initially measured at their market value at date of purchase. The difference between that value and purchase cost, if positive, is allocated to goodwill. Purchase cost is calculated on the basis of fair value, at the date of purchase. During consolidation using the full line-by-line method the following are eliminated:
• accounts payable and receivable existing between companies included in the consolidation, income and expenses relating to transactions between those same companies, as well as gains and losses resulting from operations between these companies relative to values included on the balance sheet;
• intercompany profits in inventories have been eliminated in the consolidation process;
• also dividends paid from subsidiaries to the Group holding companies have been eliminated in the consolidation process;
• that part of shareholders’ equity of subsidiary companies which is attributable to minority shareholders is entered as a specific item in shareholders’ equity called “Minority interest in shareholders’ equity”. The portion of consolidated results relating to shares held by third parties is entered as an item called “Minority interest in the (profit)/loss for the year”;
• conversion into Euro of the financial statements of foreign subsidiaries is made using financial year end exchange rates for assets and liabilities and rates of exchange which approximate to the average for the financial year for items in the income statement.
Z Beta S.à.r.l.
NOTES TO CONSOLIDATED FINANCIAL STATEMENTS
As of December 31, 2012 and for the year ended December 31, 2012 and 2011
24
Shareholdings in associated companies
Shareholdings in companies over which a significant influence is exercised (“associated companies”), which is presumed to be the case when the percentage of shares held is between 20% and 50%, are valued by the equity method. As a consequence of using this method, the book value of the shareholding is aligned with shareholders’ equity. The share of result made by the associated companies, after acquisition, is entered in the profit and loss account, while movements in reserves subsequent to acquisition are entered in reserves in shareholders' equity. When the Group share of losses in an associated company equals or exceeds the amount of its holding in that company, the value of its shareholding is reduced to zero and the Group does not book further losses relating to its share, unless and to the extent that the Group is responsible for them. Unrealised profits and losses generated by transactions with associated companies are eliminated in proportion to the percentage of the Group’s shareholding in those companies. Other shareholdings in which the ownership percentage is less than 20%, or 10% if listed, or over which the group exercises no significant influence, are valued at cost of purchase or subscription, net of write-downs relating to any losses considered likely to have a lasting effect on the value of the shareholdings concerned. Valuation at cost is maintained, even though higher than that resulting from the equity method, provided that expected future income or implicit capital gains included in the shareholdings allow recovery of the higher accounting value to be expected.
Translation of foreign currency accounts and financial statements
Identification of the functional currency
Amounts in the income statement and balance sheet of each Group company are entered in the currency of the primary economic environment in which the entity operates (“functional currency”). The Group consolidated financial statements are prepared in Euro, the presentation currency, which is also the functional currency of the parent company. Translation of financial statements in currencies other than the functional currency
The rules for translation of financial statements in foreign currencies to the functional currency are as follows: - assets and liabilities are translated using financial year-end closing exchange rates; - costs, sales, expenses and income are translated at the average rate for the period; - the “translation reserve” holds both exchange differences generated by translating income statement and balance sheet at different exchange rates, and those generated by translation of opening beginning balances at a different exchange rate; and - goodwill and adjustments resulting from the fair value associated with the acquisition of a foreign entity are treated as assets and liabilities of the foreign entity and translated at the closing exchange rate for the period. Exchange rates used for translation of financial statements in foreign currencies other than Euro for the year end 2012 are shown below:
The exchange rates for the year ended December 31, 2011 were as follows:
Currency
Average exchange rate
for the year ended
December 31, 2012
Exchange rate as of
December 31, 2012
USD – US Dollar 1.2848 1.3194
PMX – Mexican Peso 16.9094 17.0889
BRL – Brazilian Real 2.5098 2.6949
HK$ - Hong Kong Dollar 9.9662 10.2260
RMB – Reminbi 8.1052 8.2207
INR – Indian Rupia 68.5973 72.5600
BGN – Bulgarian Leva 1.9558 1.9558
Z Beta S.à.r.l.
NOTES TO CONSOLIDATED FINANCIAL STATEMENTS
As of December 31, 2012 and for the year ended December 31, 2012 and 2011
25
V) SUMMARY OF ACCOUNTING POLICIES
Revenue recognition
Revenues are recognised to the extent that it is probable that the economic benefits will flow to the Group and the revenues can be reliably measured. Revenue from the sale of goods is recognised when the significant risks and rewards of ownership of the goods have transferred to the buyer, usually on despatch of the goods. Provisions for returns and allowances for customer rebates are provided for in the same period as the related revenues are recorded. Shipping and handling costs are included as a component of cost of products sold net of amounts recovered through billings to customers. Income and expenses Income is recognised in the income statement when an increase in future economic benefits related to an increase in an asset or a decrease of a liability has arisen that can be measured reliably. Expense is recognised in the income statement when a decrease in future economic benefits related to a decrease in an asset or an increase of a liability has arisen that can be measured reliably. Tangible assets Tangible assets are entered in the balance sheet at cost of acquisition or internal production, including directly attributable ancillary costs, net of cumulative depreciation. Any interest costs referred to construction of tangible fixed assets are charged to the income statement. Plant and machinery may include parts with different useful lives. Depreciation is calculated on the useful life of each individual part; in the event of replacement, new parts are capitalised to the extent that they meet the criteria for entry as assets, and the book value of the parts replaced is eliminated from the balance sheet. The residual value and useful life of assets are reviewed at least at every financial year-end and if, independently of depreciation already recorded, an impairment loss occurs calculated on the basis of application of IAS 36, the fixed asset is written down accordingly; if, in future years, the reasons for the write-down no longer apply, its value is restored. Ordinary maintenance costs are expensed in the income statement when incurred, while maintenance costs which increase the value of assets are allocated to the relative assets and depreciated over their residual useful lives. Leases in which the lessor substantially retains the risks and rewards associated with ownership of the assets are classified as operating leases. Operating lease costs are recognised as an expense in the income statement on a straight-line basis over the term of the leasing contract. Depreciation charged to the income statement has been calculated on a systematic and straight-line basis, at rates considered to be representative of the estimated useful economic and technical life of the assets. The principal annual depreciation rates applied are the following:
Currency
Average exchange rate
for the year ended
December 31, 2011
Exchange rate as of
December 31, 2011
USD – US Dollar 1.3920 1.2939
PMX – Mexican Peso 17.2805 18.0454
BRL – Brazilian Real 2.3272 2.4337
HK$ - Hong Kong Dollar 10.8364 10.0510
RMB – Reminbi 8.9927 8.1588
INR – Indian Rupia 64.8820 68.7130
BGN – Bulgarian Leva 1.9558 1.9558
Z Beta S.à.r.l.
NOTES TO CONSOLIDATED FINANCIAL STATEMENTS
As of December 31, 2012 and for the year ended December 31, 2012 and 2011
26
Land is not subject to depreciation. Assets under construction are measured at cost, including directly attributable expenses. The tangible asset depreciation related to the assets acquired through the business combination, are based on the residual useful life estimated by the appraisal of an independent advisor.
Leasing Lease agreements, according to which substantially all risks and benefits are transferred to the entity, are classified as financial leases. At initial recognition the leased assets are accounted for at lower of fair market value and the present value of the minimal lease payments. After initial recognition the asset is accounted for according to the relevant accounting policy for this class of assets. Operating lease is a lease agreement that is not a finance lease. Intangible assets Intangible assets are measured at cost of acquisition or internal production, including directly attributable ancillary costs. The cost of an internally generated intangible asset includes only those expenses which can be directly attributed to the asset as from the date when the asset meets the criteria to be classified as an intangible asset. After initial recognition, intangible assets are recorded at cost, net of accumulated amortization and any impairment losses calculated as set out in IAS 36. An intangible asset, which is generated during the development phase of an internal project, which meets the definition of development according to IAS 38, is recognized as an asset if the cost of the asset can be measured reliably, the product / process is technically feasible, if it is probable that the Group will enjoy expected future benefits attributable to the asset developed and the Group intends to and has sufficient resources to complete development and to use or sell the intangible asset. Research costs are recorded as expenses into the income statement as incurred. Assets under construction are measured at cost, including directly attributable expenses. Intangible assets are subject to amortization unless they have undefined useful lives. Amortization is applied systematically over the useful life of the intangible asset in accordance with estimated future economic use. The residual value at the end of the useful life is assumed to be zero unless there is a commitment from third parties to buy the asset at the end of its useful life or if there is an active market for the asset. The directors review the estimated useful lives of intangible assets at every financial year-end. The main annual amortization rates applied are in the following ranges:
# CATEGO RY Life in Years Annual Rate
1 LAND - --
2 BUILDING 30 3.33%
3 INSTALLATIONS 10 10.00%
4 GENERAL EQUIPMENT 10 10%
5 PRODUCTION MACHINERY 8.33 12%
6 MOULD 4 25.00%
7 GENERAL TOOLING 3 33.30%
8 OFFICE EQUIPMENT & FURNITURE 10 10.00%
9 HARDWARE/ELECTRONIC OFFICE EQUIPMENT 5 20%
10 TELECOMMUNICATION EQUIPMENT 5 20%
11 MATERIAL HANDLING EQUIPMENT 5 20.00%
12 CARS AND TRUCKS 4 25.00%
# CATEGORY Life in Years Annual Rate
1 SOFTWARE AND LICENSES 3 33.30%
2 DEVELOPMENT CAPITALIZED COSTS 3 33.30%
3 PATENTS 3 33.30%
4 TRADE MARKS 10 10%
5 OTHER INTANGIBLES 5 20%
Z Beta S.à.r.l.
NOTES TO CONSOLIDATED FINANCIAL STATEMENTS
As of December 31, 2012 and for the year ended December 31, 2012 and 2011
27
Business Combinations and Goodwill Business combinations are accounted for using the acquisition accounting method. This involves recognising identifiable assets (including previously unrecognised intangible assets) and liabilities (including contingent liabilities and excluding future restructuring) of the acquired business at fair value. Goodwill, acquired in a business combination, is initially measured at cost being the excess of the cost of the business combination over the Group’s interest in the net fair value of the acquiree’s identifiable assets, liabilities and contingent liabilities. Following initial recognition, goodwill is measured at cost less any accumulated impairment losses. For the purpose of impairment testing goodwill acquired in a business combination is, from the acquisition date, allocated to each of the Group’s Cash Generating Units (CGU’s), or groups of cash generating units, that are expected to benefit from the synergies of the combination, irrespective of whether other assets or liabilities of the Group are assigned to those units or groups of units. Each unit or group of units to which the goodwill is allocated represents the lowest level within the Group at which the goodwill is monitored for internal management purposes. Goodwill is reviewed for impairment annually or more frequently if events or changes in circumstances indicate that the carrying value may be impaired. Impairment losses relating to goodwill cannot be reversed in future periods. The annual impairment test is performed at the end of each financial year.
Financial receivables and assets Initially, all financial assets are measured at cost, which is equivalent to the amount paid including transaction costs. The classification of financial assets determines their subsequent valuation, which is as follows:
• financial assets held for trading: these are recorded on the basis of fair value, unless this cannot be reliably determined, in which casethey are measured at cost, adjusted for any impairment losses; gains and losses are charged to the income statement;
• held-to-maturity investments, loans receivable and other financial receivables: these are reported on the basis of amortized cost net of write-downs made for any impairment losses; gains and losses relating to this type of asset are taken to the income statement when the investment is eliminated at the due date or when a permanent impairment loss arises;
• loans and receivables: these are non-derivative financial instruments, with fixed and definable payments, not listed in an active market. They are classified within current assets, with the exception of those with expiry dates beyond twelve months after the date of the financial statements, in which instance they are classified as non-current assets Such assets are measured at cost amortized using the effective interest method. Any losses in value resulting from the impairment test are taken to the income statement. In particular, trade receivables, are initially measured at fair value . A provision for doubtful receivables is created when there is objective evidence that the full value of the receivable may not be recoverable. Accruals to the provision for doubtful receivables are recorded in the income statement,
• available-for-sale financial assets: these are measured at fair value, with gains and losses on subsequent re-measurement recognised in a reserve within shareholders’ equity. If the fair value of these assets cannot be measured reliably, they are measured at cost, adjusted for any losses in value. If it is no longer appropriate to classify an investment as “held-to-maturity” following a change of intention or of capacity to hold it until maturity, it must be reclassified as “available-for-sale” and measured at fair value. The difference between the book value and fair value remains in shareholders’ equity until the financial asset is sold or otherwise transferred, in which case it is charged to the income statement.
Financial assets are de-recognized from the balance sheet when the right to receive cash flows from the instrument is extinguished and the Group has transferred all risks and rewards relative to the instrument.
Derivative instruments Derivative instruments are used for hedging purposes in order to reduce the interest rate risks. Consistent with IAS 39 requirements, derivative financial instruments may be recorded using the hedge accounting method only when, at inception of the hedge, there is formal designation and documentation of the hedge itself, the hedge is expected to be highly effective, the effectiveness can be measured and the hedge is highly effective throughout the various accounting periods for which it is designated. All derivative financial instruments are measured at fair value. If hedge accounting cannot be applied, the gains and losses deriving from measurement of the derivative financial instrument at fair value is recorded in the income statement.
Z Beta S.à.r.l.
NOTES TO CONSOLIDATED FINANCIAL STATEMENTS
As of December 31, 2012 and for the year ended December 31, 2012 and 2011
28
Inventories Stocks of raw and consumable materials are measured at the lower of purchase cost, including ancillary expenses, calculated using the weighted average cost method, and estimated realizable value (equivalent to replacement cost), based on market prices at the end of the period. Finished and semi-finished products are valued at the production cost. This cost includes both raw materials and direct production costs based on normal operating capacity. Where the estimated realizable value is less than the production cost, the inventory is written down to estimated realizable value and a provision for inventory obsolescence is accrued. The accrual to this provision is recorded directly in the income statement. Cash and cash equivalents Cash and cash equivalents include cash in hand and short-term high liquidity investments. Employee termination benefits Employee termination indemnities (including Italian TFR “Trattamento di fine Rapporto”) are subject to actuarial valuation using the projected unit credit method, discounted to present value using a rate of interest which reflects the market yield on the securities issued by leading companies, with maturities equal to that expected for the liability; the calculation considers TFR to have already matured for employee services already performed. The amount related to the benefits matured by the employees during the year has been considered as labour cost. The financial component for the actualization process has been classified as below financial expenses.
Income Tax Current income tax assets and liabilities are measured at the amount expected to be recovered from or paid to the taxation authorities. The tax rates and tax laws used to compute the amount are those that are enacted or substantively enacted by the balance sheet date.
Deferred income tax
Deferred income tax is provided in full, using the liability method, on temporary differences between the tax bases of assets and liabilities and their carrying amounts in the consolidated financial statements. Deferred income tax is calculated using tax rates (and tax laws) that have been enacted or substantively enacted by the balance sheet date and are expected to apply when the related deferred income tax asset is realised or the deferred income tax liability is settled. Deferred income tax assets are recognised to the extent that it is probable that future taxable profit will be available against which the unused tax losses and unused tax credits can be utilised. The same principle applies for the recording of deferred tax assets for tax losses carried forward. Income tax relating to items recognised directly in equity is recognised in equity and not in the income statement. Deferred tax assets and liabilities are classified under non-current assets and liabilities in the balance sheet. Deferred tax assets and deferred tax liabilities are offset within the same entity if a legally enforceable right exists to set off current tax assets against current tax liabilities and the deferred taxes relate to the same taxable entity and the same taxation authority. Contingent liability reserves The Group makes accruals only when a current obligation exists for a future outflow of economic resources as a result of past events, and when it is probable that this outflow of economic resources will be required to settle the obligation, and the amount of the same can be reasonably estimated. The amount accrued in the accounts is the best estimate of the expense required to completely extinguish the current obligation. Any restructuring costs are recognized when the Group has drawn up a detailed restructuring plan and has communicated it to interested parties.
Z Beta S.à.r.l.
NOTES TO CONSOLIDATED FINANCIAL STATEMENTS
As of December 31, 2012 and for the year ended December 31, 2012 and 2011
29
Financial liabilities Loans are initially measured at fair value net of directly related costs and are subsequently measured at amortized costusing the effective interest method. If there is a change in expected cash flows and the management is able to reliably estimate this, the value of the loans is recalculated to reflect the expected change in cash flows. If an exchange of debt instruments or modification of terms is accounted for as an extinguishment, any costs or fees incurred are recognized as part of the gain or loss on the extinguishment. If the exchange or modification is not accounted for as an extinguishment, any costs or fees incurred adjust the carrying amount of the liability and are amortized over the remaining term of the modified liability. Loans are removed from the balance sheet when they are extinguished and the Group has transferred all risks and charges relative to the instrument. Current liabilities are carried at nominal value or at the amount repayable. Non-current liabilities are carried at amortized cost. Translation of foreign currency operations
Elements in currencies other than the functional currency, both monetary (liquid assets, assets and liabilities which will be paid in set or determinable amounts of cash etc.), and non-monetary (payments on account to suppliers of goods and/or services, goodwill, intangible assets etc.), are initially recorded at the exchange rate at the date when the transaction takes place. Subsequently, monetary items are translated to the functional currency on the basis of exchange rates at the date of the financial statements and
VI) USE OF ESTIMATES
The preparation of the consolidated financial statements in accordance with IFRS requires assumptions and estimates to be made which have an effect on the carrying amounts of recognized assets and liabilities, income and expenses and contingent liabilities. Assumptions and estimates are generally based on uniform useful lives of assets, impairment tests, in particular for goodwill, accounting and measurement policies for provisions and the probability of future tax benefits, in particular with regard to tax loss carry forward. The actual figures may in some cases differ from the assumptions and estimates. Changes are recognized in the income statement as and when better information is available. We indicate below the critical accounting estimates used in finalizing the financial statements and the interim accounting reports because they involve significant recourse to subjective judgements, assumptions and estimates. Seasonality of operations
On an annual basis demand for pest control products is relatively stable due to the non-discretionary nature of the product; however local weather conditions can cause significant fluctuations in sales. Production of pest control products is seasonal, and peak demand occurs during the spring and the summer when insects and other pests are most active; however changes in weather conditions from year to year can have a substantial impact on insect populations in different geographic regions which directly impacts demand for pest control products. The Group’s financial results for any individual quarter are typically sensitive to seasonality, however, results for interim periods are not necessarily indicative of results that may be expected for any other interim periods or for a full year. Operating segment information The board of directors is the Group’s chief operating decision-maker. Management has determined the operating segments based on the information reviewed by the board of directors for the purposes of allocating resources and assessing performance, as follows:
• Air fresheners;
• Insecticide. The Board of Directors assess the performance of the operating segments based on gross profit. Specifically, management believes that gross profit provides an important measure of the Group’s operating performance.

Z Beta S.à.r.l.
NOTES TO CONSOLIDATED FINANCIAL STATEMENTS
As of December 31, 2012 and for the year ended December 31, 2012 and 2011
30
The following table presents revenue and profit information regarding the Group’s operating segments for the twelve months ended December 31, 2012 and 2011
Refer to Note 20 for the analysis of sales by geographical area. Impairment testing Tangible fixed assets and intangible assets are impaired in value when events or changed circumstances indicate that the value recorded in the balance sheet is not recoverable. The impairment is calculated by comparing the book value with the relative recoverable value, represented by the greater of fair value, net of disposal costs, and the value in use, calculated by discounting to present value expected cash flows deriving from use of the asset, net of disposal costs. Expected cash flows are quantified in the light of information available when the estimate is made, on the basis of subjective opinions on the trend of future variables – such as prices, costs, growth rates of demand and production profiles – and discounted to present value using a rate which takes into account the risk inherent in the asset in question. With reference to the impairment test of the Goodwill, consistency with last year, the following approaches have been adopted:
• the analyses have been performed on the Enterprise Value level and have been based on the approach of the Value in Use;
• the identified CGUs, “Cash Generated Units”, (Air Freshener and Insecticide) are the smallest identifiable group of assets that generates cash inflows from continuing use, and are largely independent of the cash inflows from other assets or groups of assets;
• the CGUs are in line with last year;
• the Value in Use has been determined using the Discounted Cash Flow (DCF) methodology, which states that the economic value of the invested capital is equal to the present value of the following components:
In thousands of Euro
AIR FRESHENER (*) INSECTICIDE TOTAL
NET SALES 259,850 77,786 337,637
Cost Of Sales 213,964 59,489 273,453
GROSS PROFIT 45,887 18,297 64,184
Gross profit % on net sales 17.7% 23.5% 19.0%
EBITDA before non recurring transactions 43,046
EBITDA before non recurring transactions % on total net sales 13%
EARNINGS BEFORE INTEREST & TAXES & NON RECURRING TRANSACTIONS 28,348
Ebit % on total net sales 8%
EARNINGS BEFORE INTEREST & TAXES 21,511
PROFIT BEFORE TAXES (9,035)
GROUP NET INCOME (16,001)
* Air Freshener also includes other products
For the twelve months ended December 31, 2012
In thousands of Euro
AIR FRESHENER (*) INSECTICIDE TOTAL
NET SALES 237,331 75,962 313,293
Cost Of Sales 192,479 57,752 250,231
GROSS PROFIT 44,852 18,210 63,062
Gross profit % on net sales 18.9% 24.0% 20.1%
EBITDA before non recurring transactions 40,391
EBITDA before non recurring transactions % on total net sales 13%
EARNINGS BEFORE INTEREST & TAXES & NON RECURRING TRANSACTIONS 27,610
Ebit % on total net sales 9%
EARNINGS BEFORE INTEREST & TAXES 26,090
PROFIT BEFORE TAXES (2,597)
GROUP NET INCOME (10,176)
* Air Freshener also includes other products
For the twelve months ended December 31, 2011
Z Beta S.à.r.l.
NOTES TO CONSOLIDATED FINANCIAL STATEMENTS
As of December 31, 2012 and for the year ended December 31, 2012 and 2011
31
� sum of net operating cash flows generated in each year of the explicit forecast period; � the terminal value, understood as the cash flows the company will be able to generate beyond the explicit
forecast period. � WACC (Weighted Average Cost of Capital) has been used as a discount rate for both CGUs.
Provisions
The Group makes accruals mainly connected to employee benefits and legal and tax disputes. Restructuring
The Group recognises liabilities for employee, severance and other costs in connection with a restructuring programme once it meets certain recognition criteria. The requirements are that the Group has made a commitment to a plan, that this plan has been announced and its benefits communicated, and that the timescale for completion means that significant changes are unlikely. The liabilities recognised represent management’s best estimate of a programme’s cost, but involve the use of assumptions and estimates with regard to the timing and scale of costs to be incurred. The actual expenditure required may differ as a programme is implemented.
Deferred taxes The recording of deferred tax assets is made on the basis of profit expectations in future years. The valuation of expected profits for the purpose of recording deferred tax depends on factors which can change over time and have significant impacts on the valuation of the deferred tax assets. Estimate of fair value The fair value of financial instruments listed in an active market is based on prices quoted on the date of the financial statements. The fair value of financial instruments not traded in an active market is calculated by valuation techniques. Various techniques are used and assumptions are based on market conditions at the date of the financial statements. In particular, the fair value of interest rate swaps is calculated on the basis of the present value of future cash flows. Pensions Accounting for pensions and post-retirement benefit plans requires the use of estimates and assumptions regarding numerous factors, including discount rate, rate of return on plan assets, mortality and employee turnover. Actual results may differ from the Group’s actuarial assumptions, which may have an impact on the amount of reported expense or liability for pensions or post retirement benefits.
VII) ACCOUNTING STANDARDS APPROVED BY THE EUROPEAN COMMISSION
Summarized below are the international financial reporting standards, interpretation and amendments to the existing standards and interpretations or specific provisions included in standards or interpretations approved by the IASB, with an indication of EU adoption status as at the date of these December 2012 Consolidated Financial Statements. The further additional standard, interpretation and amendments approved by the IASB between the balance sheet date and the date of the approval have no impact on the preparation of these accounts. Accounting standards and interpretations issued by IASB /IFRIC and endorsed by EU
New IFRS 13 – Fair value measurement
The new IFRS clarify the determination of the fair value for the purpose of the financial statements and applying to all IFRS standards permitting or requiring a fair value measurement or the presentation of disclosures based on fair value. The Group is currently reviewing and assessing these new standards and interpretations to determine the likely impact on the Group’s results (if any) in the future.
Z Beta S.à.r.l.
NOTES TO CONSOLIDATED FINANCIAL STATEMENTS
As of December 31, 2012 and for the year ended December 31, 2012 and 2011
32
Amendments to IAS 19 – Employee benefits The amendments modify the requirements for recognizing defined benefit plans and termination benefits. The Group is currently reviewing and assessing these new standards and interpretations to determine the likely impact on the Group’s results (if any) in the future. Amendments to IFRS 7 – (amended) Financial instruments: Disclosures - Offsetting financial assets and
financial liabilities
Disclosures – transfer of financial assets These amendments seek to improve financial statement disclosures and consequently improve the transparency and comparability of transactions involving the transfer of financial assets (e.g. securitisations), including the possible effects of risks for which the transferor remains liable. These amendments were endorsed by the European Union in November 2011 (EC Regulation 1205/2011) and are applicable from January 1, 2012. They will have no impact on the Group consolidated financial statements. The Group is currently reviewing and assessing these new standards and interpretations to determine the likely impact on the Group’s results (if any) in the future. New IFRS 10 – Consolidated financial statements
The new standard replaces IAS 27 – Consolidated and Separate Financial Statements – for the portion relating to the consolidated financial statements – and SIC 12 – Consolidation – Special Purpose Entities. IAS 27 – renamed “Separate Financial Statements” –contains only the principles and guidelines to be used in preparing the separate financial statements. The new version of IFRS 10 defines just one control model that applies to all entities and represents the key factor in determining whether an entity has to be consolidated. Instead, the accounting treatment and consolidation procedures have not changed from what is currently envisaged in IAS 27. The new control model introduces a greater degree of subjectivity and will demand that management exercise a higher standard of judgement to determine whether an entity is controlled and thus has to be consolidated. This new standard also explicitly envisages the possibility of controlling an entity even in the absence of a majority of votes (de facto control), a concept that was not explicitly stated in IAS 27. This standard, which will come into force on January 1, 2013, has not been endorsed yet by the European Union. The impact on the scope of consolidation resulting from introduction of the new standard on first time application is currently being analysed. The Group is currently reviewing and assessing these new standards and interpretations to determine the likely impact on the Group’s results (if any) in the future. New IFRS 12 – Disclosures of interests in other entities
The new standard introduces a new and comprehensive standard on disclosure requirements for all forms of interest in other entities. The Group is currently reviewing and assessing these new standards and interpretations to determine the likely impact on the Group’s results (if any) in the future. Amendments to IAS 32 - Financial instruments: Presentation - Offsetting financial assets and financial liabilities
The amendment clarifies the application of certain offsetting criteria for financial assets and financial liabilities. Accounting standards and interpretations issued by IASB/IFRIC and not yet endorsed by EU Pursuant to IAS 8 – Accounting Policies, Changes in Accounting Estimates and Errors, the new standards and/or interpretations that have been issued but are not yet in force or not yet endorsed by the European Union, and which are therefore not applicable, are mentioned and described briefly as follows. None of these standards and interpretations has been early adopted by the Group.
Amendments to IAS 1 – Presentation of Financial Statement The amendment clarifies the way in which comparative information should be presented when an entity changes accounting policies ore retrospectively restates or reclassifies items in its financial statements and when an entity provides comparative information in addition to the minimum comparative financial statements. The Group is currently reviewing and assessing these new standards and interpretations to determine the likely impact on the Group’s results (if any) in the future.

Z Beta S.à.r.l.
NOTES TO CONSOLIDATED FINANCIAL STATEMENTS
As of December 31, 2012 and for the year ended December 31, 2012 and 2011
33
Amendments to IAS 16 – Property Plant and Equipment The amendment clarifies that items such as spare parts, stand-by equipment and servicing equipment, shall be recognized in accordance with IAS 16 when they meet the definition of Property, plant and equipment, otherwise such items shall be classified as Inventory. The Group is currently reviewing and assessing these new standards and interpretations to determine the likely impact on the Group’s results (if any) in the future. Amendments to IAS 32 – Financial Instruments: Presentation The amendment eliminates an inconsistency between IAS 12 – Income Taxes and IAS 32 concerning the recognition of taxation arising from distribution to shareholders.
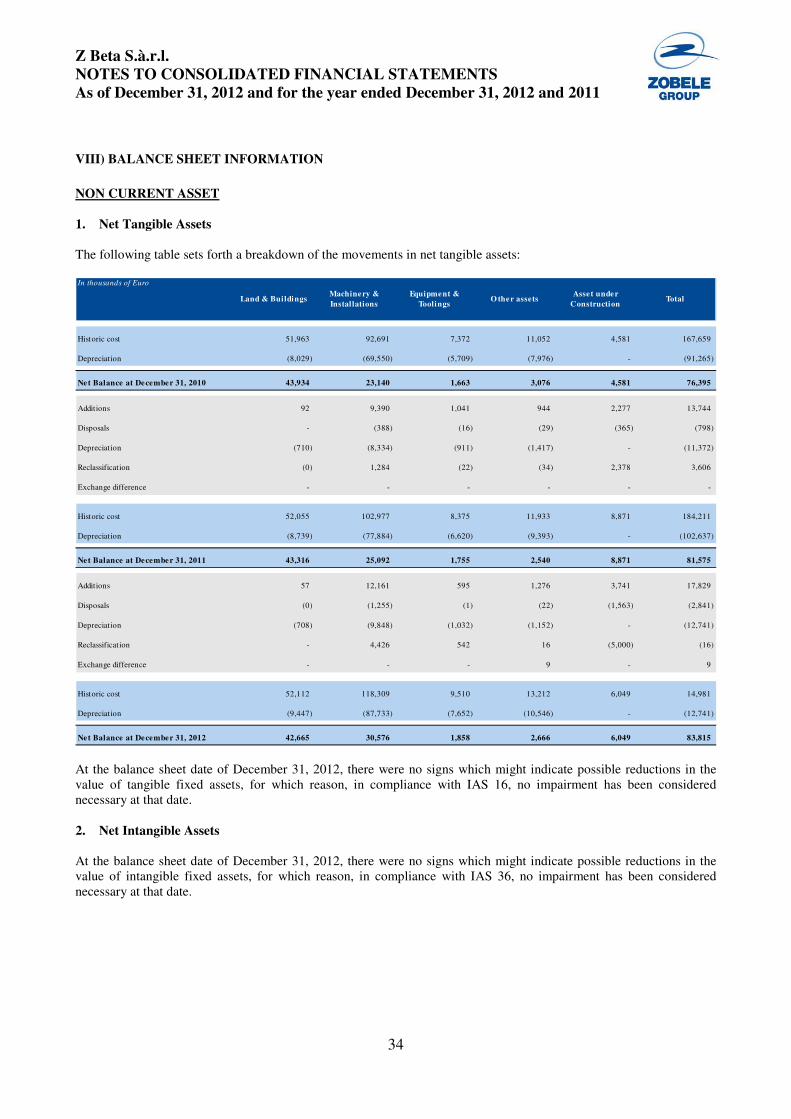
Z Beta S.à.r.l.
NOTES TO CONSOLIDATED FINANCIAL STATEMENTS
As of December 31, 2012 and for the year ended December 31, 2012 and 2011
34
VIII) BALANCE SHEET INFORMATION
NON CURRENT ASSET 1. Net Tangible Assets
The following table sets forth a breakdown of the movements in net tangible assets:
At the balance sheet date of December 31, 2012, there were no signs which might indicate possible reductions in the value of tangible fixed assets, for which reason, in compliance with IAS 16, no impairment has been considered necessary at that date. 2. Net Intangible Assets
At the balance sheet date of December 31, 2012, there were no signs which might indicate possible reductions in the value of intangible fixed assets, for which reason, in compliance with IAS 36, no impairment has been considered necessary at that date.
In thousands of Euro
Land & BuildingsMachinery &
Instal lations
Equipment &
ToolingsO ther assets
Asset under
ConstructionTotal
Historic cost 51,963 92,691 7,372 11,052 4,581 167,659
Depreciation (8,029) (69,550) (5,709) (7,976) - (91,265)
Net Balance at December 31, 2010 43,934 23,140 1,663 3,076 4,581 76,395
Additions 92 9,390 1,041 944 2,277 13,744
Disposals - (388) (16) (29) (365) (798)
Depreciation (710) (8,334) (911) (1,417) - (11,372)
Reclassification (0) 1,284 (22) (34) 2,378 3,606
Exchange difference - - - - - -
Historic cost 52,055 102,977 8,375 11,933 8,871 184,211
Depreciation (8,739) (77,884) (6,620) (9,393) - (102,637)
Net Balance at December 31, 2011 43,316 25,092 1,755 2,540 8,871 81,575
Additions 57 12,161 595 1,276 3,741 17,829
Disposals (0) (1,255) (1) (22) (1,563) (2,841)
Depreciation (708) (9,848) (1,032) (1,152) - (12,741)
Reclassification - 4,426 542 16 (5,000) (16)
Exchange difference - - - 9 - 9
Historic cost 52,112 118,309 9,510 13,212 6,049 14,981
Depreciation (9,447) (87,733) (7,652) (10,546) - (12,741)
Net Balance at December 31, 2012 42,665 30,576 1,858 2,666 6,049 83,815
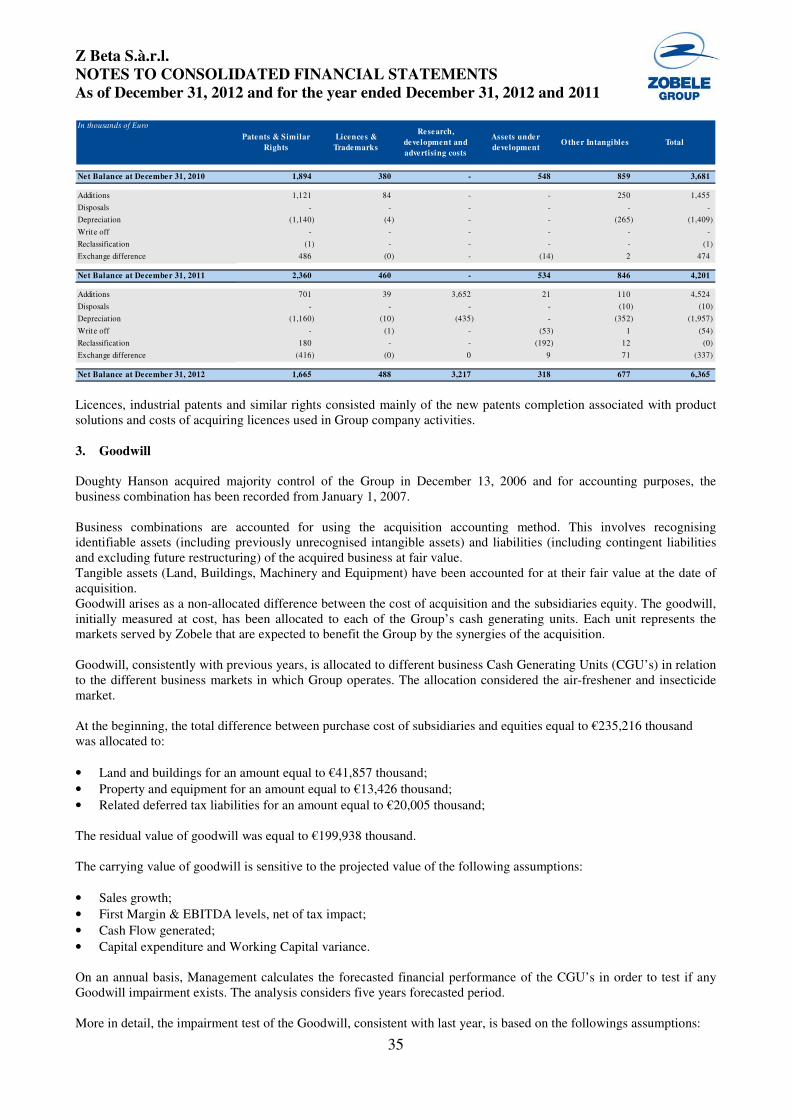
Z Beta S.à.r.l.
NOTES TO CONSOLIDATED FINANCIAL STATEMENTS
As of December 31, 2012 and for the year ended December 31, 2012 and 2011
35
Licences, industrial patents and similar rights consisted mainly of the new patents completion associated with product solutions and costs of acquiring licences used in Group company activities. 3. Goodwill Doughty Hanson acquired majority control of the Group in December 13, 2006 and for accounting purposes, the business combination has been recorded from January 1, 2007. Business combinations are accounted for using the acquisition accounting method. This involves recognising identifiable assets (including previously unrecognised intangible assets) and liabilities (including contingent liabilities and excluding future restructuring) of the acquired business at fair value. Tangible assets (Land, Buildings, Machinery and Equipment) have been accounted for at their fair value at the date of acquisition. Goodwill arises as a non-allocated difference between the cost of acquisition and the subsidiaries equity. The goodwill, initially measured at cost, has been allocated to each of the Group’s cash generating units. Each unit represents the markets served by Zobele that are expected to benefit the Group by the synergies of the acquisition. Goodwill, consistently with previous years, is allocated to different business Cash Generating Units (CGU’s) in relation to the different business markets in which Group operates. The allocation considered the air-freshener and insecticide market. At the beginning, the total difference between purchase cost of subsidiaries and equities equal to €235,216 thousand was allocated to:
• Land and buildings for an amount equal to €41,857 thousand;
• Property and equipment for an amount equal to €13,426 thousand;
• Related deferred tax liabilities for an amount equal to €20,005 thousand; The residual value of goodwill was equal to €199,938 thousand. The carrying value of goodwill is sensitive to the projected value of the following assumptions:
• Sales growth;
• First Margin & EBITDA levels, net of tax impact;
• Cash Flow generated;
• Capital expenditure and Working Capital variance. On an annual basis, Management calculates the forecasted financial performance of the CGU’s in order to test if any Goodwill impairment exists. The analysis considers five years forecasted period. More in detail, the impairment test of the Goodwill, consistent with last year, is based on the followings assumptions:
In thousands of Euro
Patents & Similar
Rights
Licences &
Trademarks
Research,
development and
advertising costs
Assets under
developmentOther Intangibles Total
Net Balance at December 31, 2010 1,894 380 - 548 859 3,681
Additions 1,121 84 - - 250 1,455
Disposals - - - - - -
Depreciation (1,140) (4) - - (265) (1,409)
Write off - - - - - -
Reclassification (1) - - - - (1)
Exchange difference 486 (0) - (14) 2 474
Net Balance at December 31, 2011 2,360 460 - 534 846 4,201
Additions 701 39 3,652 21 110 4,524
Disposals - - - - (10) (10)
Depreciation (1,160) (10) (435) - (352) (1,957)
Write off - (1) - (53) 1 (54)
Reclassification 180 - - (192) 12 (0)
Exchange difference (416) (0) 0 9 71 (337)
Net Balance at December 31, 2012 1,665 488 3,217 318 677 6,365
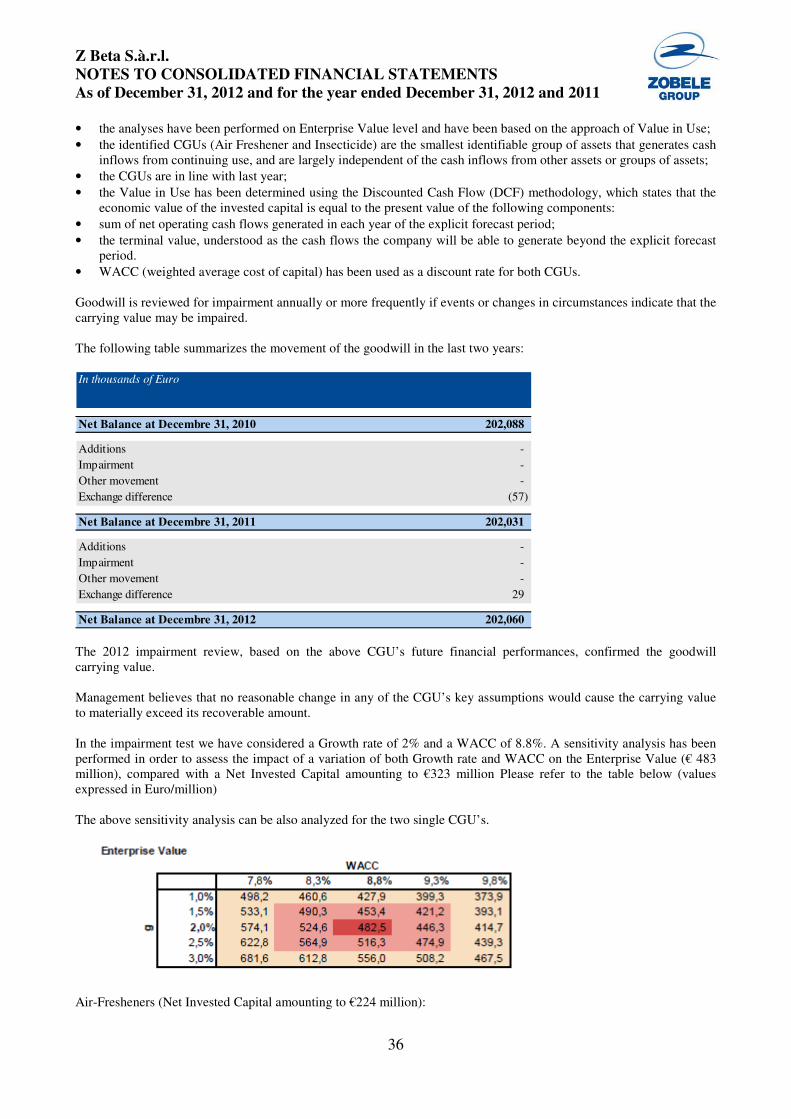
Z Beta S.à.r.l.
NOTES TO CONSOLIDATED FINANCIAL STATEMENTS
As of December 31, 2012 and for the year ended December 31, 2012 and 2011
36
• the analyses have been performed on Enterprise Value level and have been based on the approach of Value in Use;
• the identified CGUs (Air Freshener and Insecticide) are the smallest identifiable group of assets that generates cash inflows from continuing use, and are largely independent of the cash inflows from other assets or groups of assets;
• the CGUs are in line with last year;
• the Value in Use has been determined using the Discounted Cash Flow (DCF) methodology, which states that the economic value of the invested capital is equal to the present value of the following components:
• sum of net operating cash flows generated in each year of the explicit forecast period;
• the terminal value, understood as the cash flows the company will be able to generate beyond the explicit forecast period.
• WACC (weighted average cost of capital) has been used as a discount rate for both CGUs. Goodwill is reviewed for impairment annually or more frequently if events or changes in circumstances indicate that the carrying value may be impaired. The following table summarizes the movement of the goodwill in the last two years:
The 2012 impairment review, based on the above CGU’s future financial performances, confirmed the goodwill carrying value. Management believes that no reasonable change in any of the CGU’s key assumptions would cause the carrying value to materially exceed its recoverable amount. In the impairment test we have considered a Growth rate of 2% and a WACC of 8.8%. A sensitivity analysis has been performed in order to assess the impact of a variation of both Growth rate and WACC on the Enterprise Value (€ 483 million), compared with a Net Invested Capital amounting to €323 million Please refer to the table below (values expressed in Euro/million) The above sensitivity analysis can be also analyzed for the two single CGU’s.
Air-Fresheners (Net Invested Capital amounting to €224 million):
In thousands of Euro
Net Balance at Decembre 31, 2010 202,088
Additions -
Impairment -
Other movement -
Exchange difference (57)
Net Balance at Decembre 31, 2011 202,031
Additions -
Impairment -
Other movement -
Exchange difference 29
Net Balance at Decembre 31, 2012 202,060

Z Beta S.à.r.l.
NOTES TO CONSOLIDATED FINANCIAL STATEMENTS
As of December 31, 2012 and for the year ended December 31, 2012 and 2011
37
Insecticides (Net Invested Capital amounting to €100 million):
Capital expenditure has been judged a factor managed and controlled by the company and not influenced by the market trend. 4. Other Investments
The amount of €0,5 million of Investments in “Fondos de Inversion del Mercado Monetario – FIAMM”, from Zobele Spain, are pledged as guarantee for certain refundable grants and advances received from the Spain Ministry of Science and Technology. The amount of €6 thousand reported in the balance sheet is related to other minor investments. 5. Deferred Tax Assets
The amounts of deferred tax assets for which recovery is expected within or beyond the next financial year is as follows:
Temporary timing differences have been calculated between balance sheet values and values for tax purposes. The composition of deferred tax assets in the financial year at December 31, 2012 is shown in the table below, where the effects on the income statement and balance sheet, and any reclassifications are summarised.
In thousands of Euro Net Value
Entity Country Owned % Purchased Cost Reserve as at 31 December
2012
Coil Master SDN. BHD. Malaysia 29% 39 (39) --
Investments in “Fondos de Inversion del Mercado Monetario – FIAMM” Spain 100% 578 -- 576
In thousands of Euro As of December 31, P&L Equity As of December 31,
2011 movements movements 2012
Deferred tax assets non current 3,688 144 - 3,832
Deferred tax assets current 767 1,454 (194) 2,027
Total deferred tax assets 4,455 1,598 (194) 5,860
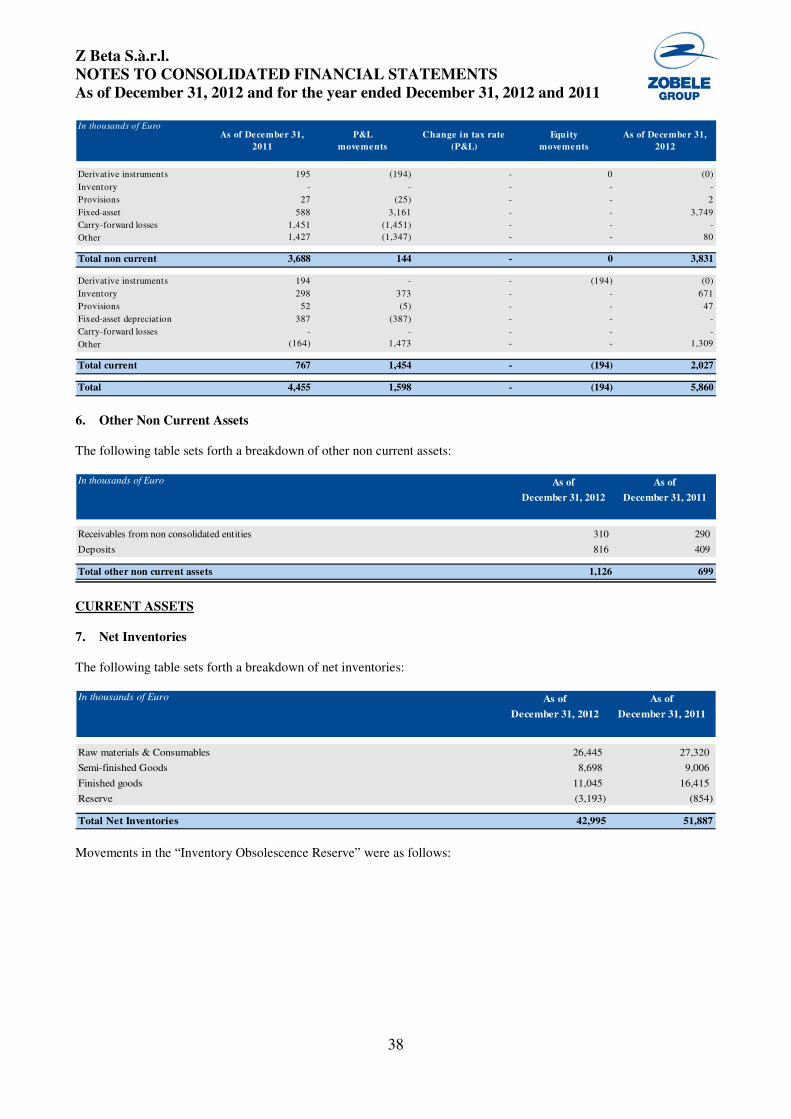
Z Beta S.à.r.l.
NOTES TO CONSOLIDATED FINANCIAL STATEMENTS
As of December 31, 2012 and for the year ended December 31, 2012 and 2011
38
6. Other Non Current Assets The following table sets forth a breakdown of other non current assets:
CURRENT ASSETS 7. Net Inventories The following table sets forth a breakdown of net inventories:
Movements in the “Inventory Obsolescence Reserve” were as follows:
In thousands of EuroAs of December 31,
2011
P&L
movements
Change in tax rate
(P&L)
Equity
movements
As of December 31,
2012
Derivat ive instruments 195 (194) - 0 (0)
Inventory - - - - -
Provisions 27 (25) - - 2
Fixed-asset 588 3,161 - - 3,749
Carry-forward losses 1,451 (1,451) - - -
Other 1,427 (1,347) - - 80
Total non current 3,688 144 - 0 3,831
Derivat ive instruments 194 - - (194) (0)
Inventory 298 373 - - 671
Provisions 52 (5) - - 47
Fixed-asset depreciation 387 (387) - - -
Carry-forward losses - - - - -
Other (164) 1,473 - - 1,309
Total current 767 1,454 - (194) 2,027
Total 4,455 1,598 - (194) 5,860
In thousands of Euro As of As of
December 31, 2012 December 31, 2011
Receivables from non consolidated entities 310 290
Deposits 816 409
Total other non current assets 1,126 699
In thousands of Euro As of As of
December 31, 2012 December 31, 2011
Raw materials & Consumables 26,445 27,320
Semi-finished Goods 8,698 9,006
Finished goods 11,045 16,415
Reserve (3,193) (854)
Total Net Inventories 42,995 51,887
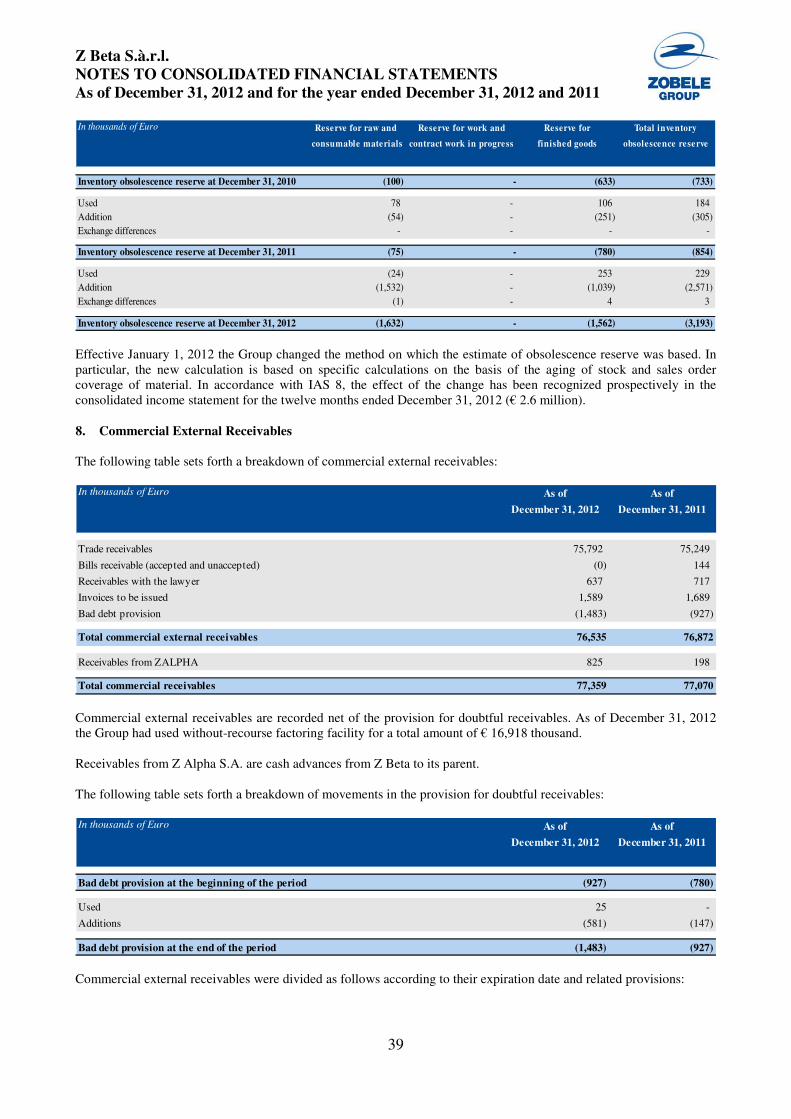
Z Beta S.à.r.l.
NOTES TO CONSOLIDATED FINANCIAL STATEMENTS
As of December 31, 2012 and for the year ended December 31, 2012 and 2011
39
Effective January 1, 2012 the Group changed the method on which the estimate of obsolescence reserve was based. In particular, the new calculation is based on specific calculations on the basis of the aging of stock and sales order coverage of material. In accordance with IAS 8, the effect of the change has been recognized prospectively in the consolidated income statement for the twelve months ended December 31, 2012 (€ 2.6 million). 8. Commercial External Receivables The following table sets forth a breakdown of commercial external receivables:
Commercial external receivables are recorded net of the provision for doubtful receivables. As of December 31, 2012 the Group had used without-recourse factoring facility for a total amount of € 16,918 thousand.
Receivables from Z Alpha S.A. are cash advances from Z Beta to its parent. The following table sets forth a breakdown of movements in the provision for doubtful receivables:
Commercial external receivables were divided as follows according to their expiration date and related provisions:
In thousands of Euro Reserve for raw and Reserve for work and Reserve for Total inventory
consumable materials contract work in progress finished goods obsolescence reserve
Inventory obsolescence reserve at December 31, 2010 (100) - (633) (733)
Used 78 - 106 184
Addition (54) - (251) (305)
Exchange differences - - - -
Inventory obsolescence reserve at December 31, 2011 (75) - (780) (854)
Used (24) - 253 229
Addition (1,532) - (1,039) (2,571)
Exchange differences (1) - 4 3
Inventory obsolescence reserve at December 31, 2012 (1,632) - (1,562) (3,193)
In thousands of Euro As of As of
December 31, 2012 December 31, 2011
Trade receivables 75,792 75,249
Bills receivable (accepted and unaccepted) (0) 144
Receivables with the lawyer 637 717
Invoices to be issued 1,589 1,689
Bad debt provision (1,483) (927)
Total commercial external receivables 76,535 76,872
Receivables from ZALPHA 825 198
Total commercial receivables 77,359 77,070
In thousands of Euro As of As of
December 31, 2012 December 31, 2011
Bad debt provision at the beginning of the period (927) (780)
Used 25 -
Additions (581) (147)
Bad debt provision at the end of the period (1,483) (927)
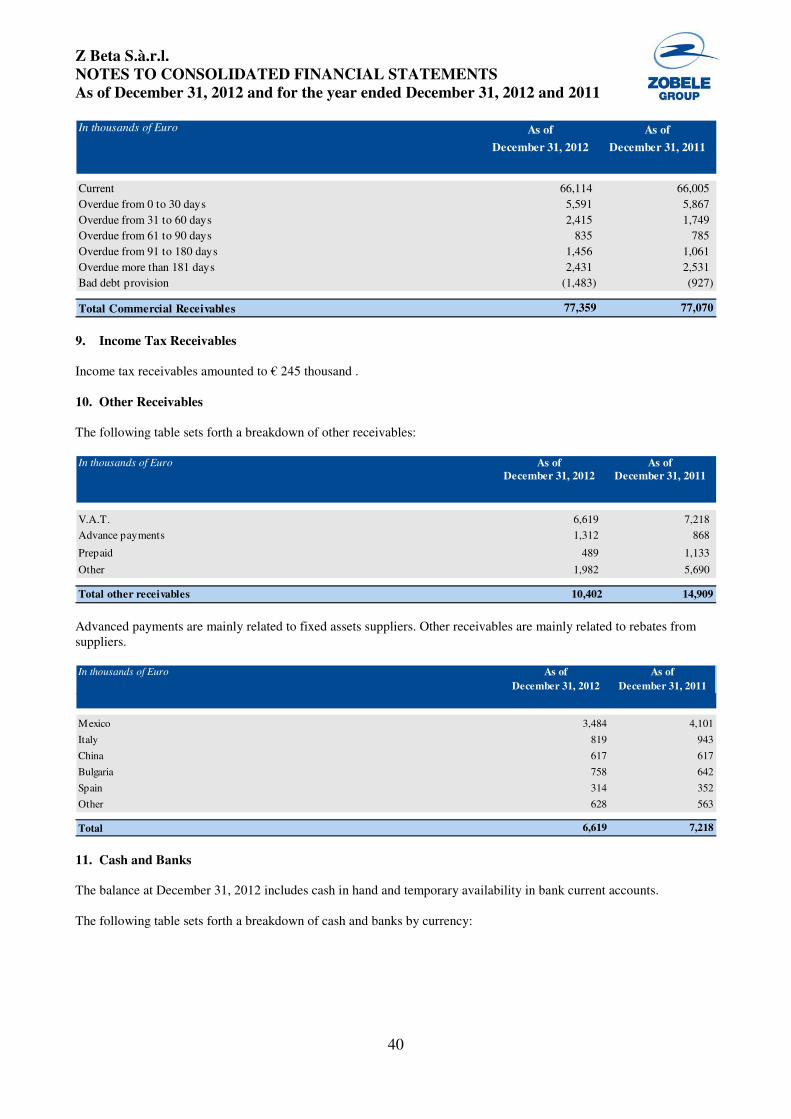
Z Beta S.à.r.l.
NOTES TO CONSOLIDATED FINANCIAL STATEMENTS
As of December 31, 2012 and for the year ended December 31, 2012 and 2011
40
9. Income Tax Receivables Income tax receivables amounted to € 245 thousand . 10. Other Receivables The following table sets forth a breakdown of other receivables:
Advanced payments are mainly related to fixed assets suppliers. Other receivables are mainly related to rebates from suppliers.
11. Cash and Banks The balance at December 31, 2012 includes cash in hand and temporary availability in bank current accounts. The following table sets forth a breakdown of cash and banks by currency:
In thousands of Euro As of As of
December 31, 2012 December 31, 2011
Current 66,114 66,005
Overdue from 0 to 30 days 5,591 5,867
Overdue from 31 to 60 days 2,415 1,749
Overdue from 61 to 90 days 835 785
Overdue from 91 to 180 days 1,456 1,061
Overdue more than 181 days 2,431 2,531
Bad debt provision (1,483) (927)
Total Commercial Receivables 77,359 77,070
In thousands of Euro As of As of
December 31, 2012 December 31, 2011
V.A.T. 6,619 7,218
Advance payments 1,312 868
Prepaid 489 1,133
Other 1,982 5,690
Total other receivables 10,402 14,909
In thousands of Euro As of As of
December 31, 2012 December 31, 2011
Mexico 3,484 4,101
Italy 819 943
China 617 617
Bulgaria 758 642
Spain 314 352
Other 628 563
Total 6,619 7,218

Z Beta S.à.r.l.
NOTES TO CONSOLIDATED FINANCIAL STATEMENTS
As of December 31, 2012 and for the year ended December 31, 2012 and 2011
41
12. Group Equity Share Capital and Share premium account The subscribed capital, amounting to €14,000 thousand is represented by 560,000 shares with a nominal value of €25 fully paid and fully owned by Z Alpha S.A. The share premium reserve amounted to € 224,341 thousand as of December 31, 2012 On September 5, 2012, the shareholder made a contribution in cash to the capital reserves (capital contribution without issue of shares) of the Company for an amount of €10,000 thousand. On December 31, 2012, the loan granted by Z Alpha S.A. to the Company for an amount of €146,479 thousand including capitalized and accrued interest was contributed to the capital reserves (capital contribution without issue of shares). We highlight that all the shares of the Z Beta S.à.r.l. are pledged in favor of a bank pursuant to a pledge agreement dated December 13, 2006 described in the following Note 14. Legal reserve In accordance with Luxembourg company law, the Company is required to transfer a minimum of 5% of its net profit for each financial year to a legal reserve. This requirement ceases to be necessary once the balance on the legal reserve reaches 10% of the issued share capital. The legal reserve is not available for distribution to the shareholders. As at December 31, 2011, the legal reserve amounts to €1,400 thousand.
Currency Translation Reserve
The currency translation includes the effects of translating the financial statements of the following subsidiaries into Euro:
In thousands of Euro
Amounts in local currency Exchange rate at year end Amounts in Euro
Euro (EURO) 8,502 1 8,502
US Dollar (US $) 24,664 1.3194 18,693
Mexican Peso (PMX) 494 17.0889 29
Brasilian Real (BR $) 350 2.6949 130
Honk Kong Dollar (HK $) 1,241 10.2260 121
Rembimbi (RMB) 9,588 8.2207 1,166
Indian Rupia (INR) 17,282 72.5600 238
Bulgarian Leva (BGN) (1,084) 1.9558 (554)
Pound (GBP) 4 0.8161 5
Canadian Dollar (CAD) 44 1.3137 33
Australian Dollar (AUD) - 1.2712 -
Total Cash & Bank As of 31, December 2012 28,364
Euro (EURO) 1,544 1.0000 1,544
US Dollar (US $) 10,082 1.2939 7,792
Mexican Peso (PMX) 10,812 18.0454 599
Brasilian Real (BR $) 684 2.4337 281
Honk Kong Dollar (HK $) 813 10.0510 81
Rembimbi (RMB) 1,226 8.1588 150
Indian Rupia (INR) 43,950 68.7130 640
Bulgarian Leva (BGN) 0 1.9558 0
Pound (GBP) 196 0.8353 235
Canadian Dollar (CAD) - 1.5128 -
Australian Dollar (AUD) - 1.6008 -
Total Cash & Bank As of 31, December 2011 11,322
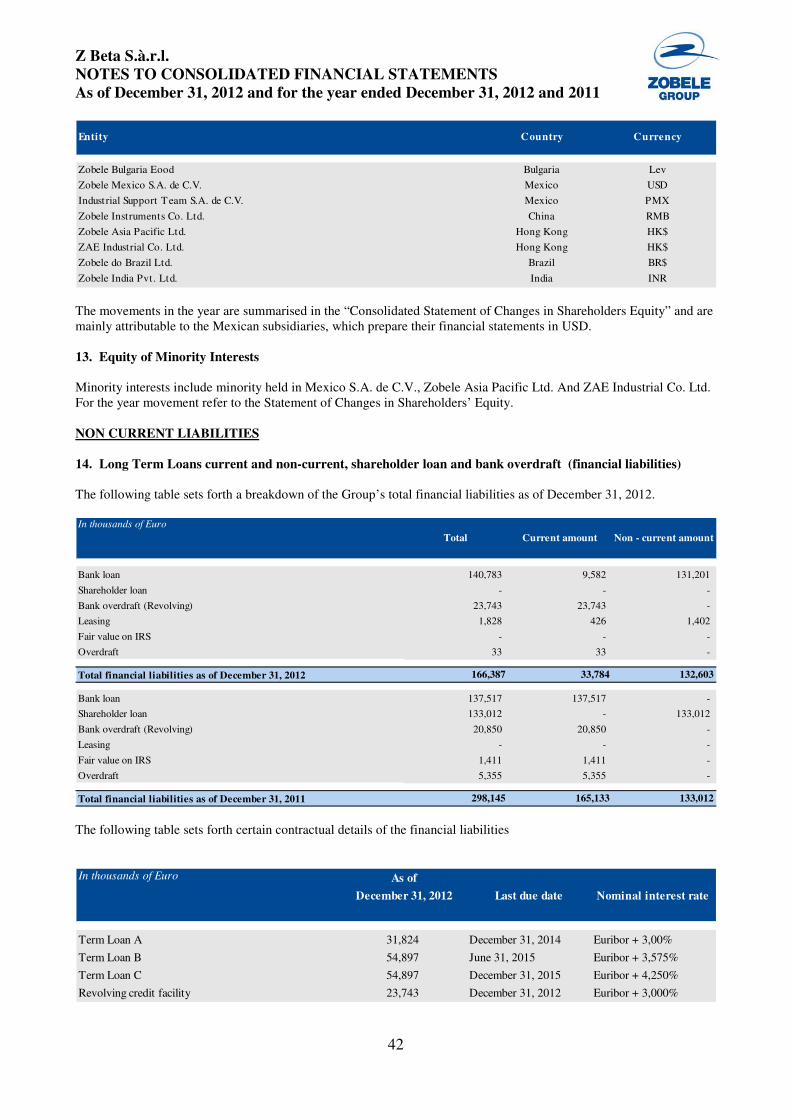
Z Beta S.à.r.l.
NOTES TO CONSOLIDATED FINANCIAL STATEMENTS
As of December 31, 2012 and for the year ended December 31, 2012 and 2011
42
The movements in the year are summarised in the “Consolidated Statement of Changes in Shareholders Equity” and are mainly attributable to the Mexican subsidiaries, which prepare their financial statements in USD. 13. Equity of Minority Interests Minority interests include minority held in Mexico S.A. de C.V., Zobele Asia Pacific Ltd. And ZAE Industrial Co. Ltd. For the year movement refer to the Statement of Changes in Shareholders’ Equity. NON CURRENT LIABILITIES 14. Long Term Loans current and non-current, shareholder loan and bank overdraft (financial liabilities) The following table sets forth a breakdown of the Group’s total financial liabilities as of December 31, 2012.
The following table sets forth certain contractual details of the financial liabilities
Entity Country Currency
Zobele Bulgaria Eood Bulgaria Lev
Zobele Mexico S.A. de C.V. Mexico USD
Industrial Support Team S.A. de C.V. Mexico PMX
Zobele Instruments Co. Ltd. China RMB
Zobele Asia Pacific Ltd. Hong Kong HK$
ZAE Industrial Co. Ltd. Hong Kong HK$
Zobele do Brazil Ltd. Brazil BR$
Zobele India Pvt. Ltd. India INR
In thousands of Euro
Total Current amount Non - current amount
Bank loan 140,783 9,582 131,201
Shareholder loan - - -
Bank overdraft (Revolving) 23,743 23,743 -
Leasing 1,828 426 1,402
Fair value on IRS - - -
Overdraft 33 33 -
Total financial liabilities as of December 31, 2012 166,387 33,784 132,603
Bank loan 137,517 137,517 -
Shareholder loan 133,012 - 133,012
Bank overdraft (Revolving) 20,850 20,850 -
Leasing - - -
Fair value on IRS 1,411 1,411 -
Overdraft 5,355 5,355 -
Total financial liabilities as of December 31, 2011 298,145 165,133 133,012
In thousands of Euro As of
December 31, 2012 Last due date Nominal interest rate
Term Loan A 31,824 December 31, 2014 Euribor + 3,00%
Term Loan B 54,897 June 31, 2015 Euribor + 3,575%
Term Loan C 54,897 December 31, 2015 Euribor + 4,250%
Revolving credit facility 23,743 December 31, 2012 Euribor + 3,000%
Z Beta S.à.r.l.
NOTES TO CONSOLIDATED FINANCIAL STATEMENTS
As of December 31, 2012 and for the year ended December 31, 2012 and 2011
43
The revolving credit facility is for an amount of €24,7 million, of which €23,7 million had been utilised as of December 31, 2012. Term Loan and Revolving Credit Facility
After the acquisition by Doughty Hanson, the Group obtained three long term loans from a syndicate of banks (Term Loan A, B and C), as well as a revolving credit facility. Term Loans A, B and C (together the “Term Loan”) were used to re-finance the existing debt at that time and to support the acquisition. The Revolving Credit Facility is used for working capital requirements. The term loans had differing repayment schedules with final repayment of Term Loan A on December 31, 2014, Term Loan B on June 31, 2015 and Term Loan C on December 31, 2015. The Term Loan agreements included certain covenants based on EBITDA, total net debt, total interest costs, capex and cash flow which were required to be measured on a quarterly basis. In March 2012, banks approved a loan amendment request rescheduling the debt repayments and modifying the covenant parameters. The rescheduling resulted in a substantial reduction of cash outflows for debt repayments over 2012-2013 and in a significant extension of the average life of the debt. In September 2012 the shareholders contributed an amount of €10 million as an increase in the “shareholders loan”. In November 2012 the Group, through its Italian subsidiary Zobele Holding S.p.A. commenced activities relating to the potential issuance of senior secured notes for an amount of €180 million for the purposes of re-financing the existing bank debt. The Notes were admitted to trading on the Euro MTF Market of the Luxembourg Stock Exchange as of January 31, 2013. The Group used the net proceeds from the issue of the Notes for the repayment of all amounts outstanding as of January 31, 2013 under our Existing Senior Facilities Agreement. Therefore any obligations resulting to the company from the fulfilment of the bank loan, including compliance with the financial covenants contractually stated, is no longer applicable. Therefore, in compliance with IAS, the Group has reclassified all third party bank debt to current and non-current liabilities according to the original contractual due dates.. The Term Loan existing as of December 2012, is guaranteed as follow:
• Shares of the main Subsidiaries: Z Beta S.à r.l., Zobele Holding S.p.A, Z Gamma B.V., Zobele International B.V.,and Zobele Bulgaria EooD
• Mortgage over Buildings in Trento (owned by Zobele Holding S.p.A.) equivalent to €40,9 million
• Pledge over Machinery (owned by Zobele Holding S.p.A., Zobele Bulgaria and Zobele Mexico S.A. de C.V.) equivalent to €5,0 million
• Pledge over Intellectual Properties (Patents owned by Zobele Holding S.p.A. and Zobele Spain S.A.)
• Pledge on the aggregate value of account receivables of Zobele Mexico S.A. de C.V.
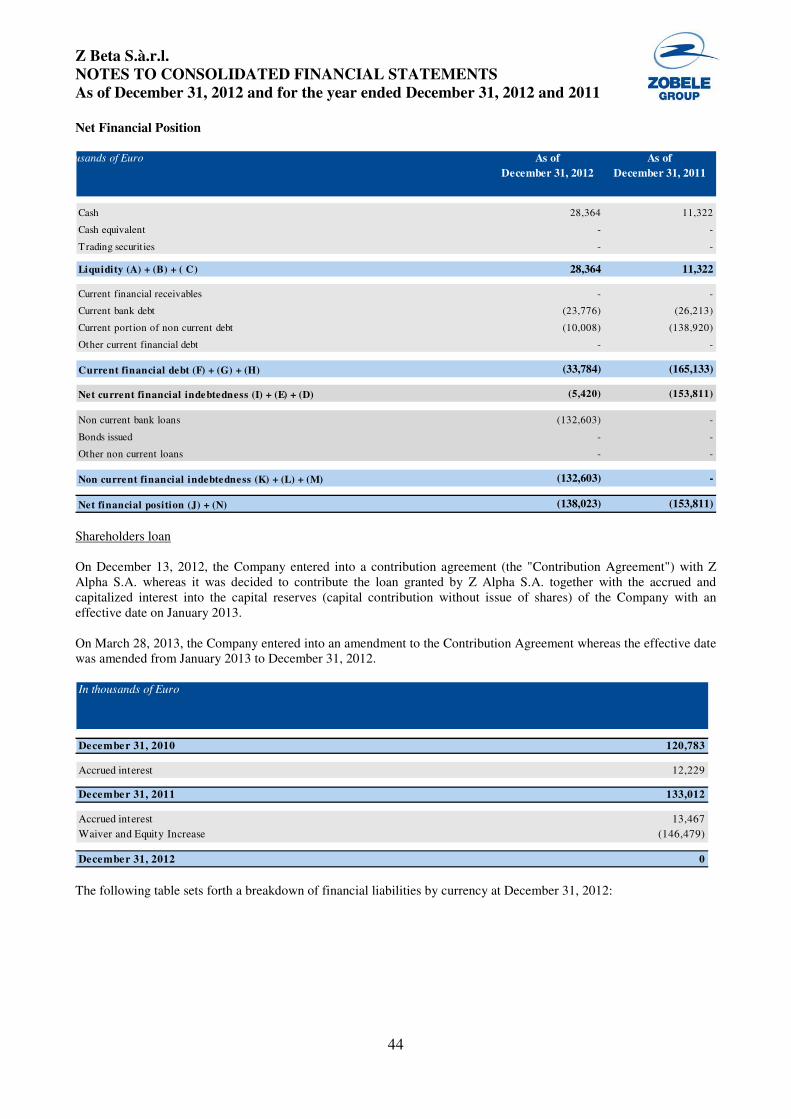
Z Beta S.à.r.l.
NOTES TO CONSOLIDATED FINANCIAL STATEMENTS
As of December 31, 2012 and for the year ended December 31, 2012 and 2011
44
Net Financial Position
Shareholders loan On December 13, 2012, the Company entered into a contribution agreement (the "Contribution Agreement") with Z Alpha S.A. whereas it was decided to contribute the loan granted by Z Alpha S.A. together with the accrued and capitalized interest into the capital reserves (capital contribution without issue of shares) of the Company with an effective date on January 2013. On March 28, 2013, the Company entered into an amendment to the Contribution Agreement whereas the effective date was amended from January 2013 to December 31, 2012.
The following table sets forth a breakdown of financial liabilities by currency at December 31, 2012:
In thousands of Euro As of As of
December 31, 2012 December 31, 2011
Cash 28,364 11,322
Cash equivalent - -
Trading securit ies - -
Liquidity (A) + (B) + ( C) 28,364 11,322
Current financial receivables - -
Current bank debt (23,776) (26,213)
Current portion of non current debt (10,008) (138,920)
Other current financial debt - -
Current financial debt (F) + (G) + (H) (33,784) (165,133)
Net current financial indebtedness (I) + (E) + (D) (5,420) (153,811)
Non current bank loans (132,603) -
Bonds issued - -
Other non current loans - -
Non current financial indebtedness (K) + (L) + (M) (132,603) -
Net financial position (J) + (N) (138,023) (153,811)
In thousands of Euro
December 31, 2010 120,783
Accrued interest 12,229
December 31, 2011 133,012
Accrued interest 13,467
Waiver and Equity Increase (146,479)
December 31, 2012 0
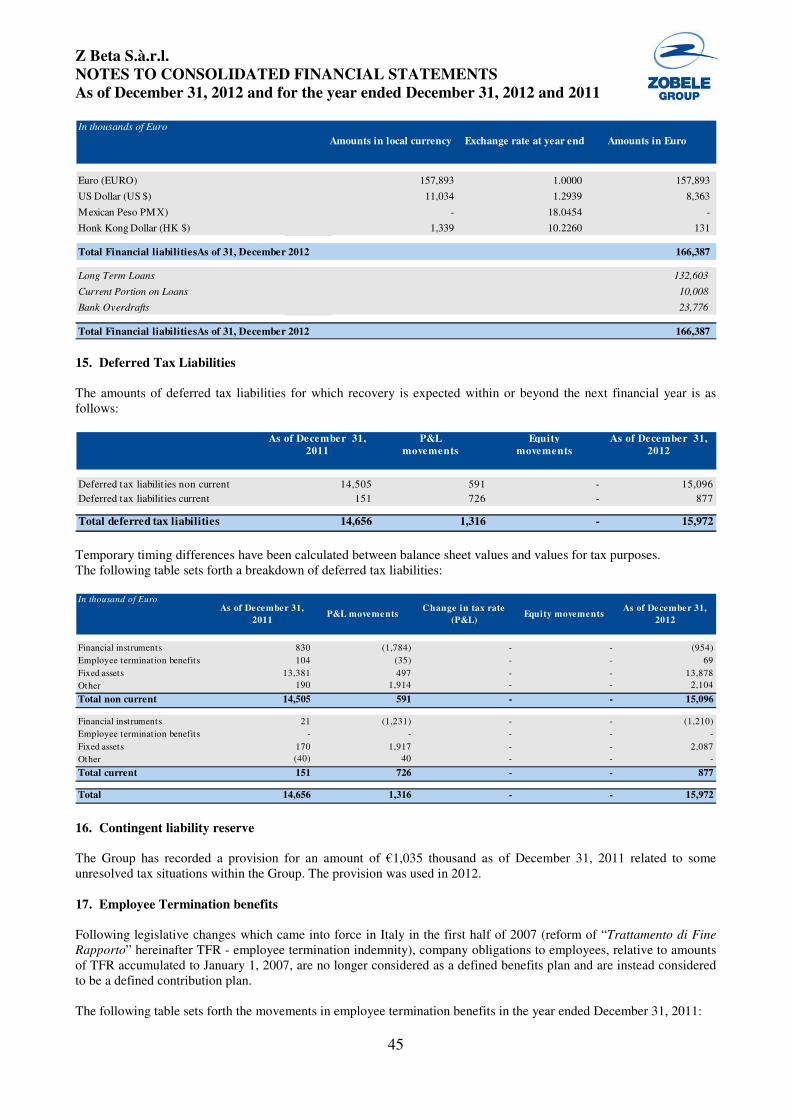
Z Beta S.à.r.l.
NOTES TO CONSOLIDATED FINANCIAL STATEMENTS
As of December 31, 2012 and for the year ended December 31, 2012 and 2011
45
15. Deferred Tax Liabilities The amounts of deferred tax liabilities for which recovery is expected within or beyond the next financial year is as follows:
Temporary timing differences have been calculated between balance sheet values and values for tax purposes. The following table sets forth a breakdown of deferred tax liabilities:
16. Contingent liability reserve The Group has recorded a provision for an amount of €1,035 thousand as of December 31, 2011 related to some unresolved tax situations within the Group. The provision was used in 2012. 17. Employee Termination benefits Following legislative changes which came into force in Italy in the first half of 2007 (reform of “Trattamento di Fine
Rapporto” hereinafter TFR - employee termination indemnity), company obligations to employees, relative to amounts of TFR accumulated to January 1, 2007, are no longer considered as a defined benefits plan and are instead considered to be a defined contribution plan. The following table sets forth the movements in employee termination benefits in the year ended December 31, 2011:
In thousands of Euro
Amounts in local currency Exchange rate at year end Amounts in Euro
Euro (EURO) 157,893 1.0000 157,893
US Dollar (US $) 11,034 1.2939 8,363
Mexican Peso PMX) - 18.0454 -
Honk Kong Dollar (HK $) 1,339 10.2260 131
Total Financial liabilitiesAs of 31, December 2012 166,387
Long Term Loans 132,603
Current Portion on Loans 10,008
Bank Overdrafts 23,776
Total Financial liabilitiesAs of 31, December 2012 166,387
As of December 31, P&L Equity As of December 31,
2011 movements movements 2012
Deferred tax liabilit ies non current 14,505 591 - 15,096
Deferred tax liabilit ies current 151 726 - 877
Total deferred tax liabilities 14,656 1,316 - 15,972
In thousand of EuroAs of December 31,
2011P&L movements
Change in tax rate
(P&L)Equity movements
As of December 31,
2012
Financial instruments 830 (1,784) - - (954)
Employee termination benefits 104 (35) - - 69
Fixed assets 13,381 497 - - 13,878
Other 190 1,914 - - 2,104
Total non current 14,505 591 - - 15,096
Financial instruments 21 (1,231) - - (1,210)
Employee termination benefits - - - - -
Fixed assets 170 1,917 - - 2,087
Other (40) 40 - - -
Total current 151 726 - - 877
Total 14,656 1,316 - - 15,972
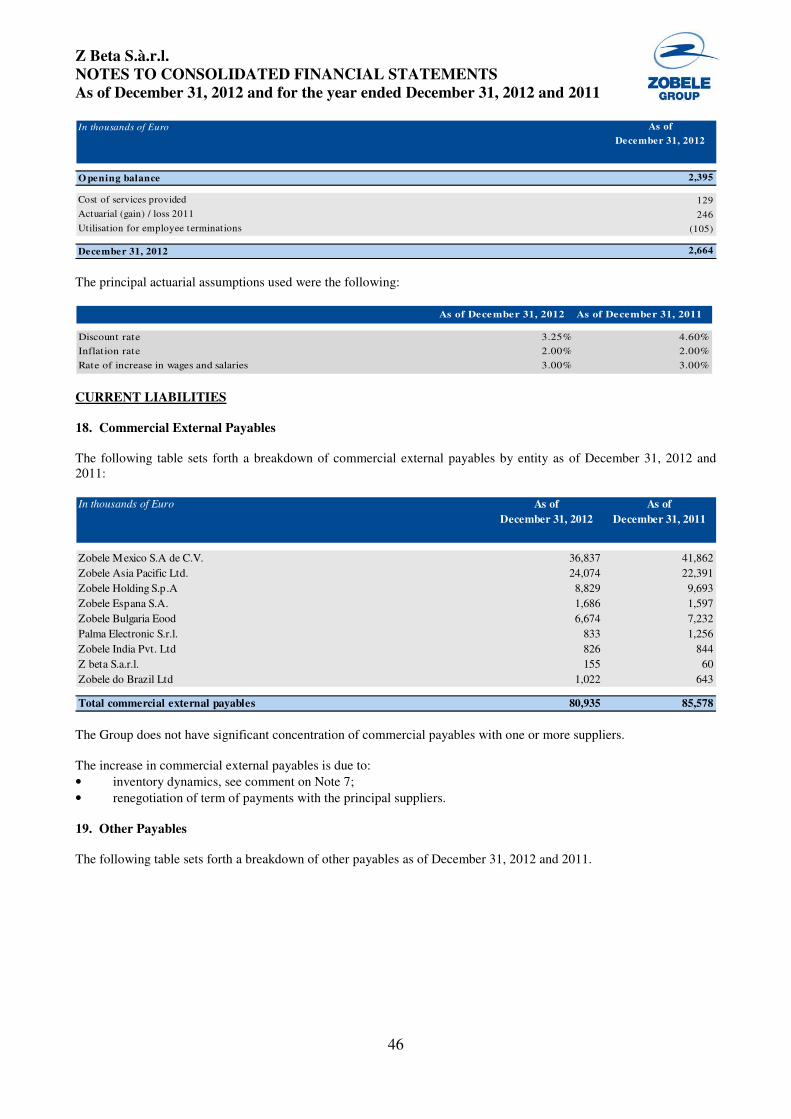
Z Beta S.à.r.l.
NOTES TO CONSOLIDATED FINANCIAL STATEMENTS
As of December 31, 2012 and for the year ended December 31, 2012 and 2011
46
The principal actuarial assumptions used were the following:
CURRENT LIABILITIES 18. Commercial External Payables The following table sets forth a breakdown of commercial external payables by entity as of December 31, 2012 and 2011:
The Group does not have significant concentration of commercial payables with one or more suppliers. The increase in commercial external payables is due to:
• inventory dynamics, see comment on Note 7;
• renegotiation of term of payments with the principal suppliers.
19. Other Payables The following table sets forth a breakdown of other payables as of December 31, 2012 and 2011.
In thousands of Euro As of
December 31, 2012
O pening balance 2,395
Cost of services provided 129
Actuarial (gain) / loss 2011 246
Utilisation for employee terminat ions (105)
December 31, 2012 2,664
As of December 31, 2012 As of December 31, 2011
Discount rate 3.25% 4.60%
Inflation rate 2.00% 2.00%
Rate of increase in wages and salaries 3.00% 3.00%
In thousands of Euro As of As of
December 31, 2012 December 31, 2011
Zobele Mexico S.A de C.V. 36,837 41,862
Zobele Asia Pacific Ltd. 24,074 22,391
Zobele Holding S.p.A 8,829 9,693
Zobele Espana S.A. 1,686 1,597
Zobele Bulgaria Eood 6,674 7,232
Palma Electronic S.r.l. 833 1,256
Zobele India Pvt. Ltd 826 844
Z beta S.a.r.l. 155 60
Zobele do Brazil Ltd 1,022 643
Total commercial external payables 80,935 85,578
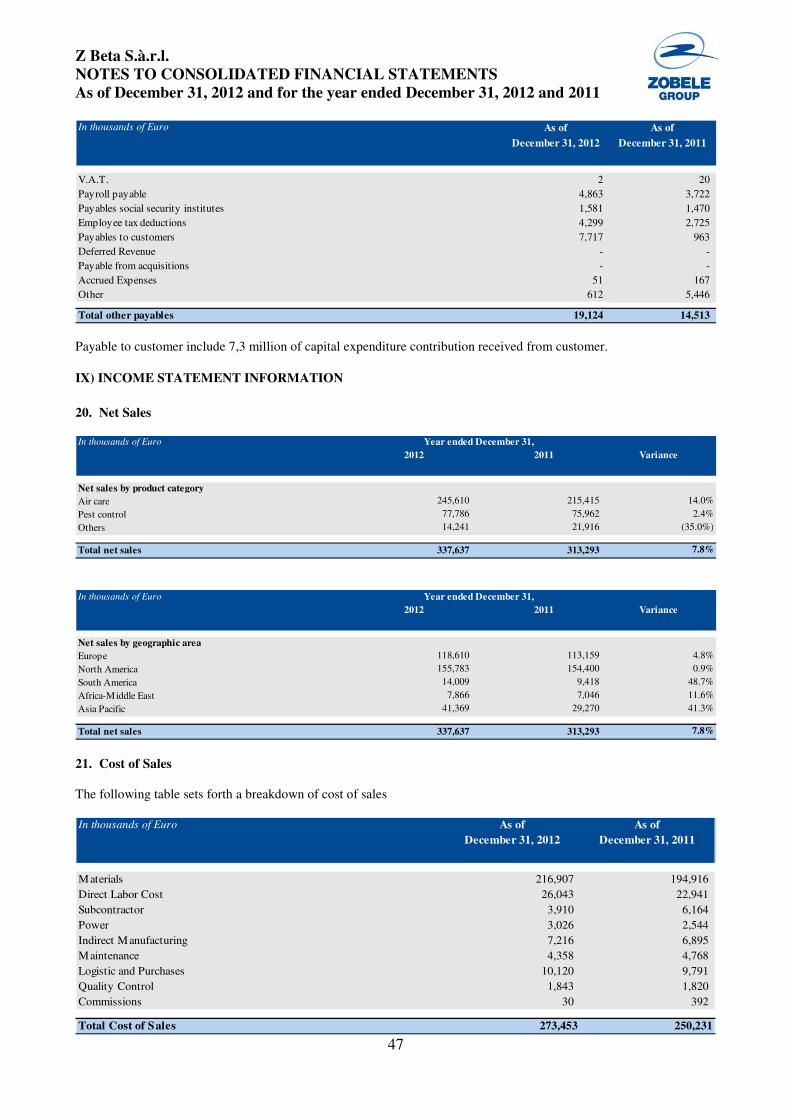
Z Beta S.à.r.l.
NOTES TO CONSOLIDATED FINANCIAL STATEMENTS
As of December 31, 2012 and for the year ended December 31, 2012 and 2011
47
Payable to customer include 7,3 million of capital expenditure contribution received from customer.
IX) INCOME STATEMENT INFORMATION
20. Net Sales
21. Cost of Sales The following table sets forth a breakdown of cost of sales
In thousands of Euro As of As of
December 31, 2012 December 31, 2011
V.A.T. 2 20
Payroll payable 4,863 3,722
Payables social security institutes 1,581 1,470
Employee tax deductions 4,299 2,725
Payables to customers 7,717 963
Deferred Revenue - -
Payable from acquisitions - -
Accrued Expenses 51 167
Other 612 5,446
Total other payables 19,124 14,513
In thousands of Euro
2012 2011 Variance
Net sales by product category
Air care 245,610 215,415 14.0%
Pest control 77,786 75,962 2.4%
Others 14,241 21,916 (35.0%)
Total net sales 337,637 313,293 7.8%
In thousands of Euro
2012 2011 Variance
Net sales by geographic area
Europe 118,610 113,159 4.8%
North America 155,783 154,400 0.9%
South America 14,009 9,418 48.7%
Africa-Middle East 7,866 7,046 11.6%
Asia Pacific 41,369 29,270 41.3%
Total net sales 337,637 313,293 7.8%
Year ended December 31,
Year ended December 31,
In thousands of Euro As of As of
December 31, 2012 December 31, 2011
Materials 216,907 194,916
Direct Labor Cost 26,043 22,941
Subcontractor 3,910 6,164
Power 3,026 2,544
Indirect Manufacturing 7,216 6,895
Maintenance 4,358 4,768
Logistic and Purchases 10,120 9,791
Quality Control 1,843 1,820
Commissions 30 392
Total Cost of Sales 273,453 250,231
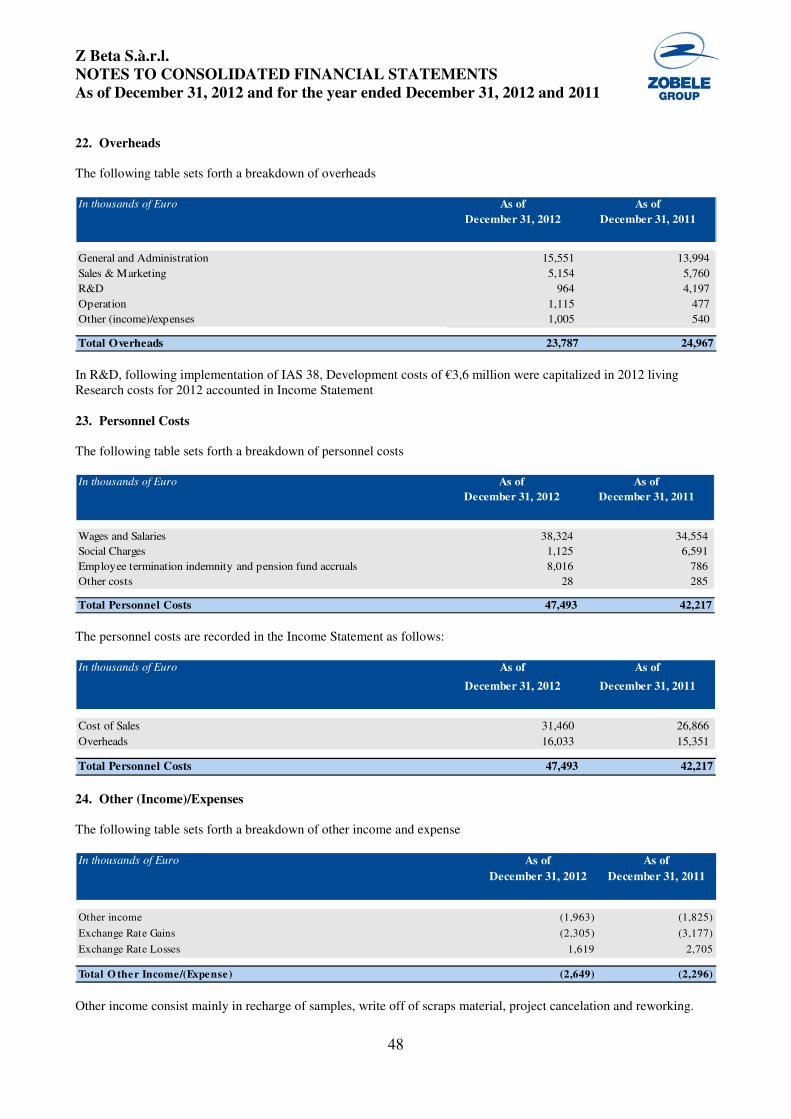
Z Beta S.à.r.l.
NOTES TO CONSOLIDATED FINANCIAL STATEMENTS
As of December 31, 2012 and for the year ended December 31, 2012 and 2011
48
22. Overheads
The following table sets forth a breakdown of overheads
In R&D, following implementation of IAS 38, Development costs of €3,6 million were capitalized in 2012 living Research costs for 2012 accounted in Income Statement 23. Personnel Costs The following table sets forth a breakdown of personnel costs
The personnel costs are recorded in the Income Statement as follows:
24. Other (Income)/Expenses
The following table sets forth a breakdown of other income and expense
Other income consist mainly in recharge of samples, write off of scraps material, project cancelation and reworking.
In thousands of Euro As of As of
December 31, 2012 December 31, 2011
General and Administration 15,551 13,994
Sales & Marketing 5,154 5,760
R&D 964 4,197
Operation 1,115 477
Other (income)/expenses 1,005 540
Total Overheads 23,787 24,967
In thousands of Euro As of As of
December 31, 2012 December 31, 2011
Wages and Salaries 38,324 34,554
Social Charges 1,125 6,591
Employee termination indemnity and pension fund accruals 8,016 786
Other costs 28 285
Total Personnel Costs 47,493 42,217
In thousands of Euro As of As of
December 31, 2012 December 31, 2011
Cost of Sales 31,460 26,866
Overheads 16,033 15,351
Total Personnel Costs 47,493 42,217
In thousands of Euro As of As of
December 31, 2012 December 31, 2011
Other income (1,963) (1,825)
Exchange Rate Gains (2,305) (3,177)
Exchange Rate Losses 1,619 2,705
Total O ther Income/(Expense) (2,649) (2,296)
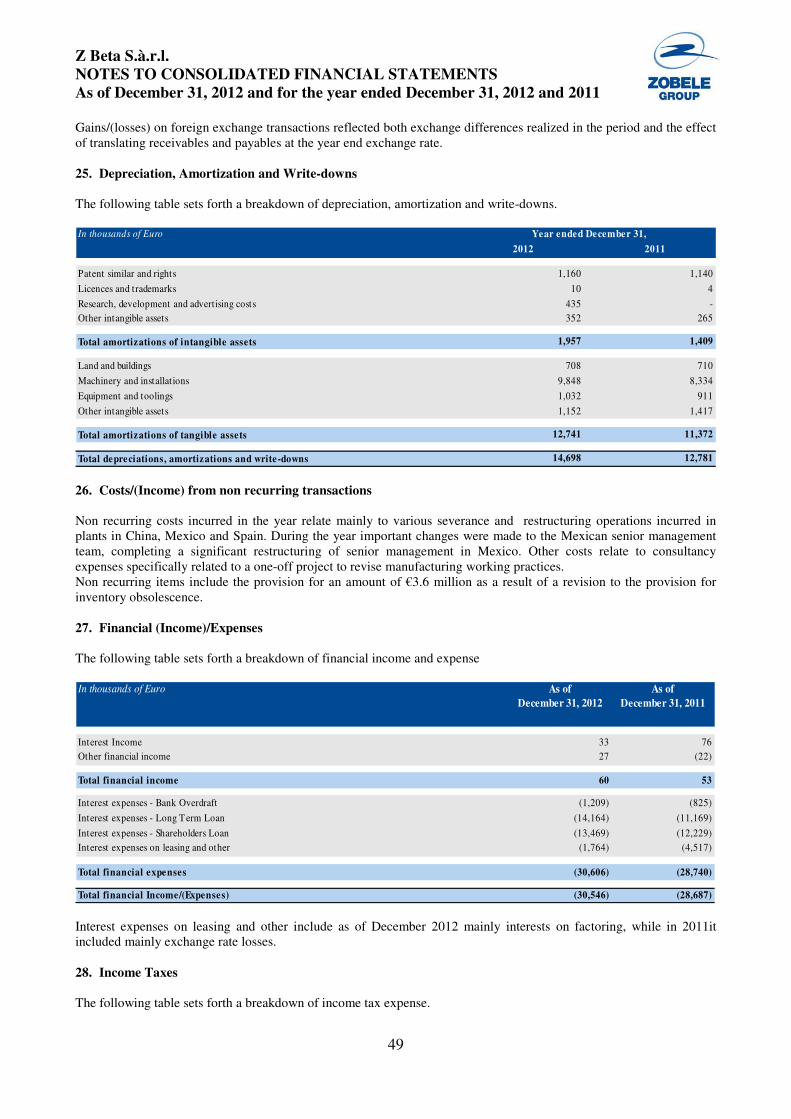
Z Beta S.à.r.l.
NOTES TO CONSOLIDATED FINANCIAL STATEMENTS
As of December 31, 2012 and for the year ended December 31, 2012 and 2011
49
Gains/(losses) on foreign exchange transactions reflected both exchange differences realized in the period and the effect of translating receivables and payables at the year end exchange rate. 25. Depreciation, Amortization and Write-downs The following table sets forth a breakdown of depreciation, amortization and write-downs.
26. Costs/(Income) from non recurring transactions Non recurring costs incurred in the year relate mainly to various severance and restructuring operations incurred in plants in China, Mexico and Spain. During the year important changes were made to the Mexican senior management team, completing a significant restructuring of senior management in Mexico. Other costs relate to consultancy expenses specifically related to a one-off project to revise manufacturing working practices. Non recurring items include the provision for an amount of €3.6 million as a result of a revision to the provision for inventory obsolescence. 27. Financial (Income)/Expenses The following table sets forth a breakdown of financial income and expense
Interest expenses on leasing and other include as of December 2012 mainly interests on factoring, while in 2011it included mainly exchange rate losses. 28. Income Taxes The following table sets forth a breakdown of income tax expense.
In thousands of Euro
2012 2011
Patent similar and rights 1,160 1,140
Licences and trademarks 10 4
Research, development and advertising costs 435 -
Other intangible assets 352 265
Total amortizations of intangible assets 1,957 1,409
Land and buildings 708 710
Machinery and installations 9,848 8,334
Equipment and toolings 1,032 911
Other intangible assets 1,152 1,417
Total amortizations of tangible assets 12,741 11,372
Total depreciations, amortizations and write-downs 14,698 12,781
Year ended December 31,
In thousands of Euro As of As of
December 31, 2012 December 31, 2011
Interest Income 33 76
Other financial income 27 (22)
Total financial income 60 53
Interest expenses - Bank Overdraft (1,209) (825)
Interest expenses - Long T erm Loan (14,164) (11,169)
Interest expenses - Shareholders Loan (13,469) (12,229)
Interest expenses on leasing and other (1,764) (4,517)
Total financial expenses (30,606) (28,740)
Total financial Income/(Expenses) (30,546) (28,687)
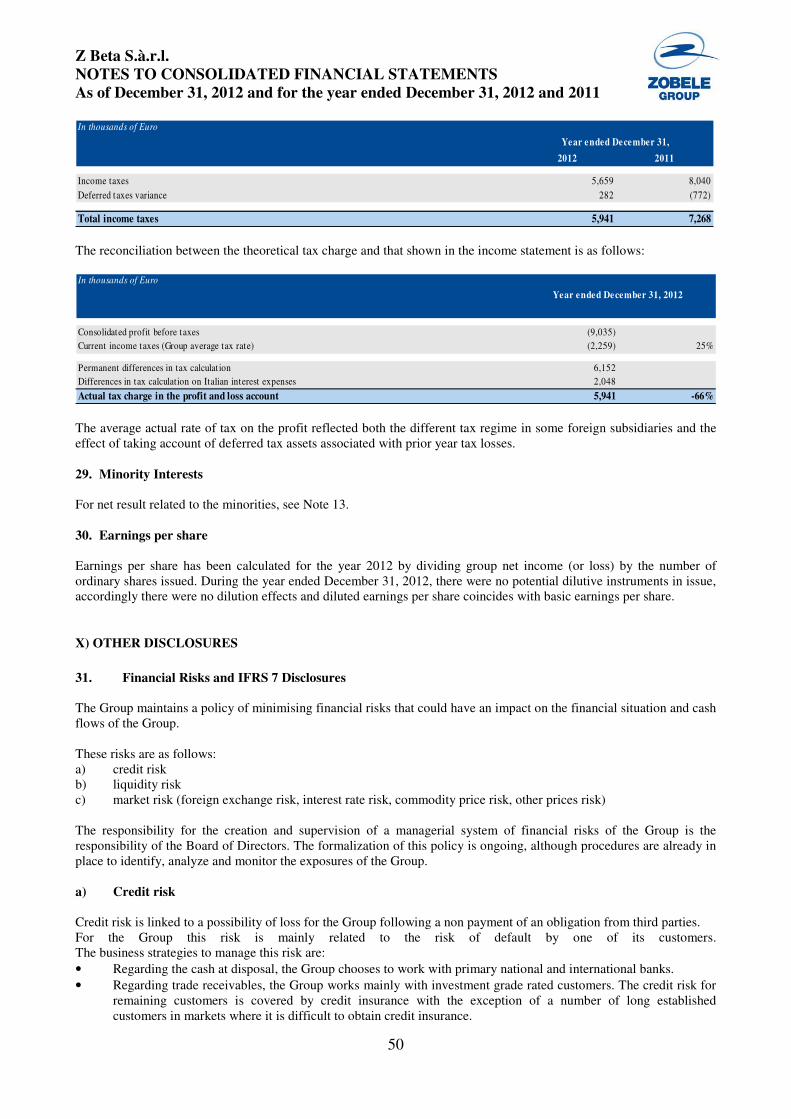
Z Beta S.à.r.l.
NOTES TO CONSOLIDATED FINANCIAL STATEMENTS
As of December 31, 2012 and for the year ended December 31, 2012 and 2011
50
The reconciliation between the theoretical tax charge and that shown in the income statement is as follows:
The average actual rate of tax on the profit reflected both the different tax regime in some foreign subsidiaries and the effect of taking account of deferred tax assets associated with prior year tax losses. 29. Minority Interests For net result related to the minorities, see Note 13. 30. Earnings per share Earnings per share has been calculated for the year 2012 by dividing group net income (or loss) by the number of ordinary shares issued. During the year ended December 31, 2012, there were no potential dilutive instruments in issue, accordingly there were no dilution effects and diluted earnings per share coincides with basic earnings per share.
X) OTHER DISCLOSURES
31. Financial Risks and IFRS 7 Disclosures The Group maintains a policy of minimising financial risks that could have an impact on the financial situation and cash flows of the Group. These risks are as follows: a) credit risk b) liquidity risk c) market risk (foreign exchange risk, interest rate risk, commodity price risk, other prices risk)
The responsibility for the creation and supervision of a managerial system of financial risks of the Group is the responsibility of the Board of Directors. The formalization of this policy is ongoing, although procedures are already in place to identify, analyze and monitor the exposures of the Group.
a) Credit risk
Credit risk is linked to a possibility of loss for the Group following a non payment of an obligation from third parties. For the Group this risk is mainly related to the risk of default by one of its customers. The business strategies to manage this risk are:
• Regarding the cash at disposal, the Group chooses to work with primary national and international banks.
• Regarding trade receivables, the Group works mainly with investment grade rated customers. The credit risk for remaining customers is covered by credit insurance with the exception of a number of long established customers in markets where it is difficult to obtain credit insurance.
In thousands of Euro
2012 2011
Income taxes 5,659 8,040
Deferred taxes variance 282 (772)
Total income taxes 5,941 7,268
Year ended December 31,
In thousands of Euro
Consolidated profit before taxes (9,035)
Current income taxes (Group average tax rate) (2,259) 25%
Permanent differences in tax calculat ion 6,152
Differences in tax calculation on Italian interest expenses 2,048
Actual tax charge in the profit and loss account 5,941 -66%
Year ended December 31, 2012
Z Beta S.à.r.l.
NOTES TO CONSOLIDATED FINANCIAL STATEMENTS
As of December 31, 2012 and for the year ended December 31, 2012 and 2011
51
• For new customers without an investment grade rating the strategy is to obtain credit insurance or else to request advanced payment.
• For customers to which the Group has agreed specific payment terms and the delivery of products is concentrated in a short time, it is normal to request a guarantee from banks or from its parent company.
• To better manage credit and liquidity risk, during 2010 the Group entered into a without-recourse factoring agreement for some of the main investment grade rated customers.
For the Group to consider a customer to be investment grade, it must have a minimum rating of BBB-. The Group regularly monitors the ratings of its customers and in the event of any downgrade credit terms are agreed with the customer. As of December 31, 2012, approximately 80% of the Group’s trade receivables were with investment rated customers.
b) Liquidity risk This risk, also called funding risk, is linked to the possibility of the Group having difficulty in obtaining funds in order to be able to meet their obligations. As described in Note 14, after the acquisition by Doughty Hanson, the Group obtained three term loans from a syndicate of banks, as well as a revolving credit facility and the possibility to get additional facilities with local banks. The term loans were used to re-finance the existing debt, whilst the revolving credit facility is used for working capital requirements. The Group also entered into without-recourse factoring agreements for some of the main investment grade rated customers. The Group monitors its funding requirements, also considering the business plan projections. As further explained in Note 14, in March 2012, the Group re-negotiated its Term Loan, in order to better manage the future repayments and cash flow requirements to support the growth in the business. c) Market risk Foreign exchange risk The Group is exposed to foreign exchange risk, arising from the potential variation in the value of a financial instrument resulting from fluctuations in the exchange value of foreign currencies. The main currencies of the Group are Euro and US Dollars. The Group has a minor portion of revenues in Canadian Dollars, British Pounds and Australian Dollars. Most of the sales by the Chinese and Mexican Subsidiaries are in US Dollars. The Asian and Mexican subsidiaries also pay the majority of their material purchases in US Dollars. As a result, sales in US Dollars are to a large extent offset by US Dollar expenses. The other subsidiaries' sales are mostly in Euro, with the largest part of costs in Euro or Euro pegged currencies. On a consolidated basis the Group's transactional foreign exchange risk is low, primarily as a result of the natural hedge of our foreign currency income and expenses. Transactional foreign exchange risk arises when our group entities execute transactions in currencies other than their functional currency. The Group has trade payables and receivables which are denominated in foreign currencies and any significant change in exchange rates could expose us to exchange rates gains and losses. The Group do not consider such exposure to be significant and do not currently use hedging instruments to manage such exposure. The Group’s exposure is primarily in the Mexican and Asian subsidiaries, who primarily execute transactions in US Dollars, whilst their functional currency is Mexican Peso and Hong Kong dollar, respectively. The Mexican branch has a part of the long term loan (loan A) that is expressed in USD that is hedged in term of foreign exchange risk with the credit versus customer that are expressed in the same currency. Interest rate risk Interest rate risk is linked to the possibility that a financial instrument and/or the financial flows generated by the same might get a variation in value due to fluctuation of interest rates in the money market.
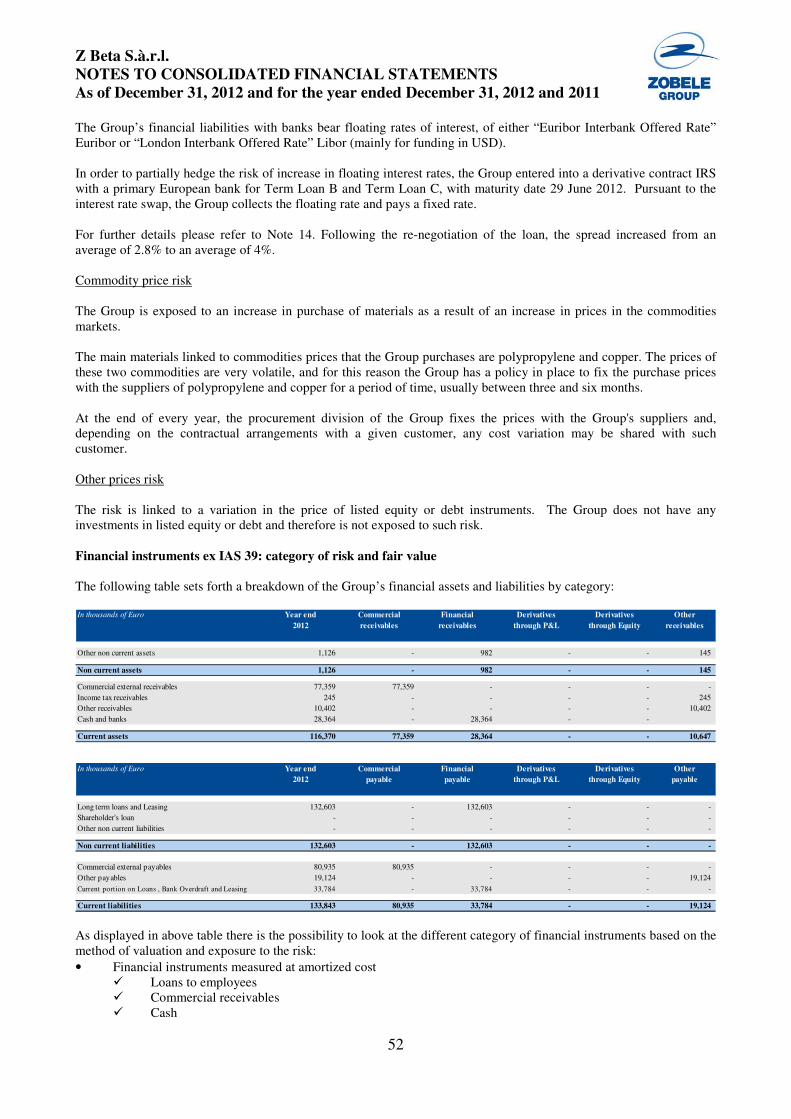
Z Beta S.à.r.l.
NOTES TO CONSOLIDATED FINANCIAL STATEMENTS
As of December 31, 2012 and for the year ended December 31, 2012 and 2011
52
The Group’s financial liabilities with banks bear floating rates of interest, of either “Euribor Interbank Offered Rate” Euribor or “London Interbank Offered Rate” Libor (mainly for funding in USD). In order to partially hedge the risk of increase in floating interest rates, the Group entered into a derivative contract IRS with a primary European bank for Term Loan B and Term Loan C, with maturity date 29 June 2012. Pursuant to the interest rate swap, the Group collects the floating rate and pays a fixed rate. For further details please refer to Note 14. Following the re-negotiation of the loan, the spread increased from an average of 2.8% to an average of 4%. Commodity price risk The Group is exposed to an increase in purchase of materials as a result of an increase in prices in the commodities markets. The main materials linked to commodities prices that the Group purchases are polypropylene and copper. The prices of these two commodities are very volatile, and for this reason the Group has a policy in place to fix the purchase prices with the suppliers of polypropylene and copper for a period of time, usually between three and six months. At the end of every year, the procurement division of the Group fixes the prices with the Group's suppliers and, depending on the contractual arrangements with a given customer, any cost variation may be shared with such customer. Other prices risk The risk is linked to a variation in the price of listed equity or debt instruments. The Group does not have any investments in listed equity or debt and therefore is not exposed to such risk. Financial instruments ex IAS 39: category of risk and fair value
The following table sets forth a breakdown of the Group’s financial assets and liabilities by category:
As displayed in above table there is the possibility to look at the different category of financial instruments based on the method of valuation and exposure to the risk:
• Financial instruments measured at amortized cost � Loans to employees � Commercial receivables � Cash
In thousands of Euro Year end Commercial Financial Derivatives Derivatives Other
2012 receivables receivables through P&L through Equity receivables
Other non current assets 1,126 - 982 - - 145
Non current assets 1,126 - 982 - - 145
Commercial external receivables 77,359 77,359 - - - -
Income tax receivables 245 - - - - 245
Other receivables 10,402 - - - - 10,402
Cash and banks 28,364 - 28,364 - -
Current assets 116,370 77,359 28,364 - - 10,647
In thousands of Euro Year end Commercial Financial Derivatives Derivatives Other
2012 payable payable through P&L through Equity payable
Long term loans and Leasing 132,603 - 132,603 - - -
Shareholder's loan - - - - - -
Other non current liabilities - - - - - -
Non current liabilities 132,603 - 132,603 - - -
Commercial external payables 80,935 80,935 - - - -
Other payables 19,124 - - - - 19,124
Current port ion on Loans , Bank Overdraft and Leasing 33,784 - 33,784 - - -
Current liabilities 133,843 80,935 33,784 - - 19,124
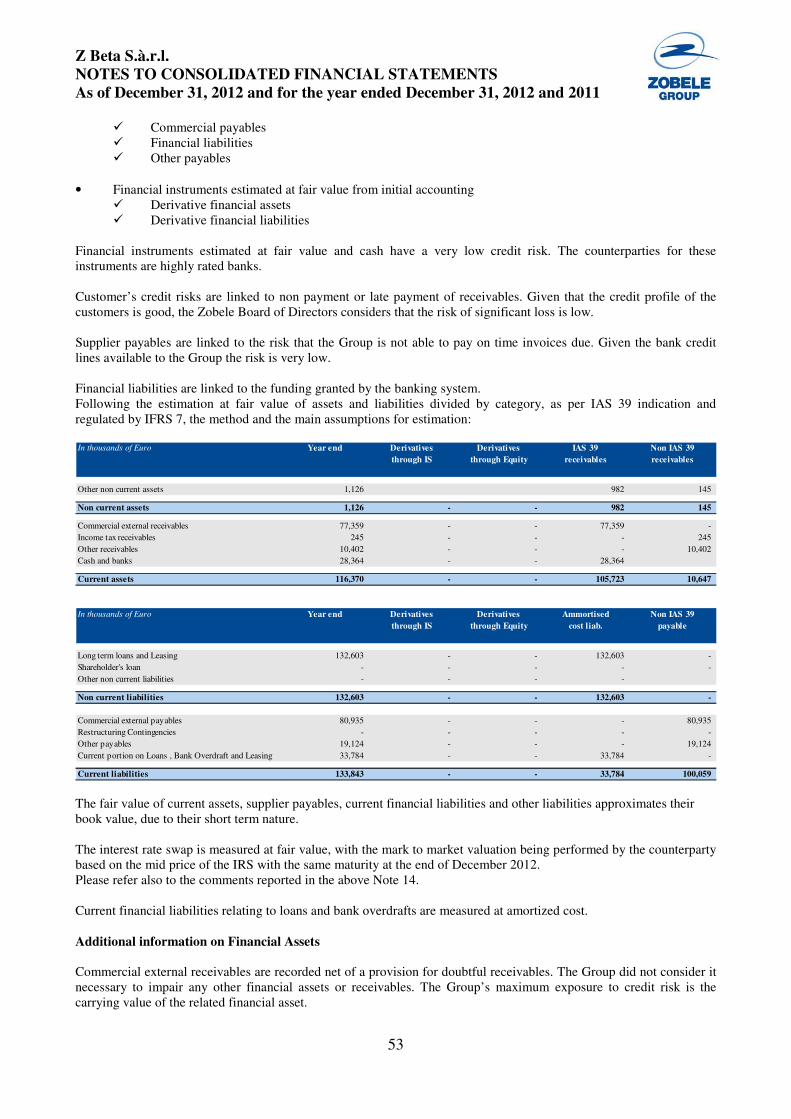
Z Beta S.à.r.l.
NOTES TO CONSOLIDATED FINANCIAL STATEMENTS
As of December 31, 2012 and for the year ended December 31, 2012 and 2011
53
� Commercial payables � Financial liabilities � Other payables
• Financial instruments estimated at fair value from initial accounting � Derivative financial assets � Derivative financial liabilities
Financial instruments estimated at fair value and cash have a very low credit risk. The counterparties for these instruments are highly rated banks. Customer’s credit risks are linked to non payment or late payment of receivables. Given that the credit profile of the customers is good, the Zobele Board of Directors considers that the risk of significant loss is low. Supplier payables are linked to the risk that the Group is not able to pay on time invoices due. Given the bank credit lines available to the Group the risk is very low. Financial liabilities are linked to the funding granted by the banking system. Following the estimation at fair value of assets and liabilities divided by category, as per IAS 39 indication and regulated by IFRS 7, the method and the main assumptions for estimation:
The fair value of current assets, supplier payables, current financial liabilities and other liabilities approximates their book value, due to their short term nature. The interest rate swap is measured at fair value, with the mark to market valuation being performed by the counterparty based on the mid price of the IRS with the same maturity at the end of December 2012. Please refer also to the comments reported in the above Note 14. Current financial liabilities relating to loans and bank overdrafts are measured at amortized cost.
Additional information on Financial Assets Commercial external receivables are recorded net of a provision for doubtful receivables. The Group did not consider it necessary to impair any other financial assets or receivables. The Group’s maximum exposure to credit risk is the carrying value of the related financial asset.
In thousands of Euro Year end Derivatives Derivatives IAS 39 Non IAS 39
through IS through Equity receivables receivables
Other non current assets 1,126 982 145
Non current assets 1,126 - - 982 145
Commercial external receivables 77,359 - - 77,359 -
Income tax receivables 245 - - - 245
Other receivables 10,402 - - - 10,402
Cash and banks 28,364 - - 28,364
Current assets 116,370 - - 105,723 10,647
In thousands of Euro Year end Derivatives Derivatives Ammortised Non IAS 39
through IS through Equity cost liab. payable
Long term loans and Leasing 132,603 - - 132,603 -
Shareholder's loan - - - - -
Other non current liabilities - - - -
Non current liabilities 132,603 - - 132,603 -
Commercial external payables 80,935 - - - 80,935
Restructuring Contingencies - - - - -
Other payables 19,124 - - - 19,124
Current portion on Loans , Bank Overdraft and Leasing 33,784 - - 33,784 -
Current liabilities 133,843 - - 33,784 100,059
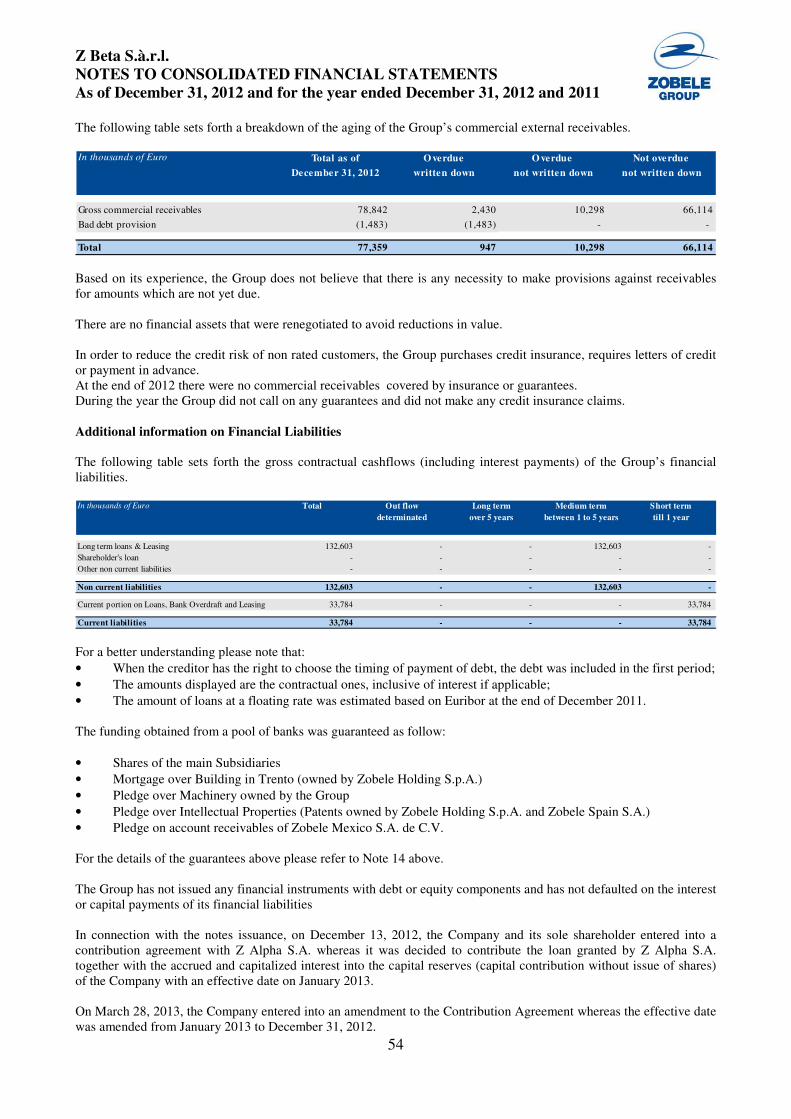
Z Beta S.à.r.l.
NOTES TO CONSOLIDATED FINANCIAL STATEMENTS
As of December 31, 2012 and for the year ended December 31, 2012 and 2011
54
The following table sets forth a breakdown of the aging of the Group’s commercial external receivables.
Based on its experience, the Group does not believe that there is any necessity to make provisions against receivables for amounts which are not yet due. There are no financial assets that were renegotiated to avoid reductions in value. In order to reduce the credit risk of non rated customers, the Group purchases credit insurance, requires letters of credit or payment in advance. At the end of 2012 there were no commercial receivables covered by insurance or guarantees. During the year the Group did not call on any guarantees and did not make any credit insurance claims. Additional information on Financial Liabilities The following table sets forth the gross contractual cashflows (including interest payments) of the Group’s financial liabilities.
For a better understanding please note that:
• When the creditor has the right to choose the timing of payment of debt, the debt was included in the first period;
• The amounts displayed are the contractual ones, inclusive of interest if applicable;
• The amount of loans at a floating rate was estimated based on Euribor at the end of December 2011. The funding obtained from a pool of banks was guaranteed as follow:
• Shares of the main Subsidiaries
• Mortgage over Building in Trento (owned by Zobele Holding S.p.A.)
• Pledge over Machinery owned by the Group
• Pledge over Intellectual Properties (Patents owned by Zobele Holding S.p.A. and Zobele Spain S.A.)
• Pledge on account receivables of Zobele Mexico S.A. de C.V. For the details of the guarantees above please refer to Note 14 above. The Group has not issued any financial instruments with debt or equity components and has not defaulted on the interest or capital payments of its financial liabilities In connection with the notes issuance, on December 13, 2012, the Company and its sole shareholder entered into a contribution agreement with Z Alpha S.A. whereas it was decided to contribute the loan granted by Z Alpha S.A. together with the accrued and capitalized interest into the capital reserves (capital contribution without issue of shares) of the Company with an effective date on January 2013. On March 28, 2013, the Company entered into an amendment to the Contribution Agreement whereas the effective date was amended from January 2013 to December 31, 2012.
In thousands of Euro Total as of O verdue O verdue Not overdue
December 31, 2012 written down not written down not written down
Gross commercial receivables 78,842 2,430 10,298 66,114
Bad debt provision (1,483) (1,483) - -
Total 77,359 947 10,298 66,114
In thousands of Euro Total Out flow Long term Medium term Short term
determinated over 5 years between 1 to 5 years till 1 year
Long term loans & Leasing 132,603 - - 132,603 -
Shareholder's loan - - - - -
Other non current liabilities - - - - -
Non current liabilities 132,603 - - 132,603 -
Current portion on Loans, Bank Overdraft and Leasing 33,784 - - - 33,784
Current liabilities 33,784 - - - 33,784

Z Beta S.à.r.l.
NOTES TO CONSOLIDATED FINANCIAL STATEMENTS
As of December 31, 2012 and for the year ended December 31, 2012 and 2011
55
Sensitivity Analysis
Currency Exchange rate The Group operates internationally and therefore is exposed to foreign exchange risk. Most of the Group’s net sales are invoiced in Euro or USD, with the Group’s European entities invoicing in Euro and the non-European entities invoicing in USD. Similarly, most of the Group’s non European entities incur their costs in USD. Therefore, the Group considers that for non European entities there is a natural hedge of net sales and expenses. The total exposure to foreign exchange risk at December 31, 2012 is as follows:
The Group used foreign exchange contracts during the year to hedge exposure on trading activities. There were no foreign exchange derivatives outstanding at the balance sheet date. Regarding the currency rate risk, a variance of the exchange rate of +10% or -10 % will result in the following impact:
In thousands of Euro
Amounts in local currency Exchange rate at year end Amounts in Euro
Euro (164,764) 1.0000 (164,761)
US Dollar 8,737 1.3194 6,622
Mexican Peso 11,073 17.0889 648
Brasilian Real 6,408 2.6949 2,378
Hong Kong Dollar 3,020 10.2260 295
Reminbi (74,855) 8.2207 (9,109)
Indian Rupia 11,640 72.5600 160
Bulgarian Leva (1,300) 1.9558 (665)
Pound (20) 0.8161 (25)
SGD Dollar - 2.2727 -
Canadian Dollar (CAD) 44 1.3137 33
Australian Dollar (AUD) 108 1.2712 85
Total exposure as of 31, December 2012 (164,339)
Euro (163,645) 1.0000 (163,645)
US Dollar 4,717 1.2939 3,646
Mexican Peso (131,546) 18.0454 (7,290)
Brasilian Real 5,028 2.4337 2,066
Hong Kong Dollar (24,048) 10.0510 (2,393)
Reminbi (67,768) 8.1588 (8,306)
Indian Rupia 85,918 68.7130 1,250
Bulgarian Leva (153) 1.9558 (78)
Pound 178 0.8353 213
SGD Dollar (1,381) 2.2727 (608)
Canadian Dollar (CAD) 0 0.0000 0
Australian Dollar (AUD) 151 1 114
Total exposure as of 31, December 2011 (175,031)
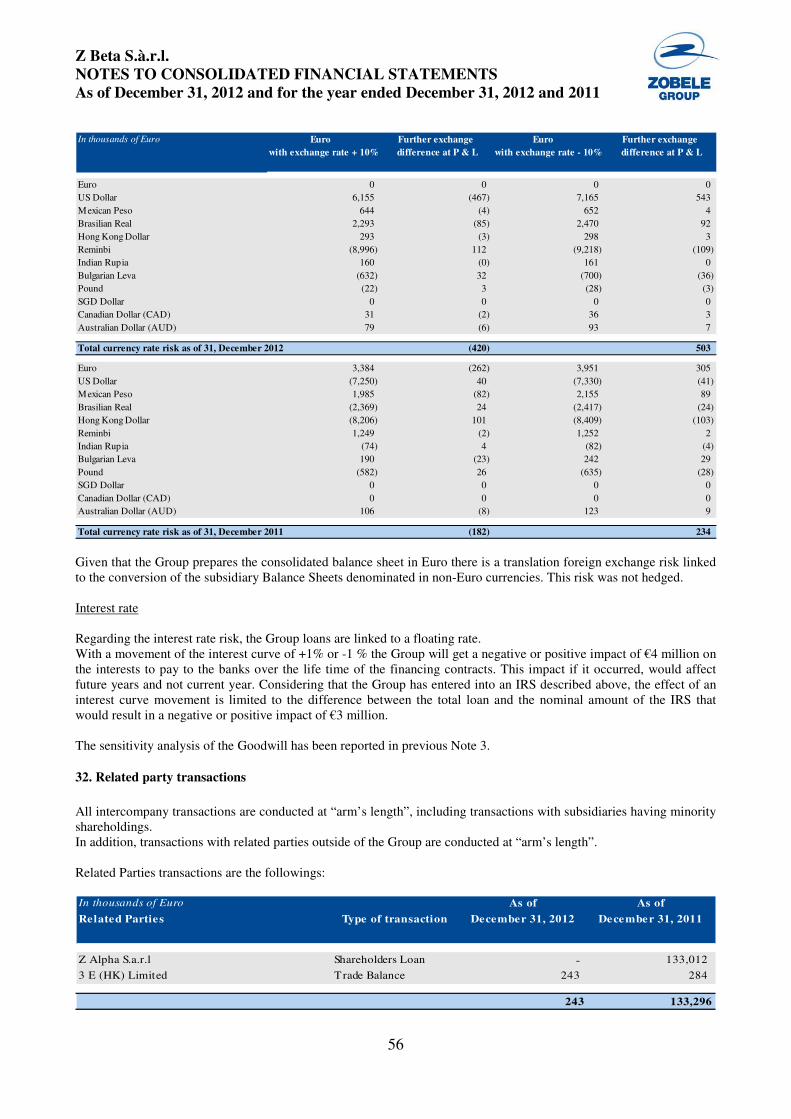
Z Beta S.à.r.l.
NOTES TO CONSOLIDATED FINANCIAL STATEMENTS
As of December 31, 2012 and for the year ended December 31, 2012 and 2011
56
Given that the Group prepares the consolidated balance sheet in Euro there is a translation foreign exchange risk linked to the conversion of the subsidiary Balance Sheets denominated in non-Euro currencies. This risk was not hedged. Interest rate Regarding the interest rate risk, the Group loans are linked to a floating rate. With a movement of the interest curve of +1% or -1 % the Group will get a negative or positive impact of €4 million on the interests to pay to the banks over the life time of the financing contracts. This impact if it occurred, would affect future years and not current year. Considering that the Group has entered into an IRS described above, the effect of an interest curve movement is limited to the difference between the total loan and the nominal amount of the IRS that would result in a negative or positive impact of €3 million. The sensitivity analysis of the Goodwill has been reported in previous Note 3.
32. Related party transactions
All intercompany transactions are conducted at “arm’s length”, including transactions with subsidiaries having minority shareholdings. In addition, transactions with related parties outside of the Group are conducted at “arm’s length”. Related Parties transactions are the followings:
In thousands of Euro Euro Further exchange Euro Further exchange
with exchange rate + 10% difference at P & L with exchange rate - 10% difference at P & L
Euro 0 0 0 0
US Dollar 6,155 (467) 7,165 543
Mexican Peso 644 (4) 652 4
Brasilian Real 2,293 (85) 2,470 92
Hong Kong Dollar 293 (3) 298 3
Reminbi (8,996) 112 (9,218) (109)
Indian Rupia 160 (0) 161 0
Bulgarian Leva (632) 32 (700) (36)
Pound (22) 3 (28) (3)
SGD Dollar 0 0 0 0
Canadian Dollar (CAD) 31 (2) 36 3
Australian Dollar (AUD) 79 (6) 93 7
Total currency rate risk as of 31, December 2012 (420) 503
Euro 3,384 (262) 3,951 305
US Dollar (7,250) 40 (7,330) (41)
Mexican Peso 1,985 (82) 2,155 89
Brasilian Real (2,369) 24 (2,417) (24)
Hong Kong Dollar (8,206) 101 (8,409) (103)
Reminbi 1,249 (2) 1,252 2
Indian Rupia (74) 4 (82) (4)
Bulgarian Leva 190 (23) 242 29
Pound (582) 26 (635) (28)
SGD Dollar 0 0 0 0
Canadian Dollar (CAD) 0 0 0 0
Australian Dollar (AUD) 106 (8) 123 9
Total currency rate risk as of 31, December 2011 (182) 234
In thousands of Euro As of As of
Related Parties Type of transaction December 31, 2012 December 31, 2011
Z Alpha S.a.r.l Shareholders Loan - 133,012
3 E (HK) Limited Trade Balance 243 284
243 133,296
Z Beta S.à.r.l.
NOTES TO CONSOLIDATED FINANCIAL STATEMENTS
As of December 31, 2012 and for the year ended December 31, 2012 and 2011
57
These transactions were made at arm's length in the ordinary course of business and, in the reasonable determination of members of our Board of Directors, on terms as favourable as might reasonably have been obtained from an unaffiliated third party. 33. Compensation
Remuneration and other benefits
The aggregate compensation of the members of the Board of Directors for the performance of their functions within the Group for the year ended December 31, 2012 amounted to approximately €0.4 million. The aggregate compensation of the members of the Board of Directors of the Company for the performance of their functions within other group’s companies for the year ended December 31, 2012 amounted to approximately €0.2 million. Bonus plan
Senior management participates with other management in our bonus scheme. The scheme rewards managers for achievement of both individual and collective targets, with collective targets set on various KPI measures, included in the Group’s Balance Scorecard Examples of such targets are such as earnings before interest, tax, depreciation and amortization (“EBITDA”), Working Capital and Cash Flow 34. Commitments and guarantees
As of December 31, 2012 the Company has financial obligations arising from rental and operating lease agreements for a total amount of €8.220 thousand of which € 2.172 thousand are due within one year. As described in Note 14, the Term Loan is secured and pledged on certain Group assets and shares
There are no other significant legal or arbitration proceeding which the Group believe could have a significant impact. 35. Subsequent Events Senior Secured notes issuing procedure
The last months of 2012 and the first months of the year saw the Board of Directors of the company involved in the redefinition of the financial debt structure of the company and the Group pursuing the double objectives of improving its liquidity ratio and adequately supporting growth plans defined by the Group’s business plan for the period 2012 – 2015.
In addition, the provisions of the Italian Legislative Decree no. 83 of 22 June 2012, converted into Law no. 134 of August 7, 2012, also established favorable fiscal conditions for Italian companies to issue and sell bonds on international markets.
On January 31, 2013, the Group, through its Italian subsidiary Zobele Holding S.p.A, issued of senior secured notes for an amount of €180 million for the purposes of re-financing the existing bank debt.
The Notes are admitted to trading on the Euro MTF Market of the Luxembourg Stock Exchange.
The Notes’ mature on February 1, 2018 and bear interest at a fixed annual rate of 7.875% payable semi-annually in arrears on February 1 and August 1 of each year, beginning on August 1, 2013.
The Notes are guaranteed on a senior basis by each of: Z Beta S.à r.l., Z Gamma B.V., Zobele International B.V., Zobele España, S.A.U., Zobele México, S.A. de C.V. and Zobele Bulgaria EooD. The obligations of the Group under the Notes will be secured by the following collateral:
• a pledge over the shares of the Company by Z Alpha;
• a pledge over the shares of Z Gamma B.V, Zobele Holding S.p.a., Zobele International B.V;
• a pledge over the shares of.;
Z Beta S.à.r.l.
NOTES TO CONSOLIDATED FINANCIAL STATEMENTS
As of December 31, 2012 and for the year ended December 31, 2012 and 2011
58
• a pledge over certain intellectual property rights of the Zobele Holding S.p.a;
• a special moveables pledge granted by Zobele Bulgaria EooD;
• a shares and receivables pledge over the shares of Zobele Bulgaria EooD ;
• a pledge over 95% of the shares of Zobele México, S.A. de C.V. by Zobele International B.V.;
• a pledge (without transfer of possession) over all movable assets owned by Zobele México, S.A. de C.V.;
• a charge over the shares of Zobele Asia Pacific (Hong Kong) Limited;
• a pledge over the shares of Zobele España, S.A.U. ; and
• a pledge by Z Gamma B.V. over certain intra-group receivables between Z Gamma B.V. and Zobele Holding S.p.a..
The Group used the net proceeds from the issue of the Notes for the repayment of all amounts outstanding as of January 31, 2013 under our Existing Senior Facilities Agreement, which is now terminated.
In order to finance the needs of the general consolidated working capital, on January 31, 2013 the Group also entered into a Revolving Credit Facility agreement for a total amount of €30 million ending six months before the expiry of the Notes. This credit line has economic conditions in line with market condition and is secured by the substantially the same Collateral as the Notes.
Sales and Purchase agreement of 5% of the share capital of Zobele Mexico S.A. De C.V.
On March 2013, the group entered into an agreement for the purchase of 5% of the share capital of Zobele Mexico S.A. De C.V. with the Minority Shareholders of the group Mexican subsidiary. The purchase price of USD 3,150 million will be paid in cash on the completion date that will take place within the end of April 2013. Approved by Approved by Director Chief Executive Officer
Mr. Cedric Stébel Mr. Roberto Schianchi __________________________________ ____________________________________ Date Date __________________________________ ____________________________________