yulia gladyshko extraction of hemicelluloses by acid
TRANSCRIPT

Saimia University of Applied Sciences Technology, Imatra Degree program in Paper Technology
Yulia Gladyshko
EXTRACTION OF HEMICELLULOSES BY ACID
CATALYZED HYDROLYSIS
Bachelor’s Thesis 2011
ABSTRACT
Yulia Gladyshko Extraction of Hemicelluloses by Acid Catalyst Hydrolysis, 45 pages, 2 appendices Saimaa University of Applied Sciences, Imatra Unit of Technology, Degree program in Paper Technology Bachelor’s Thesis 2011 Supervisor: Dr. Yang Guangyu, D.Sc., Saimaa UAS The techniques of chemical hydrolysis can be employed in order to separate polysaccharides from wood in a form of monosaccharides. Various acids can be used as the catalyst such as mineral acids and organic acids at certain operational conditions, i.e. temperature, pressure and time.
The aim of this study was to investigate effects of different hydrolysis techniques on the two types of raw material, birch chips and sawdust mixture of softwood. The obtained hydrolyzate were analyzed, e.g. pH measurement, measurement of dry solids content, and monosaccharides identification by the capillary electrophoresis method.
The results revealed that sulfuric acid catalyzed hydrolysis was more effective in a comparison with other two methods. Thus it is the most prospective approach for sugars extraction among tested methods. Moreover, hydrolyzates received from SW sawdust treatment contained more products than other hydrolyzates samples, but the hydrolyzate from treated birch chips revealed a high concentration of xylose.
Xylose-rich liquors of acid hydrolysis of birch chips can be used in xylitol production after required cleaning procedures, while glucose-rich hydrolyzates from treated SW sawdust can be utilized in biofuel production.
Key words: Biorefinery, Hydrolysis, Capillary Electrophoresis, Softwood Sawdust, Birch, Mineral Acid, Organic Acid.

CONTENTS
1 INTRODUCTION ............................................................................................. 4
2 WOOD CHARACTERISATION ........................................................................ 5
2.1 Cellulose .................................................................................................... 7
2.2 Hemicelluloses........................................................................................... 8
2.2.1 Softwood Hemicelluloses .................................................................. 10
2.2.2 Hardwood Hemicelluloses ................................................................. 12
2.3 Lignin ....................................................................................................... 13
2.4 Extractives ............................................................................................... 15
2.5 Wood Chips and Sawdust ....................................................................... 16
3 CHEMICAL HYDROLYSIS OF WOOD .......................................................... 17
3.1 The Mechanism of Cleavage of Glycosidic Bonds ................................... 17
3.2 Dissociation Constant .............................................................................. 19
3.3 Hot Water Autohydrolysis ........................................................................ 19
3.4 Concentrated-acid Hydrolysis .................................................................. 20
3.5 Dilute Acid Hydrolysis .............................................................................. 20
3.6 Organic Acid Hydrolysis ........................................................................... 21
4 EXPERIMENTAL PART ................................................................................. 22
4.1 Equipment ............................................................................................... 22
4.2 Materials and Methods ............................................................................ 24
4.3 Capillary Electrophoresis ......................................................................... 26
5 RESULTS ...................................................................................................... 26
5.1 pH Measurement ..................................................................................... 26
5.2 Dry Solids Content ................................................................................... 28
5.3 Comparison of Extracts After Treatment .................................................. 29
5.4 Comparison of Electropherograms .......................................................... 31
5.4.1 Analysis of Birch Hydrolyzates .......................................................... 32
5.4.2 Analysis of Sawdust Hydrolyzates ..................................................... 33
5.5 Concentration of Hydrolyzates ................................................................. 33
5.6 Discussion ............................................................................................... 35
6 SUMMARY..................................................................................................... 35
REFERENCES ................................................................................................. 37
APPENDICES

4
1 INTRODUCTION
The conversion of biomass into chemicals and energy is a key to sustainable
use of natural resources. The wood biomass represents the most abundant and
available biomass source, containing at least four valuable components:
cellulose, lignin, hemicelluloses and extractives. In the scope of Biorefinery
concept, wood can be fractionally converted into compounds which would be
further separated and used for chemical and/or biochemical conversion. The
hydrolysis techniques can be employed in order to separate polysaccharides
from wood in a form of monosaccharides. (Garotte et al. 2001).
The mechanism of chemical hydrolysis is based on the catalytic cleavage of
glycosidic bonds in polysaccharides. Various acids can be used as the catalyst,
but the most common is sulfuric acid. However, several organic acids such as
acetic and formic acids can also be used as catalysts. Moreover, hot water
autohydrolysis can be applied as pre-treatment to extract valuable
hemicelluloses from the wood prior to pulping. The obtained sugars can be
used in various applications. The ethanol is obtained from hexoses by
fermentation. Moreover, nowadays it is possible to convert pentoses to ethanol
due to new techniques. In Finland, xylose is commercibally utilized for
production of sweetening agent, xylitol. (Gellerstedt et. al. 2009, p. 175).
The objective of the work was to study the effect of hydrolysis on two different
raw materials: birch chips and sawdust mixture of softwoods. Several hydrolysis
methods were used to extract major monosaccharides. The selected hydrolysis
techniques were: hot water treatment, sulfuric acid catalyzed hydrolysis and
acetic acid catalyzed hydrolysis. The obtained hydrolyzate samples were
subjected for analysis. Following parameters have been measured: pH values
of hydrolyzate samples and concentration of dissolved solids. Monosaccharides
were defined and quantified by means of capillary electrophoresis analysis. As
the result, the efficient hydrolysis process was proposed and several important
conclusions about hydrolyzate samples were made.

2 WOOD CHARACTERISATIO
Wood is of biological origin and
as well as chemically.
and softwoods. Softwoods are gymnosperm trees, while hardwoods are
angiosperm trees. Also, density of most hardwoods is higher than densit
softwoods. (Stenius 2000, p. 1; Pettersen 1
Although the chemical composition of wood varies quantitatively among tree
species, it is possible to generalize content of a tree. The overall chemical
composition of wood is shown in the
Figure 2.1 Scheme of chemical compositio
184)
As can been seen from the figure 2.1, major part of
matter, which is about 99%
5
WOOD CHARACTERISATION
s of biological origin and has a very complex structure morphologically
as chemically. Wood species can be divided into two groups
. Softwoods are gymnosperm trees, while hardwoods are
angiosperm trees. Also, density of most hardwoods is higher than densit
(Stenius 2000, p. 1; Pettersen 1984, p.57).
Although the chemical composition of wood varies quantitatively among tree
species, it is possible to generalize content of a tree. The overall chemical
wood is shown in the figure 2.1.
Scheme of chemical composition of the wood (Azarov
As can been seen from the figure 2.1, major part of wood consists of organic
matter, which is about 99%, and only 1% of the wood is represented by mineral
a very complex structure morphologically
two groups: hardwoods
. Softwoods are gymnosperm trees, while hardwoods are
angiosperm trees. Also, density of most hardwoods is higher than density of
Although the chemical composition of wood varies quantitatively among tree
species, it is possible to generalize content of a tree. The overall chemical
n of the wood (Azarov et al. 1999, p.
wood consists of organic
presented by mineral

6
compounds. The mineral compounds can be obtained after incineration of wood
in the oven at temperatures 600-800 oC. Holocellulose, carbohydrate part of
wood, is composed of cellulose and hemicelluloses. The cellulose content of
both hardwood and softwood is approximately same 40%-45%, whereas
content of other components may differ (Stenius 2000, p. 28). Softwood and
hardwood differ in hemicelluloses´ composition; hemicelluloses of softwoods
are mostly presented by hexosanes (hexatomic carbohydrates), while
hemicelluloses of hardwoods are presented mostly by pentosans (pentatomic
carbohydrates) (Azarov et al. 1999, p. 184). Generally, softwood species
contain more lignin and less hemicelluloses than hardwoods. The lignin content
of hardwoods is around 20%-25%, while amount of lignin in softwoods is around
25%-30% of the wood dry solids (Stenius 2000, p.28). Furthermore, hardwoods
have more extractives than softwoods, in temperate tree species the extractives
content is between 5% and 10% (Kellomäki 2009, p. 151).
The table 2.1 shows information about commonly used wood species in pulp
and paper industry, where values are given in the percentages of dry wood
weight.
Table 2.1 Chemical comparison of various wood species (Sixta 2006, p. 23) Species Common
name Extrac-tives
Lignin Cellu-lose
Hemicelluloses Other polysac- charides
Gluco- mannan
Glucuro-
noxylan Softwood Pinus radiata
Monterey pine
1.8 27.2 37.4 20.4 8.5 4.3
Picea abies Norway spruce
1.7 27.4 41.7 16.3 8.6 3.4
Picea glauca
White spruce
2.1 27.5 39.5 17.2 10.4 3.0
Hardwood Betula verrucosa
Silver birch 3.2 22.0 41.0 2.3 27.5 2.6
Betula papyrifera
Paper birch
2.6 21.4 39.4 1.4 29.7 3.4
Eucalyptus globulus
Blue gum 1.3 21.9 51.3 1.4 19.9 3.9
Extraction with CH2Cl2, followed by C2H5OH.

7
As can be seen from the table 2.1, the most commercial wood species such as
birch and spruce are rich in celluloses as well as in hemicelluloses, but have
relatively small content of lignin. The extractives content of the stemwood is
relatively low, and it significantly depends on the period of the harvesting and
age of the tree. (Gellerstedt et al. 2009, p. 149).
Furthermore, wood contains small amounts of inorganic components, which
play an important role in tree well-being. The amounts of those minerals differ
according to the tree species and environment (Kellomäki, 2009). The table 2.2
shows the average concentration of important minerals in the dry mass of wood
and bark.
Table 2.2 Concentration of some mineral elements in the stemwood and stem bark of five major tree species in Finland (Kellomäki 2009, p. 154) Tree component
Concentration of primary elements,%
Concentration of trace elements, ppm
P K Ca Mg Mn Fe Zn S B Cu
Softwoods Stemwood 0.01 0.06 0.12 0.02 147 41 13 116 3 2 Stem bark 0.08 0.29 0.85 0.08 507 60 75 343 12 4 Hardwood Stemwood 0.02 0.08 0.08 0.02 34 20 16 90 2 2 Stem bark 0.09 0.37 0.85 0.07 190 191 131 341 17 13
As can be seen from the Table 2, bark of both hardwood and softwood contains
more inorganic compounds than in stemwood of respective tree species.
2.1 Cellulose
The most abundant natural polymer in the world is cellulose, which is the main
structural material of plants cell wall. It is insoluble in water and in most organic
solvents. However, during treatment with concentrated acid and high
temperature, cellulose can be degraded into glucose units, because it is

8
composed of β-D-glucopyranose units (Laine 2005, p. 15). The structure of
cellulose molecule is shown in the figure 2.2.
Figure 2.2 Chemical structure of cellulose (Laine 2005, p. 15) As can be seen from the figure 2.2, cellulose is the linear homopolymer
consisted of β-1,4-glycosidic linked D- glucopyranose units. Although structure
of cellulose may look simple at first, the complicated supramolecular
organization makes it a complex substance, which is able to form different types
of hydrogen bonds within the same cellulose chain or between different chains
(Pettersen 1984). The supramolecular structure of cellulose is presented by
microfibrills which can form larger aggregates, fibrils. Cellulose in the
microfibrils forms crystalline matrix, thus it is so difficult to dissolve cellulose.
However, in microfibrils some parts of cellulose chain with amorphous structure
are readily dissolved in hot water (Azarov et al. 1999).
2.2 Hemicelluloses
Hemicelluloses vary significantly among hardwoods and softwoods according to
the type and content in the wood cell walls. Generally, hardwoods contain a
high proportion of xylose units and more acetyl groups than softwoods. By
contrast, softwoods have a high proportion of mannose units and more
galactose units (Sixta 2006).

9
“Hemicelluloses are relatively easily hydrolyzed by acids to their monomeric
components consisting of D-glucose, D-mannose, D-xylose, L-arabinose, and
small amounts of L-rhamnose,” (Sjöström 1981, p. 60). The quantities of these
monosaccharides are shown in the table 2.3.
Table 2.3 Nonglucosic units of the hemicelluloses in various woods (Sixta 2006, p. 29) Species Mannose
[%] Xylos
e [%]
Galac-tose [%]
Arabi-nose [%]
Uronic Acid [%]
Rham-nose [%]
Acety-lated [%]
Softwoods
Balsam fir 10 5.2 1.0 1.1 4.8 - 1.4 European larch 11.5 5.1 6.1 2.0 2.2 - - Norway spruce 13.6 5.6 2.8 1.2 1.8 0.3 - Black spruce 9.4 6.0 2.0 1.5 5.1 - 1.3 Scots pine 12.4 7.6 1.9 1.5 5.0 - 1.6 Canadian hemlock 10.6 3.3 1.8 1.0 4.7 - 1.4
Hardwoods
Red maple 3.3 18.1 1.0 1.0 4.9 - 3.6 Silver birch 3.2 24.9 0.7 0.4 3.6 0.6 - European beech 0.9 19.0 1.4 0.7 4.8 0.5 - Aspen 3.5 21.2 1.1 0.9 3.7 - 3.9
As can be seen from the table 2.3, hardwoods have higher amount of xylose,
which is over 18%, and the largest amount of 24.9% xylose can be found in
silver birch. By contrast, softwoods have a relatively small amount of xylose, for
example Scots pine contains 7.6% and Norway spruce 5.6%. Also, it can be
concluded that softwoods contain more mannose than hardwoods. Norway
spruce contains 13.6% while aspen has only 3.5% of mannose.

2.2.1 Softwood Hemicelluloses
Galactoglucomannan
backbone chain of
mannopyranose units
structure is shown in the
Figure 2.3 Chemical structure of Galactoglucomannans
galactoglucomannan have
galactose:glucose:mannose
polysaccharides the
content is referred to as glucomannan
C-2 and C-3 positions in mannose and glucose units are partially substituted by
acetyl groups, on the average one group per 3
p. 60-61).
Softwoods contain 5%
(1-4)-linked β-D-xylopyranose units w
O-methyl-D-glucuronic acid
arabinose side chains can be easily hydrol
structure which is less resistant to hydrolysis
structure of arabinoglucuronoxylan is
10
emicelluloses
Galactoglucomannans are main hemicelluloses in softwoods, they have a linear
backbone chain of (1→4)-linked β-D-glucopyranose with attached
units (Sjöström 1981, p. 60). The galactoglucomannan
structure is shown in the figure 2.3.
emical structure of galactoglucomannan (Sjöström, 1981, p. 61
Galactoglucomannans may vary according to their galactose content. The
galactoglucomannan have low galactose content with
galactose:glucose:mannose ratio of about 0.1:1:4, whereas in the galactose
the corresponding ratio is 1:1:3. The fraction
referred to as glucomannan. An important structural feature is that the
3 positions in mannose and glucose units are partially substituted by
acetyl groups, on the average one group per 3-4 hexose units
tain 5%-10% of arabinoglucuronoxylan, which
ylopyranose units with branches of α-(1-2) linked pyranoid 4
glucuronic acid, and α-(1-3)-attached L-arabinose units
arabinose side chains can be easily hydrolyzed by acids due to their furanosidic
structure which is less resistant to hydrolysis. (Sjöström 1981, p.61
structure of arabinoglucuronoxylan is illustrated in the figure
s, they have a linear
with attached β-D-
The galactoglucomannan
glucomannan (Sjöström, 1981, p. 61)
heir galactose content. The
0.1:1:4, whereas in the galactose-rich
The fraction with low galactose
An important structural feature is that the
3 positions in mannose and glucose units are partially substituted by
4 hexose units. (Sjöström 1981,
, which consists mainly of
2) linked pyranoid 4-
arabinose units. The
yzed by acids due to their furanosidic
(Sjöström 1981, p.61). The
2.4.

11
Figure 2.4 Structure of arabinoglucuronoxylan (Laine 2005, p. 16) Arabinogalactan content is less than 1% in most softwoods species. However,
some species have more arabinogalactan, for example Siberian larch contains
around 10-25% of arabinogalctan by mass. (Gellerstedt et al. 2009, p. 114).
Arabinogalactan consists of D-galactopyranose main units attached by β-
(1→3)-bonds which form the main branch and side branches which are made of
β-(1→6)-linked D-galactose units, L-arabinose units (Laine 2005). The
structure of arabinogalactan can be seen in the figure 2.5.
Figure 2.5 Structure of arabinogalactan of larches (Laine 2005, p. 17)
As it is shown in the figure 2.5, arabinogalactan represents a carbohydrate
composed of arabinose and galactose monosaccharides. Since larch
arabinogalactan is water-soluble, it can be extracted from untreated heartwood
by hot water (Gellerstedt et al. 2009, p. 114).

Another minor compound of softwoods is xylog
primary cell wall of higher plants, it is shown in
Figure 2.6 Structure of xyloglucan
As can been seen from the figure 2.6
monosaccharides attached by
at the hydroxyl group of C6. Side branches
xylose units or of galactose, arabinose or f
xylose.
2.2.2 Hardwood Hemicelluloses
The major polysaccharide of hemicelluloses in
acetyl-4-O-methylglucuruno
glucuronoxylan (Sjöström 1981, p. 62,
Generally, the term xylan refers to the xylose
softwoods and hardwoods. Hardwood species contain 15%
(Sjöström 1981, p. 62).
in the figure 2.7.
Figure 2.7 Abbreviated formula of glucuronoxylan. Sugar units: xylopyranose (xylp), and group (CH3CO) (Sjöström 1981, p. 63
12
Another minor compound of softwoods is xyloglucan. It can be found
primary cell wall of higher plants, it is shown in the figure 2.6
2.6 Structure of xyloglucan (Laine 2005, p. 17)
As can been seen from the figure 2.6, xyloglucan like cellulose
monosaccharides attached by β-(1→4)-bonds, whereas side bra
t the hydroxyl group of C6. Side branches are composed either of single
ts or of galactose, arabinose or fructose units (1
emicelluloses
polysaccharide of hemicelluloses in different hardwood species is
methylglucuruno-β-D-xylan, which is sometimes referred as
curonoxylan (Sjöström 1981, p. 62, Gellerstedt et al. 2009, p. 108).
Generally, the term xylan refers to the xylose-base hemicelluloses in both
softwoods and hardwoods. Hardwood species contain 15%
(Sjöström 1981, p. 62). The structure of hardwood glucurunoxylan can be seen
2.7 Abbreviated formula of glucuronoxylan. Sugar units: ), and 4-O-methyl-α-D-glucuronic acid (Glc
Sjöström 1981, p. 63)
It can be found in a
2.6.
, xyloglucan like cellulose has D-glucose
bonds, whereas side branches attached
are composed either of single
ose units (1→2)-bonded to
different hardwood species is O-
is sometimes referred as
et al. 2009, p. 108).
base hemicelluloses in both
softwoods and hardwoods. Hardwood species contain 15%-30% of xylan
dwood glucurunoxylan can be seen
2.7 Abbreviated formula of glucuronoxylan. Sugar units: β-D-
glucuronic acid (GlcpA). R is an acetyl

13
As shown in the figure 2.7, xylose consists of (1→4) linked β-D-xylopyranose
units and acetyl groups are attached at C-2 or C-3 (Sjöström 1981, p. 62,
Gellerstedt et al 2009, p. 109).
Figure 2.8 The structure of glucomannan (Laine 2005, p. 19)
The glucomannan content in hardwood is usually between 3% and 5%.
Glucomannan is composed of β-(1→4)-linked D-mannopyranose backbone and
D-glucupyranose units. The ratio between glucose and mannose is different
among wood species, which can be between 1:2 and 1:1 respectively.
(Sjöström 1981, p. 63, Gellerstedt et al. 2009, p. 113). The chemical structure of
glucomannan can be seen in the figure 2.8.
2.3 Lignin
Lignin is aromatic polymer that binds together the cellulose microfibrils and
hemicellulose fixating them towards each other (Gellerstedt et al. 2009, p. 121).
The position of lignin within lignocellulosic matrix can be seen in the figure 2.9.
Figure 2.9 The allocation of the lignin within lignocellulosic matrix (Department of Energy Genomics, 2010)

14
As it is illustrated in the figure 2.9, cellulose acts as reinforcing fibers and lignin
acts as “glue” between them (Gellerstedt et al. 2009, p. 121). Thus, it is difficult
to extract lignin in its native form without breaking down the whole matrix and it
is impossible to determine the molecular weight of lignin as well. Theoretically, it
was suggested that wood lignin has degree of polymerization of several
thousands, whereas in practice it might be even higher. (Gellerstedt et al.
2009).
Lignin macromolecules are composed of three different phenylpropanoid
monomer units (monolignols) – predecessors of lignin. These units are bounded
by various carbon-carbon and carbon-oxygen bonds (Doherty et al. 2011).
Those phenylpropanoid monomer units are shown in the figure 2.10.
Figure 2.10 Monolignols, (a) p-Coumaryl alcohol (4-hydroxyl phenyl,H), (b) coniferyl alcohol (guaiacyl, G), (c) sinapyl alcohol (syringyl, S), (Doherty et al. 2011)
As can be seen in figure 2.10, the only difference between monolignols is the
presence and allocation of methoxyl groups. The phenylpropanoid monomer
units create a three-dimensional lignin net in wood. The “H” type monolignols
are commonly encountered in the non-wood plants, while two other types (G
and S) are found mostly in woody plants. Softwood lignin is more difficult to
degrade than hardwood one as it contains more G units; while hardwood lignin
is built of S units. Lignin has the most sophisticated structure among other wood
compounds. However, the precise structure of native lignin is still unknown.
(Azarov et al. 1999).

2.4 Extractives
The extractives are soluble compounds in neutral solvents such as water,
diethyl ester, toluene, methanol, ethanol, acetone etc. (Stenius 2000, p. 43).
The content of extractives and their quantity depend on the tree type and the
environment affecting it (Kello
extractives is higher in bark, leaves and roots, than in stemwood. Chemically
extractives are divided into hydrocarbons (mainly terpenes), alcohols,
aldehydes and ketones, acids, resin acids, carbohydrates, phenol
compounds (Azarov
The classification according to the separation methods of extractives includes
following groups: volatile oils, resin
schematic structure of this classif
from the extractives can be seen in the figure 2.11.
Figure 2.11 Scheme of extractives content (Azarov
Volatile oils are represented by high
separated by water distillation. They are mainly composed of monoterpenes
and other volatile terpenes, terpenoids as well as of many different low
molecular compounds. The volatile oils content of wood is relatively low and
varies in range from 0.1% to 1%
Gellerstedt et al. 2009
Resin acids can be extracted by organic solvents, but ar
Resins are divided into free acids (resin and fatty) and neutral compounds.
Neutral compounds are classified as saponifi
and nonsaponifiable compounds (terp
15
xtractives are soluble compounds in neutral solvents such as water,
diethyl ester, toluene, methanol, ethanol, acetone etc. (Stenius 2000, p. 43).
The content of extractives and their quantity depend on the tree type and the
environment affecting it (Kellomäki, 2009, p. 151). Generally, content of
extractives is higher in bark, leaves and roots, than in stemwood. Chemically
extractives are divided into hydrocarbons (mainly terpenes), alcohols,
aldehydes and ketones, acids, resin acids, carbohydrates, phenol
compounds (Azarov et al. 1999, Gellerstedt et al. 2009).
The classification according to the separation methods of extractives includes
ng groups: volatile oils, resins and water-soluble compounds. The
schematic structure of this classification and corresponding products derived
from the extractives can be seen in the figure 2.11.
Figure 2.11 Scheme of extractives content (Azarov et al. 1999, p. 498)
Volatile oils are represented by high-volatile compounds, which can be
ater distillation. They are mainly composed of monoterpenes
and other volatile terpenes, terpenoids as well as of many different low
molecular compounds. The volatile oils content of wood is relatively low and
varies in range from 0.1% to 1%. (Sjöström 1981, p. 89; Azarov
l. 2009).
Resin acids can be extracted by organic solvents, but are not soluble in water
Resins are divided into free acids (resin and fatty) and neutral compounds.
Neutral compounds are classified as saponifiable compounds (fats and waxes)
and nonsaponifiable compounds (terpene alcohols, phytosterols,
xtractives are soluble compounds in neutral solvents such as water,
diethyl ester, toluene, methanol, ethanol, acetone etc. (Stenius 2000, p. 43).
The content of extractives and their quantity depend on the tree type and the
mäki, 2009, p. 151). Generally, content of
extractives is higher in bark, leaves and roots, than in stemwood. Chemically
extractives are divided into hydrocarbons (mainly terpenes), alcohols,
aldehydes and ketones, acids, resin acids, carbohydrates, phenol and nitric
The classification according to the separation methods of extractives includes
soluble compounds. The
ication and corresponding products derived
1999, p. 498)
volatile compounds, which can be
ater distillation. They are mainly composed of monoterpenes
and other volatile terpenes, terpenoids as well as of many different low
molecular compounds. The volatile oils content of wood is relatively low and
; Azarov et al. 1999;
e not soluble in water.
Resins are divided into free acids (resin and fatty) and neutral compounds.
able compounds (fats and waxes)
ene alcohols, phytosterols, etc.).

16
Generally, the amount of resin acids in heartwood of hardwoods is 0.2% - 0.8%,
whereas it is 2.4% - 4.8% in heartwood of pine. There are almost no resin acids
in hardwood. (Gellerstedt et al. 2009).
Water-soluble compounds can be extracted by cold or hot water. They consist
of various phenol compounds (tannins, coloring compounds), carbohydrates,
glycosides, and soluble salts (Azarov et al. 1999). The wood extractives
contribute to wood properties such as color, odor, and decay resistance
(Pettersen, 1984, p. 68).
2.5 Wood Chips and Sawdust
The wood chips are a commonly used form of raw material for pulping. Chips of
good quality should have uniform size. Various types of chipper machines are
available on the market nowadays, which makes it possible to choose correctly
the appropriate equipment to the wood species. Chip size is a balance between
mechanical fiber damage and liquor impregnation. The recommended chip
sizes to be used in pulping are following: length X width X thickness = 15 X 20 X 3
mm, the illustration of chip dimension is shown in the figure 2.12. However, the
size of chips can vary according to wood species and fiber length. The target of
predefined chip size is to provide uniform penetration of cooking liquor through
the chip. (Sixta 2006, p. 80).
Figure 2.12 Recommended chip dimensions and size (Sixta 2006, p. 80)
The respective chip size is not preferable for hydrolysis, because the smaller
chip size enables better penetration of solution, so that better dissolution of
wood compounds. From this point of view, sawdust is more applicable raw
material. (Testova 2006, p. 11).

17
Sawdust is a by-product of sawmills which is available in large amounts.
Particles of sawdust are not as uniform as chips, however small size fraction is
dominant. Saw dust may consist of a large proportion of heartwood. (Korpinen
2010). One way of sawdust utilization is the pulp production, which began
during mid-1950s. Sawdust pulp is mixed with hardwood pulp to increase its
initial strength, and also it is used as a raw material for production of laminating
papers, since it provides good opacity and release properties (Knowpulp, VTT).
3 CHEMICAL HYDROLYSIS OF WOOD
The fractionation of lignocellulosic materials by various treatments is a modern
approach in the scope of biorefinery. According to Garotte et al. (2001) wood
biomass is a source of numerous chemical compounds that have a wide range
of marketable appeal. Hydrolysis enables selective dissolution of
carbohydrates, along with the formation of valuable byproducts such as furfural,
HMF, acetic acid, levulinic acid etc.
3.1 The Mechanism of Cleavage of Glycosidic Bonds
The main principle of the chemical hydrolysis is the catalytic cleavage of the
glycosidic bonds in polysaccharides catalyzed by dilute or concentrated mineral
acids. Also organic acids can be used as a catalyst for the process. The
mechanism of polysaccharides hydrolysis can be illustrated with an example of
cellulose hydrolysis (Holkin 1989). The mechanism of the hydrolysis is shown
in the figure 3.1.

18
Figure 3.1 The mechanism of hydrolytic cleavage of glycosodic bonds (Holkin 1989, p. 53).
The protonation of the glycosidic oxygen atom, which contains a free pair of
electrons, occurs during first stage of hydrolysis. As the result, oxonium
macroion (8) is formed, which yields in activation of glycosidic bonds. In the
protons conjugation reaction glycosidic bond poses nucliophilic character. The
process is reversible, thus all of the active and inactive forms are in the
thermodynamic equilibrium.
As the result of oxonium macroion dissociation, the macromoleculs of cellulose
(9) and carbonium macroion (10) are formed, which are in equilibrium with
oxonium ion (11). Due to the distribution of the positive charge between carbon
and oxygen atoms, the system formed by these ions is called carboxonic ion.
As the result of interaction of carbocation (10) with water the fragment of
macromolecule is formed (12). Then, formed fragments of macromolecules are
hydrolyzed further. The product of the full hydrolysis of cellulose is D-Glucose.
The acid is playing a role of catalyst in this reaction, it is acting only with
intermediate products and released unchanged after reaction.
The reaction of the cleavage of the oxonium ion (8) is determinative for the
hydrolysis speed, due to lower speed of reaction in comparison with the process
of the conjugation of water to the carbcation (10). (Holkin 1989).

3.2 Dissociation C
The catalyzing action of a
effective as catalysts
essence of this difference can be explained by the acid dissociation cons
Ka. This constant is a quantitative measu
calculated as follows:
In this equilibria, A–
(in this context means a hydrogen ion) according to
179-181).
Due to large difference between constant value
common to use a logarithmic value
Equation of pKa parameter
higher value of pKa
2 to 12 in water solution.
considered to be strong. For Instance
of acetic acid is ju
concentration of H
hydrolysis process since it
of H+, the faster hydrolysis proceeds
for hydrolysis more often than organic acids
3.3 Hot Water Autohydrolysis
Autohydrolysis is a type of hydrolysis without presence of any catalyst. It is
targeted at degradation of hemicellulos
a solid phase. The depolymerization of hemicelluloses is catalyzed by
hydronium ions from water and naturally generated compounds such as acetic,
19
Dissociation Constant
The catalyzing action of acids is not equal. Mineral acids are much more
as catalysts of hydrolysis process, than for instance organic acids. The
essence of this difference can be explained by the acid dissociation cons
This constant is a quantitative measure of acid strength in solution, which
calculated as follows:
– is the conjugate base of the acid HA, and H
ext means a hydrogen ion) according to Atkins and Paula (2005, pp.
Due to large difference between constant values for different acids
common to use a logarithmic value - pKa, as follows:
parameter is obtained from Atkins and de Paula, p. 180. The
a, the weaker acid is. Thus weak acids have
2 to 12 in water solution. On the other hand, acids with pK
considered to be strong. For Instance, hydrochloric acid has p
is just around 5. The acid dissociation constant shows
concentration of H+ ions in the solution, which is especially important for
hydrolysis process since it is catalyzed by these ions. The higher concentration
, the faster hydrolysis proceeds. Therefore strong mineral acids are used
for hydrolysis more often than organic acids. (Atkins & Paula 2005, p. 181
utohydrolysis
is a type of hydrolysis without presence of any catalyst. It is
targeted at degradation of hemicelluloses as both cellulose and lignin remain
a solid phase. The depolymerization of hemicelluloses is catalyzed by
hydronium ions from water and naturally generated compounds such as acetic,
. Mineral acids are much more
of hydrolysis process, than for instance organic acids. The
essence of this difference can be explained by the acid dissociation constant,
re of acid strength in solution, which is
(1)
is the conjugate base of the acid HA, and H+ is the proton
Atkins and Paula (2005, pp.
for different acids, it is
(2)
obtained from Atkins and de Paula, p. 180. The
weak acids have pKa in range of -
pKa lower than -2 are
s pKa of -7, while pKa
st around 5. The acid dissociation constant shows
ions in the solution, which is especially important for
higher concentration
strong mineral acids are used
(Atkins & Paula 2005, p. 181).
is a type of hydrolysis without presence of any catalyst. It is
oth cellulose and lignin remain in
a solid phase. The depolymerization of hemicelluloses is catalyzed by
hydronium ions from water and naturally generated compounds such as acetic,

20
uronic and phenolic acids. (Liu 2010). Also, cellulose decomposition and lignin
repolymerization is avoided because of mild operational conditions and reaction
selectivity. However, under severe conditions, condensation reactions between
furfural and lignin may occur (Garotte et al. 2001). The hot water extraction of
readily hydrolysable carbohydrates is beneficial for utilization and recovery of
the hydrolyzate components. Moreover, environmental friendly recovery is
achieved, because no caustic or sodium is added to treat the process streams.
Therefore, there are no byproducts generated from sulfuric acid neutralization.
(Liu 2010).
3.4 Concentrated-acid Hydrolysis
Concentrated acid hydrolysis is a quite old process, which enables production
of higher amount of sugars (90% of theoretical glucose yield) in a comparison
with dilute acid hydrolysis, where degradation of cellulose occurs in harsh
environment. Moreover, concentrated acid hydrolysis can be operated at low
temperatures. (Khan 2010, p. 8). Usually, the solution of 72% sulfuric acid is
applied for 120 minutes at 20 oC, and then it is diluted to 1 M acid concentration
and heated for 240 minutes at 100 oC (Hon 2001, p. 184). However, there are
several disadvantages of the process, namely, the need of special non-
corrosive construction materials and high energy consumption of acid recovery
process (Jones 1984).
3.5 Dilute Acid Hydrolysis
The principle of this technique is to apply temperature and pressure in order to
soften lignocellulosic providing better penetration of the acid, and then degrade
carbohydrate part of wood into monosaccharides (Lavarack et al. 2002). During
treatment various products are formed: monosaccharides (xylose, arabinose,
mannose etc.), some sugar-dehydration products (furfural, hydroxylmethyl-
furfural), while lignin and part of cellulose remain as solid residue (Garotte et al.
2001, p. 155). Research works on the dilute acid hydrolysis of different
lignocellulosic materials have defined optimal process conditions: temperature
21
80-200oC, sulfuric acid concentration 0.25–8 wt%, and reaction time 10-2000
min (Lavarack et al. 2002, Hon et al. 2001, p. 184, Garotte et al. 2001). Sulfuric
acid is a commonly used acid due to low cost, non-volatileness and affordable
corrosion strength (Mosier et al. 2005).
Despite all of the benefits of sulfuric acid hydrolysis, some limitations take place
including high corrosion rates and expensive construction materials. Also,
liquors have to be neutralized prior to fermentation of sugars, thus gypsum is
formed. (Mosier et al. 2005). The large amounts of gypsum negatively influence
the downstream process, and also results in a low-value byproduct stream
(Yang et al., 2008). Thus, the treatment entails considerable expenses, which
limits wide commercial implementation in comparison with other possible
methods of hydrolysis (Hu et al. 2008).
3.6 Organic Acid Hydrolysis
The acetic acid shows good properties as organic solvent. It is acting as an
agent for fractionation, enables degradation of hemicelluloses simultaneously
with extensive delignification at high acid concentration. Furthermore, furfural
can be produced in relatively large quantities according to the severity of the
treatment conditions (Abad et al., 1996). The conditions suggested by Abad et
al. (1996) were targeted on the furfural generation during the fractionation of
eucalyptus wood with acetic acid-water-HCl solutions. For the following
objective, wood samples were treated at 120-130oC with 95% acetic acid
solutions containing 0.2-0.4% HCl as catalyst. The HCl-catalyzed acetic acid
hydrolysis is a similar process to sulfuric acid catalyzed treatment, which entails
the same problems as occurrence of reactions leading to the consumption of
sugars/furfural. By contrast, hydrolysis in acetic acid media has benefits: the
short reaction times, the mild operational temperatures, lower catalyst
concentration. (Abad et al. 1996).
The other alternative to sulphuric acid pretreatment can be suggested maleic
and fumaric acids (Maarten et al., 2009, p. 126). Neither maleic nor fumaric acid

22
does not provide such reactions resulting in formation of large amounts of
hemicelluloses degradation products (Maarten et. al., 2009, p. 126). Moreover,
the quality of the byproduct streams improves significantly by applying organic
acids, because it may be used for fertilizing soil, or applied in animal feed
(Maarten et. al., 2009, p. 126).
The treatment conditions for the organosolvent hydrolysis of wheat straw were
suggested by Maarten et al. as follows: 50 mM water solution of maleic/fumaric
acids was applied to 7.34 g of dry matter, which resulted in 10% (w/w) of dry
straw solids loading. The impregnation time for mixture was 24 hours at room
temperature, after that mixture was treated with temperature of 130, 150, and
170 oC for 30 min. (Maarten et. al., 2009, p. 127).
4 EXPERIMENTAL PART
4.1 Equipment
The extraction of hemicelluloses was carried out in a laboratory at Saimia
University of Applied Sciences, Imatra. The set of equipment consisted of
vessel autoclave and ethylene glycol bath. These pieces of equipment are
shown in the figures 4.1 and 4.2.

23
Figure 4.1 Laboratory autoclave used for experiments
The autoclave in the figure 4.1 is a cylindrical rotating vessel made of stainless
steel, while rotation provides mixing of reaction medium. The total volume of
vessel is around 10 litters. The rotation and heating degree of the vessel can be
adjusted: rotation is in on/off mode, temperature is controlled by relative scale
from one to ten. The autoclave has a range of working temperatures between
20oC and 180oC, and working pressure is approximately from 2 atm to 15 atm.
A lid is equipped with temperature and pressure meters, and gas outlet is
fastened to an autoclave with nuts which makes it leakproof.
The second part of experiments was performed in ethylene glycol bath, which
can be seen in the figure 4.2. The eight reservoirs with volume of approximately
200 ml were placed inside the glycol bath, then the cover was closed and they
were sunk into the ethylene glycol. During treatment the reservoirs were
constantly rotated. The treatment temperature range is set on the control panel,
while rotation can only be adjusted as on/off.

24
Figure 4.2 On the left hand side, control panel is illustrated and glycol bath is on the right hand side.
Both of equipment enables to follow required treatment conditions and obtain
products of desired quality. However, the amounts of production are different,
the autoclave enables to produce large quantities of hydrolyzate (around 10
liters) and treated lignocellulosic material, whereas glycol baths provides small
sample quantities. The benefit of glycol bath is that up to eight different samples
can be produced at one run, because eight samples of different materials and
solvents can be placed in reservoirs. The cooling down time is different for
equipment, because it takes more time to naturally decrease the temperature of
glycol bath.
4.2 Materials and Methods
The raw materials for the experiments were birch chips, and sawdust mixture of
mainly pine and other softwoods obtained from Imatra sawmill. The chips were
screened prior to hydrolysis. The chips screen and obtained fraction of chips
are shown in the figure 4.3.
25
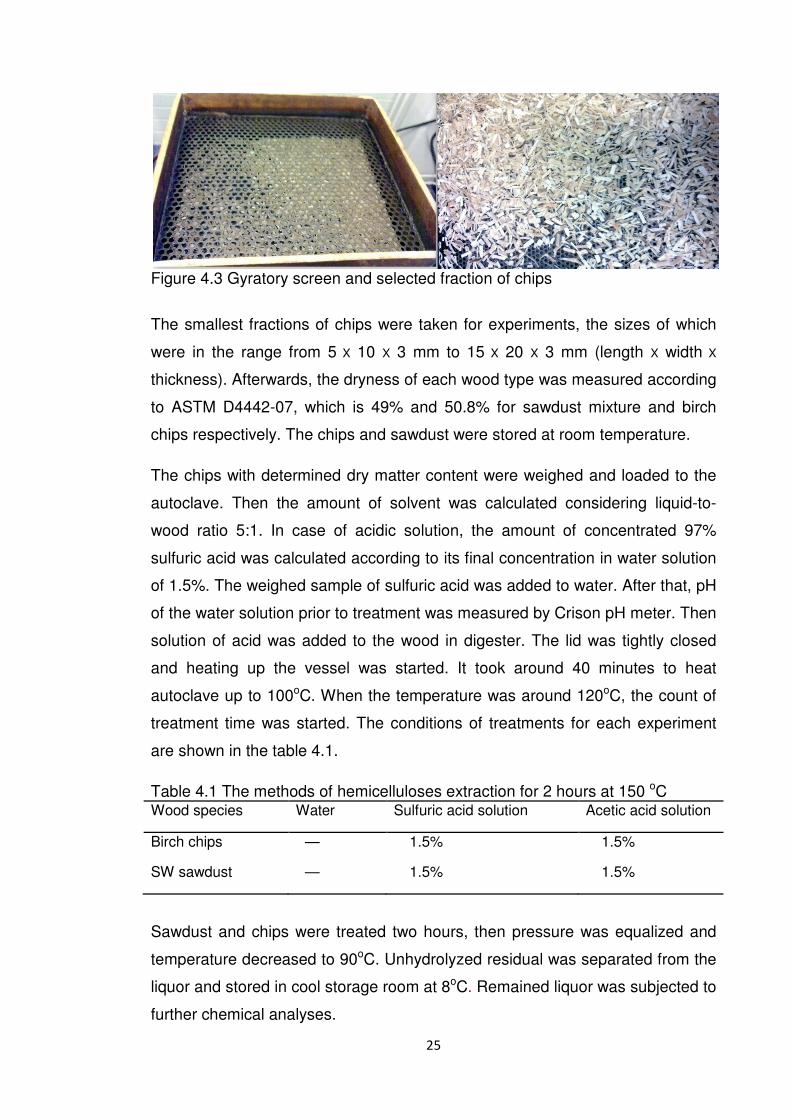
Figure 4.3 Gyratory screen and selected fraction of chips
The smallest fractions of chips were taken for experiments, the sizes of which
were in the range from 5 X 10 X 3 mm to 15 X 20 X 3 mm (length X width X
thickness). Afterwards, the dryness of each wood type was measured according
to ASTM D4442-07, which is 49% and 50.8% for sawdust mixture and birch
chips respectively. The chips and sawdust were stored at room temperature.
The chips with determined dry matter content were weighed and loaded to the
autoclave. Then the amount of solvent was calculated considering liquid-to-
wood ratio 5:1. In case of acidic solution, the amount of concentrated 97%
sulfuric acid was calculated according to its final concentration in water solution
of 1.5%. The weighed sample of sulfuric acid was added to water. After that, pH
of the water solution prior to treatment was measured by Crison pH meter. Then
solution of acid was added to the wood in digester. The lid was tightly closed
and heating up the vessel was started. It took around 40 minutes to heat
autoclave up to 100oC. When the temperature was around 120oC, the count of
treatment time was started. The conditions of treatments for each experiment
are shown in the table 4.1.
Table 4.1 The methods of hemicelluloses extraction for 2 hours at 150 oC Wood species Water Sulfuric acid solution Acetic acid solution
Birch chips — 1.5% 1.5%
SW sawdust — 1.5% 1.5%
Sawdust and chips were treated two hours, then pressure was equalized and
temperature decreased to 90oC. Unhydrolyzed residual was separated from the
liquor and stored in cool storage room at 8oC. Remained liquor was subjected to
further chemical analyses.

26
4.3 Capillary Electrophoresis
The analysis of hydrolyzate samples were carried out in the laboratory of
analytical chemistry at Lappeenranta University of Technology. Separations of
the carbohydrate standards and acid hydrolysis samples were performed with a
P/ACE MDQ (manufactured by Beckman-Coulter Inc.) capillary electrophoresis
instrument equipped with a photodiode array UV detector at wavelength 270
nm. Fused silica capillaries of 50 micrometers I.D. and length 51.5/60 cm
(effective length/ total length) were used in the experiments. The samples were
injected at a pressure of 0.5 psi (34.47 mbar) and the injection time was
optimized to 8.0 seconds. Another apparatus, 3D CE (Agilent), was used for the
experiments, the capillary I.D. of which is 50 micrometers and injection pressure
and temperature are 50.0 mbar for 8.0 seconds. Both apparatus have a
separation voltage of 17 kV. Also an electrolyte solution consisted of 130 mM
NaOH and 36 mM Na2HPO4·2 H2O, pH of the electrolyte solution had a value of
12.6. Before each measurement the capillaries were conditioned by rinsing with
0.1 M sodium hydroxide, Milli-Q water, and electrolyte solution.
5 RESULTS
Several analytic techniques were used in order to characterize the liquors such
as pH measurement, measurement of dry solids content, identification of
monosaccharides by capillary electrophoresis.
5.1 pH Measurement
The pH measurement was done for all hydrolyzates received during
experimental work. The results are illustrated in the figures 5.1 and 5.2, pH of
liquors was measured before and after hydrolysis by revolving autoclave and
glycol bath respectively.

Figure 5.1 The pH values of solvents prior to extraction and pH values of hydrolyzates from autoclave
As can be seen from the figure 5
drops after extraction, from 7 to 1.6. Decrease in pH is
acetic acid contained in wood.
case of sulfuric acid
that released acetic acid is much weaker than sulfuric
sulfuric acid can be consumed in the neutralization reactions with various wood
compounds. The acidity of
acidity of hydrolyzates
lignocellulosic bioma
Figure 5.2 The pH values of solvents prior to extraction and pH values of hydrolyzates. The liquors were received by treatment in the glycol bath.
27
Figure 5.1 The pH values of solvents prior to extraction and pH values of from autoclave.
een from the figure 5.1, pH of autohydrolysis liquors significantly
after extraction, from 7 to 1.6. Decrease in pH is affected
acetic acid contained in wood. However, pH slightly increases after extraction in
case of sulfuric acid-catalyzed hydrolysis. This increase occurs due to the fact
that released acetic acid is much weaker than sulfuric acid
sulfuric acid can be consumed in the neutralization reactions with various wood
compounds. The acidity of initial solution does not impact directly
acidity of hydrolyzates, but acidity developed during hydrolysis within the
lignocellulosic biomass does. (Testova 2006, p. 16).
Figure 5.2 The pH values of solvents prior to extraction and pH values of liquors were received by treatment in the glycol bath.
Figure 5.1 The pH values of solvents prior to extraction and pH values of
.1, pH of autohydrolysis liquors significantly
affected by released
slightly increases after extraction in
zed hydrolysis. This increase occurs due to the fact
acid. Also part of the
sulfuric acid can be consumed in the neutralization reactions with various wood
es not impact directly the final
, but acidity developed during hydrolysis within the
Figure 5.2 The pH values of solvents prior to extraction and pH values of
liquors were received by treatment in the glycol bath.

As can be seen from the figure 5.2, there is the same trend of pH changes as in
previous graph. The pH of hydrolyzate drops from 7 to 3.82, due to liberation of
acetic acid from wood. However,
was added initially, did
birch chips treatment increased from 2.87 to 2.90, whereas the pH of SW
sawdust hydrolyzate changed from 2.87 to 3.15. The higher value of p
observed in the second case, which might be due to
amount of neutral compounds of the wood in case of SW sawdust.
5.2 Dry Solids Content
The samples of hydrolyzates from each treatment were placed in oven at 40
in order to evaporate liquid and measure dry solids content. The results can be
found in the figure 5.3.
Figure 5.3 The dry solids content of the samples
As can be seen from
by treatment with acid
extraction. For example, dry solids content of birch liquors are 6.09% and
1.21% for acid-catalyzed and hot water extraction respectively. Furthermore,
was observed that the concentration of solids is higher in
hydrolyzates than the amount of solids dissolved in liquors from birch chips.
28
can be seen from the figure 5.2, there is the same trend of pH changes as in
The pH of hydrolyzate drops from 7 to 3.82, due to liberation of
acetic acid from wood. However, the pH of hydrolyzates, to which aceti
was added initially, did not change considerably. The pH of hydrolyzate from
birch chips treatment increased from 2.87 to 2.90, whereas the pH of SW
sawdust hydrolyzate changed from 2.87 to 3.15. The higher value of p
observed in the second case, which might be due to dissolution of bigger
amount of neutral compounds of the wood in case of SW sawdust.
ontent
The samples of hydrolyzates from each treatment were placed in oven at 40
evaporate liquid and measure dry solids content. The results can be
found in the figure 5.3.
Figure 5.3 The dry solids content of the samples
can be seen from the figure 5.3, dry solids content in hydrolyzates obtained
by treatment with acid catalyst is higher than that in case of hot water
extraction. For example, dry solids content of birch liquors are 6.09% and
catalyzed and hot water extraction respectively. Furthermore,
was observed that the concentration of solids is higher in
hydrolyzates than the amount of solids dissolved in liquors from birch chips.
can be seen from the figure 5.2, there is the same trend of pH changes as in
The pH of hydrolyzate drops from 7 to 3.82, due to liberation of
of hydrolyzates, to which acetic acid
The pH of hydrolyzate from
birch chips treatment increased from 2.87 to 2.90, whereas the pH of SW
sawdust hydrolyzate changed from 2.87 to 3.15. The higher value of pH is
dissolution of bigger
amount of neutral compounds of the wood in case of SW sawdust.
The samples of hydrolyzates from each treatment were placed in oven at 40 oC
evaporate liquid and measure dry solids content. The results can be
the figure 5.3, dry solids content in hydrolyzates obtained
in case of hot water
extraction. For example, dry solids content of birch liquors are 6.09% and
catalyzed and hot water extraction respectively. Furthermore, it
was observed that the concentration of solids is higher in SW sawdust
hydrolyzates than the amount of solids dissolved in liquors from birch chips. The

29
values are 1.21% and 2.57% for hydrolyzates of birch chips and SW sawdust
respectively. Furthermore, the same tendency can be seen in samples
received after acid catalyzed hydrolysis. The amount of solids dissolved in
hydrolyzate received from birch chips treatment is 6.09%, whereas it is 12.09%
in SW sawdust sample.
The observations support theoretical supposition that fine particles provide
higher yield of dissolution products (Pettersen 1984). Moreover, acid catalyzed
hydrolysis is more effective in a comparison with Autohydrolysis, so that more
solids were transferred into solution (Azarov et al. 1999, Gellerstedt et. al.
2009).
5.3 Comparison of Extracts after Treatment
Visual comparison of hydrolyzate samples have shown that all liquids have high
content of dissolved hemicelluloses due to their rich color (Testova 2006, p. 33).
The extraction liquors are shown in the figure 5.4. Also it was observed that
after some time a solid-phase precipitation was formed on the bottom of each
bottle. The solid phase might contain small pieces of fibers and brownish
powder-like particles that may resemble lignin. During water hydrolysis, less
lignin was dissolved in a comparison with acid catalyzed hydrolysis, thus hot
water hydrolyzates have less precipitate (Springer et al. 1982). Also dissolved
solids and other components of lignocellulosic material might contribute to the
density of the liquors (Appendix 1: Figure 1).

Figure 5.4 The extraction liquors
Moreover, the solutions received from acid catalyzed hydrolysis have dark
color, due to the fact that catalyst might cause formation of furfural and
hydroxyl-methylfurfural (Qian et al. 2
reaction steps occurring to polysaccharides can be seen in the figure 5.5.
degradation products of furfural consist of humic substances, which are dark
colored high molecular compounds (Nova Scotia Environmen
substances are formed as the result of condensation reaction under high
temperature and mineral acid acting as catalyst.
The figure bellow represents the stages of monosaccharides formation and their
degradation into other products. The fu
decomposition, while in the presence of tempera
and HMF continue splitting into levulinic and formic acids.
30
Figure 5.4 The extraction liquors.
Moreover, the solutions received from acid catalyzed hydrolysis have dark
color, due to the fact that catalyst might cause formation of furfural and
methylfurfural (Qian et al. 2005; Maarten et. al. 2009).
reaction steps occurring to polysaccharides can be seen in the figure 5.5.
degradation products of furfural consist of humic substances, which are dark
colored high molecular compounds (Nova Scotia Environmen
substances are formed as the result of condensation reaction under high
temperature and mineral acid acting as catalyst.
The figure bellow represents the stages of monosaccharides formation and their
degradation into other products. The furfural and HMF are products of sugars
decomposition, while in the presence of temperature and acid catalyst furfural
tinue splitting into levulinic and formic acids.
Moreover, the solutions received from acid catalyzed hydrolysis have dark
color, due to the fact that catalyst might cause formation of furfural and
et. al. 2009). The scheme of
reaction steps occurring to polysaccharides can be seen in the figure 5.5. Also,
degradation products of furfural consist of humic substances, which are dark
colored high molecular compounds (Nova Scotia Environment 2008). Humic
substances are formed as the result of condensation reaction under high
The figure bellow represents the stages of monosaccharides formation and their
rfural and HMF are products of sugars
ture and acid catalyst furfural

31
Figure 5.5 Reactions occurring to carbohydrates during hydrolysis of lignocellulosic materials. (Gellerstedt et al. 2001)
5.4 Comparison of Electropherograms
The identification of monosaccharides pictured in electropherograms was
processed according to a certain order. The migration order of
monosaccharides was as follows: xylitol, cellobiose, glucose, fructose,
rhamnose and mannose. The respective order is applicable for all
electropherograms, because standard solution and experimental conditions
were identical for all samples. Despite the fact that migration times of sugars in
standard solution and in sample may differ, the order remains as described. The
quantity of each monosaccharide can be calculated via its peak area and
corresponding calibration line. The examination of electropherograms, which
were obtained from different hydrolyzates, revealed approximate composition of
monosaccharides in each sample and unknown compounds were pointed out.

32
5.4.1 Analysis of Birch Hydrolyzates
In the obtained descriptions of reference sugars, there was a migration time of
xylitol. However, the xylitol is not a product of reactions in the hydrolyzate and it
might be mistaken with xylose. Due to the fact that hydroxyl group in xylitol is
substituted for aldehyde group in xylose, both compounds might have the same
migration time. Furthermore, xylose is a main monosaccharide by its quantity in
hardwood, whereas it is the second in softwood as can be seen from the figure
2.3. Also the cellobiose, which is a disaccharide and the product of incomplete
hydrolysis of glucose, can be found in big quantities in the hydrolyzates.
The electropherograms of birch hydrolyzate are shown in the Appendix 2:
Figure 1. On the second electropherogram can be seen that xylose is at 10.037
minute, cellobiose forms a peak at 10.632 minute, glucose is at 13.1 minute,
and poorly separated mannose is at 15 minute.
The electropherograms of liquor sample from hydrolysis catalyzed by sulfuric
acid are illustrated in the Appendix 2: Figure 3. The sugars are identified
according to the first electropherogram, where xylose and cellobiose appears at
7.33 and 7.79 minutes respectively. Then glucose might be at 10.975 minute
with corresponding area of 1670. Other two peaks at 12.018 and 12.39 did not
separate well, thus it can be said that one of them is mannose and another is
monosaccharide (arabinose, rhamnose, galactose).
The electropherograms of hydrolyzate sample of birch treated by hydrolysis with
acetic acid as catalyst are presented in the Appendix 2: Figure 4. Due to the
poor resolution it is difficult to identify compounds, but xylose might be at 10.196
minute, cellobiose followed by glucose at 10.59 and 10.852 respectively.
On the basis of CE analysis it can be said that principle monosaccharides of
birch hydrolyzates are xylose and glucose. However, other sugars (arabinose,
rhamnose, galactose) are present in insignificant quantities or cannot be
defined. The same conclusion was made by Rovio et al. in his work. Moreover,
the common unidentified compounds were found in all electropherograms of
birch samples. The two peaks are formed clearly between 20th and 22nd

33
minutes, because sugars migrate early it is possible to suggest that these
compounds are not sugars.
5.4.2 Analysis of Sawdust Hydrolyzates
The hydrolyzate sample of SW sawdust after Autohydrolysis is shown in the
Appendix 2: Figure 2, where the migration order of sugars is as follows: xylitol,
mannitol, cellobiose, glucose, fructose, rhamnose and mannose. The xylose is
at 7.32 minute, cellobiose at 8.067 minute, galactose is at 9.80 minute and
mannose is at 10.614 minute. As can be seen lots of monosaccharides
occurred in the hydrolyzate, despite the size of the peaks area the quantity of
the sugars cannot be defined directly from the figure.
The hydrolyzate sample of SW sawdust after treatment by 1.5% acetic acid is
illustrated in the Appendix 2: Figure 5. By following the same procedure as
described above, it can be said that hydrolyzate is composed of lots of
monosaccharides. However, it can be seen that xylose might migrate at 7.47
minute, glucose is at 10.069 minute and mannose can be at 11.604 minute.
In a comparison with birch hydrolyzates, there are various monosaccharides
clearly visible and they might have approximately even quantities. The
approximate monosaccharide composition of liquors can be seen in the table
5.1.
5.5 Concentration of Hydrolyzates
The capillary electrophoresis analysis revealed large concentration of various
monosaccharides in the liquid samples. However, the significant amounts of
glucose, mannose, xylose and cellobiose were detected in a comparison to
other sugars. The concentrations of major monosaccharides are given in table
5.1.

34
Table 5.1 Concentrations of monosaccharides in hydrolyzate samples
Compounds [g/l]
Birch, acid SW sawdust, acid
Birch, water SW sawdust, water
Glucose 18.27 50.80 1.60 1.35 Cellobiose 9.13 23.85 0.40 0.34 Mannose 5.48 15.39 0.33 4.63 Xylose 21.15 12.97 6.87 3.72 Total Sugars 54.20 103.01 9.20 10.04 Other 6.70 17.89 2.90 2.56
As can be seen from the table 5.1, there is a great difference between acid
catalyzed hydrolysis and hot water hydrolysis. The distinction is also observed
between hydrolyzate samples of hardwood and softwood, which were
compared to results obtained by Rovio et al. The concentration of total sugars is
very important for further conversion, generally, the higher concentration of
sugars, the more efficient conversion is. It was found out that the highest
concentration of sugars was obtained after acid-catalyzed hydrolysis of SW
sawdust (around 103 g/l), which may occur due to better diffusion of reagents
and larger reaction area of fine sawdust particles. However, acid-catalyzed
hydrolysis of birch chips yielded only a half amount of sugars in a comparison
with results of SW sawdust, around 54.20 g/l. Hot water hydrolysis provided
very low concentration of sugars, from 9 g/l to 10 g/l, and hence that cannot be
regarded as prospective in given conditions.
Concentration of certain sugars shows a clear difference between hardwood
and softwood such as non-cellulosic sugars, xylose and mannose. One reason
is difference in raw materials, which are birch chips and SW sawdust. Birch
hydrolyzate is rich in xylose, because a principle hemicellulose unit is O-acetyl-
4-O-methylglucuruno-β-D-xylan which counts almost to half of whole amount of
released sugars (Azarov, 1999). On the other hand, birch hydrolyzate contains
very small amount of mannose (5,48 g/l), while SW sawdust hydrolyzate
contains three times more mannose (around 15,5 g/l), because glucomannans
contribute to 15-20% of SW composition (Azarov, 1999). Relatively low amount
of glucose is in the birch hydrolyzate (18,27 g/l), which can be explained by fact
that hydrolysis in this case occurred only in easy-accessible part of cellulose
while crystalline part remained untouched. Amount of glucose in case of SW

35
sawdust is much higher and because of that, it is possible to say that hydrolysis
occurred in crystalline part of cellulose as well.
5.6 Discussion
The hydrolysis of softwood chips should be performed and compared with
results of hardwood chips. Moreover, sawdust of hardwood and softwood
should be treated at the same conditions and compared. The results may
provide complete information of what monosaccharides can be obtained at the
same conditions from different wood species. Therefore the hydrolysis
efficiency can be identified.
The various hydrolysis catalysts of different concentrations can be studied in
order to find the most suitable one. For example, more experiments with acetic
acid are worth to perform and to try higher concentrations with small addition of
strong acid acting as catalyst. The example of the work can be seen in the
article of Abad et al.
The capillary electrophoresis was found to be an effective method of
compounds separation for identification. However, different experimental
conditions should be studied in order to get a clear characterization of each
sample. Moreover, not only sugar analysis has to be performed, but also it is
interesting to know the uronic acids composition. Also it can be important to
know whether any furfural or HMF is in the sample, because these chemicals
act as inhibitors during biofuel production.
6 SUMMARY
The aim of this study was to investigate the effect of different hydrolysis
techniques on the two types of raw material, birch chips and sawdust mixture of
softwood. The obtained hydrolyzates were analyzed, e.g. pH measurement,
measurement of dry solids content, and monosaccharides identification by the

36
capillary electrophoresis method. The results revealed that sulfuric acid
catalyzed hydrolysis was more effective in a comparison with hot water
treatment and hydrolysis with acetic acid catalyst. The hydrolysis with sulfuric
acid catalyst is the most prospective approach for sugars´ extraction among
tested methods according to the results. Moreover, hydrolyzates received from
SW sawdust treatment contained more products than others, because of larger
surface area and better diffusion. Moreover, it is also possible that hydrolysis
occurred in crystalline part of cellulose as well in softwood.
The obtained experimental results e.g. change of pH values of solution, different
concentrations of monosaccharides and the total product yield support both the
study of the wood chemistry and the study of acid-catalyzed hydrolysis of
hemicelluloses from wood by other researchers. On the other hand, the study
results show that in order to obtain the certain type of monosaccharides for
further conversion, the hydrolysis process could be carefully selected. Xylose-
rich liquors of acid hydrolysis of birch chips can be used in xylitol production
after required cleaning procedures, while glucose-rich hydrolyzates of SW
sawdust treatment can be utilized in biofuel production.

37
REFERENCES Abad, S., Alonso, J.L., Santos, V., Parajó, J.C. 1996. Furfural from wood in catalyzed acetic acid media: a mathematical assessment. Bioresource Technology 62, pp. 115-122 Atkins, P., de Paula, J. 2005. Elements of physical chemistry. Fourth edition. United States: W.H. Freeman and Company. ISBN: 0199271836 Azarov V., Burov A., and Obolenskaya A. (1999). The Chemistry of Wood and Synthetic Polymers. ISBN-5-230-10569-0. 626 p. Book in Russian. Biochemistry 2010. Polysaccharides. http://www.mrothery.co.uk/biochm/biochmnotes.htm (Accessed on 15 October 2010)
Crestini, C., Crucianelli, M., Orlandi M., Sladino, R. 2010. Oxidative strategies in lignin chemistry: A new environmental friendly approach for the functionalisation of lignin and lignocellulosic fibers. Catalysis Today 156, pp. 22 Department of Energys Genomic, 2010. http://genomics.energy.gov. Doherty W., Mousaviouna P., Fellows C. (2011). Value-adding to cellulosic ethanol: Lignin polymers. Industrial Crops and Products 33, pp. 259-276 Garotte, G., Domínguez, H., Parajó, J. C. 2001. Generation of xylose solutions from Eucalyptus globulus wood by autohydrolysis-posthydrolysis processes: posthydrolysis kinetics. Bioresource Technology 79. pp 155-164. Gellerstedt, G. Henriksson., Ek, M. 2009. Wood chemistry and biotechnology. Göttingen: Hubert & Co. ISBN 978-3-11-021339-3 Holkin, J.I. 1989. Technologia Gidroliznyh Proizvodstv. Moscow: Lesnaja Promishlennost.
Hon, D. N.-S., Shiraishi, N. 2001. Wood and cellulosic chemistry. 2nd edition. New York: Marcel Dekker Inc. ISBN: 0-8247-0024-4
Humic Substances.
http://www.gov.ns.ca/nse/water/docs/droponwaterFAQ_HumicSubstances.pdf (Accessed on 17.04.2011) Hu, G., Heitmann, J. A., Rojas, O. J. 2008. Feadstock pretreatment strategies for producing ethanol from wood, bark, and forest residues. Bioresources 3(1). pp. 270-294. Jones, J., Semrau, K. 1984. Wood hydrolysis of ethanol production, Previous experience and the economics of selected process. Biomass 5, 109–135.

38
Kellomäki, S. 2009. Forest resources and sustainable management. In: Paper Making Science and Technology. Jyväskylä: Paper Engineers’ association/ paperi ja puu Oy. ISBN: 9789525216325 Khan, M. A. 2010. Hydrolysis of hemicellulose by commercial enzyme mixtures. Luleå University of Technology. Department of Chemical Engineering and Geosciences. Master Thesis. Korpinen, R. 2010. On the potential utilisation of sawdust and wood chip screenings. Åbo Akademi University. Department of Chemical Engineering. Phd thesis. Laine, C. 2005. Doctoral dissertation ISSN 1457-6252. Structure of hemicelluloses and pectins in wood and pulp. pp. 57 ISSN 1457-6252
Lavarack, B. P., Griffin, G.J., Rodman, D. 2002. The acid hydrolysis of sugarcane bagasse hemicellulose to produce xylose, arabinose, glucose and other products. Biomass and Bioenergy 23, pp. 367-380 Liu, S. 2010. Woody biomass: Niche position as a source of sustainable renewable chemicals and energy and kinetics of hot-water extraction/hydrolysis. Biotechnology Advances 28 (2010) 563-582. Maarten, A., Kootstra, J., Beeftink, Hendrik H., Scott, Elinor L., Sanders, Johan P.M. 2009. Comparison of dilute mineral and organic acid pretreatment for enzymatic hydrolysis of wheat straw. Biochemical Engineering Journal 46, pp. 126-131. Mosier, N., Wyman, C., Dale, B., Elander, R., Lee, Y. Y., Holtzapple, M., Ladisch, M. 2005. Features of promising technologies for pretreatment of lignocellulosic biomass. Bioresource Technology 96. pp 673-686. Nova Scotia Environment. 2008. Humic substances. Pettersen, R. C. 1984. The chemical composition of wood. In: Rowell, R. The chemistry of solid wood. USA: American Chemical Society. ISBN13: 9780841207967 Qian, X.H., Nimlos, M.R., Davis, M., Johnson, D.K., Himmel, M.E., Ab initio molecular dynamics simulations of beta-d-glucose and beta-d-xylose degradation mechanisms in acidic aqueous solution, Carbohydr. Res. 340 (2005) 2319–2327. Rovio, S., Simolin, H., Koljonen, K., Sirén, H. 2008. Determination of monosaccharide composition in plant fiber materials by capillary zone electrophoresis. Journal of chromatography A, 1185. pp. 139-144.
Sixta, H. 2006. Handbook of pulp. Volume 1. The Federal Republic of Germany: Strauss GmbH, Mörlenbach. ISBN: 3527309993
39
Sjöström, E. 1981. Wood chemistry. New York: Academic press Inc. ISBN 012647480X Springer, E. L., Harris, J. F. 1982. Prehydrolysis of aspen wood with water and with dilute aqueous sulfuric acid. USDA Forest Service, Forest Products Laboratory, Madison. Stenius, P. 2000. Forest products chemistry. In: Gullichsen, J., Paulapuro, H. Paper making science and technology. Jyväskylä: Fapet Oy. ISBN: 9525216039 Testova, L. 2006. Hemicelluloses extraction from birch wood prior to kraft cooking. Luleå University of Technology. Department of Chemical Engineering and Geosciences. Master Thesis. Wood Technology 2010. Technologia gidroliza drevesiny. http://www.woodtechnology.ru/obrabotka-drevesiny/ximicheskaya-obrabotka-drevesiny/texnologiya-gidroliza-drevesiny.html (Accessed on 15 October 2010)
Yang, B., Wyman, C.E. 2008. Pretreatment: the key to unlocking low-cost cellulosic ethanol, Biofuels Bioprod. Biorefining 2. pp. 26–40.

Figure 1 Density of liquors received during hot water and sulfuric acid catalyzed hydrolysis in the revolving digester.
Figure 1 Density of liquors received during hot water and sulfuric acid catalyzed hydrolysis in the revolving digester.
APPENDIX 1
1 (1)
Figure 1 Density of liquors received during hot water and sulfuric acid catalyzed

APPENDIX 2 1 (5)
Figure 1Electropherogram of hydrolyzate sample from birch chips autohydrolysis during 2 hours, where 1 –hydrolyzate sample, 2 – sample and standard solution of fructose (25 ppm), 3 – standard solution of fructose (25 ppm)
5 10 15 20 25
mAU
0
2.5
5
7.5
10
12.5
15
17.5
20
DAD1 A, Sig=270,20 Ref=off (LK2011\11040703.D)
3.4
19
4.6
55 4
.703
4.7
36
6.5
68
7.2
78 7
.558 7.7
48
8.6
58 8
.735 9.3
10
9.6
60
10.
039
10.
633
11.
019
11.
193
11.
369
11.
531
11.
687
12.
329
12.
365
12.
587
12.
789 1
3.18
9 1
3.28
6 1
3.41
0
14.
042
14.
206
14.
495
14.
982
15.
234
15.
463
15.
933
16.
179
16.
980
17.
220
17.
334
17.
473
17.
500
17.
694
18.
643 1
9.16
6
19.
765
20.
888
21.
515
23.
284
23.
547
24.
462
5 10 15 20 25
mAU
0
2.5
5
7.5
10
12.5
15
17.5
20
DAD1 A, Sig=270,20 Ref=off (LK2011\11040705.D)
0.1
68
1.0
26
3.5
53 3
.643
3.8
45
5.0
86 5
.144
6.7
05 6
.936
7.2
72
7.7
45
8.1
51
8.9
56
9.3
02
9.6
64 9
.805
9.8
54 1
0.03
7
10.
632
10.
963 1
1.08
9 1
1.24
5 1
1.35
8 1
1.51
1 1
1.67
4
12.
316
12.
379
12.
399
12.
421
13.
187
13.
270
13.
418
13.
546
13.
599
13.
656
13.
928
14.
038
14.
201
14.
482
14.
972
15.
223
15.
457
15.
926
16.
166
16.
455
18.
243
18.
455
19.
052
19.
172
19.
423
19.
461
19.
786
20.
245
20.
906
21.
522
21.
785
21.
835
22.
399
22.
509
22.
662
22.
826
25.
267
5 10 15 20 25
mAU
0
2.5
5
7.5
10
12.5
15
17.5
20
DAD1 A, Sig=270,20 Ref=off (LK2011\11040701.D)
0.3
48
3.8
33
4.5
09 7.3
21
7.6
70
8.0
67
9.3
95
9.7
36 10.
195
10.
389
10.
701
11.
077
13.
160
13.
411
17.
573
17.
599
19.
692
20.
036
22.
781
22.
841
23.
334
23.
901
24.
112
24.
549
1
2
3

2(5)
Figure 2 Electropherogram of hydrolyzate sample from SW sawdust autohydrolysis during 2 hours, where 1 – hydrolyzate sample, 2 – sample and standard solution of fructose (25 ppm), 3 – standard solution of fructose (25 ppm)
8 10 12 14 16 18 20 22
mAU
0
2.5
5
7.5
10
12.5
15
17.5
20
DAD1 A, Sig=270,20 Ref=off (LK2011\11040707.D)
7.3
40
7.8
18
8.2
16
8.4
41
8.7
62
9.4
26
9.7
87 10.
189
10.
842
11.
236
11.
412
11.
531
11.
688
11.
859
11.
966
12.
196
12.
312
13.
175 13.
416
13.
523
14.
300
14.
474
14.
738
15.
263
15.
516
15.
764
16.
238
17.
094
17.
369
17.
497
17.
663
19.
104 19.
613
20.
516
21.
406
22.
061
22.
714
8 10 12 14 16 18 20 22
mAU
0
2.5
5
7.5
10
12.5
15
17.5
20
DAD1 A, Sig=270,20 Ref=off (LK2011\11040709.D)
7.3
16
7.7
92
8.1
73
8.7
68
9.4
07
9.8
00 10.
176
10.
814
11.
256
11.
399
11.
502
11.
663
11.
834
12.
137
12.
522
12.
653
13.
147 1
3.49
7
14.
268
14.
460
14.
740
14.
935
15.
255
15.
502
15.
767
16.
235
17.
383
18.
061
19.
129
19.
626
20.
564
21.
446
22.
103
8 10 12 14 16 18 20 22
mAU
0
2.5
5
7.5
10
12.5
15
17.5
20
DAD1 A, Sig=270,20 Ref=off (LK2011\11040701.D)
7.3
21
7.6
70
8.0
67
9.3
95
9.7
36 10.
195
10.
389
10.
701
11.
077
13.
160
13.
411
17.
573
17.
599
19.
692
20.
036
22.
781
22.
841
1
2
3

3 (5)
Figure 3 Electropherogram of hydrolyzate sample from birch chips treatment during 2 hours with sulfuric acid as catalyst (1.5%), where 1 –hydrolyzate sample, 2 – sample and standard solution of fructose (25 ppm), 3 – standard solution of fructose (25 ppm)
10 15 20
mAU
0
5
10
15
20
25
30
DAD1 A, Sig=270,20 Ref=off (LK2011\11040713.D)
7.0
59
7.3
39
7.7
94
Are
a: 5
6.26
93
9.2
43
Are
a: 1
670.
19
10.
975
Are
a: 1
641.
36
12.
018
Are
a: 1
252.
51
12.
392
Are
a: 5
2.72
55 1
3.61
2 Are
a: 1
57.9
19
14.
967
Are
a: 1
57.0
27
16.
276
17.
968
18.
040
18.
388
18.
729
19.
451
19.
673
20.
468
20.
950
21.
052
21.
345
21.
405
21.
688
21.
787
21.
823
22.
283
22.
602
23.
118
24.
501
10 15 20
mAU
0
5
10
15
20
25
30
DAD1 A, Sig=270,20 Ref=off (LK2011\11040701.D)
7.3
21
7.6
70
8.0
67
9.3
95
9.7
36
10.
195
10.
389
10.
701
11.
077
13.
160
13.
411
17.
573
17.
599
19.
692
20.
036
22.
781
22.
841
23.
334
23.
901
24.
112
24.
549
10 15 20
mAU
0
5
10
15
20
25
30
DAD1 A, Sig=270,20 Ref=off (LK2011\11040605.D)
7.1
80
7.5
43
7.9
22
8.3
82 8
.483
8.9
31
9.5
80
10.
025
10.
241
10.
542
10.
631
15.
363
15.
695
15.
728
15.
826
15.
940
16.
448
17.
481
18.
538
19.
295
20.
434
20.
610
22.
512
22.
758
23.
360
23.
857
1
2
3

4 (5)
Figure 4 Electropherogram of hydrolyzate sample of birch chips treatment during 2 hours with acetic acid as catalyst (1.5%), where 1 – hydrolyzate sample, 2 – standard solution of fructose (25 ppm)
7.5 10 12.5 15 17.5 20 22.5 25
mAU
2
4
6
8
10
DAD1 A, Sig=270,20 Ref=off (LK2011\11041533.D)
Are
a: 1
2.95
82
7.4
80
Are
a: 8
.549
72
7.6
49
Are
a: 1
0.38
58
9.0
84 Are
a: 1
3.29
46
9.4
34
Are
a: 3
7.47
78
9.7
36
Are
a: 1
01.8
11
10.
196
Are
a: 1
9.66
33
10.
590
Are
a: 4
3.35
64
10.
852
Are
a: 7.
3556
8
11.
066
Are
a: 1
0.00
25
11.
307
Are
a: 7
.069
33
11.
484 A
rea:
43.
3328
13.
078
Are
a: 7
.200
74
14.
230
Are
a: 5
.588
03
14.
717
Are
a: 1
0.84
97
14.
933
Are
a: 9
.009
52
15.
146
Are
a: 3
1.62
82
15.
681
Are
a: 2
7.45
62
18.
948
Are
a: 7
.479
82
19.
525
Are
a: 2
2.18
39
20.
579
Are
a: 3
1.30
2
21.
132
Are
a: 5
.177
12
25.
433
Are
a: 2
9.84
34
25.
620
min7.5 8 8.5 9 9.5 10 10.5 11 11.5
mAU
1
1.25
1.5
1.75
2
2.25
2.5
2.75
3
3.25
DAD1 A, Sig=270,20 Ref=off (LK2011\11041515.D)
Are
a: 1
3.667
7
7.4
96
Are
a: 1
1.225
7.8
63
Are
a: 1
2.77
54
8.2
93 A
rea:
3.1
4409
10.
006
Are
a: 7
.881
94
10.
471
Are
a: 3
.7779
1
10.
674 A
rea:
5.4
6293
11.
016
Are
a: 5
.392
93
11.
125
1
2

5 (5)
Figure 5 Electropherogram of hydrolyzate sample from SW sawdust treatment during 2 hours with acetic acid as catalyst (1.5%), where 1 - hydrolyzate sample, 2 – sample and standard solution of fructose (25 ppm), 3 – standard solution of fructose (25 ppm)
5 10 15 20 25
mAU
0
2
4
6
8
10
12
DAD1 A, Sig=270,20 Ref=off (LK2011\11041529.D)
5 10 15 20 25
mAU
0
2
4
6
8
10
12
DAD1 A, Sig=270,20 Ref=off (LK2011\11041530.D)
7.4
78
Are
a: 8
.768
68
7.6
93
Are
a: 7
.926
48
7.8
91
8.5
97
Are
a: 1
3.99
49 9
.351
Are
a: 1
2.99
56
9.7
23
Are
a: 3
8.77
7
10.
069
Are
a: 1
38.4
9
10.
604
Are
a: 6
4.95
91
11.
211
Are
a: 8
.779
42
11.
590
Are
a: 1
3.68
73
11.
785
Are
a: 8
.246
1
11.
956
Are
a: 2
3.22
81
13.
492
Are
a: 3
5.89
03
13.
592
14.
078
Are
a: 1
1.84
33
14.
393
Are
a: 1
0.14
53
14.
572
Are
a: 8
.380
58
14.
839
Are
a: 1
1.67
86
15.
363
Are
a: 2
1.81
48
15.
611
Are
a: 4
8.52
35
16.
378
16.
828
16.
878
16.
939
17.
048
17.
158
17.
200
17.
360
17.
736
18.
958
Are
a: 2
3.11
24
19.
837
Are
a: 3
5.89
33
21.
604
Are
a: 4
1.49
45
22.
234
5 10 15 20 25
mAU
0
2
4
6
8
10
12
DAD1 A, Sig=270,20 Ref=off (LK2011\11041516.D)
0.0
93
Are
a: 1
3.69
45
7.4
88
Are
a: 1
1.33
49
7.9
21
Are
a: 11
.933
4
8.2
95
Are
a: 2
.566
14
10.
035
Are
a: 6
.783
28
10.
481
Are
a: 3
.456
11
10.
683
Are
a: 5
.387
56
11.
021
Are
a: 4
.657
37
11.
092
1
2
3