your wealth & life - ubs€¦ · your wealth & life navigating ... live.2 life expectancy...
TRANSCRIPT

UBS CIO Wealth Management Research 3Q 2014
Your Wealth & Life
Navigating longevity
Personal strategies for wealth management
Inside: An interview with the head of MIT’s AgeLab, Joe Coughlin

ContentsNavigating longevity
02 Editorial
03 Introduction: Planning for longevity risk certainty
06 Interview: David McWilliams speaks with Joe Coughlin
08 Longevity planning for retirees
Safe spending rates, revisited Personal pensions Efficientwithdrawalstrategies Prudent leverage Demographics and asset returns
17 Millennials and longevity
Human capital, the hidden asset Human capital and asset allocation Insurance implications of a longer life Locatingassetsduringwealthaccumulation
23 Wealth transfer and legacy
Trusts:focusonflexibility Longevityandtheannualgifttaxexclusion Givingwhileliving
31 Disclaimer

Inearly2013,weasked2,056investorsabouttheirtopfinan-cial concerns (UBS Investor Watch,Q12013).Nearlyallofthetoptenresponseswerestrategicinnature.HowdoIknowifI’msavingenough?HowdoIknowifI’lloutlivemyassets?HowcanIavoidmajorfinancialmistakes?HowdoIprepare forhealthcareexpensesinretirement?HowdoIensurethefinancialwell-beingofmychildrenandgrandchildren?
Wewerenotsurprisedbytheseresults.Duringtherecoveryfollowingthefinancialcrisis,we’venoticedaseaofchangeinourclients’perspectivesaboutmanagingtheirwealth.Perhapsitwasarecognitiondrawnfromdevastatedhouseholdbalancesheetsin2008andearly2009,butachievinggoalshaselevatedinimportancewhereastheephemeral“outperformance”bogeyseemstohavetakenabackseat.
Inordertoaddressthesemore-strategicquestions,we’repleasedtolaunchthefirsteditionofournewquarterlyflag-ship, Your Wealth & Life.Thispublicationwillprimarilyfocusonwhatacademicsandpractitionersrefertoasthelifecycletheoryofwealthmanagement.
Ultimately,savingsandinvestmentarevehiclesforshiftingconsumptionintothefuture,butasmanyinvestorshavedis-covered,successfullyaccomplishingthattaskisfraughtwithchallenges.Withthisnewflagshipreport,weendeavortoofferrigorousanswerstotheseveryimportanttopics.
Ourfirsteditionfocusesonlongevity.Whetheryou’re25,55or75,thechangingnatureofhumanlongevityimpactshowyoushouldsave,invest,plan,spend,give,andbequest.Wehopeyoufindthiscomprehensiveoverviewbothinterestingand enlightening.
Dear reader,
MichaelCrook
MikeRyan
Mike Ryan, CFAChief Investment Strategist, WMARegional CIO, Wealth Management US
Michael Crook, CAIAHead of Portfolio & Planning Research
CIO, Wealth Management US
2 September2014Your Wealth & Life

Your Wealth & LifeSeptember20143
Introduction Planning for longevity risk certainty
Michael Crook, CAIA, Head of Portfolio & Planning Research
Imagineyouwerea40-year-oldmalein1940.Youhadsurviveda15%chanceofpassingawayduringyourfirstyearoflife(anda1.5%probabil-ityofpassingawayduringWWI),butyourfuturemortalityremainedveryuncertain.Eventhoughyourremainingmedianlifeexpectancywasprettyreasonableat30to40moreyears,youhadaslightlyhigherprobabilityofpassingawayinyourmid-60sthaninyourmid-80s.1Livingwellintoyour80sand90swasafairlylow-probabilityrisk.Certainlysuchanoutlookwouldhaveanimpactonhowyousavedandinvestedoveryourlifetime.

4 September2014Your Wealth & Life
Introduction
Fast forward to 2014Theoutlookforlongevityhasshiftedsignifi-cantly.Notonlyhasinfantmortalitydeclinedbyover98%in100years,butdueinparttomajorpublichealthgains,likedeclinesinsmoking-related illness and car fatalities, end-of-life lon-gevityhasimprovedsignificantlyaswell.Peopleare living longer, healthier lives. Mostlongevitydiscussionsfocusonextensionsofmedianlifeexpectancy.Thesehavebeenimpres-siveandshouldn’tbeunderstated–particularlybecausemanystudiesindicateindividualssys-tematicallyunderestimatehowlongtheywilllive.2Lifeexpectancyfora65-year-oldintheUSjumpedfrom12.7yearsto15yearstonearly20yearsbetween1940,1970,and2010,respec-tively.3Keepinmindthatlifeexpectancynum-bersaremediannumbersandthatfullyhalfofall65-year-oldswilllivepastthemedianexpectancy. Assuch,usingmedianlifeexpectancynumbersdesigned to represent an entire population can beamisleadingguidetolongevity.Becauseoffactorssuchasobesityandsocioeconomic
status,“average”longevitycanbehighlyvariedamongdifferentpopulationsandcohorts.Forinstance,individualsthatretainahealthybodymassindexthroughouttheirlivescanreasonablyadd2to3yearstothemediannumbers.
Perhapsanequallyimportantbutoftenover-lookedaspectoflongevityisthechangingdistri-butionofmortalityoverthelifecycle(seeFig.1).Only50yearsago,a65-year-oldfacedroughlyanequalprobabilityofdeatheveryyearuntiltheywere85,atwhichpoint80%hadpassedaway.Asitisnow,deathwasguaranteed;onlythetimingofitwasextraordinarilyuncertain. Today,thedistributionsurroundingtheproba-bilityofdeathhasbecomemuchmorepeaked.Survivalintoaperson’s80sand90sismuchmorelikely.Infact,anaverage65-year-oldfemaletodayhasagreaterthan30%chanceoflivingto90.Survivorshipoddsforacouplecompound these statistics further. There’s a 50%probabilitythatatleastonememberofatwo-personhouseholdcurrentlyaged65willlivetobe90.
25%Decline between 1981 and 2009 in age-adjusted death rate for all causes of death among people age 65 and over.2
Retirement ≠ Old84% of investors say retirement is not a sign of being old (UBS Investor Watch).1
50%Decline in death rates for heart disease and stroke between 1981 and 2009.2
Lung cancerThe decrease in smok-ing has been a major factor in the decline of the US cancer death rate overall – especially the lung cancer death rate among men.3
Feeling goodDuring the period of 2008–2010, 76 percent of people age 65 and over rated their health as good, very good, or excellent.2

Wheredoesgivingfitin?Finally,section3providesamultigenerationalperspective.Familiesshouldexpectmoregen-erational overlap in the future, requiring greater diligencetoachievewealthtransferandcharita-blegivinggoals.OurmostrecentInvestorWatchpublication,5whichfocusedoninheritance,foundthat60%ofbenefactorswouldprefertopassonwealthwhilelivingratherthanpost-humously.Givingwhilelivingisclearlygrowinginimportance.Welookatsomeframeworkstoachievetheseobjectiveswhilemaintainingflex-ibilitytochangecourseinthefuture.
Sowhatistheimpact?Basedonthisdata,webelieveitisfairtosaythat longevity riskhasbecomelongevity cer-tainty for most households. The impact is far-reaching.Forretirees,thedurationofretirementhasbecomeamajorretirementriskonparwithcatastrophic health care costs.4 Section 1 of this documentpresentsananalysisoftherisksretir-eesface,guidelinesforaddressingthoserisks,anupdatedmethodologyfordeterminingsaferetirementspendingandareviewofefficientassetdistributionguidelines.Avoidingunforcederrorsduringtheretirementperiodwillbevitalto success.
Whataboutthosewhoareyetto retire?Section2looksathowthechangingnatureoflongevityimpactsthosewhoarepre-retirementand, in particular, Millennials. Millennials have pursued a higher level of educational attainment thananygenerationbeforethem.Theirlargestassetishumancapital,andnowtheyfacelon-gerworkingperiodsastheyconvertthathumancapitalintofinancialassets.Wediscusstheinvestment, insurance, and asset location impact ofthesetrendsforinvestorsintheir20sto50s.
Source: Human Mortality Database. University of California, Berkeley (USA), andMax Planck Institute for Demographic Research (Germany). Available at www.mortality.orgor www.humanmortality.de (data downloaded on 7/30/2014); CIO WMRA
19501900 2000
2050
2.0
1.5
0.0
0.5
1.0
3.5
3.0
2.5
4.0
1 9 17 25 33 41 49 57 65 73 81 1059789 113
Fig 1: Longevity has become more certain
Probability distribution of life expectancy by birth year, in %
Freq
uenc
y of
dea
th
Age
Source: Social Security Administration, CIO WMRA
19001950
40
20
0
100
80
60
120
65 68 71 74 77 80 83 86 89 92 95 10410198 107 110
Fig. 2: Households should plan for one member to live wellinto old age
Probability of at least one member of two-person household surviving tocertain age based on year of birth, in %
Your Wealth & LifeSeptember20145
Introduction

David McWilliams: You recently conducted a survey that looked at concerns about the future. What were the top concerns that the participants reported?
Joe Coughlin: Weconductedanonlinestudytobetterunderstand,acrossthelifespanregardlessofgeneration,theworriesthatpeoplehavefortheirfutureolderlives.Considerthefollowing:youarelikelytoliveatleast20,30,maybeeven40yearspastretirementageifyouchooseyourparentswellandmanageyourownwell-being.Wewantedtounderstandhowdifferentagegroupsthoughtaboutthoseconcerns.Acrossallgroupsthenumberoneconcernwasfinan-cialstability.Healthcertainlybecomesatop-tworelatedissue–butagainthedefinitionofcon-cernabouthealthisalsotiedtowhosehealthyouareconcernedabout.Whenyou’reyoungerit’saboutyou.Whenyou’reolder,andthatstartstochangearound55,westartbeingmorecon-cernedaboutthehealthandwealthofothers.
In what other ways do concerns change based on age?Inthe45-to54-year-oldgroupthenumberoneconcernisindeedfinancialstability.It’snotjustamatterofhowmuchmoneywillIhave,butwillIhaveastableandsteadyincometohavethelifestylethatIwant.Andthatbeginstochangealittlelateron.Now,there’sanumberofotherissuesthatbecomemorepronouncedasweage.Findingcare,makingsurethatwehaveaccesstocarethatwemayneed,lossofcognitivefunc-tion,etc.It’sveryinterestingthatinmanycasesdeathislessofafearthanlossofcognitiveabil-ityduetoAlzheimer’sordementia.Nextwaslossofmobility,whichbeginswithdriving.Thinkaboutthis:70%ofAmericansoverage50live
insuburbanandruralareas.Chancesaretheydon’tlivenearmasstransitorwithinwalkingdistanceofmostplaces.Iftheydon’tdrive,theybecomeeffectivelyprisonersintheirownhomes.
I’m just surprised you’re worried about mobility when you’re 54 years old. Thinkaboutwhatyou’redoingwhenyouare45to54.You’recallingyourparentsnotjusttosayhello.You’recallingyourparentsoftentothankGodthattheyanswerthetelephone.SoIthinkthat’swhereyoustarttoseethatyourownagingasarealconcern.Andfranklythisisaper-fecttimeforthinkingabouthowtomanagethecomplexitiesofretirement.
Okay – that’s helpful. Then what happens when you reach your mid-50s and early 60s?Financialstabilityisstillnumberone,butnowyoustarttobecomemoreconcernedaboutyourgrandchildrenandtheirchildren’sfinancialstabil-ity.Butreallywhatchangesprofoundlyisthenextconcern–lossofcognitivefunction.Manyofourrespondentsbegintothinkabouthavingtoplanforthepossibilityoflong-termcareformemoryloss,forformalcareathome,forthetimewhenyouoryourpartnermightlosecognitiveabil-ity.Somethingthatistotallynewasareportedconcernforthisgroupisthefearofbecomingaburden.Beginninginthe60’s,respondentsshow
Interview David McWilliams, Head of Wealth Management Transformation at UBS,recentlysatdownwithJoseph F. Coughlin, Ph.D., Director of the MassachusettsInstituteofTechnologyAgeLab.Hisresearchexamineshowthedisruptivedemographicsofanagingsociety,socialtrendsandtechnol-ogywillshapefutureinnovationsinbusinessandgovernment.Wefeatureexcerptsoftheirdiscussionbelow.
You may be able to climb that ladder at age 80 or 85, but do you want to take the risk, and do you want to hear your spouse or your adult children yelling at you as you’re doing it?
6 September2014Your Wealth & Life

The last one, “Who will you have lunch with?”Yes,“Whowillyouhavelunchwith?”Andcommonsenseandverygoodsocialbehavioralresearch has demonstrated that a strong social networkiscriticaltoagingwell.Arecentmedi-calstudycameoutshowingthat60%ofolderadults over the age of 70 come into hospital emergencyroomsmalnourished,regardlessofincomeandeducation.Why?They’renoteat-ingcorrectly.Andoneofthereasonsthey’renot,particularlywomenwholivealone,isthateat-ingisasocialactivity.Wemakemeals,wehavecelebrations,weenjoybreakingbreadwithoth-ers.However,whenwelivebyourselvesorwedon’thavethatstrongsocialnetwork,wetendtogetalittlelazyandallofasuddenasliceofcheeseandawiltedpieceoflettucebecomesameal.Soweneedtohavefriendsaroundtorein-forcehealthybehaviors,togetusout,toensurethatweadheretoourmedicationregimens,justfranklytoremainvitalpeople.Ifyou’regoingtobeliving20or30yearsbeyondretirement,that’saboutthesamedistanceyouhadfromhigh school graduation to midlife crisis. That’s a longtimeandyouneedalonglistofthingstoremainhealthy,happy,vitalandinteresting.
Any final thoughts?Ithinktheonethingthatwetendtoforgetaboutisthatasweageandaswechange,retirementhasgottenfarmorecomplexthaneverbefore.Wenowneednotjustanadvi-sor,notjustafinancialplanner,butsomeonetohelpusnavigatelongevity.Wearenowliv-inginatimeinwhichwehavefewerchildrenwithus,andwehavenorealmentalmodelorexampleofwhatourparentsdidinthesamesituation.Thelast20to30yearsofourlifecanbeamongthemostcomplextimes.Andsoaswethinkaboutplanningforretirement,theconcernshouldbe“WhatamIgoingtodoandneedregardingresources?Myphysical,cogni-tive,financial,andsocialresourceswillbecomestrained in old age. What do I need to do to ensurethehighestqualityoflifeIcanhave?”
interestonwhatarethethingsthatIcandotoplantoavoidbecomingaburden,notjusttomypartnerbuttomyadultchildrenaswell.
You sometimes use three questions, I under-stand, to illustrate needs in retirement. Why do you choose these questions and what do they mean? Ithinkoneofthethingsthatweneedtostartthinkingaboutis,“Arewedoingretirementplan-ning,arewedoingfinancialplanning,orarewedoinglongevityplanning?”SoIposedthreeques-tionsthatareprofoundlysimple,butthey’rethepartsofretirementwenevertalkabout.Wetalkaboutvolunteering,wespeakofvacations,wespeakofgrandchildren.Thosearethethingswelookforwardto,butthere’salsothemundanethatweoftendon’tthinkabout.Thefirstques-tionis“Whowillchangeyourlightbulbs?”Wetendtoforgetthatthelittlethingswedoeverydayreallycontributetoourcapacitytoremainindependent.Youmaybeabletoclimbthatlad-deratage80or85,butdoyouwanttotaketherisk,anddoyouwanttohearyourspouseoryouradultchildrenyellingatyouasyou’redoingit?Soyouhavetostartthinkingnow,“Whatisthecostandtheplanningnecessaryforservicesto‘age-in-place,’tomakeitpossibleforyoutostayinthehomethatyouwanttobein?”
I think this is spectacular. Well your next one is, “Where will you get an ice-cream cone?”Yes,wellthisismyfavorite.AndthisislargelybecauseoriginallywhenIstartedstudyingagingIstartedstudyingitfromatransportationpointofview.Forme,chocolateice-creamisahugequalityoflifeissue.Butthinkaboutthefol-lowing:ifyoudonotdriveoryoucannotwalktoyourfavoriteicecreamshop,howwillyougetthere?Areyougoingtotakeataxi?Areyougoingtocallafriend?AreyougoingtobotheranadultchildforthatlittlespontaneousmomentonahotJulynightwhenyousimplywantachocolatesoftserve?Theanswerisprob-ably‘no.’Andwhilethecapacitytohavethatice-creamconeisaboutseamlesstransportation,italsohighlightstheimportanceof,whatyou’replanningforthat20,30,maybeeven40yearsofretirement,ensuringthatyouknowandhaveaccesstowhatisdesired,notjustneeded.
Interview with Joe Coughlin
Joe Coughlin and David McWilliams are employees of MIT and UBS Wealth Management Transformation, respectively. They are not members of CIO Wealth Management Research (CIO WMR). CIO WMR may have views that differ or are contrary to the views expressed herein.
Your Wealth & LifeSeptember20147

8 September2014Your Wealth & Life
Longevity planning for retirees
Retiredinvestorsfaceamultitudeofrisks,allofwhichfoldupintoasingleoverarchingone:longevity.Willyououtliveyourmoney?Inadditiontofocus-ingoninvestmentreturnsandspendingrates,weendorseacomprehensiveapproachthatincludesmoreefficientmanagementofliabilities,anintelligentwithdrawalstrategyandgreaterincorporationofannuities.
Longevity:Althoughmortalitydataindicatesthatliving30ormoreyearsafterretirementisincreasinglylikely,longevityremainsariskfromaport-foliostandpoint.31%ofthevarianceintherequiredstartingvalueinourmodelwasduetouncertaintyaroundlongevity.Notonlydolongerretire-mentdurationsincreasetheriskthatanotherriskwilleventuallyoccur,buttheysignificantlyincreasethedollaramountofassetsnecessarytoinitiallyfundretirement.Broad-basedfinancialplanningonaconsistentbasisisthefirststepformanaginglongevityriskoverthecourseofretire-ment,butaddinganexplicitlongevityhedgeintheformofadeferredannuityshouldbeacorepartofmosthouseholds’balancesheets.– continues next page
The risks facing retirees (in order of relative importance)
31%
A multitude of risks, all surmountableTheGreatRecessionandfollowingperiodoflowinterestratesandanemiceconomicgrowthhavehighlightedtherisksfacedbyinvestorsnearingretirement.Unfortunately,manyretireesdon’tfeelliketheyhaveasolidgraspoftherelativesignificanceofthemajorriskstheyfaceduringretire-ment.Asaresult,wehavedevelopedamarket-basedforward-lookingmeasureofthecontribu-torstoastartingbalancethatisneededforasuccessfulretirement(definedasnotrunningoutofmoney).Wehopeitcanhelpbetterillustratewhichfactorsaremostimportanttomanagingfinancesduringretirement.
Michael Crook, CAIA, Head of Portfolio & Planning Research

Your Wealth & LifeSeptember20149
Interest rates:14%ofthevariancearoundtheinitialstartingvalueisduetothelevelofinterestrates.Lowinterestratesareachallengesincelowratesbegetlowreturnswithinfixedincome.Althoughweexpectthisprob-lemtomoderateasratesnormalize,investorsshouldcertainlyincorporatelower-than-averagebondreturnsintotheircurrentfinancialplanning.
Inflation:Inflationisalwaysamajorlong-termriskforretireessincesmallchangesinannualinflationcanhavesignificantramificationsovermultipledecades.Inflationrisk(accountingfor14%ofthevarianceinthestartingvalueinourstudy)canbemitigatedbyremainingfullyinvested,holdingassetclassesthatareexpectedtobroadlyincreaseinvaluewithinflation(e.g.,equities,commodities,realestate),havingsomewealthannuitizedwithinflationprotection(socialsecurityandmostpensionsfitintothisclassification),andfocusingonlong-termmeasuresofsuccessratherthanshort-termvolatilitywhenmakingdecisions.
Equity volatility:Thesequenceofreturnsmattersagreatdealwhenassetsarebeingdistributedfromaportfolio.Earlynegativereturnscanbeconsid-erablymoredetrimentaltooutcomesthannegativereturnslateron.Equityvolatility,accountingfor13%ofvarianceintherequiredstartingvalue,isaproxyforpotentialsequencerisk.Properdiversificationalongwithsomeformofannuitizationisthebestwaytomitigatethisrisk.
Equity returns:10%ofthenecessarystartingleveliscontingentonreal-izedequityreturns.Althoughtherearenotmanysatisfyingwaystohedgelowreturns,investorsshouldtakecomfortinknowingthattheirsuccessisnotlargelypredicatedonUSequitymarketreturns.Globalizingequityport-folioscanfurthermitigatethisriskaswell.
Rate volatility:Ratevolatilitycanresultinfailureaswell(10%ofvariancearoundstartingamount).Althoughinterestratemovementshavebeenquitebenignoverthelast30years,sharpincreasesininterestratescanleadtolossesinbondportfolios,creatingthesametypeofsequenceriskprob-lemsanequitybearmarketcausesearlyinretirement.
Withdrawal rate:Althoughitiscertainlypossibletospendyourselfintothepoorhouseduringretirement,only7%ofthevarianceinrequiredstart-ingbalanceresultedfromspending.Basedonourmethodologyandassum-inganinitial4%withdrawal,aretireewhostartsspendingataprudentrateandthenhastoincreasespendingby25%inordertocoverunex-pectedexpenseswilllikelyremainsolventforthebalanceofretirement,allotherthingsbeingequal.
Correlations:Basedonouranalysis,smallchangesincorrelationsamongassetsclasseshavelittle(1%)impactonthenecessarystartingbalanceforasuccessfulretirement.Thisshouldn’tbeinterpretedasmeaningthatdiversificationisn’timportant–quitetheopposite.Awell-balancedandwell-diversifiedportfolioshouldserveretireeswell,despitepossibleshiftsincorrelations, over the full course of retirement.
The risks facing retirees (in order of relative importance) – continued
Longevity planning for retirees
14%
14%
13%
10%
10%
7%
1%

10 September2014Your Wealth & Life
Although our research indicates that spending is onlyoneofmanyimportantfactorsthatcontrib-utetotheriskoffailureinretirement,balancingconsumptionwithbequestandcharitablegoalscanbequitechallengingasinvestmentportfo-liosriseandfall,householdsage,andobjectivesevolve over time. Manyhouseholdshavebeeninfluencedbythesafewithdrawalrate(SWR)concept,colloquiallyknownasthe“4%rule.”The4%rulesaysthata65-year-oldcanwithdraw4%oftheassetsfromherportfolioduringthefirstyearofretire-ment,growthoseassetsbyinflationinsubse-quentyears,andhaveaminimalprobabilityofrunningoutofmoneyoverthenext30years.The“4%”numberonlyhasrelevanceduringthefirstyearofretirementsincespendingisthengrownbyinflation–resultinginaconstantstan-dardoflivingduringtheretirementyears.
The4%ruleiseffectivebecauseitissimpleandeasytoapply,buttherearealsomajorproblemsthatlimititsutility.First,thenatureofthe4%rule detaches spending from changes in portfolio value.Theresponsefunctioneachyearisexactly
thesame–increasespendingbyinflation–nomatterhowwellorpoorlytheportfoliohasper-formed.Thedetachmentfromrealityalsotendstomakeittooconservativebecause,withoutanyadjustmentovertime,therulehastobeori-entedtowardworst-caseoutcomes.Additionally,aspendingruleshouldincorporatelongevityandrecognizethataprudentconsumptionlevel,asapercentage of portfolio value, is higher for those intheir80sthanthoseintheir60s.Ultimately,followingthe4%rulehasresultedinportfoliosthathavegrownby100%ininflation-adjustedtermsoverthecourseofretirement–assetsthatcouldeasilyhavebeenusedtoimprovethestan-dard of living during retirement. Instead,amoreeffectiverulewouldbeonethatinitiatesspendingataprudentlevel,butenablesforstep-upsbasedongoodportfolioperfor-manceanddecreasinglifeexpectancywithoutleavingthehouseholdsubjecttotheneedtoreducelivingstandards.Wecallthisadynamicsafe depletion rate (DSDR).
TheDSDRworkslikeanSWRinthatitisaspeci-fiedinflation-adjustedamountofspendingthatcanbemaintainedthroughretirement,withtheimportant caveat that it is revised on an annual basis.Essentially,eachyearthehouseholdspendsthegreaterof(1)lastyear’sspendingadjustedforinflation(thesameasanSWR)or(2)thecurrentportfoliovaluemultipliedbythenewDSDR.Thatnewspendinglevelsetsanupdatedflooronfuturespending,withthepossibilityoffurtherincreasesbasedonmarketperformance.These potential step-ups are important (and can bequitesizable),particularlyduringthefirst10
Safe spending rates, revisited
Longevity planning for retirees
Source: MSCI, UBS CIO WMR
50
40
30
20
10
0
70
60
80
31 7 2725232119171513119 29 315
Fig. 2: A dynamic approach can enable increased consumption
Average inflation-adjusted spending per year, in thousands USD
4% RuleDSDR
Michael Crook, CAIA, Head of Portfolio & Planning Research
Fig. 1: Dynamic safe depletion rates
DSDR based on retirement horizon
Retirement Duration
DSDR Retirement Duration
DSDR
30 4.0% 22 4.5%
29 4.1% 21 4.6%
28 4.1% 20 4.8%
27 4.2% 19 4.9%
26 4.2% 18 5.0%
25 4.3% 17 5.2%
24 4.4% 16 5.5%
23 4.4% 15 5.7%
Source: MSCI, UBS CIO WMR

Your Wealth & LifeSeptember201411
to15yearsofretirementwhenmanyhouse-holdsreportthattheywouldprefertoprudentlymaximizespending.1
Basedondatafrom1963to2013,Fig.1pro-videsDSDRsforaportfoliocomprisedof50%large-capequities,10%small-capequities,and40%intermediate-terminvestment-gradecor-poratebonds,rebalancedannually.Again,thesearewithdrawalratesthatcanbemultipliedbythe current value of the portfolio to determine whetherornotaspendingstep-upisprudentbasedoninvestmentperformanceandupdatedretirementduration.Ofcourse,we’dadviseagainst using medianlifeexpectancyforsuchanexercise.Avaluethatreflectsatleastonemem-berofthehouseholdlivingintotheirmid-orlate-90sprovidesforahighermarginofsafety. ComparingtheresultsoftheDSDRstrategytothe4%ruleforthesameperiodfrom1963to2014isillustrativeinregardtothetrade-offs.Inregardtoconsumption,theDSDRenabledhouseholdstoprudentlyincreaseaveragespend-ingby40%and80%duringthefirst10and15yearsofretirement,respectively.Anexampleof this increase in consumption for a household startingwith1mmUSDcanbeseenbelow(seeFig.2).Thesespendingincreasestakeplacelead-inguptoandduringthe“mytime”(late-60stoearly-80s)phaseofretirement,duringwhichhouseholds report increased spending and a focus on travel and leisure. Thetrade-off,ofcourse,isthepotentialbequest.FollowingtheDSDRframeworkcertainlyleads,onaverage,tolowerterminalportfoliovalues.
However,corpusvaluesremainquitesubstantial–80%oftheinflation-adjustedvalueoftheini-tialportfolioafter30yearscomparedto200%forthe4%rule(seeFig.3).Suchanoutcomereflectsapreferablebalancebetweenconsump-tionandbequestformosthouseholdsandcan,ofcourse,betweakedupordowntoreflectpreferences in either direction.
Figure4illustratesinflation-adjustedconsump-tionpathsforthreedifferentretirementyearcohorts, assuming an initial portfolio value of$100:1968(ahorribleretirementcohort),1985(agoodretirementcohort),and1992(anaverageretirementcohort).Basedonabove-averagemarketreturns,theDSDRrulewouldhaveenabledhouseholdsinthe1985and1992cohortstosafelyincreasespendingby100%duringthefirstdecadeofretirement.Conversely,itwouldhaveprudentlyrestrainedspendingforthe1968cohortbasedonpoorratesofreturnandhighinflationduringthe1970s.
Ultimately,anyheuristicforretirementspend-ing,includingboththe4%ruleandtheDSDR,issimplyastartingpointfordiscussion.Safespendinglevelsarecontingentonmanyfactors,including asset allocation, asset location, and bequestmotives,allofwhicharelikelytochangeover the course of retirement. Comprehensive financialplanningistheonlywaytofullyincor-porateallofthehousehold-specificissuesneces-sarytomakeaprudentdecision.Accordingly,weadvisehouseholdstofeelcomfortableusingtheDSDRforguidancebasedonlong-termhistoricaldata,buttoupdatetheirfinancialplanbeforemakingbigshiftsinspendingduringretirement.
Source: MSCI, UBS CIO WMR
2,000
1,500
1,000
500
0
2,500
31 7 2725232119171513119 29 315
Fig. 3: Increased consumption results in lower terminal wealth
Real value of portfolio, in thousands USD
4% RuleDSDR
Source: MSCI, UBS CIO WMR
19851992 1968
8
6
0
2
4
14
12
10
16
1 3 5 7 9 11 13 15 17 19 21 272523 29
Fig. 4: Prudent spending step-ups can be substantial
DSDR step-ups based on retirement year
With
draw
al (r
eal,
$s)
Years aer retirement
Longevity planning for retirees
Pensionsaregenerallytreasuredretirementassetsbythosethatownthemsincetheyofferthe“definedbenefit”ofsafeinflation-adjustedincome streams for the duration of retirement. Theyeffectivelysolveinflationrisk,longev-ityrisk,andinvestmentriskallinoneproduct.Unfortunately,onlyabout40%1 of Americans overtheageof60arecoveredbydefined-bene-fitpensions,anumberthatisdecliningeachyear.
Fortunately,householdsarenotheldhostagetoemployersforattainingdefinedincomeinretirement. Those that don’t have access to pensionscan“pensionize”partoftheirport-foliothroughannuitization.However,thisisastepthatisrarelytaken.Oneexplanationisthatinvestorsappeartosuccumbtowhat’sknownastheendowmenteffect.Theyvaluethepensionsendowedtothemveryhighly,butarenotwillingtoconvertassetstoanannuityatretirement.
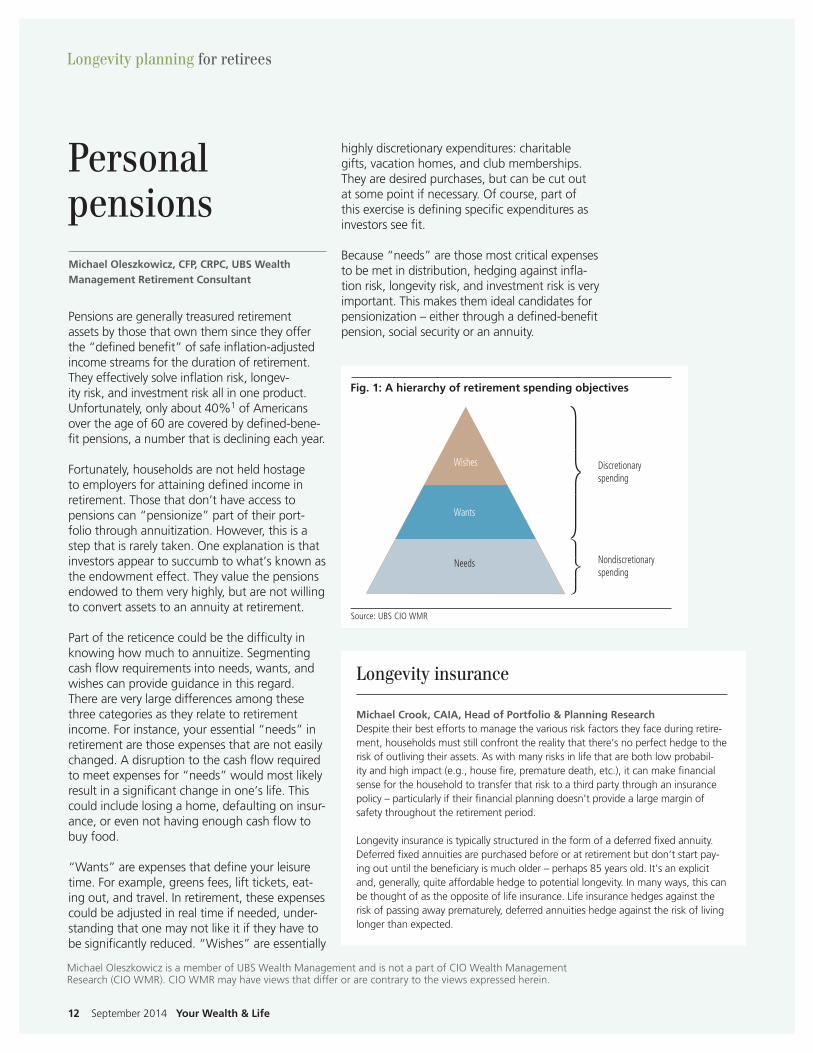
Partofthereticencecouldbethedifficultyinknowinghowmuchtoannuitize.Segmentingcashflowrequirementsintoneeds,wants,andwishescanprovideguidanceinthisregard.Thereareverylargedifferencesamongthesethreecategoriesastheyrelatetoretirementincome.Forinstance,youressential“needs”inretirementarethoseexpensesthatarenoteasilychanged.Adisruptiontothecashflowrequiredtomeetexpensesfor“needs”wouldmostlikelyresultinasignificantchangeinone’slife.Thiscould include losing a home, defaulting on insur-ance,orevennothavingenoughcashflowtobuyfood.
“Wants”areexpensesthatdefineyourleisuretime.Forexample,greensfees,lifttickets,eat-ingout,andtravel.Inretirement,theseexpensescouldbeadjustedinrealtimeifneeded,under-standingthatonemaynotlikeitiftheyhavetobesignificantlyreduced.“Wishes”areessentially
highlydiscretionaryexpenditures:charitablegifts,vacationhomes,andclubmemberships.Theyaredesiredpurchases,butcanbecutoutatsomepointifnecessary.Ofcourse,partofthisexerciseisdefiningspecificexpendituresasinvestorsseefit.
Because“needs”arethosemostcriticalexpensestobemetindistribution,hedgingagainstinfla-tionrisk,longevityrisk,andinvestmentriskisveryimportant.Thismakesthemidealcandidatesforpensionization–eitherthroughadefined-benefitpension,socialsecurityoranannuity.
Personal pensions
Longevity insurance
Michael Crook, CAIA, Head of Portfolio & Planning ResearchDespitetheirbesteffortstomanagethevariousriskfactorstheyfaceduringretire-ment,householdsmuststillconfronttherealitythatthere’snoperfecthedgetotheriskofoutlivingtheirassets.Aswithmanyrisksinlifethatarebothlowprobabil-ityandhighimpact(e.g.,housefire,prematuredeath,etc.),itcanmakefinancialsenseforthehouseholdtotransferthatrisktoathirdpartythroughaninsurancepolicy–particularlyiftheirfinancialplanningdoesn’tprovidealargemarginofsafetythroughouttheretirementperiod.
Longevityinsuranceistypicallystructuredintheformofadeferredfixedannuity.Deferredfixedannuitiesarepurchasedbeforeoratretirementbutdon’tstartpay-ingoutuntilthebeneficiaryismucholder–perhaps85yearsold.It’sanexplicitand,generally,quiteaffordablehedgetopotentiallongevity.Inmanyways,thiscanbethoughtofastheoppositeoflifeinsurance.Lifeinsurancehedgesagainsttheriskofpassingawayprematurely,deferredannuitieshedgeagainsttheriskoflivinglongerthanexpected.
Michael Oleszkowicz, CFP, CRPC, UBS Wealth Management Retirement Consultant
Longevity planning for retirees
Source: UBS CIO WMR
Fig. 1: A hierarchy of retirement spending objectives
Wishes Discretionaryspending
Nondiscretionaryspending
Wants
Needs
12 September2014Your Wealth & Life
MichaelOleszkowiczisamemberofUBSWealthManagementandisnotapartofCIOWealthManagementResearch(CIOWMR).CIOWMRmayhaveviewsthatdifferorarecontrarytotheviewsexpressedherein.

Your Wealth & Life August 2014 13
Mostinvestorsaccumulatethemajorityoftheirtotallifetimewealthbythetimetheyreachretire-ment.Withlowerincomestreamsbutpotentiallyhighercostsoflivinggoingforward,aninves-tor’sassetbasemustgeneratesustainablereturnscompatiblewithamodestspendingratethatgrowswithinflationovertime.Manyinvestorsearlyinretirementmightwronglybelievethattheirassetswillsafelycarrythemtoage80or90withahighdegreeofcertainty.Butfailingtoaccountforassetlocationinwithdrawalscandra-maticallyincreasetheriskofoutlivingone’sassets.
Asset location in the accumulation phase is a keydeterminantofaportfolio’slongevityinthewithdrawalphase.Reallocatingbetweentax-ableandtax-deferredaccountsisdifficult,anddramaticallyalteringthemakeupofone’stax-ableportfoliocanresultinlargetax-relatedandtransactioncoststhatincreaselongevityrisk.Ouranalysisindicatesthatminimizingunnecessarilylargetaxliabilitiesearlyinretirementisthelynch-pinofprolongingaportfolio’slongevity.Thisis
accomplishedbyoptimizingone’swithdrawalsbyassetlocation.
Figure1showsthebenefitofefficientwithdrawalpolicyinretirement.Itchartsthepathoftwoidenticalportfoliosheldbynewlyretired60-year-oldswith4%spendingrates,demonstratingthedramaticallydifferentresultsdependingontheorderinwhichthevariousaccountsaredepleted.Intheoptimalstrategy,requiredminimumdis-tributions(RMDs)fromtax-deferredaccountsarethefirstsourceofwithdrawalsalongwithcashflowsfromassetsheldintaxableaccounts.Nextcomeliquidationsofassetsheldintax-ableaccounts.Onlyaftertheseholdingsarefullydepleteddoessellingassetsheldintax-deferredaccountsbeyondRMDsbecomeprudent.
Investorswholiquidatetheirtax-deferredaccountstooearlywill,onaverage,severelycurtailtheirportfolios’longevity.Whyisthis?Withdrawalsfromtax-deferredaccountsaresubjecttoordinaryincometaxes,andtriggeringthosepotentiallyhightaxpaymentstoosoonintoretirementshrinksthebasefromwhichtheportfoliocangrowinfutureyears.Properassetlocationplacestheleasttax-efficientassetclassesintax-deferredaccountswhich,ifallowedtogrowtax-freeforlonger,cansupportaretiree’slifestyleforlongerandallowforalargerlegacygifttobeneficiariesorcharitiesupondeath.Ouranalysisshowsthata$10millionportfoliocanhaveitslongevityextendedbytentotwelveyearsiftheinvestormovesfromaninefficienttoanoptimalwithdrawalstrategy.Fig.2showsthe optimal order to fund retirees’ costs of living fromtheirassetbase.
Efficient withdrawal strategies
Source: UBS CIO WMR
$14$12$10
$8$6$4$2$0
$16
6559 77 8983 9571
Fig. 1: Efficient withdrawal strategy yields powerful results
Simulated retirement portfolio values in $mlns under different sequenceof withdrawals
Sell tax-deferred last Sell tax-deferred first
Longevity planning for retirees
Fig. 2: Avoid triggering highest tax liabilities early in retirement
Efficient sequence of withdrawal by account type for retirement spending needs
1. 401(k) or IRA required minimum distributions (70 1/2 & up)
2. Cash flows generated by assets in taxable accounts
3. Sale of assets in taxable accounts
4. Sale of assets in tax-deferred accounts
5. Sale of assets in tax-free accounts*
*Assumes investor does not move into higher tax bracket during retirement Source: UBS CIO WMR
Brian Nick, CAIA, Senior Investment Strategist

14 September2014Your Wealth & Life
Investorstendtospendquiteabitoftimeandefforttryingtooptimizetheirassetallocations,butfrequentlygiveshortshrifttotheliabilitysideofthebalancesheet.Conventionalwisdomalsosaysthatretireesshouldtypicallyavoiddebt.Unfortunately,suchaviewcanhaveanegativeimpact in regard to total resources and the cash flowavailableformeetingobjectives.Thecur-rentperiodofhistoricallylowrealinterestratesprovidesatacticalopportunityandincentivetoextenddebtmaturitiesandlockinlowrateswhileprovidinganimplicitinflationhedgeforthebalancesheet.
WeexpecttheFederalReservetomaintainaFedFundstargetof0-0.25%untilmid-2015.Aslongasshort-terminterestratesremainbelowthepre-vailingrateofinflationthecostofholdingdebttiedtoshort-termratesonabalancesheetisrela-tivelylow.Mortgagedebtprovidesoneexample,althoughthiscanbebroadlyextendedtoalltypesofresponsibledebt.Forexample,thepub-lishedannualpercentagerate(APR)foraJumbo7/1ARMfromUBSMortgagewas3.026%on7/31.Weexpectinflationtoaverageabout2.5%forthenextdecade,implyinganannualinflation-adjustedcostofonly0.526%forsevenyears.Totheextentthattheinvestor’sassetsareexpected
toreturnmorethan0.526%,maintainingthoseassetsinsteadofpayingoffdebtcanleadtoalargerbalancesheetinadditiontoprovidinggreatercashflowflexibility.
Aftersevenyearsourinterestratemodelsimplytherateonthemortgagewouldresetto4.76%andthento6.26%(seeFig.1)asone-yearLIBORincreases over time. At this point, the mortgage couldberefinancedorpaidoff,dependingontheinterest rate environment at that point in time.
Toseehowthisworksinpractice,supposeacoupleisreachingretirementwith$3millionintotalassets,includingtheircurrentprimaryresi-dence.Theywanttodownsizeintoa$500,000homeandaredeterminingwhetheritmakessensetouseanARMmortgagetofinance80%ofthecostoftheirnewproperty.Additionally,theyholdamoderateinvestmentproposalwithanestimatedreturnof6%peryearandexpectamarginaltaxrateof33%inretirement.Despitepayingabout$90,000ininterestthrough2021,thenetbalancesheetresult,onaverage,isagainofjustover$92,000(seeFig.2).
Inadditiontotheestimatedbalancesheetben-efit,there’sonemoreadvantagetothisstrategythatisworthmentioning:inflationprotection.Manyofourclientsareconcernedaboutabove-averageinflationinthefuture.Holdingfixed-ratedebtisonewaytoexpress,andhedgeagainst,thatview.Ifrealizedinflationishigherthanweexpect,thevalueofthedebtobligationwillbeeroded–makingthehouseholdbetteroff.
Prudent leverage
Source: Bloomberg, CIO WMRA, as of 7/30/2014
ARM Rate Modeled Index Rate
4
3
0
1
2
7
6
5
8
2014 2018 2022 2026 203820342030 2042
Fig. 1: We expect interest rates to rise gradually over time
Modeled rate path of 1-year LIBOR and a 7/1 ARM mortgage, in %
Inte
rest
Rat
e
Source: CIO WMRA
100,000
50,000
0
250,000
150,000
200,000
2014 2016 2018 2020 2022 2024 2026
Fig. 2: Estimated benefit of utilizing low-cost debt
Balance sheet differential, 7/1 ARM vs. no mortgage
Longevity planning for retirees
Michael Crook, CAIA, Head of Portfolio & Planning Research
We’d like to thank Jeff Gray for his consultation on this article.

Demographiceffectsonassetpricesareofinter-estforanumberofreasons.Forone,muchattentionhascorrectlyfocusedontheagingof populations in much of the advanced econ-omy(wherethebulkofglobalwealthresides)and selected emerging economies, such as China.Second,traditionallifecycleinvestmentapproaches suggest that older investors are likelytoprefersafetyandincome(e.g.,bonds)asopposedtogrowth(e.g.,stocks).Third,retir-eesareassumedtohavelowersavingsrates,astheyconsumetheiraccumulatedwealth,poten-tiallyimplyingimportantchangesinrealinterestrates.Finally,aggregatedoverlargepopulations,demographicchangesaretypicallypredictable(apartfromimmigration).Still,aswepointoutbelow,itistrickierthancommonlyassumedtoconcludehowchangesintheagestructureofapopulationwillaffectassetpricesandvaluations.
Demographics and valuationsWebeginwithequities.BasedonUSdataspan-ningmuchofthepost-warera,itispossibletodetectarelationshipbetweenP/Emultiplesandaging.Specifically,thereseemstobearelation-shipwiththeratiooftheoldercohort1withintheUSpopulation(seeFig.1).
Demographics and asset returns
Tobesure,correlationdoesnotimplycausality,buttheintuitionisthatthewealthaccumulatedbyolderpeopletendstobeinvestedinfinan-cialsecurities.ThiswaspointedoutbyLiuandSpiegel2 and, assuming that the relationship wascausalandwouldholdintothefuture,theyinferredthatUSequityvaluationwouldsufferheadwindsoverthenexttwodecadesasbabyboomerssellequitiestofinancetheirretirement.
Fixed-incomevaluationalsoappearstohaveaconditionalrelationshipwiththedominanceoftheoldercohort(seeFig.2),suggestingthatolder people have an increasing appetite for US Treasuries.Ofcourse,nominalTreasuryyieldsoverthepost-warperiodweresurelyinfluencedmorebychangingmacroeconomiccircumstances,suchasvariationsininflationexpectations.
Demographic trendsAlthough much discussion of US demograph-icsisdrawntotheagingofbabyboomers,thatfocusignoresanotherimportantfactaboutUSpopulationdynamics.Specifically,theUSfer-tilityrate(definedasthenumberofchildrenperwoman)hasbeenrisingsteadilyforthreedecadesandisnowabove2.ThatsuggeststhattheconventionalwisdomofanAmericagrow-ingeveroldermaynotberight,atleastatmoredistanthorizons.Thedemographichumpofbabyboomerswillmoveintothetailoftheagedistribution,andthedistortioncreatedbythepost-warspikeinfertilityrateswillfade.Inshort,demographicchange,asimportantasitmaybe,couldalsoprovetobetransitoryaslonger-runfactorsdeterminingpopulationgrowthchange.
.Source: DataSteam, Bloomberg, UN, UBS, as of 31 July 2014
40–64/20+ ratio, rhsS&P 500 P/E ratio
2015
05
10
4540353025
50
34
32
44
42
40
38
36
46
50 54 58 62
Forecast
66 70 74 78 82 86 90 141006029894 18
Fig. 1: Demographics might be a headwind for equity valuations
S&P 500 trailing 12m P/E vs. size of older cohort In %
Source: DataSteam, Bloomberg, UN, UBS, as of 7/31/2014
40–64/20+ ratio, rhsUS 10yr bond yields
420
14121086
16
34
32
44
42
40
38
36
46
50 54 58 62
Forecast
66 70 74 78 82 86 90 141006029894 18
Fig. 2: Apparent relationship between size of older cohortand bond yields
Treasury yield vs. size of older cohort, in %
Longevity planning for retirees
Larry Hatheway, PhD, Economist, UBS Inv. Research; Ramin Nakisa, PhD, Strategist, UBS Inv. Research
Your Wealth & LifeSeptember201415

Research on valuation tends to focus on the dominanceofthemiddle-to-oldcohortsbecausethesehaveshownassetvaluationrelationshipsinthepast.However,webelievethatthismaybemisleadingwhenextrapolatingintothefuture.Theoverwhelmingtrend,bothregionallyandglobally,isoneofincreasinglifeexpectancyasa consequence of medical advances, improv-ingdietandlifestylechange.Suchadramaticincreaseinthenumberofhealthyover-65scouldwellleadtosocialtransformation.Inparticular,agingbabyboomersmaynotwantto,orindeedbeableto,retiregiventhenecessityoffundinganincreasinglylengthyretirement.
International capital marketsMostworklinkingdemographicstoassetpref-erenceassumesaclosedeconomyandcapitalmarkets(forsimplicity).Butinaworldofincreas-inglyintegratedeconomiesandassetmarkets,thatassumptionisprobablytoostrong.Theincreasingintegrationofcapitalmarketsandtheriseofwealthinemergingeconomies,suchasChina,matters.Akeyconsequenceofglobaliza-tion,quitepossibly,willbeadeclinein“homecountrybias”asinvestorsseekgreaterdiversifi-cationandreturnonaworldwidebasis.Inthatenvironment, domestic preferences (including thosedrivenbyaging)willplayasmallerroleindetermining domestic asset prices.
Fadingdomesticpreferenceinassetpurchaseswillbecomeevenmoreimportant,giventhegrowingpoolsofinvestiblefundsoverseas.Indeed,therapidriseofawealthymiddleclassinChinaandelsewhereinthedevelopingworld
hascausedasharpriseinforeignownershipofUSassets(seeFig.3).Inshort,domesticdemo-graphicinfluencesonassetpricesmaybeoffsetbychangingglobaldemandforinvestibleassets.
Inthatregard,itisinterestingtolookatthecompositionofassetsownedbyforeigninves-tors. In the past, US investors sought higher returnsinforeignmarkets,whereasnon-USinvestorswerelookingforsafetyintheUS.Forexample,sovereignwealthfundslookingforasafestoreofwealthderivedfromcommoditiesoratradesurpluswouldpurchaseUSTreasuries.ThispatternseemstobechangingasforeignholdingsofUSTreasuriesarenowfalling,whileownershipofUSequitiescontinuesitssteadyrise.ForeignholdingsofUSequities,whichweresmallin2000,arenowrisingrapidly(seeFig.4).Forexample,ChineseownershipofUSstocksincreased26%between2010and2011(fromUSD127billiontoUSD159billion).
Inconclusion,wedonotbelievethereisastraightforwardcasetobemadethatdemo-graphicswillsignificantlyimpactassetreturnsover the coming decades. Although there is a theoreticalbasisforassuminganimpact,mostofthatworkassumesaclosedeconomy.Overall,theresearchthatwehavedonesuggeststhattherelationshipbetweenassetclassreturnsanddemographicshasbeentenuousatbest.Accordingly,wewouldencourageinvestorstofocus on more fundamental factors (e.g., valua-tions,corporateearnings,GDPgrowth,interestrates)whenprojectingfutureassetclassreturns.
Source: Haver, UBS, as of 31 July 2014
TreasuriesEquities
Agencies (rhs)Corporate Bonds
0
50
40
30
20
10
60
0.20.0
1.21.00.80.60.4
1.81.61.4
2.0
52 56 60 64 68 72 76 80 84 88 92 1208040096
Fig. 3: Foreign ownership of US assets continues to climb
Foreign ownership of US assets (% of total market)
Source: Haver, UBS
1000800600400200
0
14001200
1600
Hong
Kon
g
Mid
dle
East
oil e
xpor
ters
Irela
nd
Switz
erla
nd
Belg
ium
Cana
da
Luxe
mbo
urg
Caym
anIsl
andsUK
Japa
n
Chin
a
Rest
of
Wor
ld
Fig. 4: Foreign holdings of US equities have also been increasing
Foreign holdings of US equities (US$ bn)
2000 20132010
Longevity planning for retirees
16 September2014Your Wealth & Life
Larry Hatheway and Ramin Nakisa are members of UBS Investment Research and are not a part of CIO Wealth Man-agement Research (CIO WMR). CIO WMR may have views that differ or are contrary to the views expressed herein.

Your Wealth & LifeSeptember201417
Millennials’mostvaluableassetisn’ttheirstockorbondportfolio,theirprimaryresidence,oranyotherfinancialasset.Theirlargestassetistheirhuman capital.1Humancapitalcanbedefinedas the (present) value of an individual’s future earnings.Justasabondderivesitsvaluefromtheexpectedflowoffutureincome,humancapi-talderivesitsvaluefromtheexpectedflowoffuturelaborincome.Humancapitalistypicallythegreatestduringthefirsthalfofanindividual’scareer. Over time, as income is earned, saved and invested,humancapitaldiminisheswhilefinan-cialassetsgrowasapercentageofnetworth.
Millennials,whohavepursuedmoreeducationalattainmentthananyothergenerationinhistoryandgraduatedintotheworstlabormarketin50years,mightnotfeelwealthyatthisstageintheirlives. But once human capital is incorporated into theirbalancesheets,manyMillennialsareactuallyquitewealthy.Theysimplyneedtimetoextracttheir hard-earned human capital in the form of laborincomeandconvertitintofinancialassets.Longevityplaysanimportantroleinthiscalcula-tion,asMillennialshavegreatercertaintyaroundlongerworkinglifetimesandpost-workretire-mentperiodsthanthegenerationsbeforethem.
Howishumancapitalcalculated?Thevalueofhumancapitaliseffectivelythenetpresentvalueofestimatedfutureearnings.Fromafinancialstandpoint, high-income individuals have more humancapitalthanlow-incomeindividuals,althoughthequantitymattersmoreforinsuranceconsiderations than asset allocation decisions. The percentage of human capital as a portion ofone’soverallbalancesheetisaboutthesameacrossthelifecycleregardlessofincome,assum-ing similar savings rates.
Becausehumancapitalisquantifiedthrougha net present value calculation, future earn-ingsshouldbediscountedatanappropriateratebasedonpotentialriskiness.Acareerwithhighlysecureandpredictableincome(e.g.,ten-uredprofessor,physician)isalmostbond-like,whereasalessstablecareer(e.g.,commissionedsales,actor,investmentbanker)providesincomethatismoreequity-like.
Theimplicationisthatthemorestock-likeaninvestor’s human capital is, the more he or she shouldtrytodiversifyawayfromequitiesintoless correlated investments.2Arelativelysecurejobwithsteadyearningsenablestheindividualtotakemorerisksinhisorherinvestmentport-folio,butlessstableemploymentmightwarrantholding a greater allocation in more conserva-tiveassetsthatcanprovidestableincomewhennecessary.Humancapitalalsomattersfromaninsurance standpoint. Households should hedge riskstotheirlargestassets,andhumancapitalcertainlyqualifiesinthatregard.Inthefollowingtwoarticles,we’lldigintobothoftheseimplica-tionsabitmore.
Millennialsand longevity
LongevitymaynotbeatthefrontofmostMillennials’minds,butisnonethe-less relevant. A longer life implies a longer career and a longer retirement. WeuseahumancapitalframeworktodevelopourviewsonhowMillennialsshouldinvestandhedgetheirbalancesheets.Wealsoprovideadviceonoptimalassetlocationforyoungerinvestors.
Human capital, the hidden assetMatthew Baredes, Strategist

18 September2014Your Wealth & Life
Is human capital different for Millennials?
Stephen Freedman, PhD, CFA
Thereisaninclinationtoestimatethatthehumancapitalofyoungadultsmaybesomewhatmorebond-likethanequity-likeonthebond-equityspectrum.Thisisbecauseundernormalcircumstances,salariesandwagescanbedependedonwithreasonableregularityandunemploymentbenefitshelpbridgethegapincaseofjobloss.However,inthecaseofMillennialsthereareseveralfactorsthatcanmakehumancapitalappearmoreequity-likethanitwasforpriorgenerations.
First,thereisawidelyheldbeliefthatMillennialsaremorelikelytobecomeentrepreneursthanpriorgenera-tions.Asentrepreneurshiptypicallypeaksmid-career,itwilltaketimetotellwhetherthisexpectationiscon-firmed.Ifitis,thiswouldmakethehumancapitalofmanyMillennialsmoreequity-likeastheriskofstartupfailuresisconsiderableand,onceabusinessisestablished,entrepreneurialprofitswillvarywiththebusinesscycletoamuchlargerdegreethansalaries.Second,Millennialsaremorelikelytoswitchemployers.Whileanygivenemployerchangemaybringopportunitiesandcareerupside,frequentswitchesalsobearriskssuchassignalinglowloyaltytofutureemployers.Finally,Millennialstypicallyrankdoing“meaningfulwork”highonthelistofjobattributestheyseek.Thissuggeststhatbeyondsimplechangeswithinthesamesector,theymayalsobemorelikelytocompletelychangecareerpathsatsomepointduringtheiractivelife.This,too,createsrisksandopportunities.
Millennials by the numbersTheMillennialGenerationgenerallyincludesthosewhowerebornfromtheearly1980stotheearly2000s.Wehighlightsomekeyfiguresbelow.
Millennials and longevity
English and ...38% of Millennials are bilingual, up from 22% in 2003.5
Well educated23% have a Bachelor’s degree or higher, making them the most educated generation.4
87%of Millennials consider a company’s commit-ment to social and environmental causes when deciding where to work.2
71%of Millennials at “regu-lar” jobs would prefer to quit their current job to work for themselves (Millennial Branding and oDesk) and 60% of them plan to do so in the next two years.1
26% of Millennials are married, down from 36% of GenXer’s, 48% of Boomers and 65% of the Silent Majority (based on percentage of each generation married at age 18-32).3
Staying single

Your Wealth & LifeSeptember201419
Aswestatedatthebeginningofthispiece,people are living longer. There is a good chance thatlifeexpectancieswillbeevenhigherbythetime Millennials reach middle age. The general increaseinlifeexpectancyhasvariousimplica-tions for saving and investment, as Millennials arelikelytoworklongerandhavealongerretirement than their parents.
So if Millennials are going to retire at an older agethanpreviousgenerations,howshouldtheyinvest?Well,whenwethinkofMillennials’over-allassetallocation,wemustonceagainreturntotheconceptofhumancapital.ThevastmajorityofMillennials’assetsarenon-financial,buttheseassetsstillmustbeconsideredwhenmakinginvestment decisions.
Ifhumancapitalismorebond-likethanstock-like,itimpliesthatMillennialsshouldholdmoreequities in their investment portfolio. This is becausetheirhumancapitalfunctionsasanimplicitbondontheirbalancesheet. (Also, givenyoungerinvestors’lesserliquidityneeds
comparedtoolderinvestors,theyshouldbewill-ingtotoleratemorevolatilityinexchangeforgreaterabsolutereturns.Therefore,theyshouldalreadyhaveasignificantlyhigherallocationinequities,allotherthingsbeingequal.)Infact,whenlookingatMillennials’overallbalancesheets,thepercentageallocationinequitieswillchangedramaticallyovertime.
Figure1assumesthattheinvestoristargetingalevelof60%ofoverallcapital(humanandfinancial)inequities,saving20%ofhissalaryperyear,withasalarythatgrowsatarealrateof2%andusingadiscountrateof3%.Asthechartdemonstrates,investorswillincreasetheirbalancesheetexposureuntilthepointatwhichtheirfinancialassetscanreachtheirtargetedoveralllevelofequityexposure.
Furthermore,thisleadstosituationswherethepercentageoffinancialassetsallocatedinequi-tiescanbeextreme(seeFig.2).Whileitmayseemincrediblyriskyfromafinancialassetper-spective,ifyoubelieveintheconceptofhumancapital,theriskinessoftheportfolioiscounter-balancedbythestabilityofone’shumancapital.
ThegoodnewsforMillennialsisthatalthoughreturnsarelikelytobelowerinthemediumterm,givenlowerinterestratesandfairvalu-ationinequitymarkets,Millennialsareinvest-ingforthenext30+years,andoverthelongerterminvestmentreturnsshouldbemuchbetter.Althougha100%equityportfolioislikelytoovolatile for most investors, equities should form the core of most Millennials’ portfolios.
Human capital and asset allocation
Source: UBS CIO WMR
10
0
30
20
50
40
605550 65
60
70
4540Age
353025
Fig. 1: Implicit equity allocation increases as human capitalis realized
Percentage equity allocation relative to total balance sheet (Human capital+ financial capital)
Matthew Baredes, Strategist
Millennials and longevity
Source: UBS CIO WMR
20
0
60
40
100
80
605550 65
120
4540Age
353025
Fig. 2: Equity allocations should be high for most younginvestors
Percentage equity allocation relative to overall financial capital

20 September2014Your Wealth & Life
As discussed in the previous article, the per-centage concentration of human capital on a balancesheetmattersmorethantheabsolutevaluewhenitcomestoimpactingassetalloca-tiondecisions.Conversely,thevalueofhumancapital is one important consideration for insur-ance planning. Because loss of human capital represents a catastrophic outcome for most householdsbutcannoteasilybetradedordiver-sified,it’simportanttoconsiderwaystohedgethrough insurance.
Thefinancialassetcorollaryisreceivingallofafamily’sincomefromonebondissuedbyonefirm.Itisobviouslyprudenttodiversifythatriskintoothersecuritiesinsuchasituation.Absenttheabilitytodoso,purchasinginsuranceagainstdefaultisthenext-bestoption.
Therearetwokindsofinsurancethatareofparticular importance to Millennials: life insur-anceanddisabilityinsurance.Lifeinsurancehelpsprotectagainstprematuremortalityandthelossoffutureincomeforafamilythatwouldfollowsuchanevent.Givenourpreviousdis-cussionaboutthelargevalueofhumancapitalthatMillennialscurrentlypossess,itisimperativeforanyMillennialwithfinancialdependentstohedgetheirmortalityriskthroughlifeinsurance.Disabilityinsurancecanprovideanimportanthuman capital hedge for non-fatal situations. Givenlongerlifespans,individualswhoareunfortunateenoughtobecomepermanentlydisabledatayoungagearelikelytolivelongerthantheywouldhaveinthepastandthereforearegoingtoneedmoreforlivingexpenses.Inaddition,temporarydisabilityisnotuncommon,withsomeexpertsestimatingthatoneinfourMillennialswillbedisabledforsomeperiodoftimebeforetheyretire.1
Householdsfrequentlyprotecttheirbalancesheetsbyholdinghomeownersinsuranceandautoinsurance.Forthesamereasons,lifeanddisabilityinsurancealsoprotectbalancesheethealthbyhedgingriskstohumancapital.Theseshouldbeviewedasvitalcomponentsofawell-constructedbalancesheet,particularlyforthosewhohaven’tyetaccumulatedenoughfinancialresources to last a lifetime.
Insurance implications of a longer life
Thinking about disability insuranceJay Rabinowitz, Insurance consultant, UBS Wealth Management Americas
Whenlookingtobuydisabilitycoveragethereareseveralchoicestoconsider.Thefirstplacetocheckiswithyouremployer.Mostjobsprovidebothshort-termandlong-termcoverage,typicallyupto60%ofyoursalarybutoftenwithacap.
Ifyouareself-employedordonothavesufficientcoverageatwork,buyingpersonalcoverageisimportant. One important advantage of direct coverageisthatthebenefitwillbereceivedonatax-freebasis.Benefitsunderanemployer-providedplanarealmostalwaystaxable.Thecostofanypolicywillbedrivenprimarilybyyourage,thetypeofworkyoudoandyourincome.Youthenhavetomakedecisionsaboutthefeatures,whichinclude:
• Coveragefortheinabilitytodoyourjob(“ownoccupation”)orcoverageforgeneraldisability.Wehighlyrecommendoptingfor“ownoccupa-tion”coverage.
• Theeliminationperiod–howlongyouneedtobedisabledbeforethebenefitsbegin.Theshorterthewaitingperiod,themoreexpensivetheplanwillbe.Ifyouhavesetasideenoughmoneytocoveryourexpensesforseveralmonths,youcanlowerthepremiumbyelectingalongerelimina-tion period.
• Howlongwillthebenefitbepaid?Plansoffercoverageforasetperiodofyearsoruntil65.Werecommendensuringyouhaveenoughcoveragetofillwhatevergapdisabilitywouldleaveinyourfinancialplan.
• Increasesincoverage–thisfeatureallowsyoutoautomaticallyincreasethebenefitwithoutgoingthroughunderwritingagain.Thisisveryimpor-tantforMillennialswhoseincomeisexpectedtoincrease over time.
Millennials and longevity
Matthew Baredes, Strategist

Your Wealth & LifeSeptember201421
Assetlocation(i.e.,thedistributionofassetswithindifferentaccounttypes)isanimportantbutoftenovelookedaspectofassetaccumula-tion.Iwouldimaginemanyinvestorsworkdili-gentlytodeterminetheirfinancialgoals,figureouttheirrisktolerance,buildtheirassetalloca-tionandwatchtheirassetsgrow,withoutreal-izingthemonetarybenefitsofoptimallylocatingassets.Increasinglifespanandlowerexpectedreturns across asset classes heighten the impor-tanceofincreasedportfoliolongevity.
Becauseitcanbedifficulttoshiftassetsbetweenaccounttypes(e.g.,taxabletonon-taxable),optimizingassetlocationismostimportantforthoseinthewealthaccumulationphase.Asinvestorsaccumulatewealthanddistributeassetsbetweentheir401(k),taxableaccountandtheirRothIRA,theyshouldfocusonfillingtheirtax-shelteredaccount(s)withthemosttax
inefficientassetsfirst,andthenaccumulatingmoretaxefficientassetsintheirtaxableaccount.
Forinstance,sincecouponpaymentsaretaxedatordinaryincometaxrates,taxablefixedincomeisbestheldintax-deferredaccounts,wherecouponpaymentscanbereinvestedandcompoundedtax-free.Thesamethingholdsforothertax-inefficientequities,suchasREITs,activelymanagedequityfundswithhighturn-overratesandcapitalgainsdistributions,andlong/short managed funds.
Ontheotherhand,tax-efficientequityholdings,suchasindexfundsorexchange-tradedfunds(ETFs),shouldbeplacedintaxableaccountsbecausecapitalgainsdistributionsareminimalandtheseassetstypicallyexhibitlowturnover.Allowingcapitalgainstogrowtax-freeforaslongaspossibleinthoseaccountsisoptimal.
Fig.1showsthefuturevalueofeachassetclassbasedonaUSD35,000initialinvestmentinanIRAandUSD21,000investmentinataxableaccount(equivalentpre-taxincome).ReturnsarebasedonUBSCapitalMarketAssumptionsandtheIRAisassumedtobefullywithdrawnandtaxedat40%after20years.Thebarchartdemonstrates the future value of each asset, dependingonplacementinataxableortax-deferred account, and helps paint the picture ofwhichassetsshouldbeatoppriorityinyourtax-deferredaccount.Forexample,byholding
Locating assets during wealth accumulation
* Assumptions: Contributing $1 into an IRA is equivalent to $0.60 in a taxable account. Income tax rate is 40%. Dividends and long-term capital gains tax rate is 23.8%.20 years of static returns, based on CMAsSource: UBS CIO WMR Portfolio & Planning Research
Taxable Account
IRA aer taxes (40%) Accumulated taxes
200,000
150,000
100,000
50,000
0
250,000
Passive USLarge Cap Equity
Fig. 1: Future value of asset classes based on location*
Tax-inefficient assets forfeit highest percentage of growth in taxable accounts, in USD
Passive USSmall Cap Equity
Passive EMEquity
Active Int’lDeveloped Equity
Active USLarge Cap Equity
Active EMEquity
IGCorporates
HYCorporates
Millennials and longevity
Jon Rather, Strategist

22 September2014Your Wealth & Life
high-yieldcorporatesinataxableaccount,weestimatethataninvestorisforfeiting51%oftheasset’sfuturevalue,onaverage,after20years.Fixedincomeandactiveequitymanag-ersdisplaythebiggestdifferenceinfuturevaluebasedonlocation,andshouldbeatoppriorityinatax-shelteredaccount.Figure2summarizestheoptimallocationforanumberofdifferentasset classes.
Awordofcaution:Eachinvestor’sfinancialsitu-ationisdifferent,andthereisnoone-size-fits-allanswertothequestionofoptimalassetlocation.Liquidityneeds,taxbrackets,timehorizon,assetallocation,rebalancingpreferences,sequenceofreturns,andrelativesizeofaccountsareall factors that can disrupt these guidelines. Nevertheless,theseillustrationsshouldmakeclearthatefficientassetlocationisavitalcom-ponent,alongwithassetallocation,ofinvest-ment planning.
Fig. 2: Where to locate assets
Taxable Account 401(k) Roth IRA
Municipal bonds High yield bonds Small-cap active managers
Index funds Investment grade bonds Emerging markets active managers
ETFs Government fixed income
Tax-managed mutual funds REITs
Low dividend yielding equities Actively managed equities
Long/short hedge funds
Source: UBS CIO WMR Portfolio & Planning Research
Millennials and longevity

The most common reason for creating trusts istohelppreservewealthfortheuseoffuturegenerations.Familieswanttaxefficiencyandcreditorprotectionwithaminimumofadminis-trative friction.
Evenforfamilieswithverycleargoals,extendedlongevitycomplicateswealthtransfer.Withbeneficiariesfrequentlylivingintotheir90sandbeyond,balancingtheneedsofoverlappinggenerationsisagrowingchallengeandtheideathatanyonealivetodaycouldwriteanoptimalset of rules for the operation of a trust over the next100yearsbordersonhubris.Asaresult,well-draftedtrustsincreasinglymustprovidemultiple mechanisms to give future generations ofbeneficiaries,fiduciaries,andtheiradvisorstheflexibilityneededtoadapttochangesinthelaw,family,andsociety.
Beforediscussingspecificmechanismsthatcanbeincludedintrusts,it’sworthtakingamomenttothinkaboutsomeofthechallengesatrustmayfaceovertime.Forexample,ben-eficiarieschange.Today,abenefactormightsee
grandchildren and great-grandchildren reach adulthoodduringtheirlifetimes.Beneficiariesalsomove.Theymaymovetootherstates,buttheycanalsomovetocountriesthatdonotrec-ognizethelegalconceptofatrust.Furthermore,wecanbesurethetaxrulesgoverningtrustswillchange,althoughpredictingexactlywhatthosechangeswillbeisimpossible.And,ofcourse,whilewehopeforthebest,it’sreasonabletoexpectsomefuturedescendantwillhaveadis-ability(whetherphysical,mentalorotherwise)thatmakesitinappropriatetograntthempow-ersandresponsibilitiesthatotherdescendantscaneasilyhandle.
Withallthatsaid,thefollowingisasampleofcommontrustprovisionsthatcreateflexibility,sotrustscreatedtodaycanadaptandcontinuetoserveafamilywellfordecadestocome.
1. Absolute Discretion Distribution Standard: The mostflexibleofdistributionstandards,thisallowsatrusteecompletefreedominmakingdistributions.Thetrusteecanpayoutevery-thing(ifthelawchangesandthetrustisnolongerefficient)ornothing(ifachildissuc-cessfulandhasnoneedfortrustdistributions)withoutfearabeneficiaryorcreditorwillchal-lenge the decision.
2. Lifetime Power of Appointment:Allowsonetrustbeneficiary(usuallytheoldestgeneration)todirecttrustpropertytootherindividualsortocharity(eitheroutrightorinfurthertrust).
Wealth transfer and legacy
Oneimpactofenhancedlongevityisthatmultiplegenerationswillincreas-inglyoverlap.Thishasanimpactontheeffectivenessofcertainwealthtransferandcharitablegivingstrategies.Theannualgifttaxexclusion,forinstance,becomesverypowerfuloverlongtimehorizons,whereasrigidtrustarrangementsmayprecludefamiliesfromachievingtheirgoals.
Trusts: focus on flexibilityStephen Liss, Senior Wealth Strategist, UBS Advanced Planning Group
Your Wealth & LifeSeptember201423

3. Testamentary Power of Appointment: When theprimarybeneficiaryofatrustdiesheorshecanexercisethispowerbywilltodirecttrustpropertytootherbeneficiariesortochar-ity(eitheroutrightorinfurthertrust).Decadesfromnow,thispowercanbeusedbyachildtocustomizefurthertrustsforgrandchildrenbasedoninformationwesimplydonothavetoday.
4. Power to Remove and Replace Trustees: Createsa“checkandbalance”byallowingsomeonetochangethetrustee.Thispowercouldbelongtotheprimarybeneficiary,amajorityofbeneficiaries,afamilyfriendoranyother person the donor selects.
5.Power to Amend Trust Administrative Provisions: These are the provisions controlling thingsliketheinvestmentoftrustassets,thecalculation of income, and accountings (of the use of trust funds).
6.Power to Distribute in Further Trust:Allowsthetrustee to transfer assets to another trust and
24 September2014Your Wealth & Life
Wealth transfer and legacy
therebymateriallychangethetermsofthetrust.
7. Power to Change the Governing Law of the Trust:Enablesthetrusteetochangethegov-erninglawtoamorefavorablejurisdictionatafuture time.
Youwillnoticethatsomeoftheseprovisionsgrantadditionalpowerstothetrustees,whileotherscanbeexercisedbythebeneficiariesthemselves.Checksandbalancescanbecre-atedinmanyotherways,forexamplebyimpos-ingagerestrictions,requiringmajorityaction,or mandating that someone consent to certain decisionsbeforetheybecomelegallyeffective.Trustscanbecustomizedtomeettheneedsofanyfamilyandtheabovelistisnotintendedtobeexhaustive.Itshould,however,giveasenseofthevarietyofoptionsthatexisttobuildflexibilityintotrustsandensurethatthebenefactor’smainobjectivesaremetwellintothefuture.
Stephen Liss is a member of UBS Advanced Planning Group and is not a part of CIO Wealth Management Research (CIO WMR). CIO WMR may have views that differ or are contrary to the views expressed herein.

Acommongoalofmanyfamiliesistotransferwealthtothenextgenerationandbeyondinatax-efficientmanner.Theobjectivemaybetopayforcollegeformultiplegenerations,tohelpchildrenmakeadownpaymentonahome,tocreateafamilybanktohelpfuturegenerationsstartanewbusinessorotherentrepreneurialendeavor,orsimplytotransferwealthintacttothechildren.Thedesiretotransferwealthcanbeimpairedbythefederalestateandgifttaxsystem.Underfederalrules,anindividualmaytransferuptoUSD5.34millionduringhisorherlifeorupondeathtax-free(thisamountisindexedtoinflation).Anycumulativetransfersabovethethresholdaresubjecttogiftorestatetaxatarateof40%.Inaddition,manystateshaveestateandinheritancetaxesaswell,whichcompoundstheproblem.
Theestateandgifttaxmaysignificantlyimpairyourwealthtransfergoals.Oneofthesim-plestwaystotransferwealthtoyourchildrenorotherfamilymembersduringyourlifetimeandminimizethetaxcostisthroughtheuseofthegifttaxannualexclusion.Eachyear,anindividualmaygiftUSD14,000toasmanypeopleasthedonorwishesfreeofthegifttax.Thisamountisreferredtoasthegifttaxannualexclusion,andisanannual“freebie”thatmustbeusedinthecalendaryearorthebenefitislost.GiftsundertheannualexclusiondonotcountagainsttheUSD5.34milliongiftandestatetaxexemptionamount.
Thereareawidevarietyofstructuresthatyoucanemploytomakeannualexclusiongifts.Forgiftstoadults,youcansimplygiftcashorassetsdirectlytoanindividual.Forgiftstominors,youcangiftassetstothebeneficiaryinacustodial
account under the Uniform Transfers to Minors ActorUniformGifttoMinorsAct.Whilethesearesimpleandeasytoimplement,theminorbeneficiaryofacustodialaccountwillhavecon-troloverthegiftedassetsatage18or21(and,inlimitedcircumstances,25),dependingonthestatelawgoverningtheaccount.Manyclientsdon’tlikethisrule.Todelaythetimebywhichyourbeneficiaryobtainscontroloverthegiftedasset,youcanchooseinsteadtomakeagiftintrustforyourintendedbeneficiary.Withincertainlimits,atrustallowsyoutosettherulesunderwhichyourbeneficiarywillreceiveeco-nomicbenefitoforcontrolovertheassets.Giftsintrustcanbestructuredtoqualifyforthegifttaxannualexclusion.
Averypopularmethodofmakingannualexclu-siongiftsisviaa529collegesavingsplan.Contributionstoa529plancanbeinvestedin plan-approved mutual funds (including age-
weightedallocationfunds)togrowonatax-freebasisforfutureusebythebeneficiaryforquali-fiedhighereducationexpenses.Giftsto529plansareallowedauniquebenefit–fiveyearsofgiftsmaybemadeinalumpsum,butforannualexclusionpurposesthegiftisproratedoverthefive-yearperiod,therebytakingadvantageoftheannualgifttaxexclusionforeachyear.Totakeadvantageofthisfront-loadingbenefit,youmustfileagifttaxreturnelectingtospreadthegiftoverfiveyears.
Longevitycangreatlybenefitaplanofmakingannualexclusiongifts.Theearlieryoubeginaprogram of annual giving and the longer the giftingprogramcontinues,themoreyoucanmoveoutofyourestatecompletelyfreeofthegiftandestatetax.Thefollowingchartshowsthesimulatedgrowthofmaximumannualexclu-siongifts(USD14,000eachin2014,increasingwithinflationovertime)fromtwoparentstoatrustforthebenefitofonechildeveryyearfor30years,assumingtheassetsareinvestedinamoderate portfolio. Based on these assumptions,
Longevity and the annual gift tax exclusion
Wealth transfer and legacy
Erin Wilms, Co-Head, UBS Advanced Planning Group
Your Wealth & LifeSeptember201425
The earlier you begin a program of annual giving and the longer the gifting program continues, the more you can move out of your estate completely free of the gift and estate tax.

thetrustwouldgrowtoamedianvalueofUSD3.2millionbytheendofthe30-yearperiod(seeFig.1).Ifinsteadtheparentshadnotembarkedonagiftingplan,thoseassetswouldbesubjecttoestatetaxintheirestates,potentiallysubjecttoa40%taxofoverUSD2million.TheannualexclusiongiftingprogramcouldavoidthatUSD2millionineventualestatetaxforthefamilythroughconsistent,ongoinggifting.
Annualexclusiongifts,asthenamesuggests,canbemadeeachyear;however,ifyoudon’ttakeadvantageoftheexclusioninanygivenyear,theopportunityforthatyearislostforever.YourgiftsmustbecompletebyDecember31ofeachyear.Ifyourgoalistotransferalargeamountofwealthoutofyourestatetoyourchil-drenorotherbeneficiariesduringyourlifetime,itisbesttostartyourgiftingprogramsoonerratherthanlater.Beforemakinganygifts,con-sultyourtax,legalandfinancialadvisorstodis-cusswhatgiftingstrategiesandassetsmaybemostappropriateforyou.
Source: CIO WMRA
25th%ile5th%ile
75th%ile50th%ile 95th%ile
5
4
3
2
1
0
6
302826242220181614121086420
Fig 1. Annual exclusion gi results in significant wealth transfer
Simulated growth over 30 years, assumes annual contribution, in million USD
Wealth transfer and legacy
26 September2014Your Wealth & Life
Erin Wilms is a member of UBS Advanced Planning Group and is not a part of CIO Wealth Management Research (CIO WMR). CIO WMR may have views that differ or are contrary to the views expressed herein.

America is good at giving. In 2013, Americans gaveaworld-leadingUSD335billiontocharity.1 The traditional concept of leaving a portion of yournetworthtocharitywhenyoupassawayisfamiliar to most Americans.
Unfortunately,sincewe’renowlivinglonger,ourcharitableimpact–withoutplanning–isdecreasing.Ifyoulive20yearslongerthanexpected,thecharityincludedinyourwillortrustwillhavetowaitthatsame20yearsforyourgift.Inaddition,about60,000UScharitiescloseeachyear,sowithoutyourgift,yourtargetcharitymaynotevenexist,ortheirmissioncouldchangebythetimeyoupass.2
Sohowdoyouavoidoutlivingyourphilan-thropiclegacy?Herearethreewaystogivewhileyoulive:
1. Start early and start nowGivingattheendofyourlifeisaneasywaytoensurethatsomeofyourassetsareeventuallygiventocharity.However,sincethecharitywillnotseeadimeuntilyoupassaway,considerusingthefollowingoptionstohaveanimpacttoday:
Donor-advised funds–Agivingvehiclethatallowsyoutomakeanirrevocablecontributionofassets,receiveataxdeduction,andgivetovariouscharitiesovertimeastheassetsgrowtax-free.
Private foundations–Agivingvehiclethatoffersyoumaximumcontrolandflexibilityoverphilan-thropic giving and assets.
2. Involve your familyInvolvingyourfamilyinyourphilanthropicgoalsisessentialtomaximizingyourimpactlongafteryou’vepassed.
Spouse/partner–Yourspouseorpartnermightinherityourwealthbeforeyourchildrendo,andlikelyviewsgivingdifferentlythanyoudo.Women-ledhouseholdstendtogivetwiceasmuch as male-led households.3Involvingyourspousecanalignyourintereststocreatealastingphilanthropiclegacy.
Children/grandchildren–Involvingchildreninyourgivingcanjump-startyourimpactwhileyoulive.Regardingphilanthropy,89%ofNextGensareinfluencedbytheirparents,and75%ofHNW investors under 40 cite social impact as extremely/veryimportant.4NextGenfamilymem-berscanbecomeactiveleadersoffamilydonor-advised funds and private foundations, and their involvementisanexcellentwaytobringfamiliestogether to create a lasting impact.
3. Use strategic philanthropyManyindividualsgiveassetstocharitywithouttrackingtheresults.This“sprayandpray”model–whiletraditional–canbeapoormatchwithlongevityifthecharityrunsthroughitsassetsandasksforadonationagainthenextyearwithoutmakingameasurabledifference.
Today,applyingsimpleconceptsofsustainabilityandmeasurabilitytoyourphilanthropicdeci-sionscansignificantlyincreaseyourimpact.Forexample,usingGuideStarandothertrackingsourcescanhelpyouunderstandwhereyourdollarsgoandhowtheyareusedtowardyourgoals.Maximizetheimpactofyourdonationsbyfocusingonthesocialreturnofeachdollaryoudonate,andconcentrateyourfinancialsupportonorganizationsthatwillstillbearoundlongafteryouare.
4. Surround an issueWhile donations are important, there are other waysyoucangivetomaximizeyourimpact.
Investing–Therearenumeroussociallyrespon-sibleinvestmentvehiclesandimpactinvesting
Your Wealth & Life August 2014 27
Giving while living
Wealth transfer and legacy
Zach Graumann, Philanthropy Strategist, UBS Client Philanthropy Services Team; Bill Sutton, Head of UBS Client Philanthropy Services Team
If you live 20 years longer than expected, the charity included in your will or trust will have to wait that same 20 years for your gift.

optionstobringfor-profitdollarstocausesyou’repassionateabout.
Lending–Certainfor-profitandnon-profitorga-nizationscanlendmoneytocompaniesandindi-vidualstosupportyourcausefromtheothersideofthebalancesheet.
Buying–Companieswithasocialmission,suchasFEED,LibertyUnited,TOMSShoesorWarbyParker,makeagifttocharityeachtimeyoupur-chase their products.
Fundraising and networking–Youcanopenyournetworktofundraisers,thoughtleadersandinnovatorsinthearenaswhereyougive.
Time and talent–Non-profitscanbestarvedfortalentedindividuals,andyourtimeandinsightsmaybethegreatestassetsyoucangive.
Giving while livingOneofthebestreasonstogivewhileyouliveistoenjoythedifferenceyouaremakingnowwhileinvolvingfamilyandfriendsinyourphilanthropy.
28 September2014Your Wealth & Life
Wealth transfer and legacy
Zach Graumann and Bill Sutton are members of UBS Client Philanthropy Services and are not a part of CIO Wealth Management Research (CIO WMR). CIO WMR may have views that differ or are contrary to the views expressed herein.

Matthew BaredesisaStrategistwithintheCIOPortfolio& Planning Research group in CIO Wealth Management Research. He focuses on advice related to investment strat-egy,portfolioconstruction,behavioralinvestingandfinancialplanning.
Joseph F. Coughlin, PhD is Director of the Massachusetts InstituteofTechnologyAgeLab.Hisresearchexamineshowthedisruptivedemographicsofanagingsociety,socialtrendsandtechnologywillshapefutureinnovationsinbusinessandgovernment.Coughlinteachespolicyandsystemsinnova-tioninMIT’sEngineeringSystemsDivisionandhaspublishednearly100peer-reviewedpublicationsandreports.
Michael Crook isanExecutiveDirectorandHeadofPortfolioandPlanninginCIOWealthManagementResearch,wherehe advises investors on asset allocation, portfolio construc-tion,andfinancialplanning.Heistheauthorofnumerousacademicandprofessionalarticlesincludingpublicationsinthe Journal of Wealth Management, the Journal of Investing, andtheJournalofIndexInvestingandisaformeradjunctprofessorofeconomicsatMarymountManhattanCollege.He’salsoareviewerfortheJournalofInvestingandtheJournalofIndexInvesting.
Zach GraumannisaPhilanthropyStrategistontheUBSClientPhilanthropyServicesteam,specializinginNextGeneration giving. He is also the founder and CEO of SuitUp, anon-profitthathelpscompaniesruncommunityserviceeventsinschoolsthroughoutNewYorkCity.
Larry Hatheway, PhD, is Chief Economist at the UBS InvestmentBank.HeisamemberoftheSecuritiesResearchExecutiveCommitteeoftheUBSInvestmentBankandalsoservesasamemberoftheGlobalInvestmentCommittee(UBS Wealth Management).
Stephen Liss is a Senior Wealth Strategist in the Advanced PlanningGroup.HehelpseducateUBSclientsontax,estateplanning,philanthropyandlifeinsurance.
David McWilliams is the Head of Wealth Management Transformation at UBS. Wealth Management Transformation isaneworganizationthathelpsFinancialAdvisors,throughteaming,training,planning,increasingproductivityanddeliv-eringholisticwealthmanagement.
About the authors
Your Wealth & LifeSeptember201429
Ramin Nakisa, PhD,isDeputyHeadoftheGlobalAssetAllocationteam,partofMacroStrategyResearchintheUBSInvestmentBank.
Brian Nick is a Senior Strategist in the Portfolio & Planning Research group in CIO Wealth Management Research. He providesadvicetoinvestorsregardingmarketdevelopments,portfolio construction, and short- and long-term asset alloca-tion.BrianalsoservesasliaisonbetweenCIOWMRandtheUBS Private Wealth Management division.
Mike Oleszkowicz CFP, CRPC is a Wealth Management RetirementConsultantwhohelpsUBSfinancialadvisorsandclientsrecognizetherisksonemayfaceinretirementandidentifysolutionsthatmayhelpmitigatethoserisksthroughafinancialplanningprocess.
Jay RabinowitzisanInternalInsuranceConsultantwhoworkswithUBSfinancialadvisorsindeveloping,presentingandimplementinginsurance-basedsolutionstoourclients.
Jon RatherisaStrategistwithintheCIOPortfolio&PlanningResearch group in CIO Wealth Management Research. He focusesonadvicerelatedtoinvestmentstrategy,portfolioconstruction,andfinancialplanning.
Bill Sutton, Jr.isHeadofUBSClientPhilanthropyServices,providingsubjectmatterexpertise,adviceandsolutionsthatenableUBSclients’wealthtoreflecttheirvaluesthroughgiv-ing,investing,andcommunityservice.
Erin Wilms is the Co-Head of the Advanced Planning Group. SheleadsateamthathelpseducateUBSclientsontax,estateplanning,philanthropyandlifeinsurance.

30 September2014Your Wealth & Life
EndnotesIntroduction: Planning for longevity certainty 1http://www.ssa.gov/OACT/NOTES/as120/LifeTables_
Tbl_7_1900.html 2https://www.soa.org/News-and-Publications/
Newsroom/Press-Releases/2012-07-30-retirees-under.aspx
3HumanMortalityDatabase.UniversityofCalifornia,Berkeley(USA),andMaxPlanckInstituteforDemographicResearch(Germany).Availableatwww.mortality.orgorwww.humanmortality.de(datadown-loaded on 7/30/2014).
4VanDerhei,J.“WhyDoesRetirementReadinessVary:ResultsfromEBRI’s2014RetirementSecurityProjectionModel.”TheJournalofRetirement,Vol.1,No.4(2014),pp.95-117.
5UBSInvestorWatch,“Beginbeforetheend,”Q32014
Introduction: Infographic 1UBSInvestorWatch:80isthenew60,4Q2013 2FederalInteragencyForumonAging-relatedStatistics,
“OlderAmericans2012:KeyIndicationsofWell-being,”June2012
3FactSheet:Cancer,NationalInstitutesofHealth,October2010
Safe spending rates, updated 1UBSInvestorWatch:80isthenew60,Q42013
Personal pensions 1NationalInstituteonRetirementSecurity
Demographics and asset returns 1 The proportion of the population in the range of 40
to64yearsoverthatofthepopulationabovetheageof 20.
2“BoomerRetirement:HeadwindsforUSEquityMarkets,”LiuandSpiegel,FRBSFEconomicLetter(2011)
Human capital, the hidden asset 1SeeMilevsky,Moshe.AreYouaStockoraBond?
2012,FTPress. 2SeeJagannathan,Ravietal.“WhyShouldOlderPeople
InvestLessinStocksthanYoungerPeople?”1996,MinneapolisFed
Millienials by the numbers 1Millennials&theFutureofWork.MillennialBranding
andoDesk,2013. 22010ConeCauseEvolutionStudy,ConeLLC 3TheDeclineofMarriageandRiseofNewFamilies,Pew
Research Center, 2010 4,5Millennials:BreakingtheMyths.Nielsen,2014
Insurance implications of a longer life 1USSocialSecurityAdministrationfactsheet,February
7, 2013.
Giving while living 1GivingUSA2014:TheAnnualReportonPhilanthropy
fortheYear2013(includesindividuals,privatefounda-tionsandbequests)
2http://philanthropy.com/blogs/giveandtake/have-100000-nonprofit-groups-failed-in-the-recession/25952
3http://www.tbf.org/tbf/14/women-in-philanthropy 4“#NextGenDonors:RespectingLegacy,Revolutionizing
Philanthropy,”21/64&JohnsonCenterforPhilanthropy,2013
4 CapGemini World Wealth Repo

Your Wealth & LifeSeptember201431
Publication details
PublisherUBSFinancialServicesInc.
Wealth Management Research
1285AvenueoftheAmericas,20thFloor
NewYork,NY10019
Thisreportwaspublished
on4September2014.
Editor in chiefMichaelCrook
Authors (inalphabeticalorder)MatthewBaredesJosephF.CoughlinMichaelCrookStephenFreedmanZach GraumannLarryHathewayStephen LissDavid McWilliamsRaminNakisaBrianNickMichaelOleszkowiczJayRabinowitzJon RatherBill Sutton, Jr.Erin Wilms
EditorCLS Communication, Inc.
Project Management Paul Leeming
Desktop PublishingGeorgeStilabowerCognizantGroup–BasavarajGudihal, SrinivasAddugula,PavanMekala
and Virender Negi
ThisreporthasbeenpreparedbyUBSFinancial
ServicesInc.(“UBSFS”).

Chief Investment Office (CIO) Wealth Management (WM) Research ispublishedbyUBSWealthManagement andUBSWealthManagementAmericas,BusinessDivisionsofUBSAG(UBS)oranaffiliatethereof.CIOWM Research reports published outside the US are branded as ChiefInvestmentOfficeWM.IncertaincountriesUBSAGisreferredtoasUBSSA.Thispublicationisforyour informationonlyandisnot intendedasan offer, or a solicitation of an offer, to buy or sell any investment orotherspecificproduct.Theanalysiscontainedhereindoesnotconstituteapersonalrecommendationortakeintoaccounttheparticularinvestmentobjectives, investment strategies, financial situation and needs ofany specific recipient. It is based on numerous assumptions. Differentassumptionscouldresultinmateriallydifferentresults.Werecommendthatyouobtainfinancialand/ortaxadviceastotheimplications(includingtax)ofinvestinginthemannerdescribedorinanyoftheproductsmentionedherein.Certainservicesandproductsaresubjecttolegalrestrictionsandcannotbeofferedworldwideonanunrestrictedbasisand/ormaynotbeeligible for sale toall investors.All informationandopinionsexpressedinthisdocumentwereobtainedfromsourcesbelievedtobereliableandingood faith,butno representationorwarranty,expressor implied, ismadeastoitsaccuracyorcompleteness(otherthandisclosuresrelatingtoUBSanditsaffiliates).Allinformationandopinionsaswellasanypricesindicatedarecurrentonlyasofthedateofthisreport,andaresubjectto changewithout notice.Opinions expressed hereinmay differ or becontrarytothoseexpressedbyotherbusinessareasordivisionsofUBSas a result of using different assumptions and/or criteria.At any time,investment decisions (includingwhether to buy, sell or hold securities)madebyUBSAG,itsaffiliates,subsidiariesandemployeesmaydifferfromor be contrary to theopinions expressed inUBS researchpublications.Someinvestmentsmaynotbereadilyrealizablesincethemarketinthesecuritiesisilliquidandthereforevaluingtheinvestmentandidentifyingtherisktowhichyouareexposedmaybedifficulttoquantify.UBSrelieson informationbarrierstocontroltheflowof informationcontained inoneormoreareaswithinUBS,intootherareas,units,divisionsoraffiliatesofUBS.Futuresandoptionstradingisconsideredrisky.Pastperformanceof an investment is no guarantee for its future performance. Some investmentsmaybe subject to sudden and large falls in value andonrealizationyoumayreceivebacklessthanyouinvestedormayberequiredtopaymore.ChangesinFXratesmayhaveanadverseeffectontheprice,valueorincomeofaninvestment.Thisreportisfordistributiononlyundersuchcircumstancesasmaybepermittedbyapplicablelaw.
DistributedtoUSpersonsbyUBSFinancialServicesInc.,asubsidiaryofUBSAG.UBSSecuritiesLLCisasubsidiaryofUBSAGandanaffiliateofUBSFinancialServicesInc.UBSFinancialServicesInc.acceptsresponsibilityforthecontentofareportpreparedbyanon-USaffiliatewhenitdistributesreports toUSpersons.All transactionsbyaUSperson in thesecuritiesmentioned in this report should be effected through a US-registeredbrokerdealeraffiliatedwithUBS,andnotthroughanon-USaffiliate.ThecontentsofthisreporthavenotbeenandwillnotbeapprovedbyanysecuritiesorinvestmentauthorityintheUnitedStatesorelsewhere.
UBS specifically prohibits the redistribution or reproduction of thismaterialinwholeorinpartwithoutthepriorwrittenpermissionofUBSandUBSacceptsnoliabilitywhatsoeverfortheactionsofthirdpartiesinthis respect.
VersionasperMay2014.
©UBS 2014. The key symbol andUBS are among the registered andunregisteredtrademarksofUBS.Allrightsreserved.
Disclaimer
ab