your wealth & life - our financial services around … · no topic is better suited for the...
TRANSCRIPT

UBS CIO Wealth Management Research
Your Wealth & LifePersonal strategies for wealth management
Goals-basedwealth managementLiquidity, longevity, and legacy

ContentsGoals-based wealth management
01 Editorial
02 Introduction: Goals-based wealth management
06 Step 1: Develop your goals
07 Step 2: Create a holistic balance sheet
08 Step 3: Track progress
09 Step 4: Embrace a liquidity bucket
12 Interview: David McWilliams speaks with Dr. Richard Thaler
14 Behavioral advantages of bucketing
15 Case studies
23 Disclaimer
This report has been prepared by UBS Financial Services Inc. (“UBS FS”).Please see important disclaimers and disclosures on page 23.

Our discussion of lifecycle investing continues this quarter with an examination of goals-based investing. And perhaps no topic is better suited for the pages of Your Wealth & Life than a strategy that enables you to successfully align your wealth with your life.
Institutional investors have been successfully using goals-based investing for decades. In our view, it’s now time for households to put the same principles to work. We believe individual investors can learn from both pensions and endowments and more successfully align their investment portfolios with their financial plans.
In this spirit, the pages that follow offer an intuitive and integrated goals-based investing approach – including liquidity, longevity, and legacy bucketing and other con-cepts that we believe investors can use to avoid many of the behavioral pitfalls that have made modern portfolio theory difficult to implement.
In short, we hope to encourage you to define worthy goals – and to keep your eyes on them.
Dear reader,
Michael Crook, CAIA
Mike Ryan, CFA
Mike Ryan, CFAChief Investment Strategist, WMARegional CIO, Wealth Management US
Michael Crook, CAIAHead of Portfolio & Planning ResearchCIO, Wealth Management US
2 February 2015 Your Wealth & Life
Michael Crook, CAIA, Head of Portfolio & Planning Research
How did we get here?In 1952, Harry Markowitz published “Portfolio Selection” in The Journal of Finance. It was the first article to present the concepts that are now known as modern portfolio theory (MPT). The premise of MPT – that portfolio optimization is a function of the average return and variance (i.e., risk) of the portfolio – is well understood by investors today. The main insight of MPT is that by estimating risk and return characteristics for the investments in their portfolio, as well as the correlations between assets, investors can maxi-mize return for a given level of risk, or minimize risk for a targeted level of return (i.e., mean-vari-ance optimization).
In addition to providing the first quantitative framework for allocating a portfolio, MPT pro-vided two important insights for investors. The first – that investment decisions should be made in the context of all other assets that are held in a portfolio – is perhaps an aspect of investment
selection that remains underappreciated by many investors. The second insight – that inves-tors can reduce overall risk by diversifying their holdings – has been more widely accepted.
Of course, investors have long known that they should diversify their holdings. In the fourth century, Rabbi Isaac Bar Aha proposed that one should have “a third in land, a third in merchan-dise, and a third ready at hand.1” Markowitz added quantitative support and precision 1,600 years after the rabbi’s fundamental insight.
MPT has the added benefit of actually work-ing in practice – at least over long horizons and in hindsight. Fig. 1 illustrates the risk and return characteristics of seven asset classes between 1926 and 2014. The green line is the efficient frontier over the same period – the set of efficient portfolios that would have maxi-mized return for a given level of risk. Because the efficient frontier resides above all of the
The last two decades have produced a wealth of data indicating that investors fail on two levels: their buy/sell decisions detract value, on average, and they don’t invest in a way that maximizes their likelihood of reaching their primary goals. These failures might be due to behavioral biases that make it difficult to stick with modern portfolio theory or flaws in the framework itself, but for whatever reason the traditional approach to investing simply hasn’t worked. We believe goals-based wealth management is the solution.
Introduction
Goals-based wealth managementLiquidity, longevity, and legacy

Your Wealth & Life February 2015 3
individual asset classes (with the exception of the extremes), diversifying among assets would have added to portfolio efficiency.
But there’s a big difference between show-ing a hypothetical backward-looking efficient frontier and forecasting it ahead of time. An optimal portfolio between 1926 and 2014 was comprised mainly of long-term corporate bonds and small-cap equities – could anyone have pre-dicted that in December 1925? In fact, recent research indicates that a simple equal-weighted approach (like Rabbi Aha suggested) outper-forms as frequently as much more sophisticated MPT-based approaches.2 It turns out that the narrow focus on “optimizing portfolios” has mostly been a red herring.
Goals-based wealth managementWe believe individual investors and house-holds can also improve outcomes significantly by adopting aspects of liability-driven investing (LDI).3 Consider the case of pension plans as a counterexample to the mean-variance frame-work to which most individual investors aspire. Pension plans are certainly interested in invest-ing efficiently, but using volatility as the main measure of risk would miss the point. Pension plans are obligated to meet a series of future payments to their beneficiaries. That means that risk, for a pension plan, must be defined as the chance of not having assets or cash flow to meet those payments.
Of course, an appropriate plan to meet those liabilities might involve accepting a lot or a little investment volatility based on the timing of the cash flows, funding levels, and other consider-ations – but the investment decision is driven by the goal of maximizing the likelihood of meet-ing future liabilities and obligations based on all
of the relevant inputs. Over time, the success of a pension plan’s investment program is mea-sured based on whether or not the probability of meeting its objectives has increased and is on target. An example of this is provided in Fig. 2, where the brown line is the realized probability of success and the blue line is the target prob-ability of success that the pension is seeking. Pension plans refer to this framework for invest-ing as “liability-driven investing.” Readers might also see funding ratios utilized to measure prog-ress for pensions. It measures essentially the same thing as probability of success.
The intuitiveness and success of LDI has been proven in the institutional world over the last decade. Similarly, most households have future
Fig. 1: Long-term efficient frontier
Source: Morningstar, UBS CIO WMR, as of 31 December 2014
Higher return has been commensurate with higher risk over long horizons
0
14
12
10
8
6
4 Cash
S&P 500
LT Gov’t FI
HY FI
US Small Cap
Equal weightportfolio
2
16
18
Real
ized
ann
ual r
etur
n, in
%
Realized volatility, in %
302520151050 35
IT Gov’t FILT Corp FI
Source: UBS CIO WMR, as of 26 January 2015
Actual probability of success
Target probability of success
Years until cash flow due
80
60
40
20
Realized returns belowtarget: save more orincrease risk
Realized returns exceedassumption: save less orreduce risk
0
100
Proa
bilit
y of
Suc
cess
, in
%
123456789101112131415161718 0
Fig. 2: Probability of success puts performance in context
Updated probability of success compared to target
The investment decision is driven by
the goal of maximizing the likelihood of
meeting future liabilities and obligations
based on all of the relevant inputs.

4 February 2015 Your Wealth & Life
Introduction
goals and objectives that they’d like their invest-ment assets to meet. College tuition, a home purchase, retirement spending, vacations, and bequests are all examples of spending that have fairly specific dollar amounts and timing associ-ated with them, and investments can be made specifically to meet those goals.
No matter the “risk tolerance” of the individual, investing funds earmarked for a grandchild’s col-lege tuition in a moderate portfolio makes very little sense if the check is due at the bursar’s office in six months, but might be perfectly ratio-nal if college is still seven years away. The same can be said, as many investors unfortunately realized in 2008, about holding money needed for the next two years of living expenses in an aggressive portfolio or illiquid assets. LDI strate-gies intuitively drive dynamic decisions that take all of these factors into account.
ImplementationPure LDI investing would be difficult for most investors to embrace. It requires clearly specify-ing goals and then constructing a portfolio that is designed to meet those goals. Realistically, not all goals and objectives are known clearly ahead of time. A better solution for individual investors and households is to combine MPT and liability-driven investing into an intuitive, logical, integrated goals-based framework that
segments assets into three dynamic and adap-tive portfolios:
1. A liquidity portfolio: A very conservative allo-cation that contains 2–5 years of sequenced liquidity for upcoming expenses.
2. A longevity portfolio: Contains vital risk hedging products and a balanced or growth allocation, sized to match future goals and objectives through the 95th percentile of the household’s life expectancy.
3. A legacy portfolio: Assets in excess of what is necessary to meet lifetime spending objec-tives, typically invested in a growth or equity portfolio as well as any structures that are used to ensure legacy goals are met.
Importantly, asset segmentation in this frame-work is based on the goal and the timing of the goal rather than the type of asset.
The framework also has a number of benefits, including (1) it utilizes an intuitive bucketing approach for segmenting assets, (2) it creates an implicit asset-liability matching strategy based on the household’s goals, (3) it incorporates MPT for constructing high-quality growth portfolios, and (4) it incorporates risk-transfer products to hedge large balance sheet risks.
Source: UBS CIO WMR, as of 26 January 2015
Longevity
Liquidity Legacy
3.5
3.0
2.5
2.0
1.5
1.0
0.5
0.0
4.0
4.5
Ass
ets
(in m
illio
n U
SD)
85
Fig 4: Progression of buckets over life cycle
The relative composition of assets will change during lifetime
6535
Fig. 3: Life expectancy tables
95th percentile life expectancy is typically 95–100 years old
Male Female
Current age
Year of birth
95th percentile Median
Year of birth
95th percentile Median
85 1930 93 74 1930 97 81
75 1940 95 77 1940 98 82
65 1950 96 79 1950 99 84
55 1960 96 80 1960 99 85
45 1970 97 81 1970 100 86
35 1980 98 82 1980 101 86
25 1990 99 83 1990 102 87
15 2000 99 84 2000 102 88
5 2010 100 85 2010 103 88
Source: Human Mortality Database University of California, Berkeley (USA), Max Planck Institute for Demographic Research (Germany), UBS CIO WMR, as of 26 January 2015

Your Wealth & Life February 2015 5
Introduction
The liquidity and longevity portfolios are sized based on a straightforward calculation: the net present value (NPV) of the household’s spending objectives. Net present value is defined as the sum of outgoing cash flows, discounted at the expected rate of return on those assets.
For instance, if a household sizes its liquidity bucket as three years of spending and intends to spend about USD 400,000 a year, it would need to hold USD 1.19 million in that portfolio, assum-ing an annual return of 2% on those assets. The longevity bucket would be sized as the NPV of expected spending in year 4 through the 95th percentile of their life expectancy (see Fig. 3). Assets that exceed the sum of the first two buckets comprise the legacy bucket – essentially, the surplus of assets relative to goals.
The relative sizing of these buckets would change over the course of a life cycle. During an inves-tor’s 20s, 30s, and 40s, he or she would not hold many financial assets in the liquidity bucket, as current income would pay for all expenses. The longevity bucket would be in the process of being filled through savings. It should also con-tain disability insurance and life insurance. The legacy bucket would be empty for most of that period. The natural result is that nearly all of the investor’s assets would be appropriately invested in a balanced or growth portfolio.
Closer to retirement, the longevity bucket should be completely full and some assets might now also be in the legacy bucket. However, assets that will be used for spending over the next few years have also started to move into the liquidity
bucket, which has a natural de-risking effect for the overall portfolio. This is also a benefit, as it helps avoid sequence risk. The extent of the effect is moderated by the size of spending rela-tive to available assets. At retirement, the lon-gevity bucket might also contain a deferred or variable annuity, long-term care insurance, and life insurance.
Finally, an investor will slowly spend down his or her longevity bucket during his or her 70s, 80s, and 90s. Some of the risk-hedging prod-ucts might also make their way into the liquid-ity portfolio (long-term care and annuities). At the same time, legacy assets are unencumbered so they can appreciate in value. In fact, inves-tors that have large legacy portfolios relative to their spending will actually find that their aver-age portfolio risk increases during retirement, as that bucket comprises a growing portion of their overall assets. Although this might seem to con-flict with conventional wisdom, it is the correct result based on lifecycle investing theory. Fig. 4 illustrates this changing segmentation of assets over time.
The following articles and case studies are designed to explore this goals-based invest-ing framework in greater detail. In addition, David McWilliams interviews Dr. Richard Thaler, Director of the Center for Decision Research, Co-Director (with Robert Shiller) of the Behavioral Economics Project at the National Bureau of Economic Research, and author of the best-selling book Nudge.
Fig. 5: UBS goal-based investment approach
Liquidity Longevity Legacy
Purpose Provide liquidity for near-term spending
Provide asset growth and appropriate risk hedging to meet lifetime goals
Growth of legacy assets
Investment approach Conservative Balanced/growth Growth/equity
Sizing 3–5 years of cash flow Based on objectives, longevity estimate Excess assets
Risk assessment Probability of success, margin of safety, funding ratio Volatility
Intellectual framework Merton, Samuelson, Kahneman, Thaler Markowitz, Sharpe
Source: UBS CIO WMR

It’s also important to remember that investors’ goals will change over time. This is just another source of uncertainty along with income, infla-tion, income tax, and investment returns. Maintaining an eye on a forecasted probability of success therefore provides the easiest way to understand how all of these sources of uncer-tainty fit together.
However, investors need to interpret probability of success correctly, as it is a continuing source of misunderstanding. A 50% probability of suc-cess means that half the time the investor will meet or exceed the goal and half the time the investor will not have the resources for the goal. If the goal is 10 or 20 years away, a 50% prob-ability of success indicates that the investor is on track to meet the goal. As the time hori-zon shortens, however, investors will want to decrease investment risk, and see increases in the probability of success.
The bottom line is that regardless of the cli-ent’s age, financial planning reviews need to take place on a fairly regular basis as the bulk of the value of planning comes from updating and monitoring progress over time. Consistent reviews are the only way to determine whether or not the investment and estate plans are on track to meet the investor’s goals.
Perhaps the most common problem with goals-based planning is simply that it puts the cart before the horse; many investors have trouble selecting goals to pursue before they understand what the options are in the first place.
Fortunately, options are something we can eval-uate. We have the data to know where the client is today (current assets), their current trajectory (current income and savings), and where they want to go (future spending). Financial planning software allows this discussion to happen in an interactive way that wasn’t possible even 15 years ago. Investors can explore the possibilities of multiple scenarios and understand the trade-offs inherent in selecting their goals.
Some of these iterations can be very informa-tive. What would happen if the investor just stayed the course? What if they really did trim current spending a bit to save a little more? How would the projections change if the retirement date were moved? Does a higher growth rate assumption actually help, or does the additional risk do more harm than good? By looking at the various scenarios, the investor can evaluate what is realistically possible and not, as well as under-stand which assumptions are really driving the plan and which changes have the most leverage to impact the outcome.
Develop your goals
IMPLEMENTING GOALS-BASED INVESTING STEP 1
David Rosenthal, Wealth Management Consultant; Jeff Strouse, CRPC, Lead Wealth Management Consultant
David Rosenthal and Jeff Strouse are employees of UBS Wealth Management Americas. They are not members of CIO Wealth Management Research (CIO WMR). CIO WMR may have views that differ from or are contrary to the views expressed herein.
Having a detailed plan has a significant impact on confidence
Question: “How confident are you in your ability to achieve the following goals?” (Percentages show how many responded “Extremely confident” or “Very confident.”
UBS Investor Watch8
Keys to confidence: set specific goals, develop a plan and stick to it
Our research indicates that setting specific goals, developing a detailed plan, and managing one’s emotions through market swings are more important to confidence than financial acumen. Those millionaires who have a plan are dramatically more confident that they will attain their goals.
Having a detailed plan has a significant impact on confidence
Question: “How confident are you in your ability to achieve the following goals?” (Percentages show how many responded “Extremely confident” or “Very confident.”)
Additionally, our research shows that having a detailed financial plan helps millionaires avoid short-sighted investment decisions, and helps them stay the course when markets become volatile.
“ I avoid emotional decisions because I have confidence that I’ve planned and executed well.” – Male, age 71
3Ensuring a
comfortable retirement
Have a detailed plan Do not have a plan
Leaving an inheritance to my heirs
80%
83%
50%
69%
UBS Investor Watch8
Keys to confidence: set specific goals, develop a plan and stick to it
Our research indicates that setting specific goals, developing a detailed plan, and managing one’s emotions through market swings are more important to confidence than financial acumen. Those millionaires who have a plan are dramatically more confident that they will attain their goals.
Having a detailed plan has a significant impact on confidence
Question: “How confident are you in your ability to achieve the following goals?” (Percentages show how many responded “Extremely confident” or “Very confident.”)
Additionally, our research shows that having a detailed financial plan helps millionaires avoid short-sighted investment decisions, and helps them stay the course when markets become volatile.
“ I avoid emotional decisions because I have confidence that I’ve planned and executed well.” – Male, age 71
3Ensuring a
comfortable retirement
Have a detailed plan Do not have a plan
Leaving an inheritance to my heirs
80%
83%
50%
69%6 February 2015 Your Wealth & Life
Source: UBS Investor Watch survey 1Q2015.
Your Wealth & Life February 2015 7
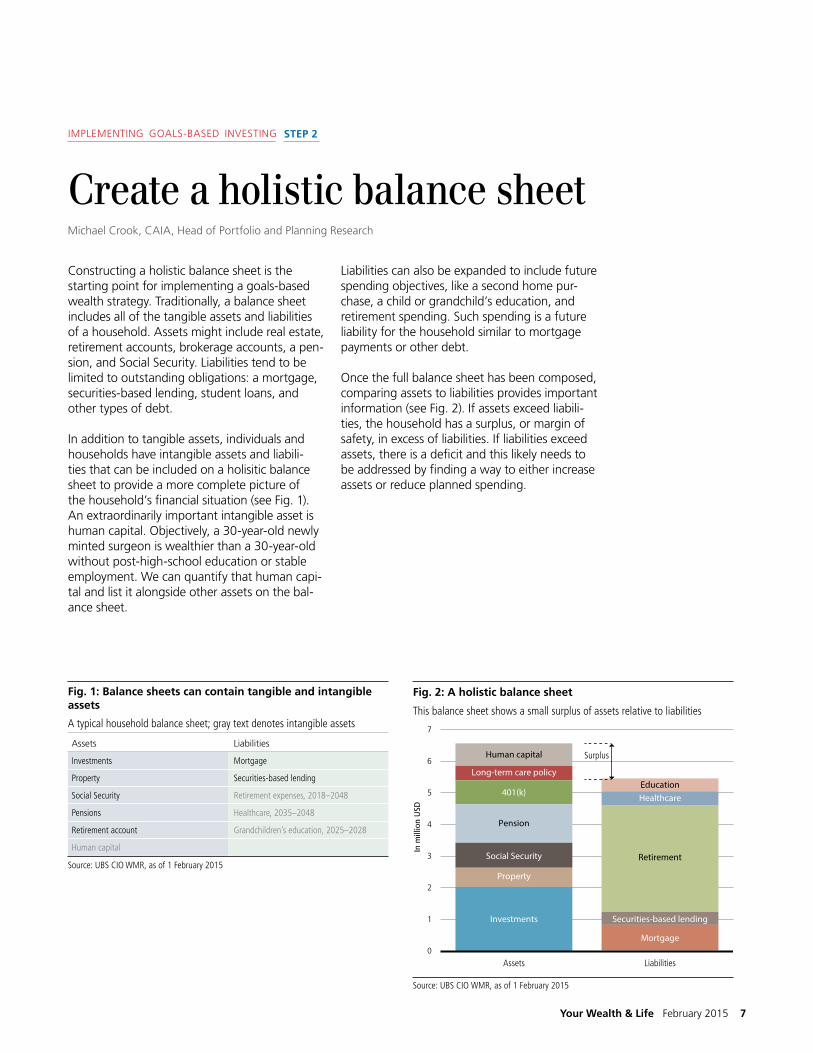
Liabilities can also be expanded to include future spending objectives, like a second home pur-chase, a child or grandchild’s education, and retirement spending. Such spending is a future liability for the household similar to mortgage payments or other debt.
Once the full balance sheet has been composed, comparing assets to liabilities provides important information (see Fig. 2). If assets exceed liabili-ties, the household has a surplus, or margin of safety, in excess of liabilities. If liabilities exceed assets, there is a deficit and this likely needs to be addressed by finding a way to either increase assets or reduce planned spending.
Constructing a holistic balance sheet is the starting point for implementing a goals-based wealth strategy. Traditionally, a balance sheet includes all of the tangible assets and liabilities of a household. Assets might include real estate, retirement accounts, brokerage accounts, a pen-sion, and Social Security. Liabilities tend to be limited to outstanding obligations: a mortgage, securities-based lending, student loans, and other types of debt.
In addition to tangible assets, individuals and households have intangible assets and liabili-ties that can be included on a holisitic balance sheet to provide a more complete picture of the household’s financial situation (see Fig. 1). An extraordinarily important intangible asset is human capital. Objectively, a 30-year-old newly minted surgeon is wealthier than a 30-year-old without post-high-school education or stable employment. We can quantify that human capi-tal and list it alongside other assets on the bal-ance sheet.
Create a holistic balance sheet
Source: UBS CIO WMR, as of 1 February 2015
5
4
3
2
1
0
6
7
In m
illio
n U
SD
Liabilities
Fig. 2: A holistic balance sheet
This balance sheet shows a small surplus of assets relative to liabilities
Assets
Investments
Mortgage
Securities-based lending
Healthcare
Retirement
Education
Property
Social Security
401(k)
Human capital
Pension
Long-term care policy
Surplus
Michael Crook, CAIA, Head of Portfolio and Planning Research
Fig. 1: Balance sheets can contain tangible and intangible assets
A typical household balance sheet; gray text denotes intangible assets
Assets Liabilities
Investments Mortgage
Property Securities-based lending
Social Security Retirement expenses, 2018–2048
Pensions Healthcare, 2035–2048
Retirement account Grandchildren’s education, 2025–2028
Human capital
Source: UBS CIO WMR, as of 1 February 2015
IMPLEMENTING GOALS-BASED INVESTING STEP 2

8 February 2015 Your Wealth & Life
represents how a household’s targeted prob-ability of success might evolve as it approaches retirement. A prudent financial planning strategy will have the household in the brown shaded area as it gets closer to retirement age, and if investors find their financial plans in the blue area, a reconsideration of their saving and spending may be required.
In addition, one of the most beneficial aspects of using probability of success as the primary performance metric is that it requires frequent monitoring and updating of financial plans. Not only will this help investors better understand their financial picture and what sort of saving or investing strategy they need to implement, but it also allows them to set more realistic expectations for their portfolios. While we are not advocating that investors ignore relative portfolio performance, adding probability of success to the portfolio review toolkit should help drive good decision making and better performance over time.
Goals-based investing (GBI) requires a new approach to performance measurement that focuses on long-term absolute performance, not short-term relative performance versus a benchmark. In this regard, one very useful per-formance metric is probability of success, which uses a Monte Carlo simulation to determine the likelihood that an investor will reach a specific financial goal. By simulating thousands of pos-sible return sequences and taking into account starting asset levels, asset allocation, savings, and the timing of goals, probability of success indicates the likelihood that the current invest-ment plan will be able to fund the designated liabilities (goals) in the future.
A 50% probability of success means that half of the time the household will outperform its goal and half of the time it will underperform its goal. Multiple decades out, a 50% probability of success is sufficient from a financial planning standpoint – it means the household is on track and can make adjustments as appropriate along the way to increase the certainty with respect to reaching their goals.
However, as the time horizon shortens, the household should expect to see the probability of success increase (see Fig. 1). The dotted line
Fig. 1: Probability of success should gradually increase closer to retirement
Source: UBS CIO WMR
0
60
40
20
80
100
Prob
abili
ty o
f suc
cess
, in
%
Years until retirement
5102030 1
Danger zone
Track progressJonathan Rather, Strategist
IMPLEMENTING GOALS-BASED INVESTING STEP 3

sufficient levels of return to fund rising living expenses over time. Currently, however, despite relatively low rates of inflation, these options run a large risk of failing to protect purchasing power. Recent cash and short-term bond rates
have failed to keep pace with inflation, mak-ing the last five years one of the worst historical periods to hold cash and most short-duration assets. While this may change as rates begin to rise, for the time being it will likely be more dif-ficult for investors to generate positive returns after inflation from ultra-safe assets.
While one solution to this problem would be to increase return potential by taking on more market risk, the inherent purpose of the liquid-ity bucket is to avoid volatility and uncertainty. Higher return volatility increases the chance that the liquidity bucket will fail to generate the funds budgeted for at the outset. Instead, we recommend accounting for the expected level of returns when sizing the buckets. When short-term interest rates are low, liquidity buckets should be somewhat larger to ensure spending needs are met.
There are at least two ways to construct a liquid-ity portfolio to meets spending needs. Take a hypothetical family that spends USD 100,000 per year and wants its liquidity bucket to gen-erate five years’ worth of cash flow. They can either construct a portfolio that allows them to spend both interest and principal, or build a larger portfolio that generates enough interest income while keeping the principal value stable.
Option 1: Use cash and a 4-year bond ladderThe first year’s expense is funded with cash, while funds to cover future years go into a
Within our goals-based investing framework, the liquidity bucket is intended to be a conservative allocation of assets to fund near-term spend-ing that is not covered by other income. As a result, this bucket’s size and composition var-ies depending on the household’s situation. For instance, a liquidity bucket may be unnecessary for individuals whose employment income cov-ers their expenses. Most other investors fall into one of two categories. The first includes those expecting to make a large purchase, such as a house, in the next five years, while the second includes retired investors whose income streams are insufficient to cover expenses.
Even investors whose income covers their regular expenses may expect to incur large expenses in the next few years. The logical place to invest money earmarked for such an expense in the next 1–5 years is the liquidity bucket. Examples include college tuition payments or a down pay-ment on a home. The right approach for meet-ing these short-term goals is to use investments that provide a lump sum of liquidity at a speci-fied date. Cash, certificates of deposit (CDs), and bond portfolios with target maturity dates may all be used for this purpose.
Retirees should use their liquidity bucket to fund their total cost of living, including day-to-day expenses, travel, and healthcare. Before deter-mining the amount of assets needed to cover these expenses, investors should first evaluate their guaranteed income sources such as Social Security, pension benefits, and annuity payments as well as required minimum distributions from qualified retirement accounts. These assets should be the first source of cash flows, reducing the need for other assets to provide current income. After appropriately sizing the bucket, the next challenge is building an allocation to provide the return needed to fulfill the remaining expenses.
Investments made within the liquidity bucket should provide a predictable income stream with safe return of principal. Traditionally, cash, CDs, and very short-term bonds have provided
Embrace a liquidity bucket
Because liquidity bucket assets are
intended to fund near-term goals, their
safety is of paramount importance.
Jonathan Bifulco, Portfolio Advisory and Consulting Group; David Durrant, Private Wealth Management Consultant
Your Wealth & Life February 2015 9
IMPLEMENTING GOALS-BASED INVESTING STEP 4

municipal bond ladder. At the start of each year, a maturing bond pays USD 100,000. To sustain the ladder going forward, the family “rolls down” funds from their longevity bucket into their liquidity bucket to purchase another 4-year bond. The precise investment amount changes depending on the prevailing level of interest rates. Because short-term rates are cur-rently quite low, nearly all of the family’s spend-ing need over the next five years goes into this bucket today, making the initial outlay just over USD 500,000 (see Fig. 1).
Option 2: Create a longer-term bond ladder and only spend the incomeGiven current interest rates, this household would need to invest over USD 9 million to build a bond ladder large enough to generate USD 100,000 each year (see Fig. 2), and further con-tributions to the ladder would need to be made in order for the income to keep up with infla-tion. For all but a relatively small number of ultra high net worth (UHNW) investors, this option is likely to be suboptimal given the large portion of the portfolio that would sit in relatively low-return assets.
A variation on the second approach would be to build a longer-duration portfolio. While sus-ceptible to more market risk, the annual income requirement could be achieved with a smaller ini-tial outlay. And again, higher interest rates would reduce the required amount of assets.
What other types of assets are appropriate to include in the liquidity bucket? Structured market-linked CDs provide principal protection1 with the possibility of increased market upside potential are one option. In addition, certain risk-managed fixed income funds target higher returns while trying to limit market risk. We caution against moving too far in the direction of seeking higher returns, however. Because liquidity bucket assets are intended to fund near-term goals, their safety is of paramount importance. Current market con-ditions may necessitate larger liquidity buckets to ensure these goals are met without tolerating a higher failure rate.
10 February 2015 Your Wealth & Life
Jonathan Bifulco and David Durrant are employees of UBS Wealth Management Americas. They are not members of CIO Wealth Management Research (CIO WMR). CIO WMR may have views that differ from or are contrary to the views expressed herein.
Fig. 1: Near-term spending funded by a 4-year bond ladder
Asset type Year Assets invested Yield Spending
Cash 0 $100,000 0.00% $100,000
Muni bond 1 $102,309 0.19% $102,500
Muni bond 2 $104,144 0.44% $105,063
Muni bond 3 $105,657 0.64% $107,689
Muni bond 4 $106,690 0.85% $110,381
Total $518,800 $525,633
Source: UBS Portfolio Advisory & Consulting Group, Bloomberg, as of 29 January 2015
Fig. 2: Near-term spending funded by income from a rolling bond ladder
MaturityAssets
invested Yield Annual income
1 $920,726 0.19% $1,722
2 $920,726 0.44% $4,051
3 $920,726 0.64% $5,865
4 $920,726 0.85% $7,863
5 $920,726 1.03% $9,465
6 $920,726 1.21% $11,122
7 $920,726 1.39% $12,770
8 $920,726 1.56% $14,345
9 $920,726 1.70% $15,680
10 $920,726 1.86% $17,116
$9,207,255 $100,000
Source: UBS Portfolio Advisory & Consulting Group, Bloomberg, as of 29 January 2015

David McWilliams: Why is behavioral finance relevant for individual investors and households in regard to decision-making?
Richard Thaler: The way I like to talk about it is, standard economics studies mythical creatures called Econs that are highly rational, never emo-tional, and can make calculations at lightning speed. I don’t have to tell your financial advisors that they don’t actually deal with Econs. And if you’re dealing with humans as opposed to Econs, then it helps to understand how they tick.
McWilliams: In your opinion, is there a behav-ioral argument for holding some extremely safe assets, and, if so, how much money do you think investors should have in those assets? Is it proportional to spending or is there something else you look at?
Thaler: Well yes, but I don’t think that there’s a hard and fast formula. It’s all about comfort. If there is an argument for holding some extremely safe assets, then it’s a behavioral one, because when you’re getting 0.1% interest – if you’re lucky – it’s hard to justify substantial holdings of cash beyond liquidity needs on any rational basis.
But, in order to get investors to be willing to bear an appropriate amount of risk, it’s some-times necessary for them to have some safe assets to give them a comfort level. That’s the main role of the safe category. How much it should be is obviously going to depend on the circumstances. But if we’re talking about some-body who’s got a substantial amount of wealth, then, say holding a couple years of basic spend-ing needs in something pretty safe may allow
the client to think differently about the other asset classes in their portfolio and to not panic when prices change.
McWilliams: What would you say are some of the more common behavioral issues that can prevent investors from achieving their goals?
Thaler: It kind of depends on the stage of the lifecycle that people are in, whether it’s in the accumulation stage or the de-accumulation stage, and the individual’s personality.
One problem that I would point to is overconfi-dence. Lots of people think that they are brilliant investors, and the way they convince themselves of that is by not keeping score. You know, it’s like going out and playing golf and not keep-ing score. You remember your good shots and forget the bad ones. That’s a fun way to play golf but unfortunately when it comes to money somebody else is keeping score.
One of the bits of advice that we’re always giv-ing people is keep track of things if you want to overcome overconfidence. If you think you are a great investor, then get someone to really analyze the trades you have made over a long period of time. Chances are you have forgot-ten about some of those dogs that did not turn out so well. The main problems that come from overconfidence are too much trading and bear-ing an inappropriate amount of risk, including taking on too much leverage.
McWilliams: So given what you just said, how do you think the findings of behavioral finance can be applied to improve investor results? What
InterviewDavid McWilliams, Head of Wealth Management Transformation at UBS, recently inter-
viewed Dr. Richard Thaler, Director of the Center for Decision Research, Co-Director
(with Robert Shiller) of the Behavioral Economics Project at the National Bureau of
Economic Research, and author of the best-selling book Nudge. Dr. Thaler is also a
founder and principal of Fuller & Thaler Asset Management.
Your Wealth & Life February 2015 11

are some ways you’ve seen people solve or address these issues in a more practical stand-point from an investor perspective?
Thaler: Ironically, it can sometimes help investors to pay less attention. Paying too much attention to day-to-day fluctuations can only get you into trouble. What I always tell people is to pick a sen-sible asset allocation and then stop opening the mail. If you’re getting electronic statements, just click delete. If you have a good financial advisor, then delegate. Let your advisor be the one who is worrying about stuff day to day.
McWilliams: Do you think behavioral finance has anything to tell us in regard to investors focusing on progress toward actually fulfilling their financial goals, as opposed to a relative per-formance versus a benchmark like the S&P 500?
Thaler: Benchmarks are one of the great evils in preventing successful investment at every level. If you think about the standard style box it really makes no sense.
Since we were talking about golf, here is an interesting finding from that domain which is related. It turns out that professional golfers are more likely to make par puts than birdie putts from exactly the same spot. The explanation is based on one of the major findings in behavioral economics, which is that people are loss averse, meaning that losses hurt more than gains make you feel good. For professional golfers bogies are considered losses and birdies are considered gains. So they think making a birdie putt is a bonus but making a bogie is a disaster. As a result they seem to pay more attention on par putts.
If you think about it, all of this is irrelevant. The only thing that matters is the score at the end of the day. Par is just a completely irrelevant number, and the same is true for benchmarks. The rational way to think about this is the total portfolio and how it all fits together. Whether some particular asset is or is not beating the benchmark to which it’s being compared is less important than how it fits in with the rest of the portfolio.
McWilliams: We’ve talked about using behav-ioral finance to avoid mistakes, but what about implications for making money?
Thaler: Much of behavioral finance is about mistakes human beings make. At Fuller and Thaler, our first step in using behavioral insights to invest is to cre-ate an investment
discipline that helps portfolio managers avoid making those common mistakes themselves. The next step is to spot the situations where other investors, both individuals and institutions, are likely to make a mistake and then to take the other side. When other investors panic and over-react to bad news, we buy. When other inves-tors are slow to react to good news because they are anchored on past performance, and are overconfident in their own forecasts about the future, we buy. It is not enough to simply be contrarian. Sometimes the conventional wis-dom is right. The trick is in finding the situations where the consensus is wrong.
McWilliams: Where do you think the field is going next? Is there any particular area of inter-est that you are looking at now that you believe is important for investors?
Thaler: One issue that’s on everyone’s mind is that we don’t have satisfactory solutions for dealing with the decumulation phase of life. This is a problem because figuring out the best way to draw down a pile of money is a much harder problem than accumulation because of longevity risk.
So I’m expecting over the next ten years that that’s going to be a big focus of attention both by academics and practitioners and I expect to see lots of innovative products and approaches. Obviously some judicial use of annuities can make sense, but the best way to use annuities would be to buy just longevity insurance. At age 65 it is possible to cheaply buy an annuity policy that only starts paying out once the investor reaches 80. With that policy in hand, the inves-tor can deal with the easier problem of drawing down money between now and the time they reach 80. But investors just can’t get their head around that idea. So I think we’re going to need to figure out other ways to help people solve this difficult problem.
12 February 2015 Your Wealth & Life

Your Wealth & Life February 2015 13
the money that had been earmarked for a trip as opposed to the rest of the household’s sav-ings. However, most people would at least feel a tendency to count the lost money against their vacation budget. In that way, embracing a buck-eting approach provides a framework that fits with our natural bias to separate out accounts by the intended use of those funds.
Another behavioral bias that the bucketing approach can help investors avoid is loss aver-sion. Loss aversion is the tendency for investors to strongly prefer avoiding losses to obtaining
equal gains. This is a perfectly rational prefer-ence since psychological studies have estimated that the displeasure produced by losses is more than twice as strong as the pleasure produced from an equal gain. However, investors have been known to abandon long-term financial plans when faced with losses on their investable assets. Unfortunately, bear markets and reces-sions are typically the worst times to sell (and the best to buy), as markets tend to recover in due course. Embracing a liquidity portfolio can help relieve some of the stress associated with bear markets and help provide investors with a level of com-fort that their near- to medium-term expenses are well covered by their financial assets. Knowing that they have two to five years’ worth of expenditures segmented helps investors main-tain a focus on the long term and not react too strongly when markets perform poorly.
A goals-based framework can also help investors avoid performance chasing and succumbing to
There is a growing body of research in the field of behavioral economics that suggests behav-ioral biases may be the greatest contributor to investors’ persistent underperformance rela-tive to passive benchmarks. Study after study has found that investors frequently buy and sell at the worst possible times. According to one prominent study, the average annual under-performance is around 1.5% (see Fig. 1). Now 1.5% may not seem like a lot, but over time and through compounding, it can lead to signifi-cantly worse investment outcomes. A short list of the common behavioral biases that plague investors includes overconfidence, mental accounting, recency, anchoring, loss aversion, and confirmation bias. Because our goals-based wealth allocation approach doubles as a bucketing strategy, it is designed to help investors avoid costly mental mistakes and should help them realize better outcomes than traditional asset allocation strate-gies. In particular, a bucketing approach helps address the behavioral bias of mental account-ing. Mental accounting describes the set of cog-nitive operations people use to make financial decisions. One aspect of mental accounting is that people tend to mentally segment their financial assets by the type of spending that they intend to use the assets for. Think of the vaca-tion savings jar that people sometimes use to put away money for a trip. If the money in the jar were stolen or somehow lost, many people would respond by postponing or canceling their vacation.
Liquidity and tax issues aside, this mental seg-mentation of assets violates the economic prin-ciple of fungibility.1 Fungibility is the idea that money in one account is perfectly substitutable for an equivalent amount of money in a different account. In other words, if the vacation jar were lost, a rational response would be to reallocate the household’s budget in a way that maximized happiness since there was nothing special about
Behavioral advantages of bucketingMatt Baredes, Strategist
Study after study has found that
investors frequently buy and sell at
the worst possible times.
ADVANTAGES OF IMPLEMENTING GOALS-BASED INVESTING

14 February 2015 Your Wealth & Life
recency bias. Recency bias refers to the tendency of individuals to extrapolate the events of the recent past to the future. When individuals see that they have underperformed a benchmark over a short time period, it is common for them to want to modify their investments, whether or not this is the right move. Goals-based investing enables investors to measure themselves rela-tive to their goals, while maintaining well-con-structed portfolios that will perform well over the long term, rather than focusing on a short-term and self-defeating strategy of beating a particular market index. Given that goals can be modified, this allows investors to have more flex-ibility and to focus on what is actually important to them (achieving their goals) as opposed to a relative performance number.
As the father of modern security analysis, Benjamin Graham once said: “The investor’s chief problem – even his worst enemy – is likely to be himself.”2 While we cannot completely eliminate behavioral biases from investing, a goal of every investor should be to create processes and plans that are likely to lessen the influence of these biases. The bucketing approach helps build portfolios in a way that is simple, intuitive, and likely to lead to better financial outcomes by minimizing behavioral errors during the invest-ment process.
Source: ”What are stock investors’ actual historical returns? Evidence from dollar-weighted returns” by Ilia Dichev, American Economic Review, 2004. UBS CIO WMR
–1.0
–2.0
–3.0
–4.0
–5.0
–6.0
0.0
1.0
Fig. 1: Investors underperform simple benchmarks
Dollar-weighted relative to buy-and-hold returns by country, in %
Italy
Fran
ce
Japa
n
Irela
nd
Swed
en
Sing
apor
e
Hong
Kon
g
Belg
ium
Nor
way UK US
Net
herla
nds
Sout
h Af
rica
Denm
ark
Ger
man
y
Switz
erla
nd
Aust
ralia
Aust
ria
Cana
da
Ave
rag
e

Case studies
Millennial• Roy is a 32-year-old employee of
LMN Inc.
• Roy is married and has a five-year-old daughter.
• He has USD 250,000 in savings.Roy plans to buy a house in five years for which the down pay-ment will be USD 100,000.
• Roy plans to pay for his daugh-ter to attend a four-year in-state public university.
• He plans to retire at age 60.
Ultra high net worth• Carol is a 49-year-old CEO and
founder of a public pharmaceu-tical company, which she took public in 2006. She has USD 32 million in investable assets and has a substantial amount of her net worth tied up in her company.
• Carol has an 18-year-old son and a 15-year-old daughter.
• A trust is already set up to pass on funds to her children.
• Carol has significant philan-thropic aspirations and has set up a donor-advised fund to ful-fill her charitable giving.
• Between her living expenses and annual charitible giving, she spends USD 600,000 per year, plans to buy a second home in 7–9 years and has future tuition payments to fund.
High net worth retiree• Bill is a 65-year-old executive set
to retire from XYZ Inc. next year.
• He has children in their 30s who are no longer dependent on him.
• In retirement, he plans to travel up until he is 80, spending USD 15,000 a year on travel. He plans to spend USD 160,000 in retirement, which includes healthcare. In two years, Bill plans to buy a vacation home in Florida for USD 200,000. In addition, he expects one of his daughters to get married in the next 5–7 years with an esti-mated cost of USD 20,000. He also plans to leave at least USD 50,000 to his children.
• Aside from his investment assets (USD 4 million), he will be living off of Social Security and pension income of USD 40,000 per year.
Your Wealth & Life February 2015 15

Case studies
• The Millennial’s largest asset is his human capital as opposed to any financial assets.
• The Millennial’s largest liability is retirement, but he has a long time period to fund this liability.
Bucketed assets
Liquidity Longevity Legacy
Investments Investments
Human capital
Life insurance
Disability insurance
• At this stage, the Millennial investor is accumulating assets. Therefore, he would not have any assets in the liquidity bucket under normal circumstances, as all spending is covered by current income.
• Exceptions to this might be a house down payment or other large purchase.
• A young investor is unlikely to have a legacy bucket as he is still accumulating assets to fill personal longevity needs.
• Due to this investor’s net saving position, the liquidity bucket is only filled for special purchases.
• The longevity bucket slowly fills as the investor approaches retirement. At this point, he does not have sufficient funds for a legacy bucket.
Buckets over time
Holistic balance sheet
Millennial
16 February 2015 Your Wealth & Life
Matt Baredes, Strategist
Source: UBS CIO WMR
LongevityLiquidity Legacy
500
400
300
200
100$90,573
$0 $0 $0 $0$22,9800
600
700
In t
ho
usa
nd
s o
f USD
In 10 years
Expected portfolio evolution over time
The longevity bucket continues to grow over time for this investor
In 5 yearsCurrent
$159,427
$356,864
$647,055
Source: UBS CIO WMR
400
300
200
100
0
500
600
700
In t
hous
ands
of U
SD
Liabilities
A holistic balance sheet
Human capital is the largest component of the Millennial’s assets
Assets
Investments
Human capital
Disability insuranceLife insurance
Down payment
Retirement
Education
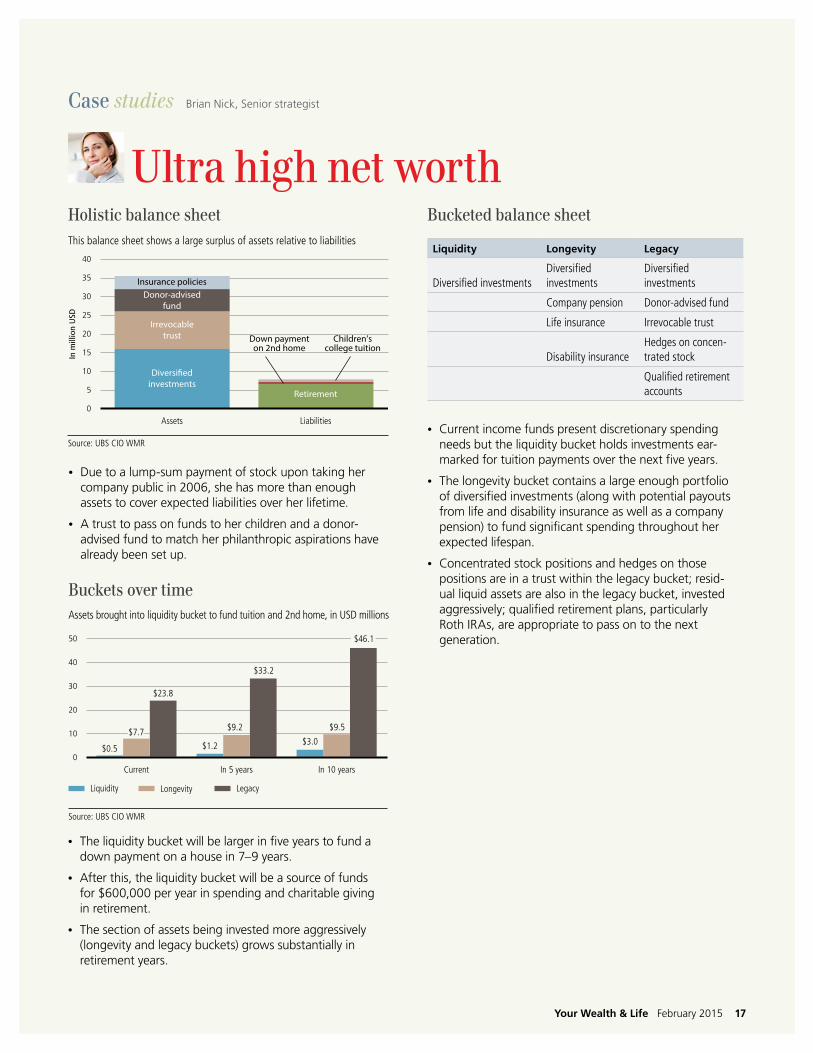
• Due to a lump-sum payment of stock upon taking her company public in 2006, she has more than enough assets to cover expected liabilities over her lifetime.
• A trust to pass on funds to her children and a donor-advised fund to match her philanthropic aspirations have already been set up.
Source: UBS CIO WMR
25
20
15
10
5
0
30
35
40
In m
illio
n U
SD
Liabilities
A holistic balance sheet
This balance sheet shows a large surplus of assets relative to liabilities
Assets
Diversi�edinvestments
Irrevocabletrust
Donor-advisedfund
Insurance policies
Retirement
Down paymenton 2nd home
Children’scollege tuition
Source: UBS CIO WMR
LongevityLiquidity Legacy
30
20
10
0
40
50
In 10 years
Expected portfolio evolution over time
Assets brought into liquidity bucket to fund tuition and 2nd home, in USD millions
In 5 yearsCurrent
$0.5 $1.2 $3.0
$9.2 $9.5
$33.2
$7.7
$23.8
$46.1
Liquidity Longevity Legacy
Diversified investmentsDiversified investments
Diversified investments
Company pension Donor-advised fund
Life insurance Irrevocable trust
Disability insuranceHedges on concen-trated stock
Qualified retirement accounts
• Current income funds present discretionary spending needs but the liquidity bucket holds investments ear-marked for tuition payments over the next five years.
• The longevity bucket contains a large enough portfolio of diversified investments (along with potential payouts from life and disability insurance as well as a company pension) to fund significant spending throughout her expected lifespan.
• Concentrated stock positions and hedges on those positions are in a trust within the legacy bucket; resid-ual liquid assets are also in the legacy bucket, invested aggressively; qualified retirement plans, particularly Roth IRAs, are appropriate to pass on to the next generation.
Case studies
Ultra high net worth
Buckets over time
Holistic balance sheet Bucketed balance sheet
Brian Nick, Senior strategist
• The liquidity bucket will be larger in five years to fund a down payment on a house in 7–9 years.
• After this, the liquidity bucket will be a source of funds for $600,000 per year in spending and charitable giving in retirement.
• The section of assets being invested more aggressively (longevity and legacy buckets) grows substantially in retirement years.
Your Wealth & Life February 2015 17

• The HNW retiree has a small surplus of assets relative to liabilities (taking present value of planned retirement spending into account) at retirement age, which is a pru-dent financial planning strategy.
• Funding retirement and healthcare expenses, purchasing a second home, and being able to travel for the first 15 years of retirement are the primary goals of this retiree.
Source: UBS CIO WMR
3
2
1
0
4
5
6
In m
illio
n U
SD
Liabilities
A holistic balance sheet
This balance sheet shows a small surplus of assets relative to liabilities
Assets
Investments
Property
Social SecurityPension income
401(k)
Long-term care policyLife insurance
Retirement
Healthcare House in FL
Travel
Source: UBS CIO WMR
LongevityLiquidity Legacy
1.4
1.2
1.0 $829,7210.8
0.6
0.4
0.2
0.0
1.6
1.8
In m
illio
n U
SD
In 10 years
Expected portfolio evolution over time
Longevity bucket moves into liquidity bucket as retiree ages
In 5 yearsCurrent
$1,657,498
$512,781
$1,344,824
$575,101
$820,862
$648,271$745,130
$1,552,077
Liquidity Longevity Legacy
Investments Investments Investments
Social Security Social Security
Pension income Pension income
Long-term care insurance
Life insurance
• At the start of retirement, the household has a liquidity bucket that holds five years of spending, a fully funded longevity bucket, and a legacy bucket.
• The retiree has sizeable pension income and Social Security benefits to help cover required expenses in retire-ment, allowing him to fund his legacy bucket with invest-ment assets. Long-term care and life insurance represent assets in the longevity bucket designed to fund potential liabilities between now and the end of his lifetime.
• As retirement progresses, the retiree effectively spends down the longevity bucket as those assets are moved to the liquidity bucket. The legacy bucket grows uncon-strained unless goals and objectives change or market performance falls below expectations.
High net worth retiree
Case studies
18 February 2015 Your Wealth & Life
Bucketed balance sheetHolistic balance sheet
Buckets over time
Jon Rather, Strategist

Your Wealth & Life February 2015 19
Many investment strategies, products and account types have built-in planning implications or are often used in the implementation of common financial planning objectives. Below you will find five major goals along with a list of accounts and investment strategies that are commonly associated with them. Keep in mind that many of the accounts and investment strategies can be designed to achieve the purposes of more than one theme. This is not an exhaustive list; however, it encom-passes the majority of purpose-type accounts that may be encountered by our clients here at UBS.
Asset allocation for particular needs, a reviewBy David Mietty, Wealth Management Consultant; Jeff Strouse, CRPC, Lead Wealth Management Consultant
RetirementIndividual retirement savings accounts independent of employer participation:• IRA• Roth IRA
Employer-sponsored retirement savings plans:• 401(k) Plans• 403(b) Plans
Employer-sponsored executive retirement savings plans:• Deferred Compensation• Stock Options• Restricted Stock
Long-term and short-term risk management products:• Alternative Investments• Structured Products
Supplemental deferred retirement savings accounts:• Variable Annuities• Personally Owned Life Insurance • Split Funded Defined Benefit Plans
FinancingNon-investment financing:• Securities-Based Loans• Mortgages
Investment financing:• Margin
EducationDeferred education savings accounts:• Coverdell Plans • 529 Plans
Non-deferred education or other purpose savings accounts:• UGMA / UTMA
Estate planningBasic estate planning trusts:• Revocable Living Trust• Irrevocable Trust• Irrevocable Life Insurance Trust
Basic transfer tax minimization/optimization trusts:• Marital Trust• Credit Shelter Trust• Generation Skipping Trust
Asset/creditor protection trusts:• Dynasty Trust• Delaware Trust• Spendthrift Trust• Asset Protection Trust
Advanced estate planning entities and trusts:• Family LLC or Partnership• Grantor Retained Annuity Trust• Spousal Lifetime Access Trust• Qualified Domestic Trust• Intentionally Defective Grantor
Trusts• Qualified Personal Residence Trust
PhilanthropyCharitable entities:• Donor-Advised Fund • Private Family Foundation• Charitable Gift Annuity • Charitable Trust• Charitable Foundation
Hybrid charitable / estate planning trusts:• Charitable Remainder Trust • Charitable Lead Trust
Appendix
David Mietty and Jeff Strouse are employees of UBS Wealth Management Americas. They are not members of CIO Wealth Manage-ment Research (CIO WMR). CIO WMR may have views that differ from or are contrary to the views expressed herein.

Matthew Baredes is a Strategist within the CIO Portfolio & Planning Research group in CIO Wealth Management Research. He focuses on advice related to investment strategy, portfolio construction, behavioral investing and financial planning.
Jonathan Bifulco is responsible for articulating and delivering comprehensive, research-driven asset allocation and portfolio strategy advice to Financial Advisors and their ultra-high net worth clients. He conducts detailed portfolio review sessions with private clients to help them develop customized strate-gic and tactical asset allocations and product implementation. Previously, Jonathan participated in the UBS Graduate Training Program, rotating through various business units in UBS Wealth Management Americas. He has a B.A. in math and economics and an M.A. in economics from Fordham University.
Michael Crook is an Executive Director and Head of Portfolio & Planning in CIO Wealth Management Research, where he advises investors on asset allocation, portfolio construction, and financial planning. He is the author of numerous academic and professional articles including publications in the Journal of Wealth Management, the Journal of Investing, and the Journal of Index Investing and is a former adjunct professor of econom-ics at Marymount Manhattan College. He’s also a reviewer for the Journal of Investing and the Journal of Index Investing.
David Durrant is a Portfolio Strategy Consultant for UBS Private Wealth Management. In this role, David provides expert review and optimization of existing asset allocations, the creation of optimized investment proposals, guidance on portfolio construc-tion and implementation, and strategies that reflect the firm’s in-depth research capabilities. Before assuming his current role at UBS, David spent ten years with Julius Baer in various roles. Prior to the sale of Julius Baer’s private banking operations in the Americas to UBS, David held the titles of Chief Currency Strategist and Senior Economist for the Americas. After the sale, David became the Chief Strategist for Julius Baer Investment Management (now known as ARTIO).
David McWilliams is the Head of Wealth Management Transformation at UBS. Wealth Management Transformation is a new organization that helps Financial Advisors, through team-ing, training, planning, increasing productivity and delivering holistic wealth management.
David Mietty is a Wealth Management Consultant for the South Central and Midwest Regions. In this capacity, David is responsible for providing Financial Advisors and their high net worth clients with unbiased, product neutral, advanced plan-ning strategies, design and implementation. David brings to UBS 32 years of professional corporate fiduciary experience, includ-ing managerial positions in personal trust administration, estate
About the contributorssettlement, estate tax, fiduciary legal counsel and wealth man-agement. He also has extensive professional experience with fiduciary litigation, closely held businesses, charitable trusts and fiduciary investment strategies.
Brian Nick is a Senior Strategist in the Portfolio & Planning Research group in CIO Wealth Management Research. He pro-vides advice to investors regarding market developments, port-folio construction, and short- and longterm asset allocation. Brian also serves as liaison between CIO WMR and the UBS Private Wealth Management division.
Jon Rather is a Strategist within the CIO Portfolio & Planning Research group in CIO Wealth Management Research. He focuses on advice related to investment strategy, portfolio con-struction, and financial planning.
David Rosenthal is a Wealth Management Consultant for the South Central Region. He emphasizes the financial planning pro-cess as a way of serving clients effectively. He collaborates with Financial Advisors and their clients regarding financial planning, estate planning strategies, insurance and investment manage-ment. David takes pride in his ability to translate complex con-cepts into easy-to understand language, and has over 30 year of experience in financial services.
Mike Ryan is Chief Investment Strategist for WMA and Regional Chief Investment Officer for Wealth Management US. He brings together market and investment insights and positions them so as to optimize impact for clients.
Jeff Strouse, has over 20 years of experience in financial and related services. In addition to his role with UBS, Jeff has past experience in public accounting and trust and estate law. He attained a post-doctoral fellowship in wealth strategies and has been a contributing author to two estate planning books. With degrees in both law and accounting, Jeff brings insight to the many aspects of financial planning. Prior to joining UBS, Jeff was a Planning Director for MS Smith Barney, a Trust and Estates Attorney and worked in the Tax Division of Ernst and Young CPAs.
20 February 2015 Your Wealth & Life

Your Wealth & Life February 2015 21
EndnotesIntroduction 1 Babylonian Talmud: Tractate Baba Mezi’a, folio 42a. 2 DeMiguel V., L. Garlappi and R. Uppal (2008), Optimal
versus naïve diversification: how inefficient is the 1/N portfolio strategy?, Review of Financial Studies, 1915-1953.
3 Baredes, Matthew and Michael Crook, Frequently Asked Questions about Liability Driven Investing, Iinvestment Strategy Insights, UBS, April 2014.
Embrace a liquidity bucket 1 Market-linked CDs are unsecured deposit obligations
of the issuer. In the event the issuer fails, the principal amount of the CD would be insured by the FDIC up to applicable statutory limits. To the extent this amount, combined with all other deposits an investor holds in the same capacity at the same bank, exceed FDIC insurance limits, the investor would be subject to the credit risk of the issuer and may lose this entire excess amount. FDIC insurance does not apply to any market-linked return, and investors may not receive this payment if the bank fails. The rules and regulations regarding the limit and applicability of FDIC insurance coverage can change. The FDIC also has the right to terminate the deposit insurance of a bank under certain limited circumstances, which could potentially result in the loss of FDIC insurance for a CD prior to maturity. For the latest information regarding FDIC insurance coverage visit: www.fdic.gov.
Behavioral advantages of bucketing 1 Thaler, Richard. “Mental Accounting Matters.” Journal
of Behavioral Decision Making, 12: 183-206 (1999) 2 Graham, Benjamin and David Dodd. The Intelligent
Investor. Harper & Brothers, 1949.

22 February 2015 Your Wealth & Life
Publication details
PublisherUBS Financial Services Inc.
Wealth Management Research
1285 Avenue of the Americas, 20th Floor
New York, NY 10019
This report was published
on 17 February 2015.
Editor in chiefMichael Crook
Contributors (in alphabetical order)Matthew BaredesJonathan BifulcoMichael CrookDavid DurrantDavid McWilliamsDavid MiettyBrian Nick Jon RatherDavid RosenthalMike RyanJeff Strouse
EditorCLS Communication, Inc.
Project Management Paul LeemingDrew GilmoreNatalie Weinberg
Desktop PublishingGeorge StilabowerCognizant Group – Basavaraj Gudihal, Srinivas Addugula, Pavan Mekala
and Virender Negi

Chief Investment Office (CIO) Wealth Management (WM) Research is published by UBS Wealth Management and UBS Wealth Management Americas, Business Divisions of UBS AG (UBS) or an affiliate thereof. CIO WM Research reports published outside the US are branded as Chief Investment Office WM. In certain countries UBS AG is referred to as UBS SA. This publication is for your information only and is not intended as an offer, or a solicitation of an offer, to buy or sell any investment or other specific product. The analysis contained herein does not constitute a personal recommendation or take into account the particular investment objectives, investment strategies, financial situation and needs of any specific recipient. It is based on numerous assumptions. Different assumptions could result in materially different results. We recommend that you obtain financial and/or tax advice as to the implications (including tax) of investing in the manner described or in any of the products mentioned herein. Certain services and products are subject to legal restrictions and cannot be offered worldwide on an unrestricted basis and/or may not be eligible for sale to all investors. All information and opinions expressed in this document were obtained from sources believed to be reliable and in good faith, but no representation or warranty, express or implied, is made as to its accuracy or completeness (other than disclosures relating to UBS and its affiliates). All information and opinions as well as any prices indicated are current only as of the date of this report, and are subject to change without notice. Opinions expressed herein may differ or be contrary to those expressed by other business areas or divisions of UBS as a result of using different assumptions and/or criteria. At any time, investment decisions (including whether to buy, sell or hold securities) made by UBS AG, its affiliates, subsidiaries and employees may differ from or be contrary to the opinions expressed in UBS research publications. Some investments may not be readily realizable since the market in the securities is illiquid and therefore valuing the investment and identifying the risk to which you are exposed may be difficult to quantify. UBS relies on information barriers to control the flow of information contained in one or more areas within UBS, into other areas, units, divisions or affiliates of UBS. Futures and options trading is considered risky. Past performance of an investment is no guarantee for its future performance. Some investments may be subject to sudden and large falls in value and on realization you may receive back less than you invested or may be required to pay more. Changes in FX rates may have an adverse effect on the price, value or income of an investment. This report is for distribution only under such circumstances as may be permitted by applicable law.
Distributed to US persons by UBS Financial Services Inc., a subsidiary of UBS AG. UBS Securities LLC is a subsidiary of UBS AG and an affiliate of UBS Financial Services Inc. UBS Financial Services Inc. accepts responsibility for the content of a report prepared by a non-US affiliate when it distributes reports to US persons. All transactions by a US person in the securities mentioned in this report should be effected through a US-registered broker dealer affiliated with UBS, and not through a non-US affiliate. The contents of this report have not been and will not be approved by any securities or investment authority in the United States or elsewhere.
UBS specifically prohibits the redistribution or reproduction of this material in whole or in part without the prior written permission of UBS and UBS accepts no liability whatsoever for the actions of third parties in this respect.
Version as per May 2014.
© UBS 2015. The key symbol and UBS are among the registered and unregistered trademarks of UBS. All rights reserved.
Disclaimer

©2015 UBS Financial Services Inc. All rights reserved. Member SIPC.
All other trademarks, registered trademarks, service marks
and registered service marks are of their respective companies.
UBS Financial Services Inc.
www.ubs.com/financialservicesinc
UBS Financial Services Inc. is a subsidiary of UBS AG.