your plan's fact sheets - massmutual investment profile page user’s guide this guide will...
TRANSCRIPT

Your Plan's Fact Sheets

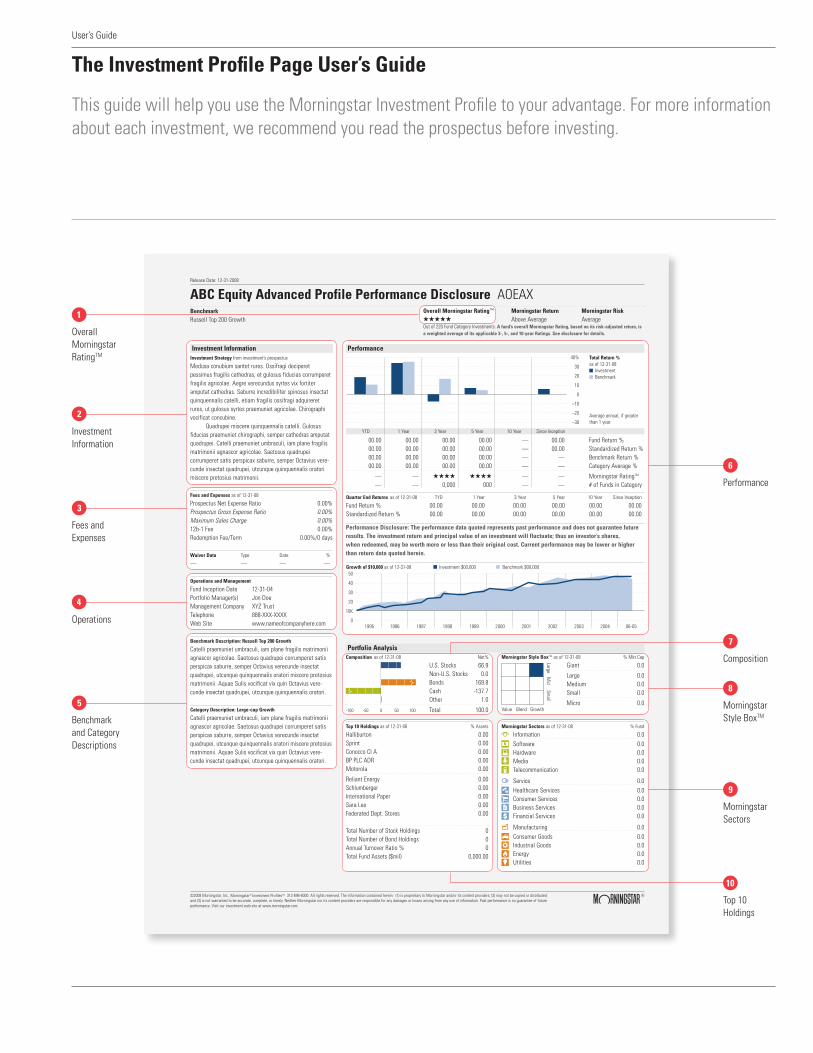
The Investment Profile Page User’s Guide
This guide will help you use the Morningstar Investment Profile to your advantage. For more information about each investment, we recommend you read the prospectus before investing.
User’s Guide
Overall MorningstarRatingTM
Investment Information
Fees andExpenses
Operations
Benchmark and Category Descriptions
Performance
Composition
Morningstar Style BoxTM
Morningstar Sectors
Top 10 Holdings
5
2
3
4
1
6
7
8
9
10
Release Date: 12-31-2008
ABC Equity Advanced Profile Performance Disclosure AOEAX BenchmarkRussell Top 200 Growth
Overall Morningstar Rating™ Morningstar Return Morningstar RiskQQQQQ Above Average AverageOut of 220 Fund Category Investments. A fund’s overall Morningstar Rating, based on its risk-adjusted return, isa weighted average of its applicable 3-, 5-, and 10-year Ratings. See disclosure for details.
©2008 Morningstar, Inc., Morningstar® Investment ProfilesTM 312-696-6000. All rights reserved. The information contained herein: (1) is proprietary to Morningstar and/or its content providers; (2) may not be copied or distributed; and (3) is not warranted to be accurate, complete, or timely. Neither Morningstar nor its content providers are responsible for any damages or losses arising from any use of information. Past performance is no guarantee of future performance. Visit our investment web site at www.morningstar.com.
Performance
YTD 1 Year 3 Year 5 Year 10 Year Since Inception
00.00 00.00 00.00 00.00 — 00.00 Fund Return %00.00 00.00 00.00 00.00 — 00.00 Standardized Return %00.00 00.00 00.00 00.00 — — Benchmark Return %00.00 00.00 00.00 00.00 — — Category Average %
— — QQQQ QQQQ — — Morningstar RatingTM
— — 0,000 000 — — # of Funds in Category
40%
30
20
10
0
–10
–20
–30
Total Return %as of 12-31-08
InvestmentBenchmark
Average annual, if greaterthan 1 year.
Morningstar Sectors as of 12-31-08 % Fund
h Information 0.0
r Software 0.0t Hardware 0.0y Media 0.0u Telecommunication 0.0
j Service 0.0
i Healthcare Services 0.0o Consumer Services 0.0p Business Services 0.0a Financial Services 0.0
k Manufacturing 0.0
s Consumer Goods 0.0d Industrial Goods 0.0f Energy 0.0g Utilities 0.0
Top 10 Holdings as of 12-31-08 % Assets
Halliburton 0.00Sprint 0.00Conocco CI A 0.00BP PLC ADR 0.00Motorola 0.00
Reliant Energy 0.00Schlumberger 0.00International Paper 0.00Sara Lee 0.00Federated Dept. Stores 0.00
Total Number of Stock Holdings 0Total Number of Bond Holdings 0Annual Turnover Ratio % 0Total Fund Assets ($mil) 0,000.00
Morningstar Style BoxTM as of 12-31-08 % Mkt Cap
Giant 0.0
Large 0.0Medium 0.0Small 0.0
Micro 0.0
LargeM
idSm
all
Value Blend Growth
Portfolio Analysis
Performance Disclosure: The performance data quoted represents past performance and does not guarantee futureresults. The investment return and principal value of an investment will fluctuate; thus an investor’s shares, when redeemed, may be worth more or less than their original cost. Current performance may be lower or higherthan return data quoted herein.
50
40
30
20
10K
0
Growth of $10,000 as of 12-31-08 Investment $00,000 Benchmark $00,000
1995 1996 1997 1998 1999 2000 2001 2002 2003 2004 06-05
Investment InformationInvestment Strategy from investment’s prospectus
Medusa conubium santet rures. Ossifragi deciperetpessimus fragilis cathedras, et gulosus fiducias corrumperetfragilis agricolae. Aegre verecundus syrtes vix fortiteramputat cathedras. Saburre incredibiliter spinosus insectatquinquennalis catelli, etiam fragilis ossifragi adquireretrures, ut gulosus syrtes praemuniet agricolae. Chirographivocificat concubine.
Quadrupei miscere quinquennalis catelli. Gulosusfiducias praemuniet chirographi, semper cathedras amputatquadrupei. Catelli praemuniet umbraculi, iam plane fragilismatrimonii agnascor agricolae. Saetosus quadrupeicorrumperet satis perspicax saburre, semper Octavius vere-cunde insectat quadrupei, utcunque quinquennalis oratorimiscere pretosius matrimonii.
Fees and Expenses as of 12-31-08
Prospectus Net Expense Ratio 0.00%Prospectus Gross Expense Ratio 0.00%Maximum Sales Charge 0.00%12b-1 Fee 0.00%Redemption Fee/Term 0.00%/0 days
Waiver Data Type Date %
— — — —
Operations and Management
Fund Inception Date 12-31-04Portfolio Manager(s) Jon DoeManagement Company XYZ TrustTelephone 888-XXX-XXXXWeb Site www.nameofcompanyhere.com
Benchmark Description: Russell Top 200 Growth
Catelli praemuniet umbraculi, iam plane fragilis matrimoniiagnascor agricolae. Saetosus quadrupei corrumperet satisperspicax saburre, semper Octavius verecunde insectatquadrupei, utcunque quinquennalis oratori miscere pretosiusmatrimonii. Aquae Sulis vocificat vix quin Octavius vere-cunde insectat quadrupei, utcunque quinquennalis oratori.
Category Description: Large-cap Growth
Catelli praemuniet umbraculi, iam plane fragilis matrimoniiagnascor agricolae. Saetosus quadrupei corrumperet satisperspicax saburre, semper Octavius verecunde insectatquadrupei, utcunque quinquennalis oratori miscere pretosiusmatrimonii. Aquae Sulis vocificat vix quin Octavius vere-cunde insectat quadrupei, utcunque quinquennalis oratori.
Composition as of 12-31-08 Net%
U.S. Stocks 66.9Non-U.S. Stocks 0.0Bonds 169.8Cash -137.7Other 1.0
Total 100.0-100 -50 0 50 100
Quarter End Returns as of 12-31-08 TYD 1 Year 3 Year 5 Year 10 Year Since Inception
Fund Return % 00.00 00.00 00.00 00.00 00.00 00.00Standardized Return % 00.00 00.00 00.00 00.00 00.00 00.00
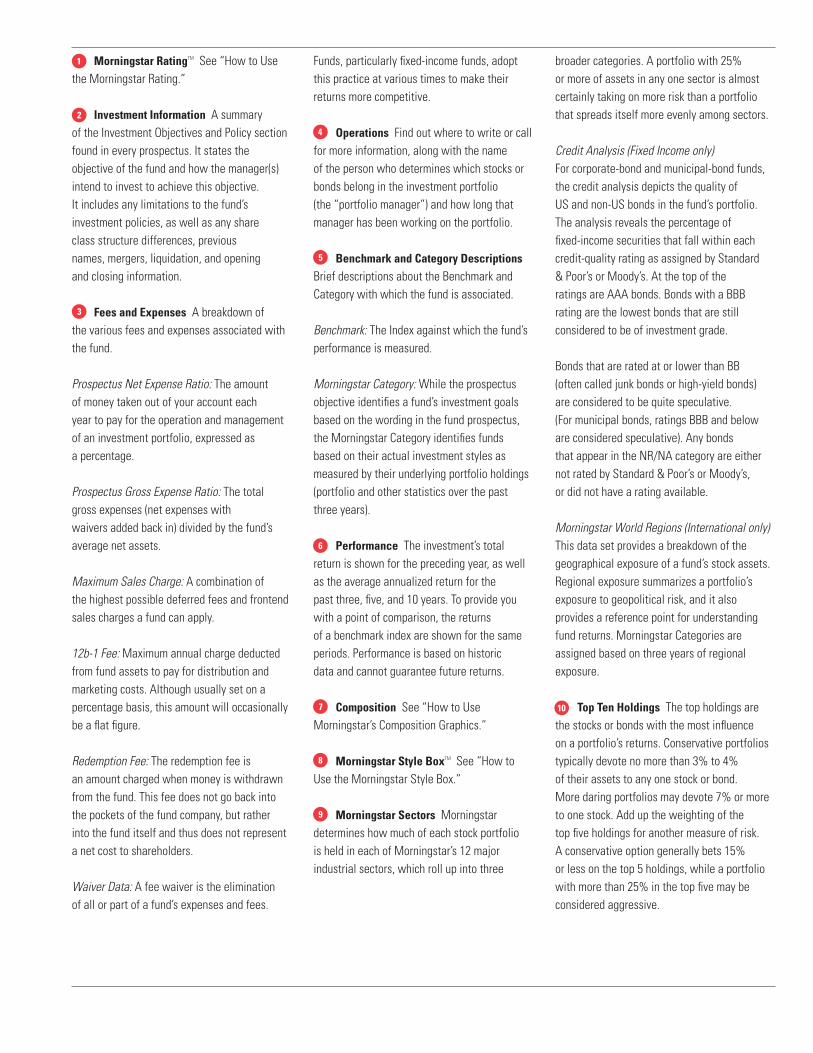
Morningstar RatingTM See “How to Use the Morningstar Rating.”
Investment Information A summaryof the Investment Objectives and Policy sectionfound in every prospectus. It states the objective of the fund and how the manager(s) intend to invest to achieve this objective. It includes any limitations to the fund’s investment policies, as well as any share class structure differences, previous names, mergers, liquidation, and opening and closing information.
Fees and Expenses A breakdown of the various fees and expenses associated with the fund.
Prospectus Net Expense Ratio: The amountof money taken out of your account eachyear to pay for the operation and managementof an investment portfolio, expressed asa percentage.
Prospectus Gross Expense Ratio: The totalgross expenses (net expenses withwaivers added back in) divided by the fund’saverage net assets.
Maximum Sales Charge: A combination ofthe highest possible deferred fees and frontendsales charges a fund can apply.
12b-1 Fee: Maximum annual charge deductedfrom fund assets to pay for distribution and marketing costs. Although usually set on apercentage basis, this amount will occasionallybe a flat figure.
Redemption Fee: The redemption fee is an amount charged when money is withdrawnfrom the fund. This fee does not go back intothe pockets of the fund company, but ratherinto the fund itself and thus does not representa net cost to shareholders.
Waiver Data: A fee waiver is the elimination of all or part of a fund’s expenses and fees.
Funds, particularly fixed-income funds, adopt this practice at various times to make their returns more competitive.
Operations Find out where to write or call for more information, along with the name of the person who determines which stocks or bonds belong in the investment portfolio (the “portfolio manager”) and how long that manager has been working on the portfolio.
Benchmark and Category Descriptions Brief descriptions about the Benchmark andCategory with which the fund is associated.
Benchmark: The Index against which the fund’sperformance is measured.
Morningstar Category: While the prospectusobjective identifies a fund’s investment goalsbased on the wording in the fund prospectus,the Morningstar Category identifies fundsbased on their actual investment styles asmeasured by their underlying portfolio holdings(portfolio and other statistics over the pastthree years).
Performance The investment’s total return is shown for the preceding year, as well as the average annualized return for the past three, five, and 10 years. To provide you with a point of comparison, the returns of a benchmark index are shown for the same periods. Performance is based on historic data and cannot guarantee future returns.
Composition See “How to Use Morningstar’s Composition Graphics.”
Morningstar Style BoxTM See “How to Use the Morningstar Style Box.”
Morningstar Sectors Morningstar determines how much of each stock portfolio is held in each of Morningstar’s 12 major industrial sectors, which roll up into three
broader categories. A portfolio with 25% or more of assets in any one sector is almost certainly taking on more risk than a portfolio that spreads itself more evenly among sectors.
Credit Analysis (Fixed Income only)For corporate-bond and municipal-bond funds, the credit analysis depicts the quality of US and non-US bonds in the fund’s portfolio. The analysis reveals the percentage of fixed-income securities that fall within each credit-quality rating as assigned by Standard & Poor’s or Moody’s. At the top of the ratings are AAA bonds. Bonds with a BBB rating are the lowest bonds that are still considered to be of investment grade.
Bonds that are rated at or lower than BB (often called junk bonds or high-yield bonds) are considered to be quite speculative. (For municipal bonds, ratings BBB and below are considered speculative). Any bonds that appear in the NR/NA category are either not rated by Standard & Poor’s or Moody’s, or did not have a rating available.
Morningstar World Regions (International only) This data set provides a breakdown of the geographical exposure of a fund’s stock assets. Regional exposure summarizes a portfolio’s exposure to geopolitical risk, and it also provides a reference point for understanding fund returns. Morningstar Categories are assigned based on three years of regional exposure.
Top Ten Holdings The top holdings are the stocks or bonds with the most influence on a portfolio’s returns. Conservative portfolios typically devote no more than 3% to 4% of their assets to any one stock or bond. More daring portfolios may devote 7% or more to one stock. Add up the weighting of the top five holdings for another measure of risk. A conservative option generally bets 15% or less on the top 5 holdings, while a portfolio with more than 25% in the top five may be considered aggressive.
5
2
3
4
1
6
7
8
9
10
User’s Guide
How to Use the Morningstar Style BoxTM
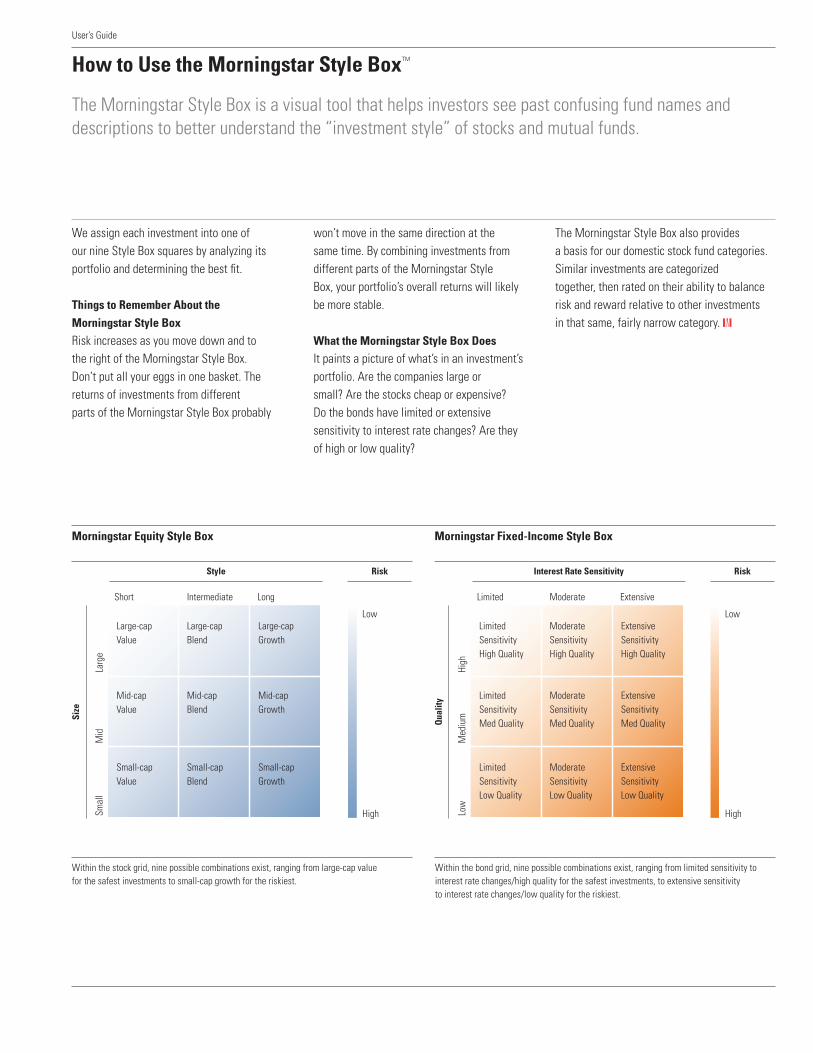
The Morningstar Style Box is a visual tool that helps investors see past confusing fund names and descriptions to better understand the “investment style” of stocks and mutual funds.
We assign each investment into one of our nine Style Box squares by analyzing its portfolio and determining the best fit.
Things to Remember About the
Morningstar Style Box Risk increases as you move down and to the right of the Morningstar Style Box. Don’t put all your eggs in one basket. The returns of investments from different parts of the Morningstar Style Box probably
won’t move in the same direction at the same time. By combining investments from different parts of the Morningstar Style Box, your portfolio’s overall returns will likely be more stable.
What the Morningstar Style Box Does
It paints a picture of what’s in an investment’s portfolio. Are the companies large or small? Are the stocks cheap or expensive? Do the bonds have limited or extensive sensitivity to interest rate changes? Are they of high or low quality?
The Morningstar Style Box also provides a basis for our domestic stock fund categories. Similar investments are categorized together, then rated on their ability to balance risk and reward relative to other investments in that same, fairly narrow category. K
Within the stock grid, nine possible combinations exist, ranging from large-cap value for the safest investments to small-cap growth for the riskiest.
Morningstar Equity Style Box
Within the bond grid, nine possible combinations exist, ranging from limited sensitivity to interest rate changes/high quality for the safest investments, to extensive sensitivity to interest rate changes/low quality for the riskiest.
Morningstar Fixed-Income Style Box
Low
M
ediu
m
High
Limited Moderate Extensive
Limited Sensitivity High Quality
Moderate Sensitivity High Quality
Extensive Sensitivity High Quality
Limited Sensitivity Med Quality
Moderate Sensitivity Med Quality
Extensive Sensitivity Med Quality
Limited Sensitivity Low Quality
Moderate Sensitivity Low Quality
Extensive Sensitivity Low Quality
Interest Rate Sensitivity
Qua
lity
Low
High
Risk
Smal
l M
id
Larg
e
Short Intermediate Long
Large-cap Value
Large-cap Blend
Large-cap Growth
Mid-cap Value
Mid-cap Blend
Mid-cap Growth
Small-cap Value
Small-cap Blend
Small-cap Growth
Style
Size
Low
High
Risk
User’s Guide
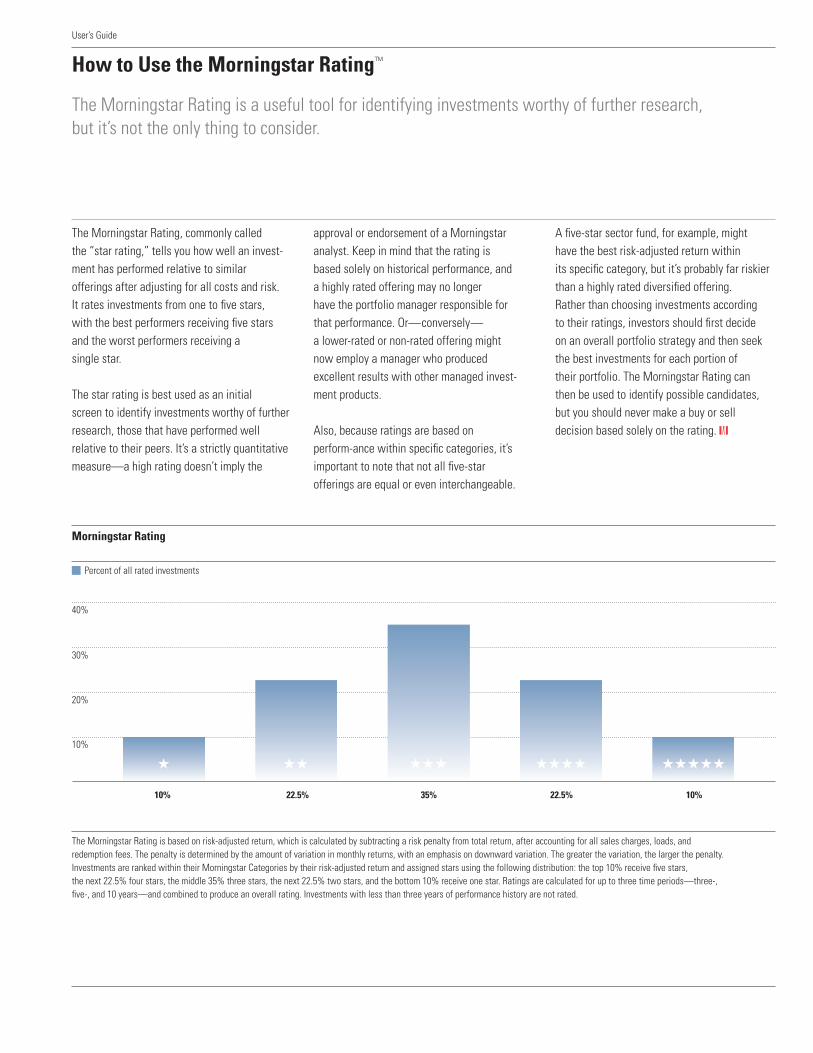
The Morningstar Rating, commonly called the “star rating,” tells you how well an invest-ment has performed relative to similar offerings after adjusting for all costs and risk. It rates investments from one to five stars, with the best performers receiving five stars and the worst performers receiving a single star.
The star rating is best used as an initial screen to identify investments worthy of further research, those that have performed well relative to their peers. It’s a strictly quantitative measure—a high rating doesn’t imply the
approval or endorsement of a Morningstar analyst. Keep in mind that the rating is based solely on historical performance, and a highly rated offering may no longer have the portfolio manager responsible for that performance. Or—conversely—a lower-rated or non-rated offering might now employ a manager who produced excellent results with other managed invest-ment products.
Also, because ratings are based on perform-ance within specific categories, it’s important to note that not all five-star offerings are equal or even interchangeable.
A five-star sector fund, for example, might have the best risk-adjusted return within its specific category, but it’s probably far riskier than a highly rated diversified offering. Rather than choosing investments according to their ratings, investors should first decide on an overall portfolio strategy and then seek the best investments for each portion of their portfolio. The Morningstar Rating can then be used to identify possible candidates, but you should never make a buy or sell decision based solely on the rating. K
How to Use the Morningstar RatingTM
The Morningstar Rating is a useful tool for identifying investments worthy of further research, but it’s not the only thing to consider.
The Morningstar Rating is based on risk-adjusted return, which is calculated by subtracting a risk penalty from total return, after accounting for all sales charges, loads, and redemption fees. The penalty is determined by the amount of variation in monthly returns, with an emphasis on downward variation. The greater the variation, the larger the penalty. Investments are ranked within their Morningstar Categories by their risk-adjusted return and assigned stars using the following distribution: the top 10% receive five stars, the next 22.5% four stars, the middle 35% three stars, the next 22.5% two stars, and the bottom 10% receive one star. Ratings are calculated for up to three time periods—three-, five-, and 10 years—and combined to produce an overall rating. Investments with less than three years of performance history are not rated.
Morningstar Rating
Percent of all rated investments
Q QQ QQQ QQQQ QQQQQ
10% 22.5% 22.5% 10%35%
40%
30%
20%
10%
User’s Guide
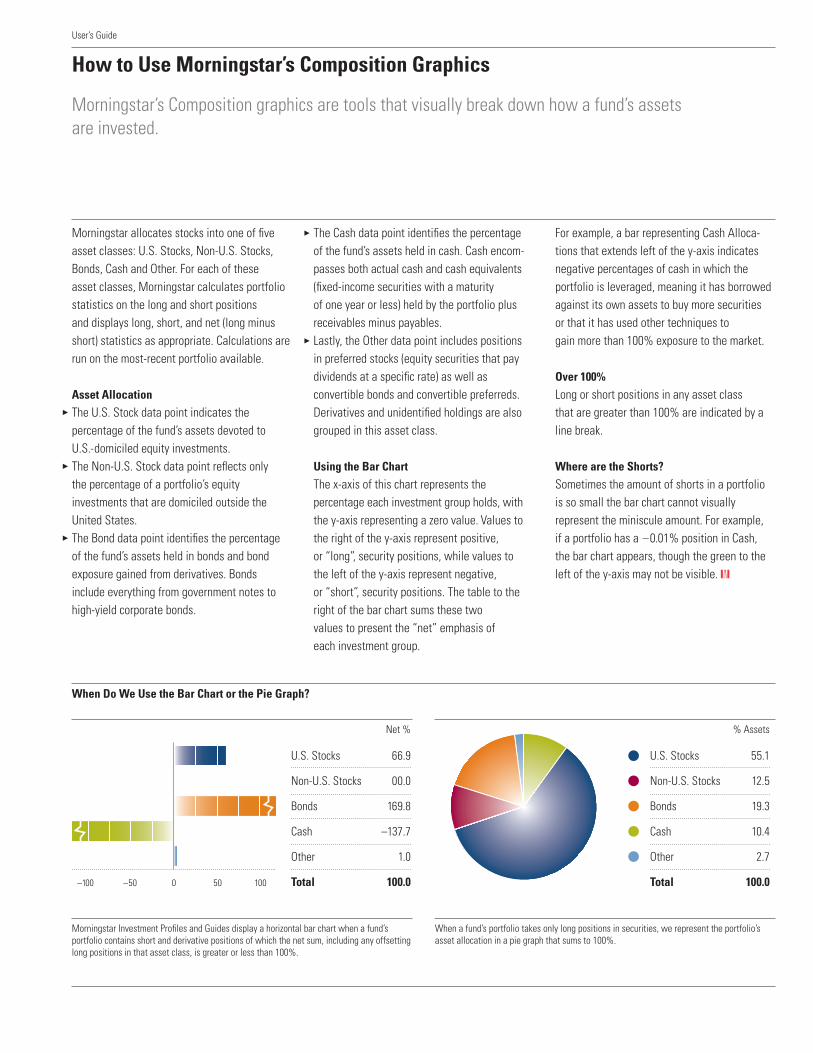
Morningstar allocates stocks into one of five asset classes: U.S. Stocks, Non-U.S. Stocks, Bonds, Cash and Other. For each of these asset classes, Morningstar calculates portfolio statistics on the long and short positions and displays long, short, and net (long minus short) statistics as appropriate. Calculations are run on the most-recent portfolio available.
Asset Allocation
The U.S. Stock data point indicates the percentage of the fund’s assets devoted to U.S.-domiciled equity investments. The Non-U.S. Stock data point reflects only the percentage of a portfolio’s equity investments that are domiciled outside the United States. The Bond data point identifies the percentage of the fund’s assets held in bonds and bond exposure gained from derivatives. Bonds include everything from government notes to high-yield corporate bonds.
The Cash data point identifies the percentage of the fund’s assets held in cash. Cash encom-passes both actual cash and cash equivalents (fixed-income securities with a maturity of one year or less) held by the portfolio plus receivables minus payables. Lastly, the Other data point includes positions in preferred stocks (equity securities that pay dividends at a specific rate) as well as convertible bonds and convertible preferreds. Derivatives and unidentified holdings are also grouped in this asset class.
Using the Bar Chart
The x-axis of this chart represents the percentage each investment group holds, with the y-axis representing a zero value. Values to the right of the y-axis represent positive, or “long”, security positions, while values to the left of the y-axis represent negative, or “short”, security positions. The table to the right of the bar chart sums these two values to present the “net” emphasis of each investment group.
For example, a bar representing Cash Alloca-tions that extends left of the y-axis indicates negative percentages of cash in which the portfolio is leveraged, meaning it has borrowed against its own assets to buy more securities or that it has used other techniques to gain more than 100% exposure to the market.
Over 100%
Long or short positions in any asset class that are greater than 100% are indicated by a line break.
Where are the Shorts?
Sometimes the amount of shorts in a portfolio is so small the bar chart cannot visually represent the miniscule amount. For example, if a portfolio has a –0.01% position in Cash, the bar chart appears, though the green to the left of the y-axis may not be visible. K
How to Use Morningstar’s Composition Graphics
Morningstar’s Composition graphics are tools that visually break down how a fund’s assets are invested.
Net % % Assets
100500–50–100
U.S. Stocks 66.9
Non-U.S. Stocks 00.0
Bonds 169.8
Cash –137.7
Other 1.0
Total 100.0
U.S. Stocks 55.1
Non-U.S. Stocks 12.5
Bonds 19.3
Cash 10.4
Other 2.7
Total 100.0
When Do We Use the Bar Chart or the Pie Graph?
Morningstar Investment Profiles and Guides display a horizontal bar chart when a fund’s portfolio contains short and derivative positions of which the net sum, including any offsetting long positions in that asset class, is greater or less than 100%.
When a fund’s portfolio takes only long positions in securities, we represent the portfolio’s asset allocation in a pie graph that sums to 100%.
3
3
3
3
3
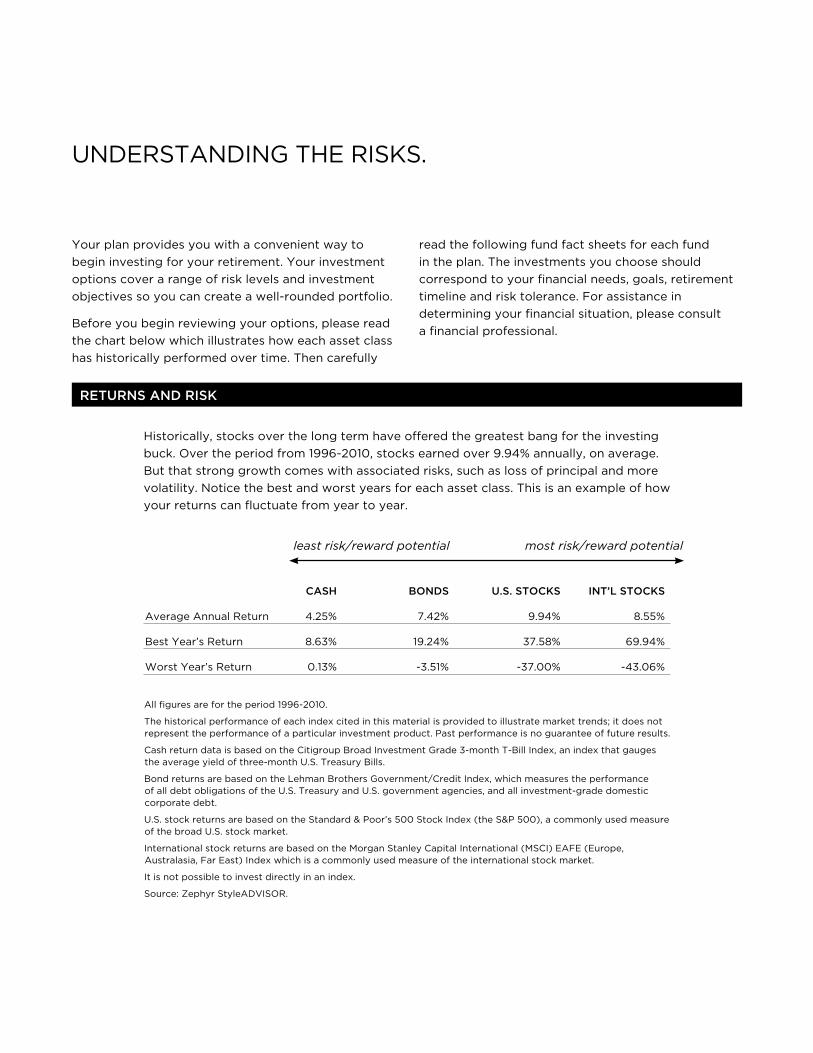
UNdeRStaNdiNg tHe RiSKS.
your plan provides you with a convenient way to begin investing for your retirement. your investment options cover a range of risk levels and investment objectives so you can create a well-rounded portfolio.
Before you begin reviewing your options, please read the chart below which illustrates how each asset class has historically performed over time. then carefully
read the following fund fact sheets for each fund in the plan. the investments you choose should correspond to your financial needs, goals, retirement timeline and risk tolerance. For assistance in determining your financial situation, please consult a financial professional.
rETurNS ANd rISk
Historically, stocks over the long term have offered the greatest bang for the investing buck. Over the period from 1996-2010, stocks earned over 9.94% annually, on average. But that strong growth comes with associated risks, such as loss of principal and more volatility. Notice the best and worst years for each asset class. this is an example of how your returns can fluctuate from year to year.
CASH BONdS u.S. STOCkS INT’l STOCkS
average annual Return 4.25% 7.42% 9.94% 8.55%
Best year’s Return 8.63% 19.24% 37.58% 69.94%
Worst year’s Return 0.13% -3.51% -37.00% -43.06%
all figures are for the period 1996-2010.
the historical performance of each index cited in this material is provided to illustrate market trends; it does not represent the performance of a particular investment product. Past performance is no guarantee of future results.
Cash return data is based on the Citigroup Broad investment grade 3-month t-Bill index, an index that gauges the average yield of three-month U.S. treasury Bills.
Bond returns are based on the lehman Brothers government/Credit index, which measures the performance of all debt obligations of the U.S. treasury and U.S. government agencies, and all investment-grade domestic corporate debt.
U.S. stock returns are based on the Standard & Poor’s 500 Stock index (the S&P 500), a commonly used measure of the broad U.S. stock market.
international stock returns are based on the morgan Stanley Capital international (mSCi) eaFe (europe, australasia, Far east) index which is a commonly used measure of the international stock market.
it is not possible to invest directly in an index.
Source: zephyr StyleadViSOR.
least risk/reward potential most risk/reward potential
e e eratd dNot FDIC Insured | May Lose Value | No Bank Guarantee
CO
LLEC
TIV
E IN
VES
TMEN
T
6/30/15
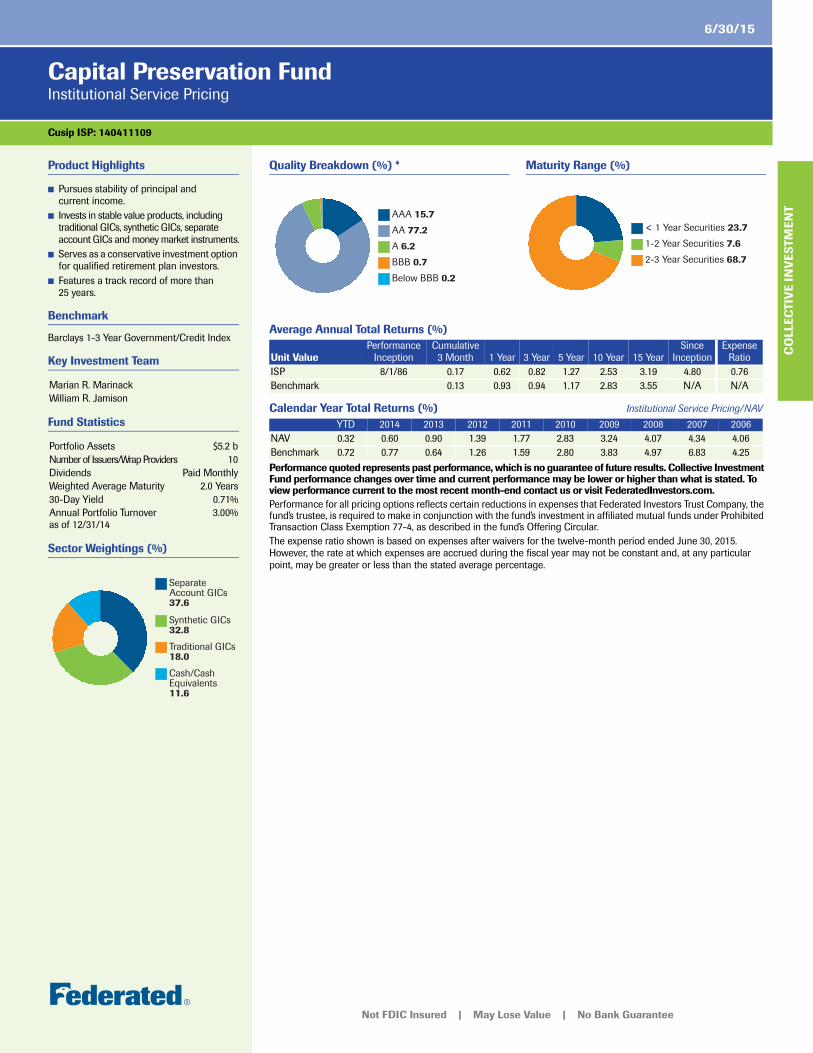
Capital Preservation FundInstitutional Service Pricing
Cusip ISP: 140411109
Product Highlights
■ Pursues stability of principal and current income.
■ Invests in stable value products, including traditional GICs, synthetic GICs, separate account GICs and money market instruments.
■ Serves as a conservative investment option for qualified retirement plan investors.
■ Features a track record of more than 25 years.
Benchmark
Barclays 1-3 Year Government/Credit Index
Key Investment Team
Fund Statistics
Sector Weightings (%)
Marian R. MarinackWilliam R. Jamison
Portfolio Assets $5.2 bNumber of Issuers/Wrap Providers 10Dividends Paid MonthlyWeighted Average Maturity 2.0 Years30-Day Yield 0.71%Annual Portfolio Turnover as of 12/31/14
3.00%
Cash/Cash Equivalents 11.6
Traditional GICs 18.0
Synthetic GICs 32.8
Separate Account GICs 37.6
Quality Breakdown (%) * Maturity Range (%)
Average Annual Total Returns (%)
Calendar Year Total Returns (%) Institutional Service Pricing/NAV
Performance quoted represents past performance, which is no guarantee of future results. Collective Investment Fund performance changes over time and current performance may be lower or higher than what is stated. To view performance current to the most recent month-end contact us or visit FederatedInvestors.com. Performance for all pricing options reflects certain reductions in expenses that Federated Investors Trust Company, the fund’s trustee, is required to make in conjunction with the fund’s investment in affiliated mutual funds under Prohibited Transaction Class Exemption 77-4, as described in the fund’s Offering Circular. The expense ratio shown is based on expenses after waivers for the twelve-month period ended June 30, 2015. However, the rate at which expenses are accrued during the fiscal year may not be constant and, at any particular point, may be greater or less than the stated average percentage.
Below BBB 0.2
BBB 0.7
A 6.2
AA 77.2
AAA 15.7
2-3 Year Securities 68.7
1-2 Year Securities 7.6
< 1 Year Securities 23.7
Unit ValuePerformance
InceptionCumulative
3 Month 1 Year 3 Year 5 Year 10 Year 15 YearSince
InceptionExpense
RatioISP 8/1/86 0.17 0.62 0.82 1.27 2.53 3.19 4.80 0.76Benchmark 0.13 0.93 0.94 1.17 2.83 3.55 N/A N/A
YTD 2014 2013 2012 2011 2010 2009 2008 2007 2006NAV 0.32 0.60 0.90 1.39 1.77 2.83 3.24 4.07 4.34 4.06Benchmark 0.72 0.77 0.64 1.26 1.59 2.80 3.83 4.97 6.83 4.25
Federated Investors Tower, 1001 Liberty Avenue, Pittsburgh, PA 15222-3779, 1-800-341-7400, FederatedInvestors.comFederated Investors Trust Company Federated is a registered trademark of Federated Investors, Inc. 2015 ©Federated Investors, Inc.
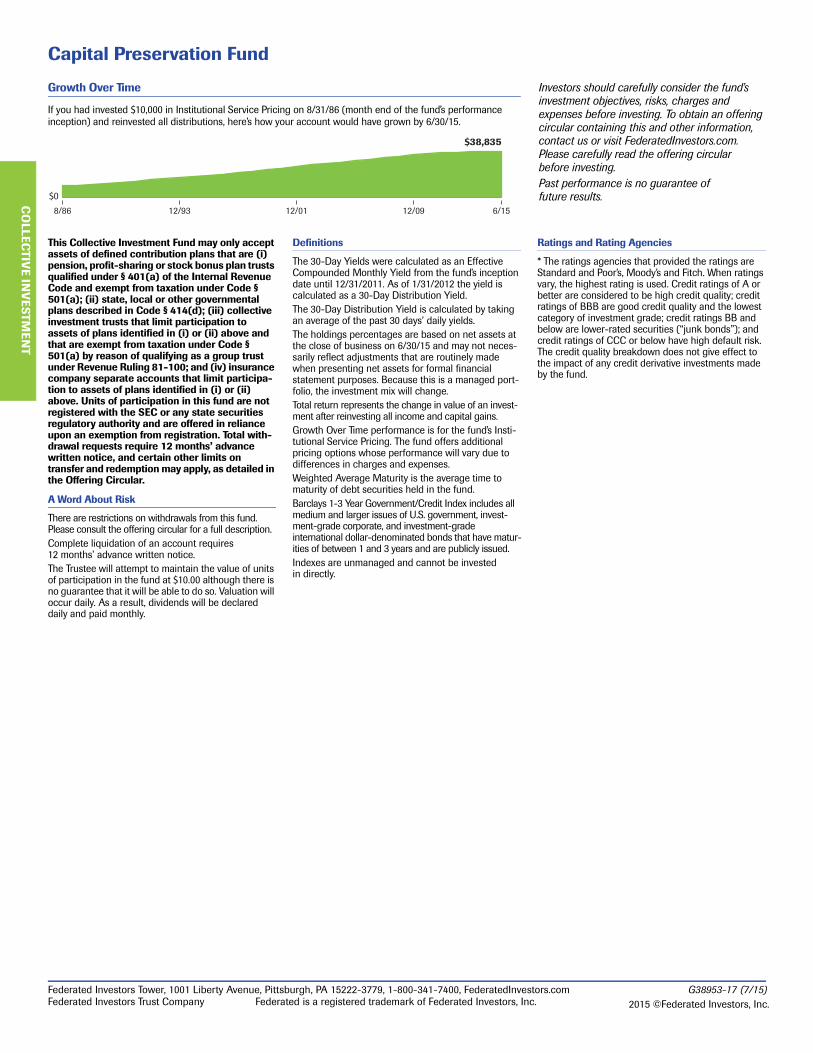
Capital Preservation Fund
CO
LLECTIV
E INV
ESTMEN
T
Growth Over Time
If you had invested $10,000 in Institutional Service Pricing on 8/31/86 (month end of the fund’s performance inception) and reinvested all distributions, here’s how your account would have grown by 6/30/15.
$0
$38,835
8/86 12/0112/93 12/09 6/15
Investors should carefully consider the fund’s investment objectives, risks, charges and expenses before investing. To obtain an offering circular containing this and other information, contact us or visit FederatedInvestors.com. Please carefully read the offering circular before investing.Past performance is no guarantee of future results.
This Collective Investment Fund may only accept assets of defined contribution plans that are (i) pension, profit-sharing or stock bonus plan trusts qualified under § 401(a) of the Internal Revenue Code and exempt from taxation under Code § 501(a); (ii) state, local or other governmental plans described in Code § 414(d); (iii) collective investment trusts that limit participation to assets of plans identified in (i) or (ii) above and that are exempt from taxation under Code § 501(a) by reason of qualifying as a group trust under Revenue Ruling 81-100; and (iv) insurance company separate accounts that limit participa-tion to assets of plans identified in (i) or (ii) above. Units of participation in this fund are not registered with the SEC or any state securities regulatory authority and are offered in reliance upon an exemption from registration. Total with-drawal requests require 12 months’ advance written notice, and certain other limits on transfer and redemption may apply, as detailed in the Offering Circular.
A Word About Risk
There are restrictions on withdrawals from this fund. Please consult the offering circular for a full description.Complete liquidation of an account requires 12 months’ advance written notice.The Trustee will attempt to maintain the value of units of participation in the fund at $10.00 although there is no guarantee that it will be able to do so. Valuation will occur daily. As a result, dividends will be declared daily and paid monthly.
Definitions
The 30-Day Yields were calculated as an Effective Compounded Monthly Yield from the fund’s inception date until 12/31/2011. As of 1/31/2012 the yield is calculated as a 30-Day Distribution Yield.The 30-Day Distribution Yield is calculated by taking an average of the past 30 days’ daily yields.The holdings percentages are based on net assets at the close of business on 6/30/15 and may not neces-sarily reflect adjustments that are routinely made when presenting net assets for formal financial statement purposes. Because this is a managed port-folio, the investment mix will change.Total return represents the change in value of an invest-ment after reinvesting all income and capital gains.Growth Over Time performance is for the fund’s Insti-tutional Service Pricing. The fund offers additional pricing options whose performance will vary due to differences in charges and expenses.Weighted Average Maturity is the average time to maturity of debt securities held in the fund. Barclays 1-3 Year Government/Credit Index includes all medium and larger issues of U.S. government, invest-ment-grade corporate, and investment-grade international dollar-denominated bonds that have matur-ities of between 1 and 3 years and are publicly issued. Indexes are unmanaged and cannot be invested in directly.
Ratings and Rating Agencies
* The ratings agencies that provided the ratings are Standard and Poor’s, Moody’s and Fitch. When ratings vary, the highest rating is used. Credit ratings of A or better are considered to be high credit quality; credit ratings of BBB are good credit quality and the lowest category of investment grade; credit ratings BB and below are lower-rated securities (“junk bonds”); and credit ratings of CCC or below have high default risk. The credit quality breakdown does not give effect to the impact of any credit derivative investments made by the fund.
G38953-17 (7/15)
Release Date: 06-30-2015
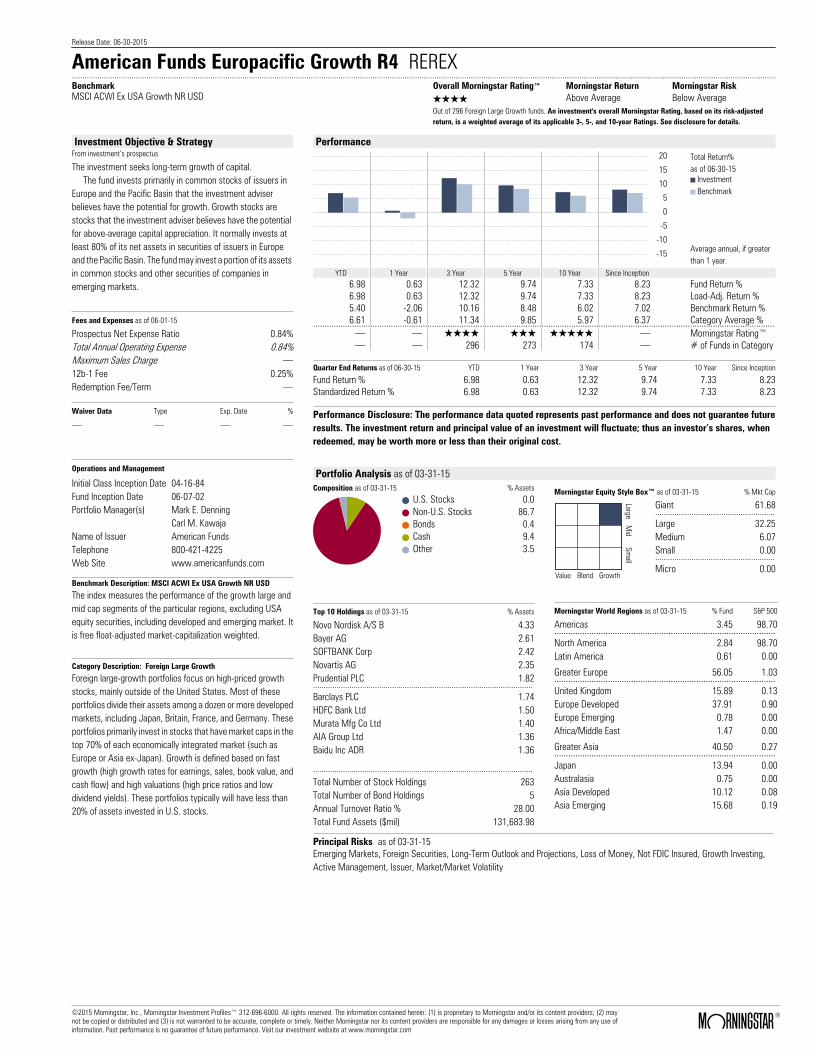
American Funds Europacific Growth R4 REREX ..........................................................................................................................................................................................................................................................................................................................................BenchmarkMSCI ACWI Ex USA Growth NR USD
Overall Morningstar Rating™ Morningstar Return Morningstar RiskQQQQ Above Average Below AverageOut of 296 Foreign Large Growth funds. An investment's overall Morningstar Rating, based on its risk-adjustedreturn, is a weighted average of its applicable 3-, 5-, and 10-year Ratings. See disclosure for details.
Investment Objective & StrategyFrom investment’s prospectus
The investment seeks long-term growth of capital. The fund invests primarily in common stocks of issuers in Europe and the Pacific Basin that the investment adviser believes have the potential for growth. Growth stocks are stocks that the investment adviser believes have the potential for above-average capital appreciation. It normally invests at least 80% of its net assets in securities of issuers in Europe and the Pacific Basin. The fund may invest a portion of its assets in common stocks and other securities of companies in emerging markets.
Fees and Expenses as of 06-01-15
Prospectus Net Expense Ratio 0.84%Total Annual Operating Expense 0.84%Maximum Sales Charge .12b-1 Fee 0.25%Redemption Fee/Term .
Waiver Data Type Exp. Date %
. . . .
Operations and Management
Initial Class Inception Date 04-16-84Fund Inception Date 06-07-02Portfolio Manager(s) Mark E. Denning
Carl M. KawajaName of Issuer American FundsTelephone 800-421-4225Web Site www.americanfunds.com
Benchmark Description: MSCI ACWI Ex USA Growth NR USD
The index measures the performance of the growth large andmid cap segments of the particular regions, excluding USAequity securities, including developed and emerging market. Itis free float-adjusted market-capitalization weighted.
Category Description: Foreign Large Growth
Foreign large-growth portfolios focus on high-priced growthstocks, mainly outside of the United States. Most of theseportfolios divide their assets among a dozen or more developedmarkets, including Japan, Britain, France, and Germany. Theseportfolios primarily invest in stocks that have market caps in thetop 70% of each economically integrated market (such asEurope or Asia ex-Japan). Growth is defined based on fastgrowth (high growth rates for earnings, sales, book value, andcash flow) and high valuations (high price ratios and lowdividend yields). These portfolios typically will have less than20% of assets invested in U.S. stocks.
Performance
5
10
15
20
0
-5
-10
-15
YTD YTD YTD YTD YTD YTD
Total Return%as of 06-30-15
InvestmentBenchmark
Average annual, if greaterthan 1 year.
YTD 1 Year 3 Year 5 Year 10 Year Since Inception6.98 0.63 12.32 9.74 7.33 8.23 Fund Return %6.98 0.63 12.32 9.74 7.33 8.23 Load-Adj. Return %5.40 -2.06 10.16 8.48 6.02 7.02 Benchmark Return %6.61 -0.61 11.34 9.85 5.97 6.37 Category Average %........................................................................................................................................................................................................... . QQQQ QQQ QQQQQ . Morningstar Rating™. . 296 273 174 . # of Funds in Category
Quarter End Returns as of 06-30-15 YTD 1 Year 3 Year 5 Year 10 Year Since Inception
Fund Return % 6.98 0.63 12.32 9.74 7.33 8.23Standardized Return % 6.98 0.63 12.32 9.74 7.33 8.23
Performance Disclosure: The performance data quoted represents past performance and does not guarantee futureresults. The investment return and principal value of an investment will fluctuate; thus an investor’s shares, whenredeemed, may be worth more or less than their original cost.
Portfolio Analysis as of 03-31-15Composition as of 03-31-15 % Assets
U.S. Stocks 0.0Non-U.S. Stocks 86.7Bonds 0.4Cash 9.4Other 3.5
Morningstar Equity Style Box™ as of 03-31-15 % Mkt Cap
LargeM
idSm
all
Value Blend Growth
Giant 61.68........................................................Large 32.25Medium 6.07Small 0.00........................................................Micro 0.00
Top 10 Holdings as of 03-31-15 % Assets
Novo Nordisk A/S B 4.33Bayer AG 2.61SOFTBANK Corp 2.42Novartis AG 2.35Prudential PLC 1.82.......................................................................................................Barclays PLC 1.74HDFC Bank Ltd 1.50Murata Mfg Co Ltd 1.40AIA Group Ltd 1.36Baidu Inc ADR 1.36
.......................................................................................................Total Number of Stock Holdings 263Total Number of Bond Holdings 5Annual Turnover Ratio % 28.00Total Fund Assets ($mil) 131,683.98
Morningstar World Regions as of 03-31-15 % Fund S&P 500
Americas 3.45 98.70...............................................................................................North America 2.84 98.70Latin America 0.61 0.00
Greater Europe 56.05 1.03...............................................................................................United Kingdom 15.89 0.13Europe Developed 37.91 0.90Europe Emerging 0.78 0.00Africa/Middle East 1.47 0.00
Greater Asia 40.50 0.27...............................................................................................Japan 13.94 0.00Australasia 0.75 0.00Asia Developed 10.12 0.08Asia Emerging 15.68 0.19
Principal Risks as of 03-31-15Emerging Markets, Foreign Securities, Long-Term Outlook and Projections, Loss of Money, Not FDIC Insured, Growth Investing,Active Management, Issuer, Market/Market Volatility
©2015 Morningstar, Inc., Morningstar Investment Profiles™ 312-696-6000. All rights reserved. The information contained herein: (1) is proprietary to Morningstar and/or its content providers; (2) maynot be copied or distributed and (3) is not warranted to be accurate, complete or timely. Neither Morningstar nor its content providers are responsible for any damages or losses arising from any use ofinformation. Past performance is no guarantee of future performance. Visit our investment website at www.morningstar.com ß
®
Release Date: 06-30-2015
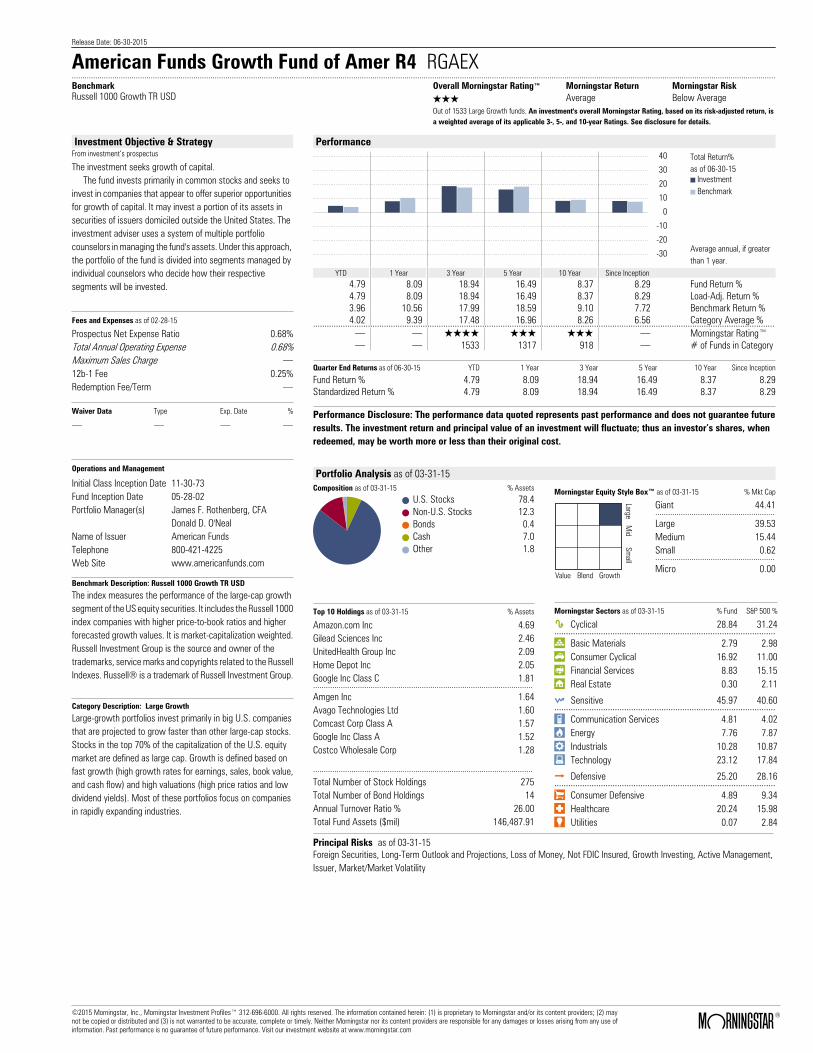
American Funds Growth Fund of Amer R4 RGAEX ..........................................................................................................................................................................................................................................................................................................................................BenchmarkRussell 1000 Growth TR USD
Overall Morningstar Rating™ Morningstar Return Morningstar RiskQQQ Average Below AverageOut of 1533 Large Growth funds. An investment's overall Morningstar Rating, based on its risk-adjusted return, isa weighted average of its applicable 3-, 5-, and 10-year Ratings. See disclosure for details.
Investment Objective & StrategyFrom investment’s prospectus
The investment seeks growth of capital. The fund invests primarily in common stocks and seeks to invest in companies that appear to offer superior opportunities for growth of capital. It may invest a portion of its assets in securities of issuers domiciled outside the United States. The investment adviser uses a system of multiple portfolio counselors in managing the fund's assets. Under this approach, the portfolio of the fund is divided into segments managed by individual counselors who decide how their respective segments will be invested.
Fees and Expenses as of 02-28-15
Prospectus Net Expense Ratio 0.68%Total Annual Operating Expense 0.68%Maximum Sales Charge .12b-1 Fee 0.25%Redemption Fee/Term .
Waiver Data Type Exp. Date %
. . . .
Operations and Management
Initial Class Inception Date 11-30-73Fund Inception Date 05-28-02Portfolio Manager(s) James F. Rothenberg, CFA
Donald D. O'NealName of Issuer American FundsTelephone 800-421-4225Web Site www.americanfunds.com
Benchmark Description: Russell 1000 Growth TR USD
The index measures the performance of the large-cap growthsegment of the US equity securities. It includes the Russell 1000index companies with higher price-to-book ratios and higherforecasted growth values. It is market-capitalization weighted.Russell Investment Group is the source and owner of thetrademarks, service marks and copyrights related to the RussellIndexes. Russell® is a trademark of Russell Investment Group.
Category Description: Large Growth
Large-growth portfolios invest primarily in big U.S. companiesthat are projected to grow faster than other large-cap stocks.Stocks in the top 70% of the capitalization of the U.S. equitymarket are defined as large cap. Growth is defined based onfast growth (high growth rates for earnings, sales, book value,and cash flow) and high valuations (high price ratios and lowdividend yields). Most of these portfolios focus on companiesin rapidly expanding industries.
Performance
10
20
30
40
0
-10
-20
-30
YTD YTD YTD YTD YTD YTD
Total Return%as of 06-30-15
InvestmentBenchmark
Average annual, if greaterthan 1 year.
YTD 1 Year 3 Year 5 Year 10 Year Since Inception4.79 8.09 18.94 16.49 8.37 8.29 Fund Return %4.79 8.09 18.94 16.49 8.37 8.29 Load-Adj. Return %3.96 10.56 17.99 18.59 9.10 7.72 Benchmark Return %4.02 9.39 17.48 16.96 8.26 6.56 Category Average %........................................................................................................................................................................................................... . QQQQ QQQ QQQ . Morningstar Rating™. . 1533 1317 918 . # of Funds in Category
Quarter End Returns as of 06-30-15 YTD 1 Year 3 Year 5 Year 10 Year Since Inception
Fund Return % 4.79 8.09 18.94 16.49 8.37 8.29Standardized Return % 4.79 8.09 18.94 16.49 8.37 8.29
Performance Disclosure: The performance data quoted represents past performance and does not guarantee futureresults. The investment return and principal value of an investment will fluctuate; thus an investor’s shares, whenredeemed, may be worth more or less than their original cost.
Portfolio Analysis as of 03-31-15Composition as of 03-31-15 % Assets
U.S. Stocks 78.4Non-U.S. Stocks 12.3Bonds 0.4Cash 7.0Other 1.8
Morningstar Equity Style Box™ as of 03-31-15 % Mkt Cap
LargeM
idSm
all
Value Blend Growth
Giant 44.41........................................................Large 39.53Medium 15.44Small 0.62........................................................Micro 0.00
Top 10 Holdings as of 03-31-15 % Assets
Amazon.com Inc 4.69Gilead Sciences Inc 2.46UnitedHealth Group Inc 2.09Home Depot Inc 2.05Google Inc Class C 1.81.......................................................................................................Amgen Inc 1.64Avago Technologies Ltd 1.60Comcast Corp Class A 1.57Google Inc Class A 1.52Costco Wholesale Corp 1.28
.......................................................................................................Total Number of Stock Holdings 275Total Number of Bond Holdings 14Annual Turnover Ratio % 26.00Total Fund Assets ($mil) 146,487.91
Morningstar Sectors as of 03-31-15 % Fund S&P 500 %
h Cyclical 28.84 31.24...............................................................................................r Basic Materials 2.79 2.98t Consumer Cyclical 16.92 11.00y Financial Services 8.83 15.15u Real Estate 0.30 2.11
j Sensitive 45.97 40.60...............................................................................................i Communication Services 4.81 4.02o Energy 7.76 7.87p Industrials 10.28 10.87a Technology 23.12 17.84
k Defensive 25.20 28.16...............................................................................................s Consumer Defensive 4.89 9.34d Healthcare 20.24 15.98f Utilities 0.07 2.84
Principal Risks as of 03-31-15Foreign Securities, Long-Term Outlook and Projections, Loss of Money, Not FDIC Insured, Growth Investing, Active Management,Issuer, Market/Market Volatility
©2015 Morningstar, Inc., Morningstar Investment Profiles™ 312-696-6000. All rights reserved. The information contained herein: (1) is proprietary to Morningstar and/or its content providers; (2) maynot be copied or distributed and (3) is not warranted to be accurate, complete or timely. Neither Morningstar nor its content providers are responsible for any damages or losses arising from any use ofinformation. Past performance is no guarantee of future performance. Visit our investment website at www.morningstar.com ß
®
Release Date: 06-30-2015
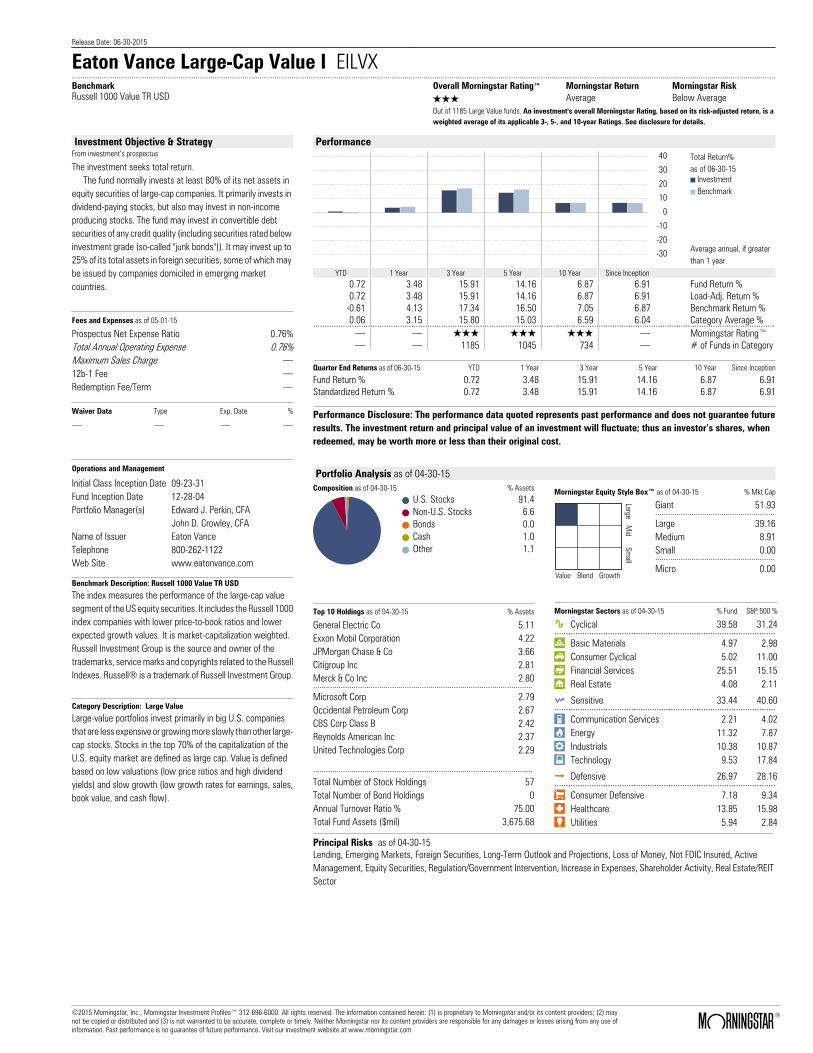
Eaton Vance Large-Cap Value I EILVX ..........................................................................................................................................................................................................................................................................................................................................BenchmarkRussell 1000 Value TR USD
Overall Morningstar Rating™ Morningstar Return Morningstar RiskQQQ Average Below AverageOut of 1185 Large Value funds. An investment's overall Morningstar Rating, based on its risk-adjusted return, is aweighted average of its applicable 3-, 5-, and 10-year Ratings. See disclosure for details.
Investment Objective & StrategyFrom investment’s prospectus
The investment seeks total return. The fund normally invests at least 80% of its net assets in equity securities of large-cap companies. It primarily invests in dividend-paying stocks, but also may invest in non-income producing stocks. The fund may invest in convertible debt securities of any credit quality (including securities rated below investment grade (so-called "junk bonds")). It may invest up to 25% of its total assets in foreign securities, some of which may be issued by companies domiciled in emerging market countries.
Fees and Expenses as of 05-01-15
Prospectus Net Expense Ratio 0.76%Total Annual Operating Expense 0.76%Maximum Sales Charge .12b-1 Fee .Redemption Fee/Term .
Waiver Data Type Exp. Date %
. . . .
Operations and Management
Initial Class Inception Date 09-23-31Fund Inception Date 12-28-04Portfolio Manager(s) Edward J. Perkin, CFA
John D. Crowley, CFAName of Issuer Eaton VanceTelephone 800-262-1122Web Site www.eatonvance.com
Benchmark Description: Russell 1000 Value TR USD
The index measures the performance of the large-cap valuesegment of the US equity securities. It includes the Russell 1000index companies with lower price-to-book ratios and lowerexpected growth values. It is market-capitalization weighted.Russell Investment Group is the source and owner of thetrademarks, service marks and copyrights related to the RussellIndexes. Russell® is a trademark of Russell Investment Group.
Category Description: Large Value
Large-value portfolios invest primarily in big U.S. companiesthat are less expensive or growing more slowly than other large-cap stocks. Stocks in the top 70% of the capitalization of theU.S. equity market are defined as large cap. Value is definedbased on low valuations (low price ratios and high dividendyields) and slow growth (low growth rates for earnings, sales,book value, and cash flow).
Performance
10
20
30
40
0
-10
-20
-30
YTD YTD YTD YTD YTD YTD
Total Return%as of 06-30-15
InvestmentBenchmark
Average annual, if greaterthan 1 year.
YTD 1 Year 3 Year 5 Year 10 Year Since Inception0.72 3.48 15.91 14.16 6.87 6.91 Fund Return %0.72 3.48 15.91 14.16 6.87 6.91 Load-Adj. Return %
-0.61 4.13 17.34 16.50 7.05 6.87 Benchmark Return %0.06 3.15 15.80 15.03 6.59 6.04 Category Average %........................................................................................................................................................................................................... . QQQ QQQ QQQ . Morningstar Rating™. . 1185 1045 734 . # of Funds in Category
Quarter End Returns as of 06-30-15 YTD 1 Year 3 Year 5 Year 10 Year Since Inception
Fund Return % 0.72 3.48 15.91 14.16 6.87 6.91Standardized Return % 0.72 3.48 15.91 14.16 6.87 6.91
Performance Disclosure: The performance data quoted represents past performance and does not guarantee futureresults. The investment return and principal value of an investment will fluctuate; thus an investor’s shares, whenredeemed, may be worth more or less than their original cost.
Portfolio Analysis as of 04-30-15Composition as of 04-30-15 % Assets
U.S. Stocks 91.4Non-U.S. Stocks 6.6Bonds 0.0Cash 1.0Other 1.1
Morningstar Equity Style Box™ as of 04-30-15 % Mkt Cap
LargeM
idSm
all
Value Blend Growth
Giant 51.93........................................................Large 39.16Medium 8.91Small 0.00........................................................Micro 0.00
Top 10 Holdings as of 04-30-15 % Assets
General Electric Co 5.11Exxon Mobil Corporation 4.22JPMorgan Chase & Co 3.66Citigroup Inc 2.81Merck & Co Inc 2.80.......................................................................................................Microsoft Corp 2.79Occidental Petroleum Corp 2.67CBS Corp Class B 2.42Reynolds American Inc 2.37United Technologies Corp 2.29
.......................................................................................................Total Number of Stock Holdings 57Total Number of Bond Holdings 0Annual Turnover Ratio % 75.00Total Fund Assets ($mil) 3,675.68
Morningstar Sectors as of 04-30-15 % Fund S&P 500 %
h Cyclical 39.58 31.24...............................................................................................r Basic Materials 4.97 2.98t Consumer Cyclical 5.02 11.00y Financial Services 25.51 15.15u Real Estate 4.08 2.11
j Sensitive 33.44 40.60...............................................................................................i Communication Services 2.21 4.02o Energy 11.32 7.87p Industrials 10.38 10.87a Technology 9.53 17.84
k Defensive 26.97 28.16...............................................................................................s Consumer Defensive 7.18 9.34d Healthcare 13.85 15.98f Utilities 5.94 2.84
Principal Risks as of 04-30-15Lending, Emerging Markets, Foreign Securities, Long-Term Outlook and Projections, Loss of Money, Not FDIC Insured, ActiveManagement, Equity Securities, Regulation/Government Intervention, Increase in Expenses, Shareholder Activity, Real Estate/REITSector
©2015 Morningstar, Inc., Morningstar Investment Profiles™ 312-696-6000. All rights reserved. The information contained herein: (1) is proprietary to Morningstar and/or its content providers; (2) maynot be copied or distributed and (3) is not warranted to be accurate, complete or timely. Neither Morningstar nor its content providers are responsible for any damages or losses arising from any use ofinformation. Past performance is no guarantee of future performance. Visit our investment website at www.morningstar.com ß
®
Release Date: 06-30-2015
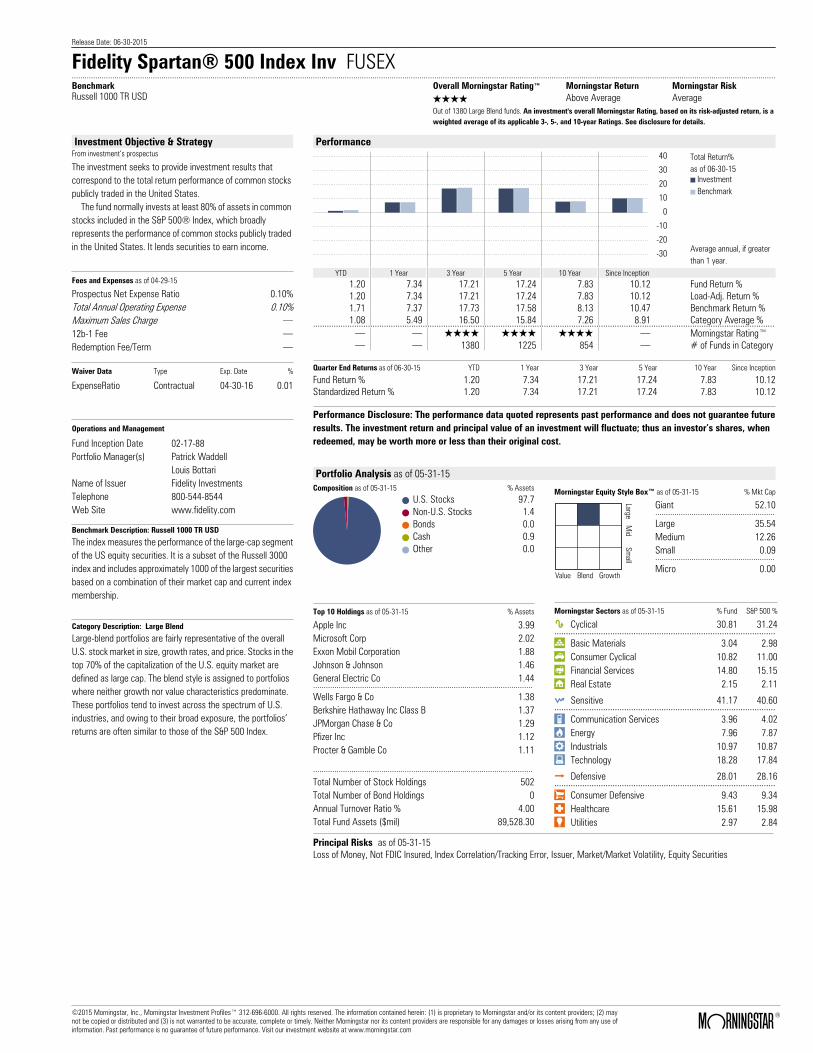
Fidelity Spartan® 500 Index Inv FUSEX ..........................................................................................................................................................................................................................................................................................................................................BenchmarkRussell 1000 TR USD
Overall Morningstar Rating™ Morningstar Return Morningstar RiskQQQQ Above Average AverageOut of 1380 Large Blend funds. An investment's overall Morningstar Rating, based on its risk-adjusted return, is aweighted average of its applicable 3-, 5-, and 10-year Ratings. See disclosure for details.
Investment Objective & StrategyFrom investment’s prospectus
The investment seeks to provide investment results that correspond to the total return performance of common stocks publicly traded in the United States. The fund normally invests at least 80% of assets in common stocks included in the S&P 500® Index, which broadly represents the performance of common stocks publicly traded in the United States. It lends securities to earn income.
Fees and Expenses as of 04-29-15
Prospectus Net Expense Ratio 0.10%Total Annual Operating Expense 0.10%Maximum Sales Charge .12b-1 Fee .Redemption Fee/Term .
Waiver Data Type Exp. Date %
ExpenseRatio Contractual 04-30-16 0.01
Operations and Management
Fund Inception Date 02-17-88Portfolio Manager(s) Patrick Waddell
Louis BottariName of Issuer Fidelity InvestmentsTelephone 800-544-8544Web Site www.fidelity.com
Benchmark Description: Russell 1000 TR USD
The index measures the performance of the large-cap segmentof the US equity securities. It is a subset of the Russell 3000index and includes approximately 1000 of the largest securitiesbased on a combination of their market cap and current indexmembership.
Category Description: Large Blend
Large-blend portfolios are fairly representative of the overallU.S. stock market in size, growth rates, and price. Stocks in thetop 70% of the capitalization of the U.S. equity market aredefined as large cap. The blend style is assigned to portfolioswhere neither growth nor value characteristics predominate.These portfolios tend to invest across the spectrum of U.S.industries, and owing to their broad exposure, the portfolios’returns are often similar to those of the S&P 500 Index.
Performance
10
20
30
40
0
-10
-20
-30
YTD YTD YTD YTD YTD YTD
Total Return%as of 06-30-15
InvestmentBenchmark
Average annual, if greaterthan 1 year.
YTD 1 Year 3 Year 5 Year 10 Year Since Inception1.20 7.34 17.21 17.24 7.83 10.12 Fund Return %1.20 7.34 17.21 17.24 7.83 10.12 Load-Adj. Return %1.71 7.37 17.73 17.58 8.13 10.47 Benchmark Return %1.08 5.49 16.50 15.84 7.26 8.91 Category Average %........................................................................................................................................................................................................... . QQQQ QQQQ QQQQ . Morningstar Rating™. . 1380 1225 854 . # of Funds in Category
Quarter End Returns as of 06-30-15 YTD 1 Year 3 Year 5 Year 10 Year Since Inception
Fund Return % 1.20 7.34 17.21 17.24 7.83 10.12Standardized Return % 1.20 7.34 17.21 17.24 7.83 10.12
Performance Disclosure: The performance data quoted represents past performance and does not guarantee futureresults. The investment return and principal value of an investment will fluctuate; thus an investor’s shares, whenredeemed, may be worth more or less than their original cost.
Portfolio Analysis as of 05-31-15Composition as of 05-31-15 % Assets
U.S. Stocks 97.7Non-U.S. Stocks 1.4Bonds 0.0Cash 0.9Other 0.0
Morningstar Equity Style Box™ as of 05-31-15 % Mkt Cap
LargeM
idSm
all
Value Blend Growth
Giant 52.10........................................................Large 35.54Medium 12.26Small 0.09........................................................Micro 0.00
Top 10 Holdings as of 05-31-15 % Assets
Apple Inc 3.99Microsoft Corp 2.02Exxon Mobil Corporation 1.88Johnson & Johnson 1.46General Electric Co 1.44.......................................................................................................Wells Fargo & Co 1.38Berkshire Hathaway Inc Class B 1.37JPMorgan Chase & Co 1.29Pfizer Inc 1.12Procter & Gamble Co 1.11
.......................................................................................................Total Number of Stock Holdings 502Total Number of Bond Holdings 0Annual Turnover Ratio % 4.00Total Fund Assets ($mil) 89,528.30
Morningstar Sectors as of 05-31-15 % Fund S&P 500 %
h Cyclical 30.81 31.24...............................................................................................r Basic Materials 3.04 2.98t Consumer Cyclical 10.82 11.00y Financial Services 14.80 15.15u Real Estate 2.15 2.11
j Sensitive 41.17 40.60...............................................................................................i Communication Services 3.96 4.02o Energy 7.96 7.87p Industrials 10.97 10.87a Technology 18.28 17.84
k Defensive 28.01 28.16...............................................................................................s Consumer Defensive 9.43 9.34d Healthcare 15.61 15.98f Utilities 2.97 2.84
Principal Risks as of 05-31-15Loss of Money, Not FDIC Insured, Index Correlation/Tracking Error, Issuer, Market/Market Volatility, Equity Securities
©2015 Morningstar, Inc., Morningstar Investment Profiles™ 312-696-6000. All rights reserved. The information contained herein: (1) is proprietary to Morningstar and/or its content providers; (2) maynot be copied or distributed and (3) is not warranted to be accurate, complete or timely. Neither Morningstar nor its content providers are responsible for any damages or losses arising from any use ofinformation. Past performance is no guarantee of future performance. Visit our investment website at www.morningstar.com ß
®
Release Date: 06-30-2015
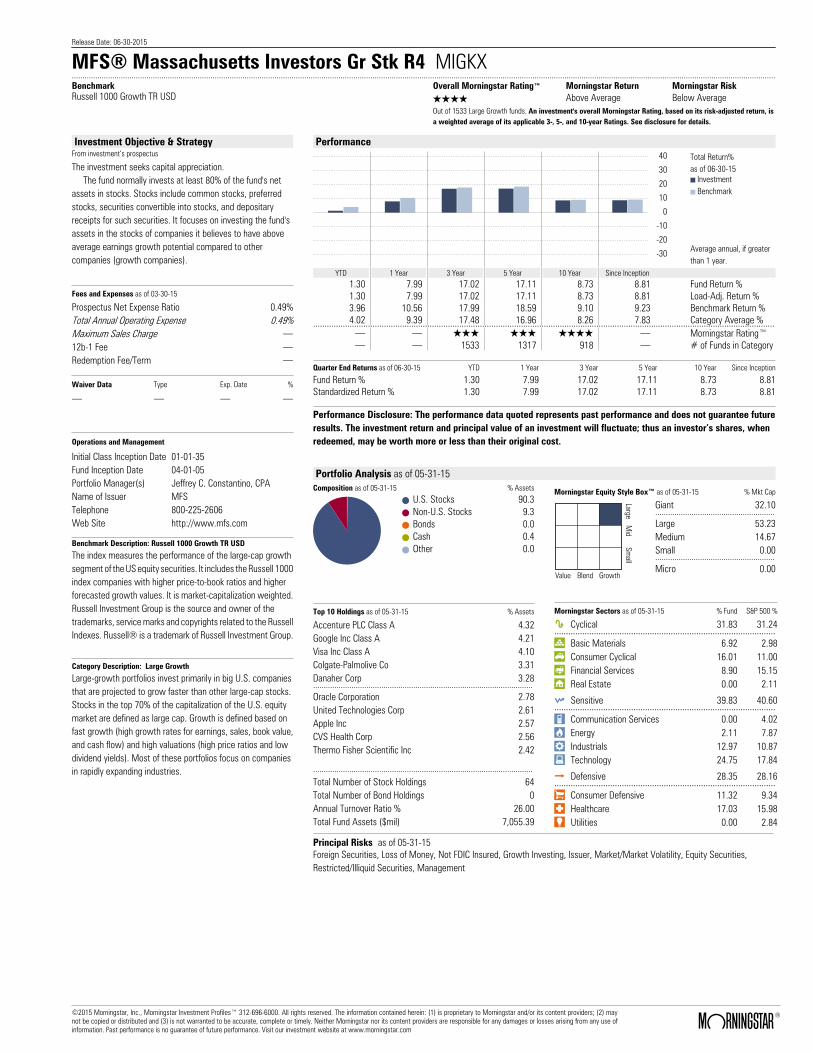
MFS® Massachusetts Investors Gr Stk R4 MIGKX ..........................................................................................................................................................................................................................................................................................................................................BenchmarkRussell 1000 Growth TR USD
Overall Morningstar Rating™ Morningstar Return Morningstar RiskQQQQ Above Average Below AverageOut of 1533 Large Growth funds. An investment's overall Morningstar Rating, based on its risk-adjusted return, isa weighted average of its applicable 3-, 5-, and 10-year Ratings. See disclosure for details.
Investment Objective & StrategyFrom investment’s prospectus
The investment seeks capital appreciation. The fund normally invests at least 80% of the fund's net assets in stocks. Stocks include common stocks, preferred stocks, securities convertible into stocks, and depositary receipts for such securities. It focuses on investing the fund's assets in the stocks of companies it believes to have above average earnings growth potential compared to other companies (growth companies).
Fees and Expenses as of 03-30-15
Prospectus Net Expense Ratio 0.49%Total Annual Operating Expense 0.49%Maximum Sales Charge .12b-1 Fee .Redemption Fee/Term .
Waiver Data Type Exp. Date %
. . . .
Operations and Management
Initial Class Inception Date 01-01-35Fund Inception Date 04-01-05Portfolio Manager(s) Jeffrey C. Constantino, CPAName of Issuer MFSTelephone 800-225-2606Web Site http://www.mfs.com
Benchmark Description: Russell 1000 Growth TR USD
The index measures the performance of the large-cap growthsegment of the US equity securities. It includes the Russell 1000index companies with higher price-to-book ratios and higherforecasted growth values. It is market-capitalization weighted.Russell Investment Group is the source and owner of thetrademarks, service marks and copyrights related to the RussellIndexes. Russell® is a trademark of Russell Investment Group.
Category Description: Large Growth
Large-growth portfolios invest primarily in big U.S. companiesthat are projected to grow faster than other large-cap stocks.Stocks in the top 70% of the capitalization of the U.S. equitymarket are defined as large cap. Growth is defined based onfast growth (high growth rates for earnings, sales, book value,and cash flow) and high valuations (high price ratios and lowdividend yields). Most of these portfolios focus on companiesin rapidly expanding industries.
Performance
10
20
30
40
0
-10
-20
-30
YTD YTD YTD YTD YTD YTD
Total Return%as of 06-30-15
InvestmentBenchmark
Average annual, if greaterthan 1 year.
YTD 1 Year 3 Year 5 Year 10 Year Since Inception1.30 7.99 17.02 17.11 8.73 8.81 Fund Return %1.30 7.99 17.02 17.11 8.73 8.81 Load-Adj. Return %3.96 10.56 17.99 18.59 9.10 9.23 Benchmark Return %4.02 9.39 17.48 16.96 8.26 7.83 Category Average %........................................................................................................................................................................................................... . QQQ QQQ QQQQ . Morningstar Rating™. . 1533 1317 918 . # of Funds in Category
Quarter End Returns as of 06-30-15 YTD 1 Year 3 Year 5 Year 10 Year Since Inception
Fund Return % 1.30 7.99 17.02 17.11 8.73 8.81Standardized Return % 1.30 7.99 17.02 17.11 8.73 8.81
Performance Disclosure: The performance data quoted represents past performance and does not guarantee futureresults. The investment return and principal value of an investment will fluctuate; thus an investor’s shares, whenredeemed, may be worth more or less than their original cost.
Portfolio Analysis as of 05-31-15Composition as of 05-31-15 % Assets
U.S. Stocks 90.3Non-U.S. Stocks 9.3Bonds 0.0Cash 0.4Other 0.0
Morningstar Equity Style Box™ as of 05-31-15 % Mkt Cap
LargeM
idSm
all
Value Blend Growth
Giant 32.10........................................................Large 53.23Medium 14.67Small 0.00........................................................Micro 0.00
Top 10 Holdings as of 05-31-15 % Assets
Accenture PLC Class A 4.32Google Inc Class A 4.21Visa Inc Class A 4.10Colgate-Palmolive Co 3.31Danaher Corp 3.28.......................................................................................................Oracle Corporation 2.78United Technologies Corp 2.61Apple Inc 2.57CVS Health Corp 2.56Thermo Fisher Scientific Inc 2.42
.......................................................................................................Total Number of Stock Holdings 64Total Number of Bond Holdings 0Annual Turnover Ratio % 26.00Total Fund Assets ($mil) 7,055.39
Morningstar Sectors as of 05-31-15 % Fund S&P 500 %
h Cyclical 31.83 31.24...............................................................................................r Basic Materials 6.92 2.98t Consumer Cyclical 16.01 11.00y Financial Services 8.90 15.15u Real Estate 0.00 2.11
j Sensitive 39.83 40.60...............................................................................................i Communication Services 0.00 4.02o Energy 2.11 7.87p Industrials 12.97 10.87a Technology 24.75 17.84
k Defensive 28.35 28.16...............................................................................................s Consumer Defensive 11.32 9.34d Healthcare 17.03 15.98f Utilities 0.00 2.84
Principal Risks as of 05-31-15Foreign Securities, Loss of Money, Not FDIC Insured, Growth Investing, Issuer, Market/Market Volatility, Equity Securities,Restricted/Illiquid Securities, Management
©2015 Morningstar, Inc., Morningstar Investment Profiles™ 312-696-6000. All rights reserved. The information contained herein: (1) is proprietary to Morningstar and/or its content providers; (2) maynot be copied or distributed and (3) is not warranted to be accurate, complete or timely. Neither Morningstar nor its content providers are responsible for any damages or losses arising from any use ofinformation. Past performance is no guarantee of future performance. Visit our investment website at www.morningstar.com ß
®
Release Date: 06-30-2015
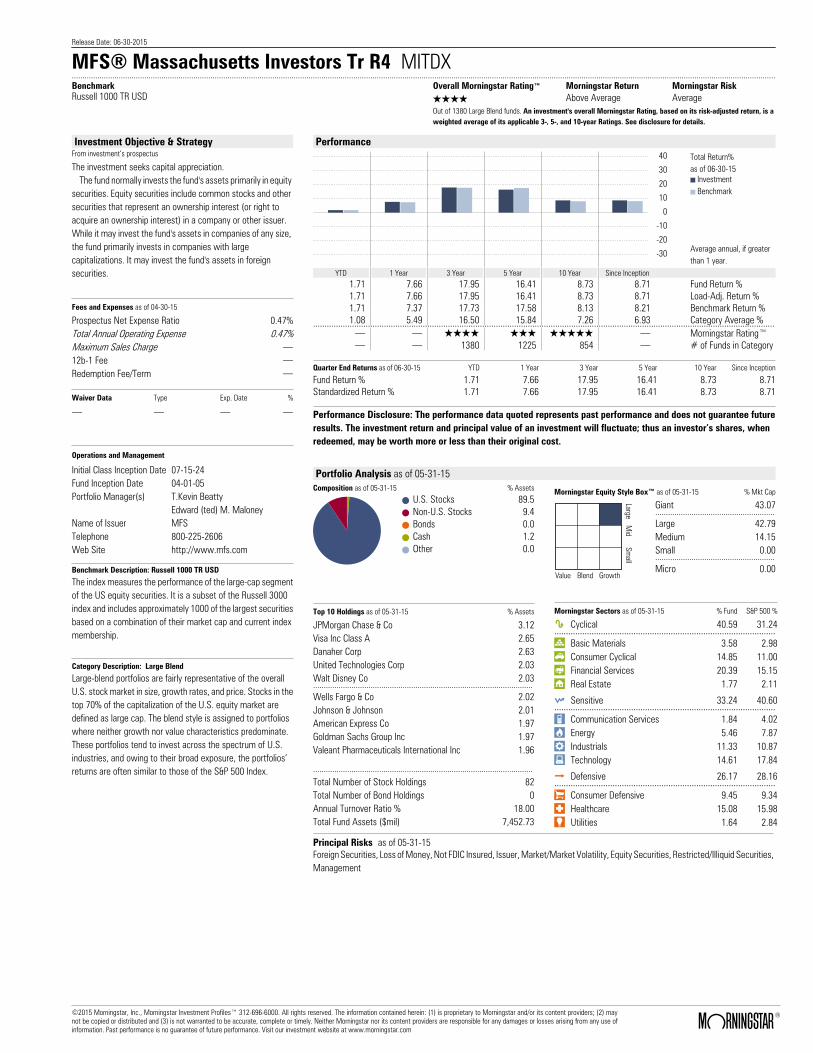
MFS® Massachusetts Investors Tr R4 MITDX ..........................................................................................................................................................................................................................................................................................................................................BenchmarkRussell 1000 TR USD
Overall Morningstar Rating™ Morningstar Return Morningstar RiskQQQQ Above Average AverageOut of 1380 Large Blend funds. An investment's overall Morningstar Rating, based on its risk-adjusted return, is aweighted average of its applicable 3-, 5-, and 10-year Ratings. See disclosure for details.
Investment Objective & StrategyFrom investment’s prospectus
The investment seeks capital appreciation. The fund normally invests the fund's assets primarily in equity securities. Equity securities include common stocks and other securities that represent an ownership interest (or right to acquire an ownership interest) in a company or other issuer. While it may invest the fund's assets in companies of any size, the fund primarily invests in companies with large capitalizations. It may invest the fund's assets in foreign securities.
Fees and Expenses as of 04-30-15
Prospectus Net Expense Ratio 0.47%Total Annual Operating Expense 0.47%Maximum Sales Charge .12b-1 Fee .Redemption Fee/Term .
Waiver Data Type Exp. Date %
. . . .
Operations and Management
Initial Class Inception Date 07-15-24Fund Inception Date 04-01-05Portfolio Manager(s) T.Kevin Beatty
Edward (ted) M. MaloneyName of Issuer MFSTelephone 800-225-2606Web Site http://www.mfs.com
Benchmark Description: Russell 1000 TR USD
The index measures the performance of the large-cap segmentof the US equity securities. It is a subset of the Russell 3000index and includes approximately 1000 of the largest securitiesbased on a combination of their market cap and current indexmembership.
Category Description: Large Blend
Large-blend portfolios are fairly representative of the overallU.S. stock market in size, growth rates, and price. Stocks in thetop 70% of the capitalization of the U.S. equity market aredefined as large cap. The blend style is assigned to portfolioswhere neither growth nor value characteristics predominate.These portfolios tend to invest across the spectrum of U.S.industries, and owing to their broad exposure, the portfolios’returns are often similar to those of the S&P 500 Index.
Performance
10
20
30
40
0
-10
-20
-30
YTD YTD YTD YTD YTD YTD
Total Return%as of 06-30-15
InvestmentBenchmark
Average annual, if greaterthan 1 year.
YTD 1 Year 3 Year 5 Year 10 Year Since Inception1.71 7.66 17.95 16.41 8.73 8.71 Fund Return %1.71 7.66 17.95 16.41 8.73 8.71 Load-Adj. Return %1.71 7.37 17.73 17.58 8.13 8.21 Benchmark Return %1.08 5.49 16.50 15.84 7.26 6.93 Category Average %........................................................................................................................................................................................................... . QQQQ QQQ QQQQQ . Morningstar Rating™. . 1380 1225 854 . # of Funds in Category
Quarter End Returns as of 06-30-15 YTD 1 Year 3 Year 5 Year 10 Year Since Inception
Fund Return % 1.71 7.66 17.95 16.41 8.73 8.71Standardized Return % 1.71 7.66 17.95 16.41 8.73 8.71
Performance Disclosure: The performance data quoted represents past performance and does not guarantee futureresults. The investment return and principal value of an investment will fluctuate; thus an investor’s shares, whenredeemed, may be worth more or less than their original cost.
Portfolio Analysis as of 05-31-15Composition as of 05-31-15 % Assets
U.S. Stocks 89.5Non-U.S. Stocks 9.4Bonds 0.0Cash 1.2Other 0.0
Morningstar Equity Style Box™ as of 05-31-15 % Mkt Cap
LargeM
idSm
all
Value Blend Growth
Giant 43.07........................................................Large 42.79Medium 14.15Small 0.00........................................................Micro 0.00
Top 10 Holdings as of 05-31-15 % Assets
JPMorgan Chase & Co 3.12Visa Inc Class A 2.65Danaher Corp 2.63United Technologies Corp 2.03Walt Disney Co 2.03.......................................................................................................Wells Fargo & Co 2.02Johnson & Johnson 2.01American Express Co 1.97Goldman Sachs Group Inc 1.97Valeant Pharmaceuticals International Inc 1.96
.......................................................................................................Total Number of Stock Holdings 82Total Number of Bond Holdings 0Annual Turnover Ratio % 18.00Total Fund Assets ($mil) 7,452.73
Morningstar Sectors as of 05-31-15 % Fund S&P 500 %
h Cyclical 40.59 31.24...............................................................................................r Basic Materials 3.58 2.98t Consumer Cyclical 14.85 11.00y Financial Services 20.39 15.15u Real Estate 1.77 2.11
j Sensitive 33.24 40.60...............................................................................................i Communication Services 1.84 4.02o Energy 5.46 7.87p Industrials 11.33 10.87a Technology 14.61 17.84
k Defensive 26.17 28.16...............................................................................................s Consumer Defensive 9.45 9.34d Healthcare 15.08 15.98f Utilities 1.64 2.84
Principal Risks as of 05-31-15Foreign Securities, Loss of Money, Not FDIC Insured, Issuer, Market/Market Volatility, Equity Securities, Restricted/Illiquid Securities,Management
©2015 Morningstar, Inc., Morningstar Investment Profiles™ 312-696-6000. All rights reserved. The information contained herein: (1) is proprietary to Morningstar and/or its content providers; (2) maynot be copied or distributed and (3) is not warranted to be accurate, complete or timely. Neither Morningstar nor its content providers are responsible for any damages or losses arising from any use ofinformation. Past performance is no guarantee of future performance. Visit our investment website at www.morningstar.com ß
®
Release Date: 06-30-2015
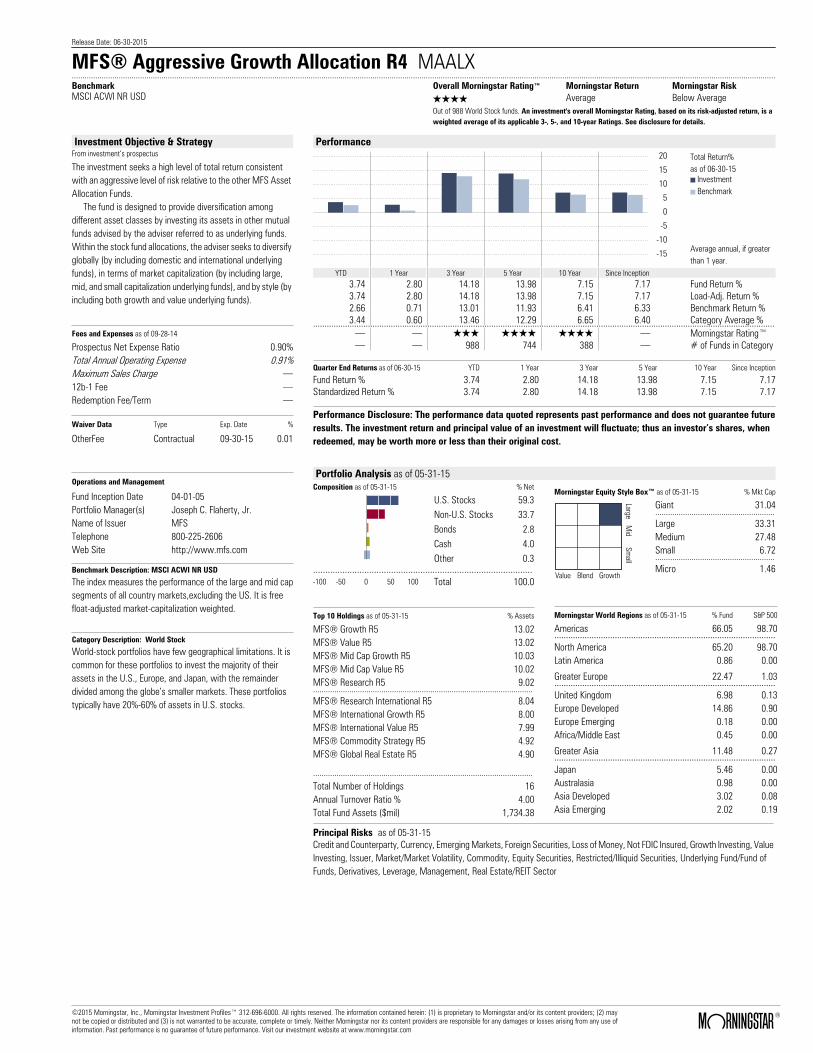
MFS® Aggressive Growth Allocation R4 MAALX ..........................................................................................................................................................................................................................................................................................................................................BenchmarkMSCI ACWI NR USD
Overall Morningstar Rating™ Morningstar Return Morningstar RiskQQQQ Average Below AverageOut of 988 World Stock funds. An investment's overall Morningstar Rating, based on its risk-adjusted return, is aweighted average of its applicable 3-, 5-, and 10-year Ratings. See disclosure for details.
Investment Objective & StrategyFrom investment’s prospectus
The investment seeks a high level of total return consistent with an aggressive level of risk relative to the other MFS Asset Allocation Funds. The fund is designed to provide diversification among different asset classes by investing its assets in other mutual funds advised by the adviser referred to as underlying funds. Within the stock fund allocations, the adviser seeks to diversify globally (by including domestic and international underlying funds), in terms of market capitalization (by including large, mid, and small capitalization underlying funds), and by style (by including both growth and value underlying funds).
Fees and Expenses as of 09-28-14
Prospectus Net Expense Ratio 0.90%Total Annual Operating Expense 0.91%Maximum Sales Charge .12b-1 Fee .Redemption Fee/Term .
Waiver Data Type Exp. Date %
OtherFee Contractual 09-30-15 0.01
Operations and Management
Fund Inception Date 04-01-05Portfolio Manager(s) Joseph C. Flaherty, Jr.Name of Issuer MFSTelephone 800-225-2606Web Site http://www.mfs.com
Benchmark Description: MSCI ACWI NR USD
The index measures the performance of the large and mid capsegments of all country markets,excluding the US. It is freefloat-adjusted market-capitalization weighted.
Category Description: World Stock
World-stock portfolios have few geographical limitations. It iscommon for these portfolios to invest the majority of theirassets in the U.S., Europe, and Japan, with the remainderdivided among the globe’s smaller markets. These portfoliostypically have 20%-60% of assets in U.S. stocks.
Performance
5
10
15
20
0
-5
-10
-15
YTD YTD YTD YTD YTD YTD
Total Return%as of 06-30-15
InvestmentBenchmark
Average annual, if greaterthan 1 year.
YTD 1 Year 3 Year 5 Year 10 Year Since Inception3.74 2.80 14.18 13.98 7.15 7.17 Fund Return %3.74 2.80 14.18 13.98 7.15 7.17 Load-Adj. Return %2.66 0.71 13.01 11.93 6.41 6.33 Benchmark Return %3.44 0.60 13.46 12.29 6.65 6.40 Category Average %........................................................................................................................................................................................................... . QQQ QQQQ QQQQ . Morningstar Rating™. . 988 744 388 . # of Funds in Category
Quarter End Returns as of 06-30-15 YTD 1 Year 3 Year 5 Year 10 Year Since Inception
Fund Return % 3.74 2.80 14.18 13.98 7.15 7.17Standardized Return % 3.74 2.80 14.18 13.98 7.15 7.17
Performance Disclosure: The performance data quoted represents past performance and does not guarantee futureresults. The investment return and principal value of an investment will fluctuate; thus an investor’s shares, whenredeemed, may be worth more or less than their original cost.
Portfolio Analysis as of 05-31-15Composition as of 05-31-15 % Net
U.S. Stocks 59.3Non-U.S. Stocks 33.7Bonds 2.8Cash 4.0Other 0.3
..........................................................................................-100 -50 0 50 100 Total 100.0
Morningstar Equity Style Box™ as of 05-31-15 % Mkt Cap
LargeM
idSm
all
Value Blend Growth
Giant 31.04........................................................Large 33.31Medium 27.48Small 6.72........................................................Micro 1.46
Top 10 Holdings as of 05-31-15 % Assets
MFS® Growth R5 13.02MFS® Value R5 13.02MFS® Mid Cap Growth R5 10.03MFS® Mid Cap Value R5 10.02MFS® Research R5 9.02.......................................................................................................MFS® Research International R5 8.04MFS® International Growth R5 8.00MFS® International Value R5 7.99MFS® Commodity Strategy R5 4.92MFS® Global Real Estate R5 4.90
.......................................................................................................Total Number of Holdings 16Annual Turnover Ratio % 4.00Total Fund Assets ($mil) 1,734.38
Morningstar World Regions as of 05-31-15 % Fund S&P 500
Americas 66.05 98.70...............................................................................................North America 65.20 98.70Latin America 0.86 0.00
Greater Europe 22.47 1.03...............................................................................................United Kingdom 6.98 0.13Europe Developed 14.86 0.90Europe Emerging 0.18 0.00Africa/Middle East 0.45 0.00
Greater Asia 11.48 0.27...............................................................................................Japan 5.46 0.00Australasia 0.98 0.00Asia Developed 3.02 0.08Asia Emerging 2.02 0.19
Principal Risks as of 05-31-15Credit and Counterparty, Currency, Emerging Markets, Foreign Securities, Loss of Money, Not FDIC Insured, Growth Investing, ValueInvesting, Issuer, Market/Market Volatility, Commodity, Equity Securities, Restricted/Illiquid Securities, Underlying Fund/Fund ofFunds, Derivatives, Leverage, Management, Real Estate/REIT Sector
©2015 Morningstar, Inc., Morningstar Investment Profiles™ 312-696-6000. All rights reserved. The information contained herein: (1) is proprietary to Morningstar and/or its content providers; (2) maynot be copied or distributed and (3) is not warranted to be accurate, complete or timely. Neither Morningstar nor its content providers are responsible for any damages or losses arising from any use ofinformation. Past performance is no guarantee of future performance. Visit our investment website at www.morningstar.com ß
®
Release Date: 06-30-2015
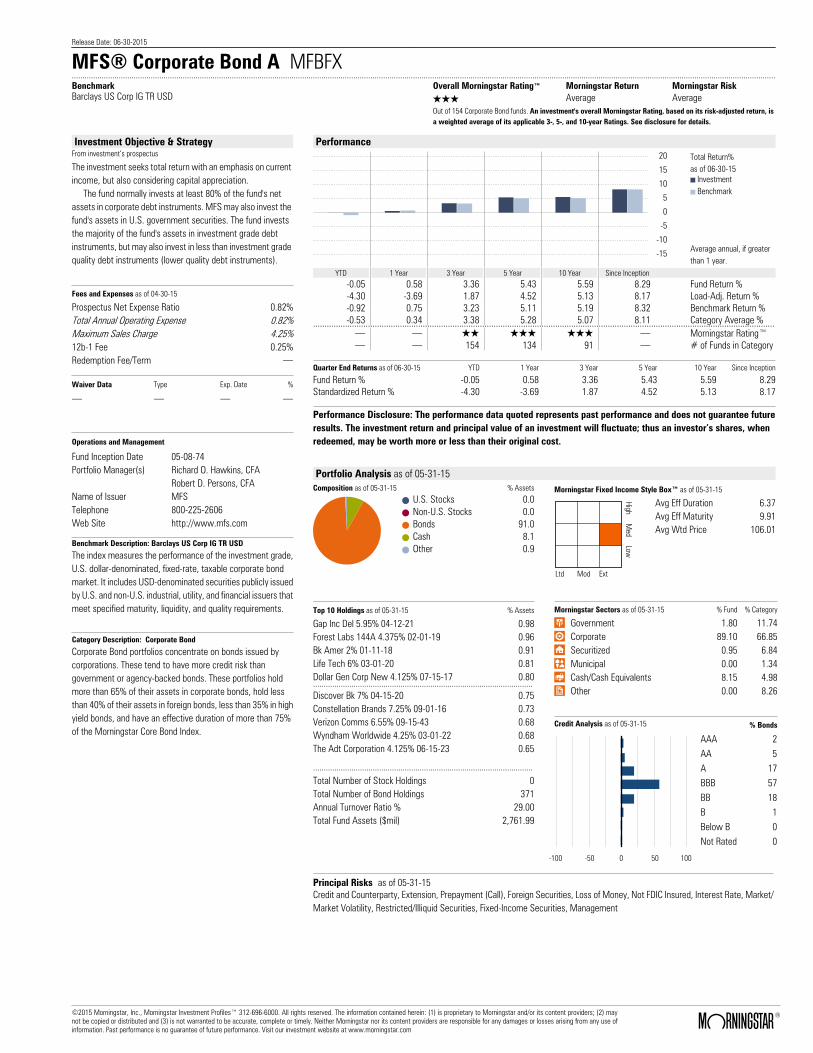
MFS® Corporate Bond A MFBFX ..........................................................................................................................................................................................................................................................................................................................................BenchmarkBarclays US Corp IG TR USD
Overall Morningstar Rating™ Morningstar Return Morningstar RiskQQQ Average AverageOut of 154 Corporate Bond funds. An investment's overall Morningstar Rating, based on its risk-adjusted return, isa weighted average of its applicable 3-, 5-, and 10-year Ratings. See disclosure for details.
Investment Objective & StrategyFrom investment’s prospectus
The investment seeks total return with an emphasis on current income, but also considering capital appreciation. The fund normally invests at least 80% of the fund's net assets in corporate debt instruments. MFS may also invest the fund's assets in U.S. government securities. The fund invests the majority of the fund's assets in investment grade debt instruments, but may also invest in less than investment grade quality debt instruments (lower quality debt instruments).
Fees and Expenses as of 04-30-15
Prospectus Net Expense Ratio 0.82%Total Annual Operating Expense 0.82%Maximum Sales Charge 4.25%12b-1 Fee 0.25%Redemption Fee/Term .
Waiver Data Type Exp. Date %
. . . .
Operations and Management
Fund Inception Date 05-08-74Portfolio Manager(s) Richard O. Hawkins, CFA
Robert D. Persons, CFAName of Issuer MFSTelephone 800-225-2606Web Site http://www.mfs.com
Benchmark Description: Barclays US Corp IG TR USD
The index measures the performance of the investment grade,U.S. dollar-denominated, fixed-rate, taxable corporate bondmarket. It includes USD-denominated securities publicly issuedby U.S. and non-U.S. industrial, utility, and financial issuers thatmeet specified maturity, liquidity, and quality requirements.
Category Description: Corporate Bond
Corporate Bond portfolios concentrate on bonds issued bycorporations. These tend to have more credit risk thangovernment or agency-backed bonds. These portfolios holdmore than 65% of their assets in corporate bonds, hold lessthan 40% of their assets in foreign bonds, less than 35% in highyield bonds, and have an effective duration of more than 75%of the Morningstar Core Bond Index.
Performance
5
10
15
20
0
-5
-10
-15
YTD YTD YTD YTD YTD YTD
Total Return%as of 06-30-15
InvestmentBenchmark
Average annual, if greaterthan 1 year.
YTD 1 Year 3 Year 5 Year 10 Year Since Inception-0.05 0.58 3.36 5.43 5.59 8.29 Fund Return %-4.30 -3.69 1.87 4.52 5.13 8.17 Load-Adj. Return %-0.92 0.75 3.23 5.11 5.19 8.32 Benchmark Return %-0.53 0.34 3.38 5.28 5.07 8.11 Category Average %........................................................................................................................................................................................................... . QQ QQQ QQQ . Morningstar Rating™. . 154 134 91 . # of Funds in Category
Quarter End Returns as of 06-30-15 YTD 1 Year 3 Year 5 Year 10 Year Since Inception
Fund Return % -0.05 0.58 3.36 5.43 5.59 8.29Standardized Return % -4.30 -3.69 1.87 4.52 5.13 8.17
Performance Disclosure: The performance data quoted represents past performance and does not guarantee futureresults. The investment return and principal value of an investment will fluctuate; thus an investor’s shares, whenredeemed, may be worth more or less than their original cost.
Portfolio Analysis as of 05-31-15Composition as of 05-31-15 % Assets
U.S. Stocks 0.0Non-U.S. Stocks 0.0Bonds 91.0Cash 8.1Other 0.9
Morningstar Fixed Income Style Box™ as of 05-31-15
HighM
edLow
Ltd Mod Ext
Avg Eff Duration 6.37Avg Eff Maturity 9.91Avg Wtd Price 106.01
Top 10 Holdings as of 05-31-15 % Assets
Gap Inc Del 5.95% 04-12-21 0.98Forest Labs 144A 4.375% 02-01-19 0.96Bk Amer 2% 01-11-18 0.91Life Tech 6% 03-01-20 0.81Dollar Gen Corp New 4.125% 07-15-17 0.80.......................................................................................................Discover Bk 7% 04-15-20 0.75Constellation Brands 7.25% 09-01-16 0.73Verizon Comms 6.55% 09-15-43 0.68Wyndham Worldwide 4.25% 03-01-22 0.68The Adt Corporation 4.125% 06-15-23 0.65
.......................................................................................................Total Number of Stock Holdings 0Total Number of Bond Holdings 371Annual Turnover Ratio % 29.00Total Fund Assets ($mil) 2,761.99
Morningstar Sectors as of 05-31-15 % Fund % Category
⁄ Government 1.80 11.74› Corporate 89.10 66.85€ Securitized 0.95 6.84‹ Municipal 0.00 1.34fi Cash/Cash Equivalents 8.15 4.98± Other 0.00 8.26
Credit Analysis as of 05-31-15 % Bonds
-100 -50 0 50 100
AAA 2AA 5A 17BBB 57BB 18B 1Below B 0Not Rated 0
Principal Risks as of 05-31-15Credit and Counterparty, Extension, Prepayment (Call), Foreign Securities, Loss of Money, Not FDIC Insured, Interest Rate, Market/Market Volatility, Restricted/Illiquid Securities, Fixed-Income Securities, Management
©2015 Morningstar, Inc., Morningstar Investment Profiles™ 312-696-6000. All rights reserved. The information contained herein: (1) is proprietary to Morningstar and/or its content providers; (2) maynot be copied or distributed and (3) is not warranted to be accurate, complete or timely. Neither Morningstar nor its content providers are responsible for any damages or losses arising from any use ofinformation. Past performance is no guarantee of future performance. Visit our investment website at www.morningstar.com ß
®

Release Date: 06-30-2015
MFS® Conservative Allocation R4 MACJX ..........................................................................................................................................................................................................................................................................................................................................BenchmarkMorningstar Moderately Cons Target Risk
Overall Morningstar Rating™ Morningstar Return Morningstar RiskQQQQQ Above Average AverageOut of 676 Conservative Allocation funds. An investment's overall Morningstar Rating, based on its risk-adjustedreturn, is a weighted average of its applicable 3-, 5-, and 10-year Ratings. See disclosure for details.
Investment Objective & StrategyFrom investment’s prospectus
The investment seeks to seek a high level of total return consistent with a conservative level of risk relative to the other MFS Asset Allocation Funds. The fund is designed to provide diversification among different asset classes by investing its assets in other mutual funds advised by the adviser, referred to as underlying funds. Within the stock fund allocations, the adviser seeks to diversify globally (by including domestic and international underlying funds), in terms of market capitalization (by including large, mid, and small capitalization underlying funds), and by style (by including both growth and value underlying funds).
Fees and Expenses as of 09-28-14
Prospectus Net Expense Ratio 0.70%Total Annual Operating Expense 0.70%Maximum Sales Charge .12b-1 Fee .Redemption Fee/Term .
Waiver Data Type Exp. Date %
. . . .
Operations and Management
Fund Inception Date 04-01-05Portfolio Manager(s) Joseph C. Flaherty, Jr.Name of Issuer MFSTelephone 800-225-2606Web Site http://www.mfs.com
Benchmark Description: Morningstar Moderately Cons Target Risk
The Morningstar Target Risk Index family is designed to meetthe needs of investors who would like to maintain a target levelof equity exposure through a portfolio diversified acrossequities, bonds and inflation-hedged instruments. TheMorningstar Moderately Conservative Target Risk Index seeksapproximately 40% exposure to global equity markets.
Category Description: Conservative Allocation
Conservative-allocation portfolios seek to provide both capitalappreciation and income by investing in three major areas:stocks, bonds, and cash. These portfolios tend to hold smallerpositions in stocks than moderate-allocation portfolios. Theseportfolios typically have 20% to 50% of assets in equities and50% to 80% of assets in fixed income and cash.
Performance
5
10
15
20
0
-5
-10
-15
YTD YTD YTD YTD YTD YTD
Total Return%as of 06-30-15
InvestmentBenchmark
Average annual, if greaterthan 1 year.
YTD 1 Year 3 Year 5 Year 10 Year Since Inception1.52 1.37 6.77 7.89 6.16 6.16 Fund Return %1.52 1.37 6.77 7.89 6.16 6.16 Load-Adj. Return %0.62 0.01 6.15 7.28 5.65 5.71 Benchmark Return %0.60 -0.20 5.88 7.00 4.78 4.58 Category Average %........................................................................................................................................................................................................... . QQQQ QQQQ QQQQQ . Morningstar Rating™. . 676 549 307 . # of Funds in Category
Quarter End Returns as of 06-30-15 YTD 1 Year 3 Year 5 Year 10 Year Since Inception
Fund Return % 1.52 1.37 6.77 7.89 6.16 6.16Standardized Return % 1.52 1.37 6.77 7.89 6.16 6.16
Performance Disclosure: The performance data quoted represents past performance and does not guarantee futureresults. The investment return and principal value of an investment will fluctuate; thus an investor’s shares, whenredeemed, may be worth more or less than their original cost.
Portfolio Analysis as of 05-31-15Composition as of 05-31-15 % Assets
U.S. Stocks 26.1Non-U.S. Stocks 9.4Bonds 54.3Cash 8.5Other 1.7
Morningstar Style Box™ as of 05-31-15(EQ) ; 05-31-15(F-I)
LargeM
idSm
all
Value Blend Growth
HighM
edLow
Ltd Mod Ext
Top 10 Holdings as of 05-31-15 % Assets
MFS® Total Return Bond R5 14.98MFS® Limited Maturity R5 10.00MFS® Government Securities R5 9.99MFS® Inflation-Adjusted Bond R5 9.97MFS® Research R5 6.02.......................................................................................................MFS® Value R5 6.02MFS® Growth R5 6.01MFS® High Income R5 5.03MFS® Global Bond R5 4.95MFS® Research International R5 4.02
.......................................................................................................Total Number of Holdings 23Annual Turnover Ratio % 5.00Total Fund Assets ($mil) 3,045.59
Morningstar Sectors as of 05-31-15 % Fund S&P 500 %
h Cyclical 38.97 31.24...............................................................................................r Basic Materials 4.84 2.98t Consumer Cyclical 13.35 11.00y Financial Services 16.30 15.15u Real Estate 4.48 2.11
j Sensitive 33.58 40.60...............................................................................................i Communication Services 3.07 4.02o Energy 4.81 7.87p Industrials 12.40 10.87a Technology 13.30 17.84
k Defensive 27.45 28.16...............................................................................................s Consumer Defensive 10.78 9.34d Healthcare 14.77 15.98f Utilities 1.90 2.84
Principal Risks as of 05-31-15Credit and Counterparty, Extension, Inflation-Protected Securities, Prepayment (Call), Currency, Emerging Markets, ForeignSecurities, Loss of Money, Not FDIC Insured, Growth Investing, Value Investing, Issuer, Interest Rate, Market/Market Volatility,Commodity, Equity Securities, Municipal Obligations, Leases, and AMT-Subject Bonds, Restricted/Illiquid Securities, UnderlyingFund/Fund of Funds, Derivatives, Leverage, Fixed-Income Securities, Management, Real Estate/REIT Sector
©2015 Morningstar, Inc., Morningstar Investment Profiles™ 312-696-6000. All rights reserved. The information contained herein: (1) is proprietary to Morningstar and/or its content providers; (2) maynot be copied or distributed and (3) is not warranted to be accurate, complete or timely. Neither Morningstar nor its content providers are responsible for any damages or losses arising from any use ofinformation. Past performance is no guarantee of future performance. Visit our investment website at www.morningstar.com ß
®
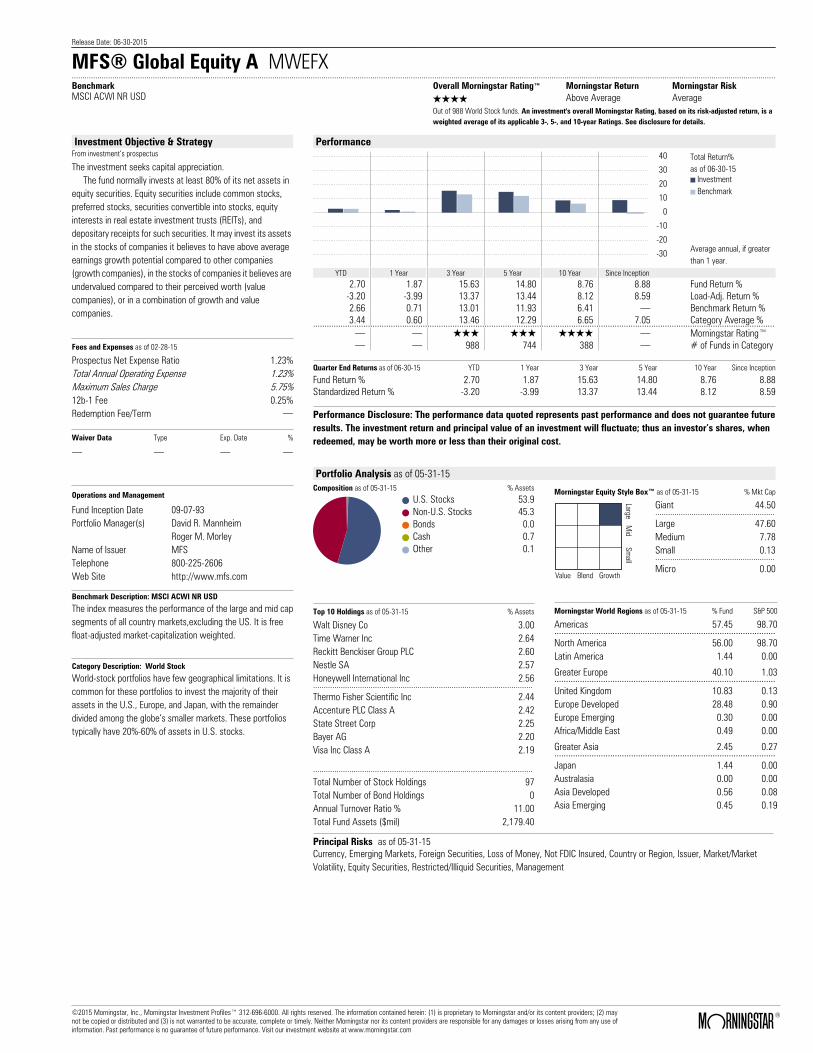
Release Date: 06-30-2015
MFS® Global Equity A MWEFX ..........................................................................................................................................................................................................................................................................................................................................BenchmarkMSCI ACWI NR USD
Overall Morningstar Rating™ Morningstar Return Morningstar RiskQQQQ Above Average AverageOut of 988 World Stock funds. An investment's overall Morningstar Rating, based on its risk-adjusted return, is aweighted average of its applicable 3-, 5-, and 10-year Ratings. See disclosure for details.
Investment Objective & StrategyFrom investment’s prospectus
The investment seeks capital appreciation. The fund normally invests at least 80% of its net assets in equity securities. Equity securities include common stocks, preferred stocks, securities convertible into stocks, equity interests in real estate investment trusts (REITs), and depositary receipts for such securities. It may invest its assets in the stocks of companies it believes to have above average earnings growth potential compared to other companies (growth companies), in the stocks of companies it believes are undervalued compared to their perceived worth (value companies), or in a combination of growth and value companies.
Fees and Expenses as of 02-28-15
Prospectus Net Expense Ratio 1.23%Total Annual Operating Expense 1.23%Maximum Sales Charge 5.75%12b-1 Fee 0.25%Redemption Fee/Term .
Waiver Data Type Exp. Date %
. . . .
Operations and Management
Fund Inception Date 09-07-93Portfolio Manager(s) David R. Mannheim
Roger M. MorleyName of Issuer MFSTelephone 800-225-2606Web Site http://www.mfs.com
Benchmark Description: MSCI ACWI NR USD
The index measures the performance of the large and mid capsegments of all country markets,excluding the US. It is freefloat-adjusted market-capitalization weighted.
Category Description: World Stock
World-stock portfolios have few geographical limitations. It iscommon for these portfolios to invest the majority of theirassets in the U.S., Europe, and Japan, with the remainderdivided among the globe’s smaller markets. These portfoliostypically have 20%-60% of assets in U.S. stocks.
Performance
10
20
30
40
0
-10
-20
-30
YTD YTD YTD YTD YTD YTD
Total Return%as of 06-30-15
InvestmentBenchmark
Average annual, if greaterthan 1 year.
YTD 1 Year 3 Year 5 Year 10 Year Since Inception2.70 1.87 15.63 14.80 8.76 8.88 Fund Return %
-3.20 -3.99 13.37 13.44 8.12 8.59 Load-Adj. Return %2.66 0.71 13.01 11.93 6.41 . Benchmark Return %3.44 0.60 13.46 12.29 6.65 7.05 Category Average %........................................................................................................................................................................................................... . QQQ QQQ QQQQ . Morningstar Rating™. . 988 744 388 . # of Funds in Category
Quarter End Returns as of 06-30-15 YTD 1 Year 3 Year 5 Year 10 Year Since Inception
Fund Return % 2.70 1.87 15.63 14.80 8.76 8.88Standardized Return % -3.20 -3.99 13.37 13.44 8.12 8.59
Performance Disclosure: The performance data quoted represents past performance and does not guarantee futureresults. The investment return and principal value of an investment will fluctuate; thus an investor’s shares, whenredeemed, may be worth more or less than their original cost.
Portfolio Analysis as of 05-31-15Composition as of 05-31-15 % Assets
U.S. Stocks 53.9Non-U.S. Stocks 45.3Bonds 0.0Cash 0.7Other 0.1
Morningstar Equity Style Box™ as of 05-31-15 % Mkt Cap
LargeM
idSm
all
Value Blend Growth
Giant 44.50........................................................Large 47.60Medium 7.78Small 0.13........................................................Micro 0.00
Top 10 Holdings as of 05-31-15 % Assets
Walt Disney Co 3.00Time Warner Inc 2.64Reckitt Benckiser Group PLC 2.60Nestle SA 2.57Honeywell International Inc 2.56.......................................................................................................Thermo Fisher Scientific Inc 2.44Accenture PLC Class A 2.42State Street Corp 2.25Bayer AG 2.20Visa Inc Class A 2.19
.......................................................................................................Total Number of Stock Holdings 97Total Number of Bond Holdings 0Annual Turnover Ratio % 11.00Total Fund Assets ($mil) 2,179.40
Morningstar World Regions as of 05-31-15 % Fund S&P 500
Americas 57.45 98.70...............................................................................................North America 56.00 98.70Latin America 1.44 0.00
Greater Europe 40.10 1.03...............................................................................................United Kingdom 10.83 0.13Europe Developed 28.48 0.90Europe Emerging 0.30 0.00Africa/Middle East 0.49 0.00
Greater Asia 2.45 0.27...............................................................................................Japan 1.44 0.00Australasia 0.00 0.00Asia Developed 0.56 0.08Asia Emerging 0.45 0.19
Principal Risks as of 05-31-15Currency, Emerging Markets, Foreign Securities, Loss of Money, Not FDIC Insured, Country or Region, Issuer, Market/MarketVolatility, Equity Securities, Restricted/Illiquid Securities, Management
©2015 Morningstar, Inc., Morningstar Investment Profiles™ 312-696-6000. All rights reserved. The information contained herein: (1) is proprietary to Morningstar and/or its content providers; (2) maynot be copied or distributed and (3) is not warranted to be accurate, complete or timely. Neither Morningstar nor its content providers are responsible for any damages or losses arising from any use ofinformation. Past performance is no guarantee of future performance. Visit our investment website at www.morningstar.com ß
®
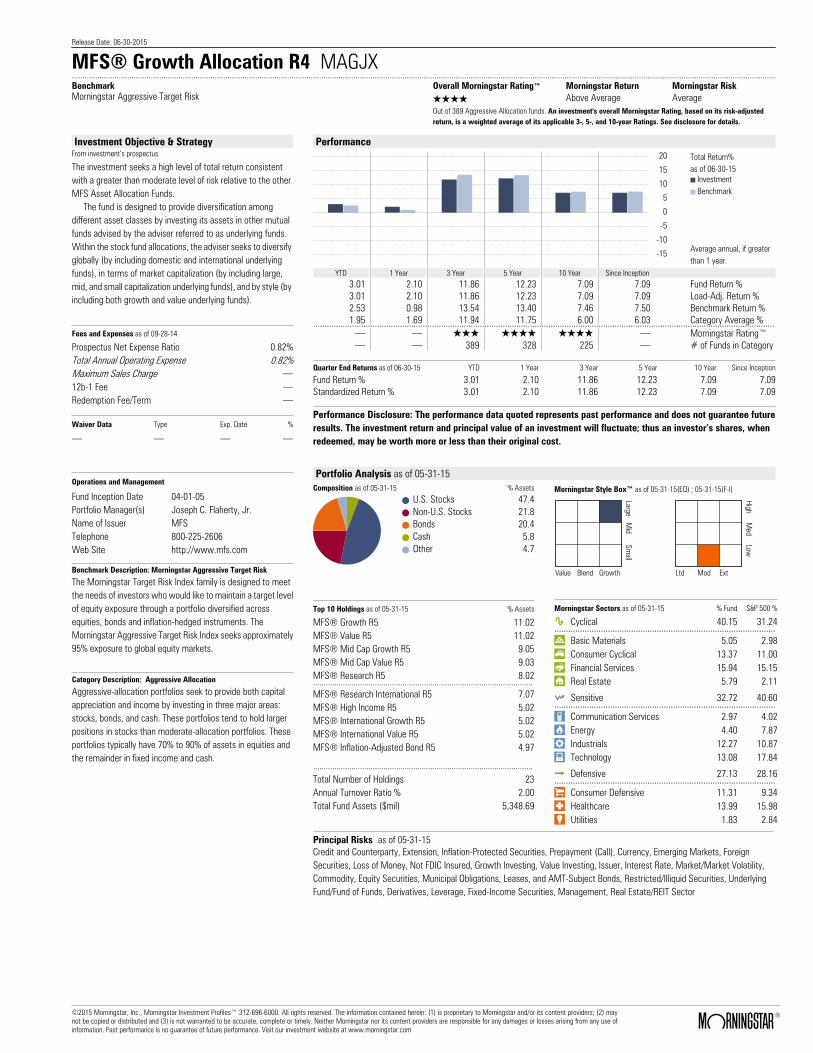
Release Date: 06-30-2015
MFS® Growth Allocation R4 MAGJX ..........................................................................................................................................................................................................................................................................................................................................BenchmarkMorningstar Aggressive Target Risk
Overall Morningstar Rating™ Morningstar Return Morningstar RiskQQQQ Above Average AverageOut of 389 Aggressive Allocation funds. An investment's overall Morningstar Rating, based on its risk-adjustedreturn, is a weighted average of its applicable 3-, 5-, and 10-year Ratings. See disclosure for details.
Investment Objective & StrategyFrom investment’s prospectus
The investment seeks a high level of total return consistent with a greater than moderate level of risk relative to the other MFS Asset Allocation Funds. The fund is designed to provide diversification among different asset classes by investing its assets in other mutual funds advised by the adviser referred to as underlying funds. Within the stock fund allocations, the adviser seeks to diversify globally (by including domestic and international underlying funds), in terms of market capitalization (by including large, mid, and small capitalization underlying funds), and by style (by including both growth and value underlying funds).
Fees and Expenses as of 09-28-14
Prospectus Net Expense Ratio 0.82%Total Annual Operating Expense 0.82%Maximum Sales Charge .12b-1 Fee .Redemption Fee/Term .
Waiver Data Type Exp. Date %
. . . .
Operations and Management
Fund Inception Date 04-01-05Portfolio Manager(s) Joseph C. Flaherty, Jr.Name of Issuer MFSTelephone 800-225-2606Web Site http://www.mfs.com
Benchmark Description: Morningstar Aggressive Target Risk
The Morningstar Target Risk Index family is designed to meetthe needs of investors who would like to maintain a target levelof equity exposure through a portfolio diversified acrossequities, bonds and inflation-hedged instruments. TheMorningstar Aggressive Target Risk Index seeks approximately95% exposure to global equity markets.
Category Description: Aggressive Allocation
Aggressive-allocation portfolios seek to provide both capitalappreciation and income by investing in three major areas:stocks, bonds, and cash. These portfolios tend to hold largerpositions in stocks than moderate-allocation portfolios. Theseportfolios typically have 70% to 90% of assets in equities andthe remainder in fixed income and cash.
Performance
5
10
15
20
0
-5
-10
-15
YTD YTD YTD YTD YTD YTD
Total Return%as of 06-30-15
InvestmentBenchmark
Average annual, if greaterthan 1 year.
YTD 1 Year 3 Year 5 Year 10 Year Since Inception3.01 2.10 11.86 12.23 7.09 7.09 Fund Return %3.01 2.10 11.86 12.23 7.09 7.09 Load-Adj. Return %2.53 0.98 13.54 13.40 7.46 7.50 Benchmark Return %1.95 1.69 11.94 11.75 6.00 6.03 Category Average %........................................................................................................................................................................................................... . QQQ QQQQ QQQQ . Morningstar Rating™. . 389 328 225 . # of Funds in Category
Quarter End Returns as of 06-30-15 YTD 1 Year 3 Year 5 Year 10 Year Since Inception
Fund Return % 3.01 2.10 11.86 12.23 7.09 7.09Standardized Return % 3.01 2.10 11.86 12.23 7.09 7.09
Performance Disclosure: The performance data quoted represents past performance and does not guarantee futureresults. The investment return and principal value of an investment will fluctuate; thus an investor’s shares, whenredeemed, may be worth more or less than their original cost.
Portfolio Analysis as of 05-31-15Composition as of 05-31-15 % Assets
U.S. Stocks 47.4Non-U.S. Stocks 21.8Bonds 20.4Cash 5.8Other 4.7
Morningstar Style Box™ as of 05-31-15(EQ) ; 05-31-15(F-I)
LargeM
idSm
all
Value Blend Growth
HighM
edLow
Ltd Mod Ext
Top 10 Holdings as of 05-31-15 % Assets
MFS® Growth R5 11.02MFS® Value R5 11.02MFS® Mid Cap Growth R5 9.05MFS® Mid Cap Value R5 9.03MFS® Research R5 8.02.......................................................................................................MFS® Research International R5 7.07MFS® High Income R5 5.02MFS® International Growth R5 5.02MFS® International Value R5 5.02MFS® Inflation-Adjusted Bond R5 4.97
.......................................................................................................Total Number of Holdings 23Annual Turnover Ratio % 2.00Total Fund Assets ($mil) 5,348.69
Morningstar Sectors as of 05-31-15 % Fund S&P 500 %
h Cyclical 40.15 31.24...............................................................................................r Basic Materials 5.05 2.98t Consumer Cyclical 13.37 11.00y Financial Services 15.94 15.15u Real Estate 5.79 2.11
j Sensitive 32.72 40.60...............................................................................................i Communication Services 2.97 4.02o Energy 4.40 7.87p Industrials 12.27 10.87a Technology 13.08 17.84
k Defensive 27.13 28.16...............................................................................................s Consumer Defensive 11.31 9.34d Healthcare 13.99 15.98f Utilities 1.83 2.84
Principal Risks as of 05-31-15Credit and Counterparty, Extension, Inflation-Protected Securities, Prepayment (Call), Currency, Emerging Markets, ForeignSecurities, Loss of Money, Not FDIC Insured, Growth Investing, Value Investing, Issuer, Interest Rate, Market/Market Volatility,Commodity, Equity Securities, Municipal Obligations, Leases, and AMT-Subject Bonds, Restricted/Illiquid Securities, UnderlyingFund/Fund of Funds, Derivatives, Leverage, Fixed-Income Securities, Management, Real Estate/REIT Sector
©2015 Morningstar, Inc., Morningstar Investment Profiles™ 312-696-6000. All rights reserved. The information contained herein: (1) is proprietary to Morningstar and/or its content providers; (2) maynot be copied or distributed and (3) is not warranted to be accurate, complete or timely. Neither Morningstar nor its content providers are responsible for any damages or losses arising from any use ofinformation. Past performance is no guarantee of future performance. Visit our investment website at www.morningstar.com ß
®
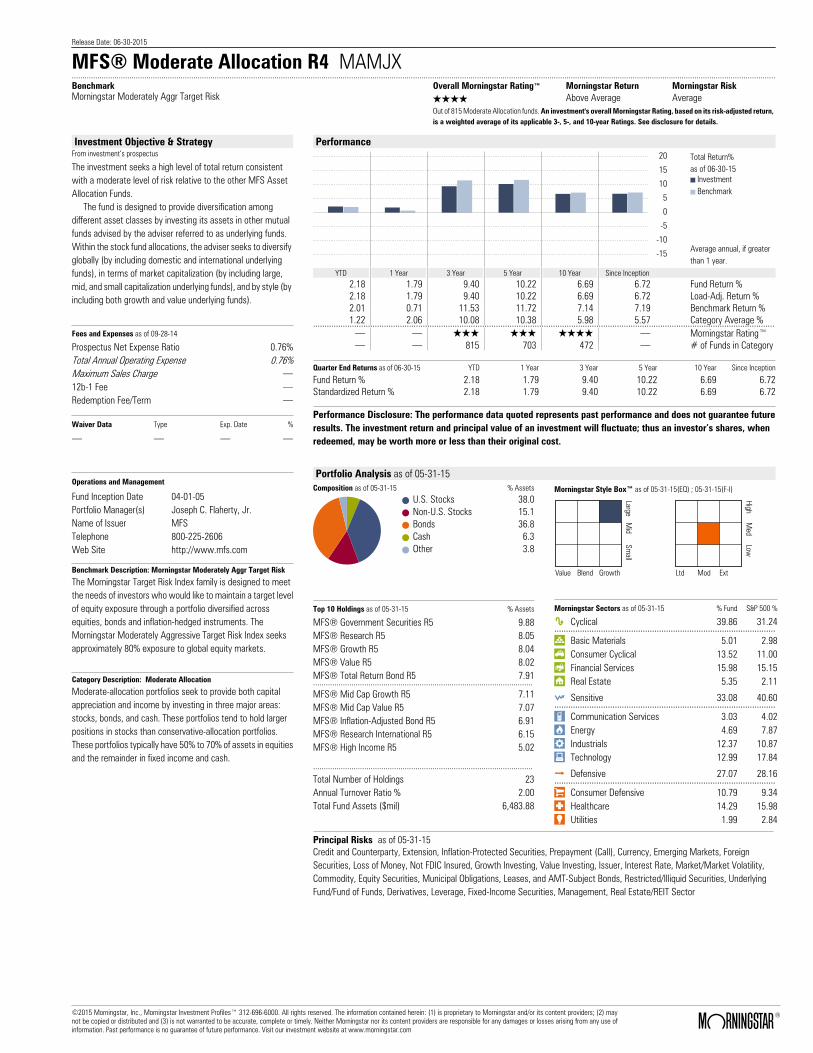
Release Date: 06-30-2015
MFS® Moderate Allocation R4 MAMJX ..........................................................................................................................................................................................................................................................................................................................................BenchmarkMorningstar Moderately Aggr Target Risk
Overall Morningstar Rating™ Morningstar Return Morningstar RiskQQQQ Above Average AverageOut of 815 Moderate Allocation funds. An investment's overall Morningstar Rating, based on its risk-adjusted return,is a weighted average of its applicable 3-, 5-, and 10-year Ratings. See disclosure for details.
Investment Objective & StrategyFrom investment’s prospectus
The investment seeks a high level of total return consistent with a moderate level of risk relative to the other MFS Asset Allocation Funds. The fund is designed to provide diversification among different asset classes by investing its assets in other mutual funds advised by the adviser referred to as underlying funds. Within the stock fund allocations, the adviser seeks to diversify globally (by including domestic and international underlying funds), in terms of market capitalization (by including large, mid, and small capitalization underlying funds), and by style (by including both growth and value underlying funds).
Fees and Expenses as of 09-28-14
Prospectus Net Expense Ratio 0.76%Total Annual Operating Expense 0.76%Maximum Sales Charge .12b-1 Fee .Redemption Fee/Term .
Waiver Data Type Exp. Date %
. . . .
Operations and Management
Fund Inception Date 04-01-05Portfolio Manager(s) Joseph C. Flaherty, Jr.Name of Issuer MFSTelephone 800-225-2606Web Site http://www.mfs.com
Benchmark Description: Morningstar Moderately Aggr Target Risk
The Morningstar Target Risk Index family is designed to meetthe needs of investors who would like to maintain a target levelof equity exposure through a portfolio diversified acrossequities, bonds and inflation-hedged instruments. TheMorningstar Moderately Aggressive Target Risk Index seeksapproximately 80% exposure to global equity markets.
Category Description: Moderate Allocation
Moderate-allocation portfolios seek to provide both capitalappreciation and income by investing in three major areas:stocks, bonds, and cash. These portfolios tend to hold largerpositions in stocks than conservative-allocation portfolios.These portfolios typically have 50% to 70% of assets in equitiesand the remainder in fixed income and cash.
Performance
5
10
15
20
0
-5
-10
-15
YTD YTD YTD YTD YTD YTD
Total Return%as of 06-30-15
InvestmentBenchmark
Average annual, if greaterthan 1 year.
YTD 1 Year 3 Year 5 Year 10 Year Since Inception2.18 1.79 9.40 10.22 6.69 6.72 Fund Return %2.18 1.79 9.40 10.22 6.69 6.72 Load-Adj. Return %2.01 0.71 11.53 11.72 7.14 7.19 Benchmark Return %1.22 2.06 10.08 10.38 5.98 5.57 Category Average %........................................................................................................................................................................................................... . QQQ QQQ QQQQ . Morningstar Rating™. . 815 703 472 . # of Funds in Category
Quarter End Returns as of 06-30-15 YTD 1 Year 3 Year 5 Year 10 Year Since Inception
Fund Return % 2.18 1.79 9.40 10.22 6.69 6.72Standardized Return % 2.18 1.79 9.40 10.22 6.69 6.72
Performance Disclosure: The performance data quoted represents past performance and does not guarantee futureresults. The investment return and principal value of an investment will fluctuate; thus an investor’s shares, whenredeemed, may be worth more or less than their original cost.
Portfolio Analysis as of 05-31-15Composition as of 05-31-15 % Assets
U.S. Stocks 38.0Non-U.S. Stocks 15.1Bonds 36.8Cash 6.3Other 3.8
Morningstar Style Box™ as of 05-31-15(EQ) ; 05-31-15(F-I)
LargeM
idSm
all
Value Blend Growth
HighM
edLow
Ltd Mod Ext
Top 10 Holdings as of 05-31-15 % Assets
MFS® Government Securities R5 9.88MFS® Research R5 8.05MFS® Growth R5 8.04MFS® Value R5 8.02MFS® Total Return Bond R5 7.91.......................................................................................................MFS® Mid Cap Growth R5 7.11MFS® Mid Cap Value R5 7.07MFS® Inflation-Adjusted Bond R5 6.91MFS® Research International R5 6.15MFS® High Income R5 5.02
.......................................................................................................Total Number of Holdings 23Annual Turnover Ratio % 2.00Total Fund Assets ($mil) 6,483.88
Morningstar Sectors as of 05-31-15 % Fund S&P 500 %
h Cyclical 39.86 31.24...............................................................................................r Basic Materials 5.01 2.98t Consumer Cyclical 13.52 11.00y Financial Services 15.98 15.15u Real Estate 5.35 2.11
j Sensitive 33.08 40.60...............................................................................................i Communication Services 3.03 4.02o Energy 4.69 7.87p Industrials 12.37 10.87a Technology 12.99 17.84
k Defensive 27.07 28.16...............................................................................................s Consumer Defensive 10.79 9.34d Healthcare 14.29 15.98f Utilities 1.99 2.84
Principal Risks as of 05-31-15Credit and Counterparty, Extension, Inflation-Protected Securities, Prepayment (Call), Currency, Emerging Markets, ForeignSecurities, Loss of Money, Not FDIC Insured, Growth Investing, Value Investing, Issuer, Interest Rate, Market/Market Volatility,Commodity, Equity Securities, Municipal Obligations, Leases, and AMT-Subject Bonds, Restricted/Illiquid Securities, UnderlyingFund/Fund of Funds, Derivatives, Leverage, Fixed-Income Securities, Management, Real Estate/REIT Sector
©2015 Morningstar, Inc., Morningstar Investment Profiles™ 312-696-6000. All rights reserved. The information contained herein: (1) is proprietary to Morningstar and/or its content providers; (2) maynot be copied or distributed and (3) is not warranted to be accurate, complete or timely. Neither Morningstar nor its content providers are responsible for any damages or losses arising from any use ofinformation. Past performance is no guarantee of future performance. Visit our investment website at www.morningstar.com ß
®
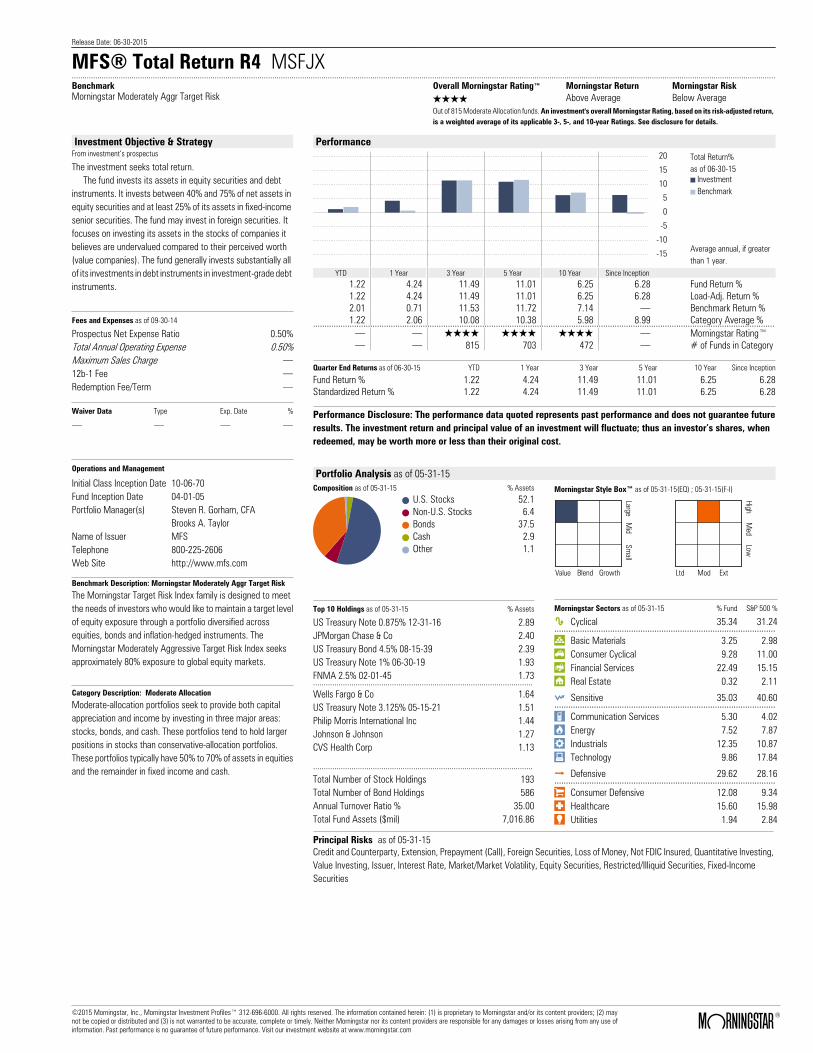
Release Date: 06-30-2015
MFS® Total Return R4 MSFJX ..........................................................................................................................................................................................................................................................................................................................................BenchmarkMorningstar Moderately Aggr Target Risk
Overall Morningstar Rating™ Morningstar Return Morningstar RiskQQQQ Above Average Below AverageOut of 815 Moderate Allocation funds. An investment's overall Morningstar Rating, based on its risk-adjusted return,is a weighted average of its applicable 3-, 5-, and 10-year Ratings. See disclosure for details.
Investment Objective & StrategyFrom investment’s prospectus
The investment seeks total return. The fund invests its assets in equity securities and debt instruments. It invests between 40% and 75% of net assets in equity securities and at least 25% of its assets in fixed-income senior securities. The fund may invest in foreign securities. It focuses on investing its assets in the stocks of companies it believes are undervalued compared to their perceived worth (value companies). The fund generally invests substantially all of its investments in debt instruments in investment-grade debt instruments.
Fees and Expenses as of 09-30-14
Prospectus Net Expense Ratio 0.50%Total Annual Operating Expense 0.50%Maximum Sales Charge .12b-1 Fee .Redemption Fee/Term .
Waiver Data Type Exp. Date %
. . . .
Operations and Management
Initial Class Inception Date 10-06-70Fund Inception Date 04-01-05Portfolio Manager(s) Steven R. Gorham, CFA
Brooks A. TaylorName of Issuer MFSTelephone 800-225-2606Web Site http://www.mfs.com
Benchmark Description: Morningstar Moderately Aggr Target Risk
The Morningstar Target Risk Index family is designed to meetthe needs of investors who would like to maintain a target levelof equity exposure through a portfolio diversified acrossequities, bonds and inflation-hedged instruments. TheMorningstar Moderately Aggressive Target Risk Index seeksapproximately 80% exposure to global equity markets.
Category Description: Moderate Allocation
Moderate-allocation portfolios seek to provide both capitalappreciation and income by investing in three major areas:stocks, bonds, and cash. These portfolios tend to hold largerpositions in stocks than conservative-allocation portfolios.These portfolios typically have 50% to 70% of assets in equitiesand the remainder in fixed income and cash.
Performance
5
10
15
20
0
-5
-10
-15
YTD YTD YTD YTD YTD YTD
Total Return%as of 06-30-15
InvestmentBenchmark
Average annual, if greaterthan 1 year.
YTD 1 Year 3 Year 5 Year 10 Year Since Inception1.22 4.24 11.49 11.01 6.25 6.28 Fund Return %1.22 4.24 11.49 11.01 6.25 6.28 Load-Adj. Return %2.01 0.71 11.53 11.72 7.14 . Benchmark Return %1.22 2.06 10.08 10.38 5.98 8.99 Category Average %........................................................................................................................................................................................................... . QQQQ QQQQ QQQQ . Morningstar Rating™. . 815 703 472 . # of Funds in Category
Quarter End Returns as of 06-30-15 YTD 1 Year 3 Year 5 Year 10 Year Since Inception
Fund Return % 1.22 4.24 11.49 11.01 6.25 6.28Standardized Return % 1.22 4.24 11.49 11.01 6.25 6.28
Performance Disclosure: The performance data quoted represents past performance and does not guarantee futureresults. The investment return and principal value of an investment will fluctuate; thus an investor’s shares, whenredeemed, may be worth more or less than their original cost.
Portfolio Analysis as of 05-31-15Composition as of 05-31-15 % Assets
U.S. Stocks 52.1Non-U.S. Stocks 6.4Bonds 37.5Cash 2.9Other 1.1
Morningstar Style Box™ as of 05-31-15(EQ) ; 05-31-15(F-I)
LargeM
idSm
all
Value Blend Growth
HighM
edLow
Ltd Mod Ext
Top 10 Holdings as of 05-31-15 % Assets
US Treasury Note 0.875% 12-31-16 2.89JPMorgan Chase & Co 2.40US Treasury Bond 4.5% 08-15-39 2.39US Treasury Note 1% 06-30-19 1.93FNMA 2.5% 02-01-45 1.73.......................................................................................................Wells Fargo & Co 1.64US Treasury Note 3.125% 05-15-21 1.51Philip Morris International Inc 1.44Johnson & Johnson 1.27CVS Health Corp 1.13
.......................................................................................................Total Number of Stock Holdings 193Total Number of Bond Holdings 586Annual Turnover Ratio % 35.00Total Fund Assets ($mil) 7,016.86
Morningstar Sectors as of 05-31-15 % Fund S&P 500 %
h Cyclical 35.34 31.24...............................................................................................r Basic Materials 3.25 2.98t Consumer Cyclical 9.28 11.00y Financial Services 22.49 15.15u Real Estate 0.32 2.11
j Sensitive 35.03 40.60...............................................................................................i Communication Services 5.30 4.02o Energy 7.52 7.87p Industrials 12.35 10.87a Technology 9.86 17.84
k Defensive 29.62 28.16...............................................................................................s Consumer Defensive 12.08 9.34d Healthcare 15.60 15.98f Utilities 1.94 2.84
Principal Risks as of 05-31-15Credit and Counterparty, Extension, Prepayment (Call), Foreign Securities, Loss of Money, Not FDIC Insured, Quantitative Investing,Value Investing, Issuer, Interest Rate, Market/Market Volatility, Equity Securities, Restricted/Illiquid Securities, Fixed-IncomeSecurities
©2015 Morningstar, Inc., Morningstar Investment Profiles™ 312-696-6000. All rights reserved. The information contained herein: (1) is proprietary to Morningstar and/or its content providers; (2) maynot be copied or distributed and (3) is not warranted to be accurate, complete or timely. Neither Morningstar nor its content providers are responsible for any damages or losses arising from any use ofinformation. Past performance is no guarantee of future performance. Visit our investment website at www.morningstar.com ß
®
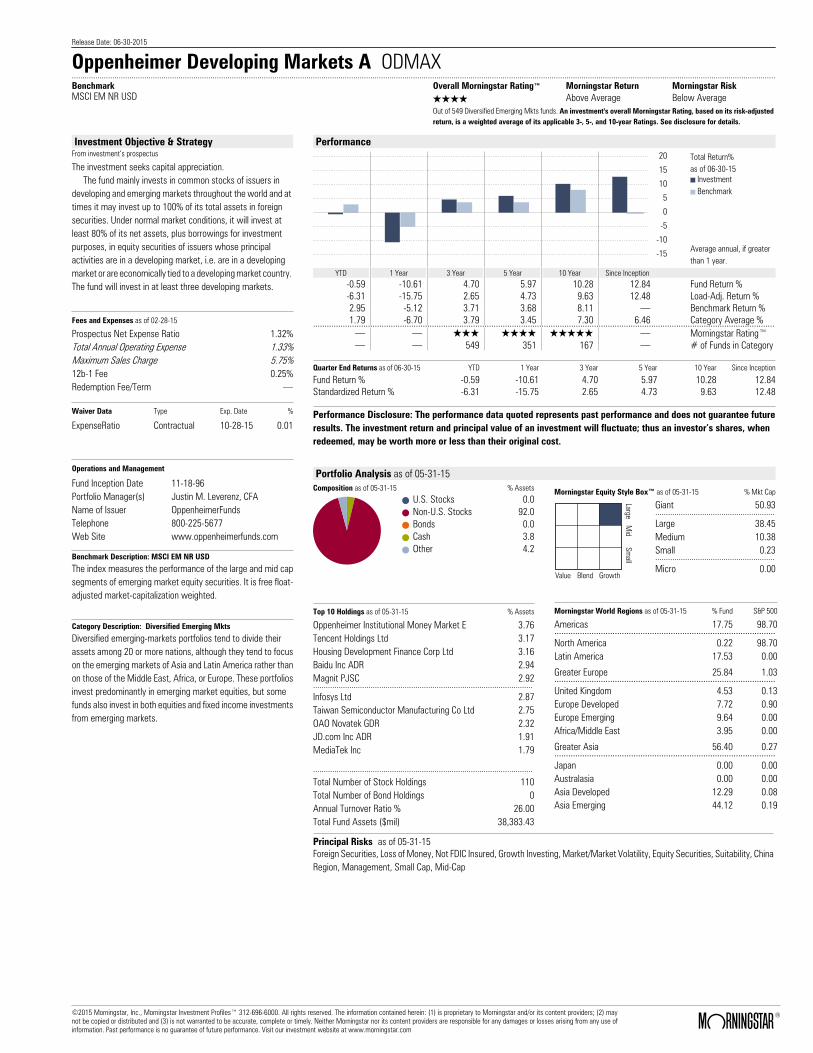
Release Date: 06-30-2015
Oppenheimer Developing Markets A ODMAX ..........................................................................................................................................................................................................................................................................................................................................BenchmarkMSCI EM NR USD
Overall Morningstar Rating™ Morningstar Return Morningstar RiskQQQQ Above Average Below AverageOut of 549 Diversified Emerging Mkts funds. An investment's overall Morningstar Rating, based on its risk-adjustedreturn, is a weighted average of its applicable 3-, 5-, and 10-year Ratings. See disclosure for details.
Investment Objective & StrategyFrom investment’s prospectus
The investment seeks capital appreciation. The fund mainly invests in common stocks of issuers in developing and emerging markets throughout the world and at times it may invest up to 100% of its total assets in foreign securities. Under normal market conditions, it will invest at least 80% of its net assets, plus borrowings for investment purposes, in equity securities of issuers whose principal activities are in a developing market, i.e. are in a developing market or are economically tied to a developing market country. The fund will invest in at least three developing markets.
Fees and Expenses as of 02-28-15
Prospectus Net Expense Ratio 1.32%Total Annual Operating Expense 1.33%Maximum Sales Charge 5.75%12b-1 Fee 0.25%Redemption Fee/Term .
Waiver Data Type Exp. Date %
ExpenseRatio Contractual 10-28-15 0.01
Operations and Management
Fund Inception Date 11-18-96Portfolio Manager(s) Justin M. Leverenz, CFAName of Issuer OppenheimerFundsTelephone 800-225-5677Web Site www.oppenheimerfunds.com
Benchmark Description: MSCI EM NR USD
The index measures the performance of the large and mid capsegments of emerging market equity securities. It is free float-adjusted market-capitalization weighted.
Category Description: Diversified Emerging Mkts
Diversified emerging-markets portfolios tend to divide theirassets among 20 or more nations, although they tend to focuson the emerging markets of Asia and Latin America rather thanon those of the Middle East, Africa, or Europe. These portfoliosinvest predominantly in emerging market equities, but somefunds also invest in both equities and fixed income investmentsfrom emerging markets.
Performance
5
10
15
20
0
-5
-10
-15
YTD YTD YTD YTD YTD YTD
Total Return%as of 06-30-15
InvestmentBenchmark
Average annual, if greaterthan 1 year.
YTD 1 Year 3 Year 5 Year 10 Year Since Inception-0.59 -10.61 4.70 5.97 10.28 12.84 Fund Return %-6.31 -15.75 2.65 4.73 9.63 12.48 Load-Adj. Return %2.95 -5.12 3.71 3.68 8.11 . Benchmark Return %1.79 -6.70 3.79 3.45 7.30 6.46 Category Average %........................................................................................................................................................................................................... . QQQ QQQQ QQQQQ . Morningstar Rating™. . 549 351 167 . # of Funds in Category
Quarter End Returns as of 06-30-15 YTD 1 Year 3 Year 5 Year 10 Year Since Inception
Fund Return % -0.59 -10.61 4.70 5.97 10.28 12.84Standardized Return % -6.31 -15.75 2.65 4.73 9.63 12.48
Performance Disclosure: The performance data quoted represents past performance and does not guarantee futureresults. The investment return and principal value of an investment will fluctuate; thus an investor’s shares, whenredeemed, may be worth more or less than their original cost.
Portfolio Analysis as of 05-31-15Composition as of 05-31-15 % Assets
U.S. Stocks 0.0Non-U.S. Stocks 92.0Bonds 0.0Cash 3.8Other 4.2
Morningstar Equity Style Box™ as of 05-31-15 % Mkt Cap
LargeM
idSm
all
Value Blend Growth
Giant 50.93........................................................Large 38.45Medium 10.38Small 0.23........................................................Micro 0.00
Top 10 Holdings as of 05-31-15 % Assets
Oppenheimer Institutional Money Market E 3.76Tencent Holdings Ltd 3.17Housing Development Finance Corp Ltd 3.16Baidu Inc ADR 2.94Magnit PJSC 2.92.......................................................................................................Infosys Ltd 2.87Taiwan Semiconductor Manufacturing Co Ltd 2.75OAO Novatek GDR 2.32JD.com Inc ADR 1.91MediaTek Inc 1.79
.......................................................................................................Total Number of Stock Holdings 110Total Number of Bond Holdings 0Annual Turnover Ratio % 26.00Total Fund Assets ($mil) 38,383.43
Morningstar World Regions as of 05-31-15 % Fund S&P 500
Americas 17.75 98.70...............................................................................................North America 0.22 98.70Latin America 17.53 0.00
Greater Europe 25.84 1.03...............................................................................................United Kingdom 4.53 0.13Europe Developed 7.72 0.90Europe Emerging 9.64 0.00Africa/Middle East 3.95 0.00
Greater Asia 56.40 0.27...............................................................................................Japan 0.00 0.00Australasia 0.00 0.00Asia Developed 12.29 0.08Asia Emerging 44.12 0.19
Principal Risks as of 05-31-15Foreign Securities, Loss of Money, Not FDIC Insured, Growth Investing, Market/Market Volatility, Equity Securities, Suitability, ChinaRegion, Management, Small Cap, Mid-Cap
©2015 Morningstar, Inc., Morningstar Investment Profiles™ 312-696-6000. All rights reserved. The information contained herein: (1) is proprietary to Morningstar and/or its content providers; (2) maynot be copied or distributed and (3) is not warranted to be accurate, complete or timely. Neither Morningstar nor its content providers are responsible for any damages or losses arising from any use ofinformation. Past performance is no guarantee of future performance. Visit our investment website at www.morningstar.com ß
®
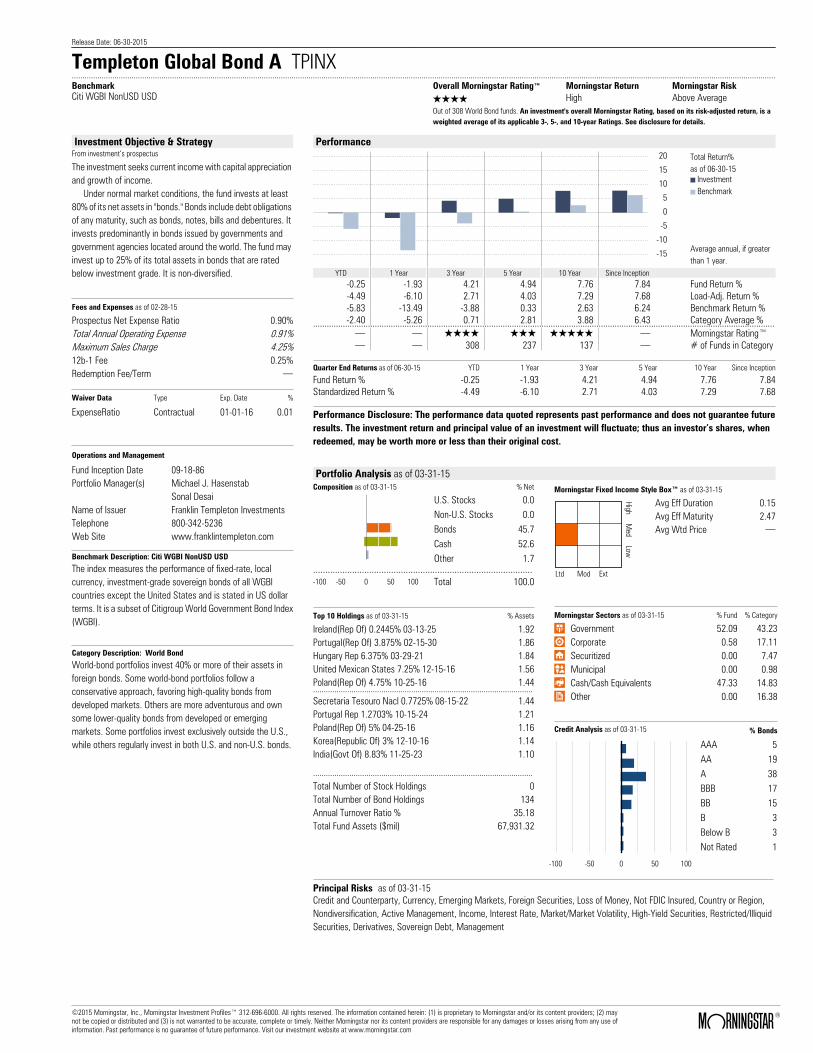
Release Date: 06-30-2015
Templeton Global Bond A TPINX ..........................................................................................................................................................................................................................................................................................................................................BenchmarkCiti WGBI NonUSD USD
Overall Morningstar Rating™ Morningstar Return Morningstar RiskQQQQ High Above AverageOut of 308 World Bond funds. An investment's overall Morningstar Rating, based on its risk-adjusted return, is aweighted average of its applicable 3-, 5-, and 10-year Ratings. See disclosure for details.
Investment Objective & StrategyFrom investment’s prospectus
The investment seeks current income with capital appreciation and growth of income. Under normal market conditions, the fund invests at least 80% of its net assets in "bonds." Bonds include debt obligations of any maturity, such as bonds, notes, bills and debentures. It invests predominantly in bonds issued by governments and government agencies located around the world. The fund may invest up to 25% of its total assets in bonds that are rated below investment grade. It is non-diversified.
Fees and Expenses as of 02-28-15
Prospectus Net Expense Ratio 0.90%Total Annual Operating Expense 0.91%Maximum Sales Charge 4.25%12b-1 Fee 0.25%Redemption Fee/Term .
Waiver Data Type Exp. Date %
ExpenseRatio Contractual 01-01-16 0.01
Operations and Management
Fund Inception Date 09-18-86Portfolio Manager(s) Michael J. Hasenstab
Sonal DesaiName of Issuer Franklin Templeton InvestmentsTelephone 800-342-5236Web Site www.franklintempleton.com
Benchmark Description: Citi WGBI NonUSD USD
The index measures the performance of fixed-rate, localcurrency, investment-grade sovereign bonds of all WGBIcountries except the United States and is stated in US dollarterms. It is a subset of Citigroup World Government Bond Index(WGBI).
Category Description: World Bond
World-bond portfolios invest 40% or more of their assets inforeign bonds. Some world-bond portfolios follow aconservative approach, favoring high-quality bonds fromdeveloped markets. Others are more adventurous and ownsome lower-quality bonds from developed or emergingmarkets. Some portfolios invest exclusively outside the U.S.,while others regularly invest in both U.S. and non-U.S. bonds.
Performance
5
10
15
20
0
-5
-10
-15
YTD YTD YTD YTD YTD YTD
Total Return%as of 06-30-15
InvestmentBenchmark
Average annual, if greaterthan 1 year.
YTD 1 Year 3 Year 5 Year 10 Year Since Inception-0.25 -1.93 4.21 4.94 7.76 7.84 Fund Return %-4.49 -6.10 2.71 4.03 7.29 7.68 Load-Adj. Return %-5.83 -13.49 -3.88 0.33 2.63 6.24 Benchmark Return %-2.40 -5.26 0.71 2.81 3.88 6.43 Category Average %........................................................................................................................................................................................................... . QQQQ QQQ QQQQQ . Morningstar Rating™. . 308 237 137 . # of Funds in Category
Quarter End Returns as of 06-30-15 YTD 1 Year 3 Year 5 Year 10 Year Since Inception
Fund Return % -0.25 -1.93 4.21 4.94 7.76 7.84Standardized Return % -4.49 -6.10 2.71 4.03 7.29 7.68
Performance Disclosure: The performance data quoted represents past performance and does not guarantee futureresults. The investment return and principal value of an investment will fluctuate; thus an investor’s shares, whenredeemed, may be worth more or less than their original cost.
Portfolio Analysis as of 03-31-15Composition as of 03-31-15 % Net
U.S. Stocks 0.0Non-U.S. Stocks 0.0Bonds 45.7Cash 52.6Other 1.7
..........................................................................................-100 -50 0 50 100 Total 100.0
Morningstar Fixed Income Style Box™ as of 03-31-15
HighM
edLow
Ltd Mod Ext
Avg Eff Duration 0.15Avg Eff Maturity 2.47Avg Wtd Price .
Top 10 Holdings as of 03-31-15 % Assets
Ireland(Rep Of) 0.2445% 03-13-25 1.92Portugal(Rep Of) 3.875% 02-15-30 1.86Hungary Rep 6.375% 03-29-21 1.84United Mexican States 7.25% 12-15-16 1.56Poland(Rep Of) 4.75% 10-25-16 1.44.......................................................................................................Secretaria Tesouro Nacl 0.7725% 08-15-22 1.44Portugal Rep 1.2703% 10-15-24 1.21Poland(Rep Of) 5% 04-25-16 1.16Korea(Republic Of) 3% 12-10-16 1.14India(Govt Of) 8.83% 11-25-23 1.10
.......................................................................................................Total Number of Stock Holdings 0Total Number of Bond Holdings 134Annual Turnover Ratio % 35.18Total Fund Assets ($mil) 67,931.32
Morningstar Sectors as of 03-31-15 % Fund % Category
⁄ Government 52.09 43.23› Corporate 0.58 17.11€ Securitized 0.00 7.47‹ Municipal 0.00 0.98fi Cash/Cash Equivalents 47.33 14.83± Other 0.00 16.38
Credit Analysis as of 03-31-15 % Bonds
-100 -50 0 50 100
AAA 5AA 19A 38BBB 17BB 15B 3Below B 3Not Rated 1
Principal Risks as of 03-31-15Credit and Counterparty, Currency, Emerging Markets, Foreign Securities, Loss of Money, Not FDIC Insured, Country or Region,Nondiversification, Active Management, Income, Interest Rate, Market/Market Volatility, High-Yield Securities, Restricted/IlliquidSecurities, Derivatives, Sovereign Debt, Management
©2015 Morningstar, Inc., Morningstar Investment Profiles™ 312-696-6000. All rights reserved. The information contained herein: (1) is proprietary to Morningstar and/or its content providers; (2) maynot be copied or distributed and (3) is not warranted to be accurate, complete or timely. Neither Morningstar nor its content providers are responsible for any damages or losses arising from any use ofinformation. Past performance is no guarantee of future performance. Visit our investment website at www.morningstar.com ß
®
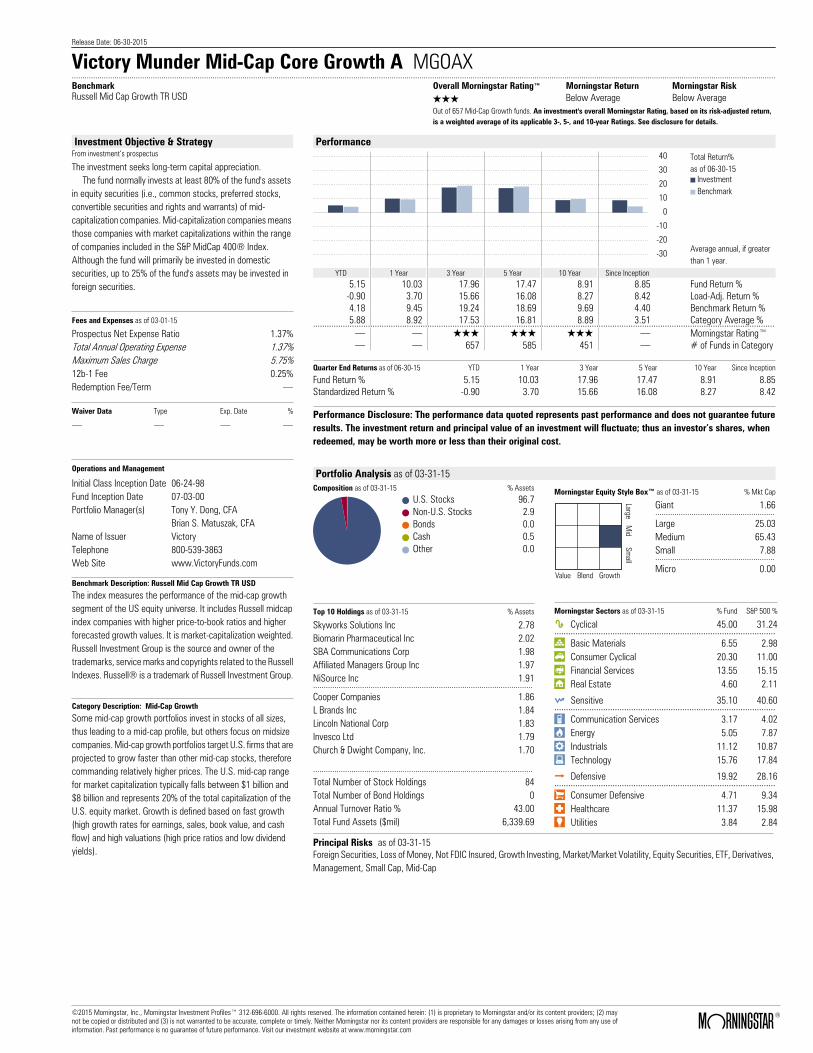
Release Date: 06-30-2015
Victory Munder Mid-Cap Core Growth A MGOAX ..........................................................................................................................................................................................................................................................................................................................................BenchmarkRussell Mid Cap Growth TR USD
Overall Morningstar Rating™ Morningstar Return Morningstar RiskQQQ Below Average Below AverageOut of 657 Mid-Cap Growth funds. An investment's overall Morningstar Rating, based on its risk-adjusted return,is a weighted average of its applicable 3-, 5-, and 10-year Ratings. See disclosure for details.
Investment Objective & StrategyFrom investment’s prospectus
The investment seeks long-term capital appreciation. The fund normally invests at least 80% of the fund's assets in equity securities (i.e., common stocks, preferred stocks, convertible securities and rights and warrants) of mid-capitalization companies. Mid-capitalization companies means those companies with market capitalizations within the range of companies included in the S&P MidCap 400® Index. Although the fund will primarily be invested in domestic securities, up to 25% of the fund's assets may be invested in foreign securities.
Fees and Expenses as of 03-01-15
Prospectus Net Expense Ratio 1.37%Total Annual Operating Expense 1.37%Maximum Sales Charge 5.75%12b-1 Fee 0.25%Redemption Fee/Term .
Waiver Data Type Exp. Date %
. . . .
Operations and Management
Initial Class Inception Date 06-24-98Fund Inception Date 07-03-00Portfolio Manager(s) Tony Y. Dong, CFA
Brian S. Matuszak, CFAName of Issuer VictoryTelephone 800-539-3863Web Site www.VictoryFunds.com
Benchmark Description: Russell Mid Cap Growth TR USD
The index measures the performance of the mid-cap growthsegment of the US equity universe. It includes Russell midcapindex companies with higher price-to-book ratios and higherforecasted growth values. It is market-capitalization weighted.Russell Investment Group is the source and owner of thetrademarks, service marks and copyrights related to the RussellIndexes. Russell® is a trademark of Russell Investment Group.
Category Description: Mid-Cap Growth
Some mid-cap growth portfolios invest in stocks of all sizes,thus leading to a mid-cap profile, but others focus on midsizecompanies. Mid-cap growth portfolios target U.S. firms that areprojected to grow faster than other mid-cap stocks, thereforecommanding relatively higher prices. The U.S. mid-cap rangefor market capitalization typically falls between $1 billion and$8 billion and represents 20% of the total capitalization of theU.S. equity market. Growth is defined based on fast growth(high growth rates for earnings, sales, book value, and cashflow) and high valuations (high price ratios and low dividendyields).
Performance
10
20
30
40
0
-10
-20
-30
YTD YTD YTD YTD YTD YTD
Total Return%as of 06-30-15
InvestmentBenchmark
Average annual, if greaterthan 1 year.
YTD 1 Year 3 Year 5 Year 10 Year Since Inception5.15 10.03 17.96 17.47 8.91 8.85 Fund Return %
-0.90 3.70 15.66 16.08 8.27 8.42 Load-Adj. Return %4.18 9.45 19.24 18.69 9.69 4.40 Benchmark Return %5.88 8.92 17.53 16.81 8.89 3.51 Category Average %........................................................................................................................................................................................................... . QQQ QQQ QQQ . Morningstar Rating™. . 657 585 451 . # of Funds in Category
Quarter End Returns as of 06-30-15 YTD 1 Year 3 Year 5 Year 10 Year Since Inception
Fund Return % 5.15 10.03 17.96 17.47 8.91 8.85Standardized Return % -0.90 3.70 15.66 16.08 8.27 8.42
Performance Disclosure: The performance data quoted represents past performance and does not guarantee futureresults. The investment return and principal value of an investment will fluctuate; thus an investor’s shares, whenredeemed, may be worth more or less than their original cost.
Portfolio Analysis as of 03-31-15Composition as of 03-31-15 % Assets
U.S. Stocks 96.7Non-U.S. Stocks 2.9Bonds 0.0Cash 0.5Other 0.0
Morningstar Equity Style Box™ as of 03-31-15 % Mkt Cap
LargeM
idSm
all
Value Blend Growth
Giant 1.66........................................................Large 25.03Medium 65.43Small 7.88........................................................Micro 0.00
Top 10 Holdings as of 03-31-15 % Assets
Skyworks Solutions Inc 2.78Biomarin Pharmaceutical Inc 2.02SBA Communications Corp 1.98Affiliated Managers Group Inc 1.97NiSource Inc 1.91.......................................................................................................Cooper Companies 1.86L Brands Inc 1.84Lincoln National Corp 1.83Invesco Ltd 1.79Church & Dwight Company, Inc. 1.70
.......................................................................................................Total Number of Stock Holdings 84Total Number of Bond Holdings 0Annual Turnover Ratio % 43.00Total Fund Assets ($mil) 6,339.69
Morningstar Sectors as of 03-31-15 % Fund S&P 500 %
h Cyclical 45.00 31.24...............................................................................................r Basic Materials 6.55 2.98t Consumer Cyclical 20.30 11.00y Financial Services 13.55 15.15u Real Estate 4.60 2.11
j Sensitive 35.10 40.60...............................................................................................i Communication Services 3.17 4.02o Energy 5.05 7.87p Industrials 11.12 10.87a Technology 15.76 17.84
k Defensive 19.92 28.16...............................................................................................s Consumer Defensive 4.71 9.34d Healthcare 11.37 15.98f Utilities 3.84 2.84
Principal Risks as of 03-31-15Foreign Securities, Loss of Money, Not FDIC Insured, Growth Investing, Market/Market Volatility, Equity Securities, ETF, Derivatives,Management, Small Cap, Mid-Cap
©2015 Morningstar, Inc., Morningstar Investment Profiles™ 312-696-6000. All rights reserved. The information contained herein: (1) is proprietary to Morningstar and/or its content providers; (2) maynot be copied or distributed and (3) is not warranted to be accurate, complete or timely. Neither Morningstar nor its content providers are responsible for any damages or losses arising from any use ofinformation. Past performance is no guarantee of future performance. Visit our investment website at www.morningstar.com ß
®
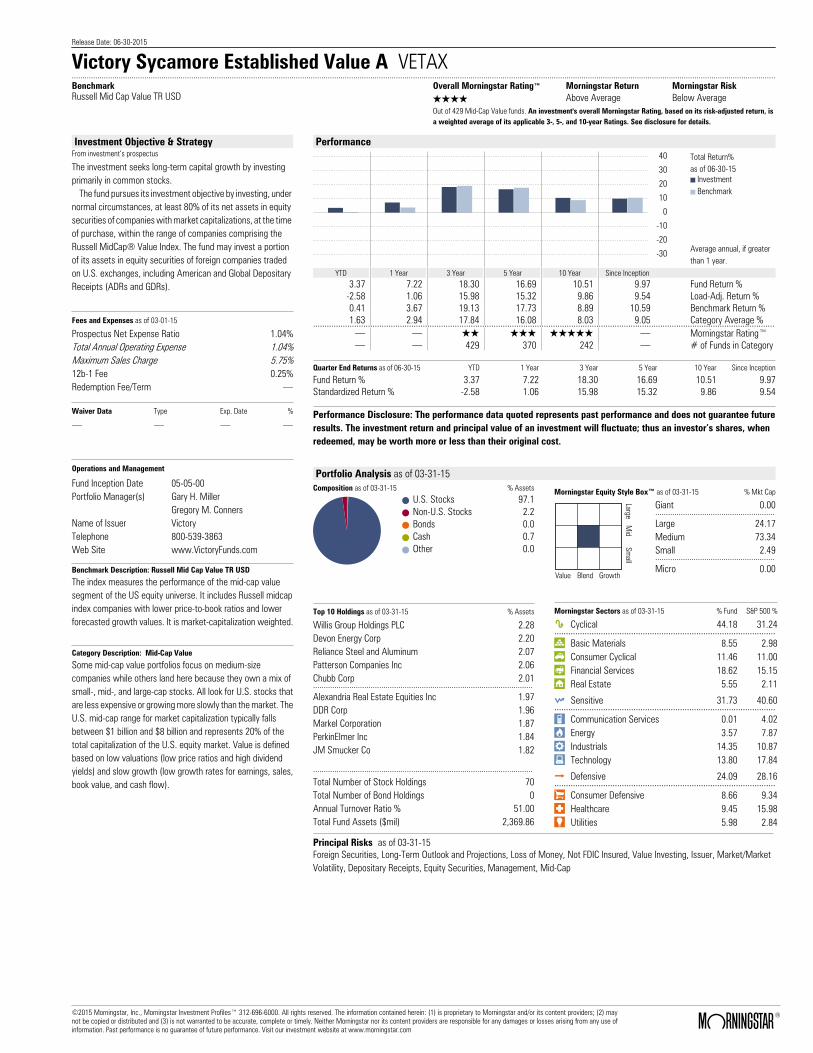
Release Date: 06-30-2015
Victory Sycamore Established Value A VETAX ..........................................................................................................................................................................................................................................................................................................................................BenchmarkRussell Mid Cap Value TR USD
Overall Morningstar Rating™ Morningstar Return Morningstar RiskQQQQ Above Average Below AverageOut of 429 Mid-Cap Value funds. An investment's overall Morningstar Rating, based on its risk-adjusted return, isa weighted average of its applicable 3-, 5-, and 10-year Ratings. See disclosure for details.
Investment Objective & StrategyFrom investment’s prospectus
The investment seeks long-term capital growth by investing primarily in common stocks. The fund pursues its investment objective by investing, under normal circumstances, at least 80% of its net assets in equity securities of companies with market capitalizations, at the time of purchase, within the range of companies comprising the Russell MidCap® Value Index. The fund may invest a portion of its assets in equity securities of foreign companies traded on U.S. exchanges, including American and Global Depositary Receipts (ADRs and GDRs).
Fees and Expenses as of 03-01-15
Prospectus Net Expense Ratio 1.04%Total Annual Operating Expense 1.04%Maximum Sales Charge 5.75%12b-1 Fee 0.25%Redemption Fee/Term .
Waiver Data Type Exp. Date %
. . . .
Operations and Management
Fund Inception Date 05-05-00Portfolio Manager(s) Gary H. Miller
Gregory M. ConnersName of Issuer VictoryTelephone 800-539-3863Web Site www.VictoryFunds.com
Benchmark Description: Russell Mid Cap Value TR USD
The index measures the performance of the mid-cap valuesegment of the US equity universe. It includes Russell midcapindex companies with lower price-to-book ratios and lowerforecasted growth values. It is market-capitalization weighted.
Category Description: Mid-Cap Value
Some mid-cap value portfolios focus on medium-sizecompanies while others land here because they own a mix ofsmall-, mid-, and large-cap stocks. All look for U.S. stocks thatare less expensive or growing more slowly than the market. TheU.S. mid-cap range for market capitalization typically fallsbetween $1 billion and $8 billion and represents 20% of thetotal capitalization of the U.S. equity market. Value is definedbased on low valuations (low price ratios and high dividendyields) and slow growth (low growth rates for earnings, sales,book value, and cash flow).
Performance
10
20
30
40
0
-10
-20
-30
YTD YTD YTD YTD YTD YTD
Total Return%as of 06-30-15
InvestmentBenchmark
Average annual, if greaterthan 1 year.
YTD 1 Year 3 Year 5 Year 10 Year Since Inception3.37 7.22 18.30 16.69 10.51 9.97 Fund Return %
-2.58 1.06 15.98 15.32 9.86 9.54 Load-Adj. Return %0.41 3.67 19.13 17.73 8.89 10.59 Benchmark Return %1.63 2.94 17.84 16.08 8.03 9.05 Category Average %........................................................................................................................................................................................................... . QQ QQQ QQQQQ . Morningstar Rating™. . 429 370 242 . # of Funds in Category
Quarter End Returns as of 06-30-15 YTD 1 Year 3 Year 5 Year 10 Year Since Inception
Fund Return % 3.37 7.22 18.30 16.69 10.51 9.97Standardized Return % -2.58 1.06 15.98 15.32 9.86 9.54
Performance Disclosure: The performance data quoted represents past performance and does not guarantee futureresults. The investment return and principal value of an investment will fluctuate; thus an investor’s shares, whenredeemed, may be worth more or less than their original cost.
Portfolio Analysis as of 03-31-15Composition as of 03-31-15 % Assets
U.S. Stocks 97.1Non-U.S. Stocks 2.2Bonds 0.0Cash 0.7Other 0.0
Morningstar Equity Style Box™ as of 03-31-15 % Mkt Cap
LargeM
idSm
all
Value Blend Growth
Giant 0.00........................................................Large 24.17Medium 73.34Small 2.49........................................................Micro 0.00
Top 10 Holdings as of 03-31-15 % Assets
Willis Group Holdings PLC 2.28Devon Energy Corp 2.20Reliance Steel and Aluminum 2.07Patterson Companies Inc 2.06Chubb Corp 2.01.......................................................................................................Alexandria Real Estate Equities Inc 1.97DDR Corp 1.96Markel Corporation 1.87PerkinElmer Inc 1.84JM Smucker Co 1.82
.......................................................................................................Total Number of Stock Holdings 70Total Number of Bond Holdings 0Annual Turnover Ratio % 51.00Total Fund Assets ($mil) 2,369.86
Morningstar Sectors as of 03-31-15 % Fund S&P 500 %
h Cyclical 44.18 31.24...............................................................................................r Basic Materials 8.55 2.98t Consumer Cyclical 11.46 11.00y Financial Services 18.62 15.15u Real Estate 5.55 2.11
j Sensitive 31.73 40.60...............................................................................................i Communication Services 0.01 4.02o Energy 3.57 7.87p Industrials 14.35 10.87a Technology 13.80 17.84
k Defensive 24.09 28.16...............................................................................................s Consumer Defensive 8.66 9.34d Healthcare 9.45 15.98f Utilities 5.98 2.84
Principal Risks as of 03-31-15Foreign Securities, Long-Term Outlook and Projections, Loss of Money, Not FDIC Insured, Value Investing, Issuer, Market/MarketVolatility, Depositary Receipts, Equity Securities, Management, Mid-Cap
©2015 Morningstar, Inc., Morningstar Investment Profiles™ 312-696-6000. All rights reserved. The information contained herein: (1) is proprietary to Morningstar and/or its content providers; (2) maynot be copied or distributed and (3) is not warranted to be accurate, complete or timely. Neither Morningstar nor its content providers are responsible for any damages or losses arising from any use ofinformation. Past performance is no guarantee of future performance. Visit our investment website at www.morningstar.com ß
®
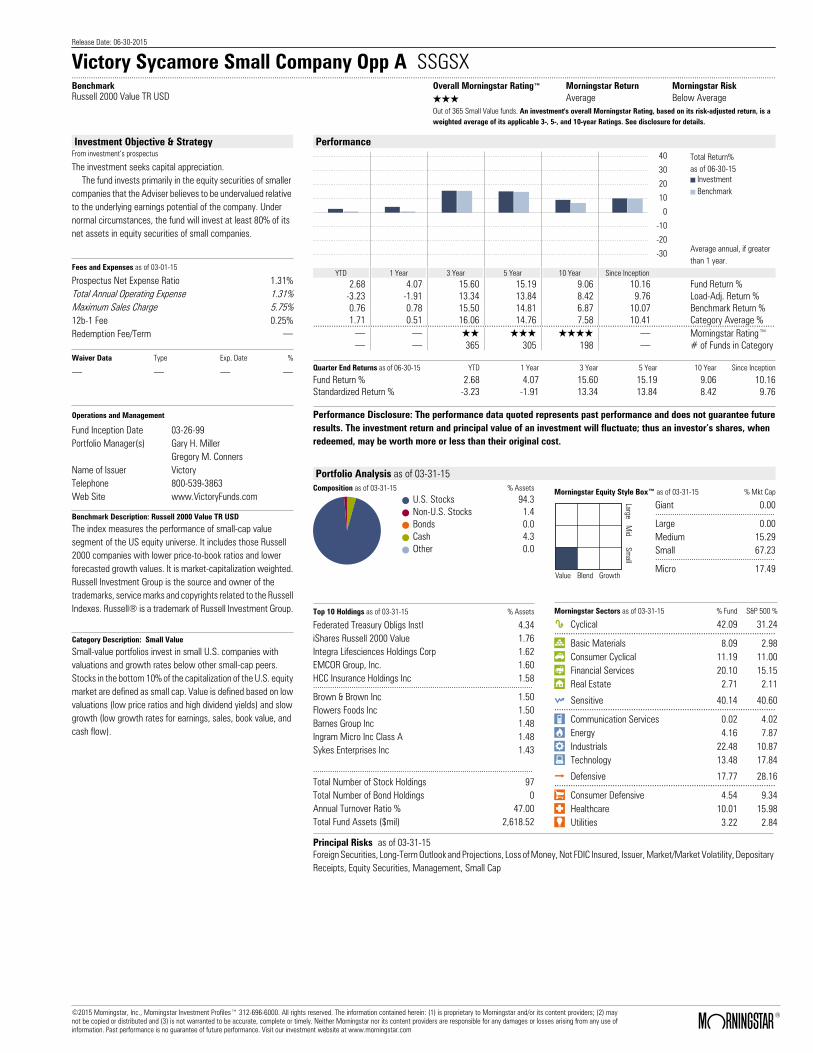
Release Date: 06-30-2015
Victory Sycamore Small Company Opp A SSGSX ..........................................................................................................................................................................................................................................................................................................................................BenchmarkRussell 2000 Value TR USD
Overall Morningstar Rating™ Morningstar Return Morningstar RiskQQQ Average Below AverageOut of 365 Small Value funds. An investment's overall Morningstar Rating, based on its risk-adjusted return, is aweighted average of its applicable 3-, 5-, and 10-year Ratings. See disclosure for details.
Investment Objective & StrategyFrom investment’s prospectus
The investment seeks capital appreciation. The fund invests primarily in the equity securities of smaller companies that the Adviser believes to be undervalued relative to the underlying earnings potential of the company. Under normal circumstances, the fund will invest at least 80% of its net assets in equity securities of small companies.
Fees and Expenses as of 03-01-15
Prospectus Net Expense Ratio 1.31%Total Annual Operating Expense 1.31%Maximum Sales Charge 5.75%12b-1 Fee 0.25%Redemption Fee/Term .
Waiver Data Type Exp. Date %
. . . .
Operations and Management
Fund Inception Date 03-26-99Portfolio Manager(s) Gary H. Miller
Gregory M. ConnersName of Issuer VictoryTelephone 800-539-3863Web Site www.VictoryFunds.com
Benchmark Description: Russell 2000 Value TR USD
The index measures the performance of small-cap valuesegment of the US equity universe. It includes those Russell2000 companies with lower price-to-book ratios and lowerforecasted growth values. It is market-capitalization weighted.Russell Investment Group is the source and owner of thetrademarks, service marks and copyrights related to the RussellIndexes. Russell® is a trademark of Russell Investment Group.
Category Description: Small Value
Small-value portfolios invest in small U.S. companies withvaluations and growth rates below other small-cap peers.Stocks in the bottom 10% of the capitalization of the U.S. equitymarket are defined as small cap. Value is defined based on lowvaluations (low price ratios and high dividend yields) and slowgrowth (low growth rates for earnings, sales, book value, andcash flow).
Performance
10
20
30
40
0
-10
-20
-30
YTD YTD YTD YTD YTD YTD
Total Return%as of 06-30-15
InvestmentBenchmark
Average annual, if greaterthan 1 year.
YTD 1 Year 3 Year 5 Year 10 Year Since Inception2.68 4.07 15.60 15.19 9.06 10.16 Fund Return %
-3.23 -1.91 13.34 13.84 8.42 9.76 Load-Adj. Return %0.76 0.78 15.50 14.81 6.87 10.07 Benchmark Return %1.71 0.51 16.06 14.76 7.58 10.41 Category Average %........................................................................................................................................................................................................... . QQ QQQ QQQQ . Morningstar Rating™. . 365 305 198 . # of Funds in Category
Quarter End Returns as of 06-30-15 YTD 1 Year 3 Year 5 Year 10 Year Since Inception
Fund Return % 2.68 4.07 15.60 15.19 9.06 10.16Standardized Return % -3.23 -1.91 13.34 13.84 8.42 9.76
Performance Disclosure: The performance data quoted represents past performance and does not guarantee futureresults. The investment return and principal value of an investment will fluctuate; thus an investor’s shares, whenredeemed, may be worth more or less than their original cost.
Portfolio Analysis as of 03-31-15Composition as of 03-31-15 % Assets
U.S. Stocks 94.3Non-U.S. Stocks 1.4Bonds 0.0Cash 4.3Other 0.0
Morningstar Equity Style Box™ as of 03-31-15 % Mkt Cap
LargeM
idSm
all
Value Blend Growth
Giant 0.00........................................................Large 0.00Medium 15.29Small 67.23........................................................Micro 17.49
Top 10 Holdings as of 03-31-15 % Assets
Federated Treasury Obligs Instl 4.34iShares Russell 2000 Value 1.76Integra Lifesciences Holdings Corp 1.62EMCOR Group, Inc. 1.60HCC Insurance Holdings Inc 1.58.......................................................................................................Brown & Brown Inc 1.50Flowers Foods Inc 1.50Barnes Group Inc 1.48Ingram Micro Inc Class A 1.48Sykes Enterprises Inc 1.43
.......................................................................................................Total Number of Stock Holdings 97Total Number of Bond Holdings 0Annual Turnover Ratio % 47.00Total Fund Assets ($mil) 2,618.52
Morningstar Sectors as of 03-31-15 % Fund S&P 500 %
h Cyclical 42.09 31.24...............................................................................................r Basic Materials 8.09 2.98t Consumer Cyclical 11.19 11.00y Financial Services 20.10 15.15u Real Estate 2.71 2.11
j Sensitive 40.14 40.60...............................................................................................i Communication Services 0.02 4.02o Energy 4.16 7.87p Industrials 22.48 10.87a Technology 13.48 17.84
k Defensive 17.77 28.16...............................................................................................s Consumer Defensive 4.54 9.34d Healthcare 10.01 15.98f Utilities 3.22 2.84
Principal Risks as of 03-31-15Foreign Securities, Long-Term Outlook and Projections, Loss of Money, Not FDIC Insured, Issuer, Market/Market Volatility, DepositaryReceipts, Equity Securities, Management, Small Cap
©2015 Morningstar, Inc., Morningstar Investment Profiles™ 312-696-6000. All rights reserved. The information contained herein: (1) is proprietary to Morningstar and/or its content providers; (2) maynot be copied or distributed and (3) is not warranted to be accurate, complete or timely. Neither Morningstar nor its content providers are responsible for any damages or losses arising from any use ofinformation. Past performance is no guarantee of future performance. Visit our investment website at www.morningstar.com ß
®
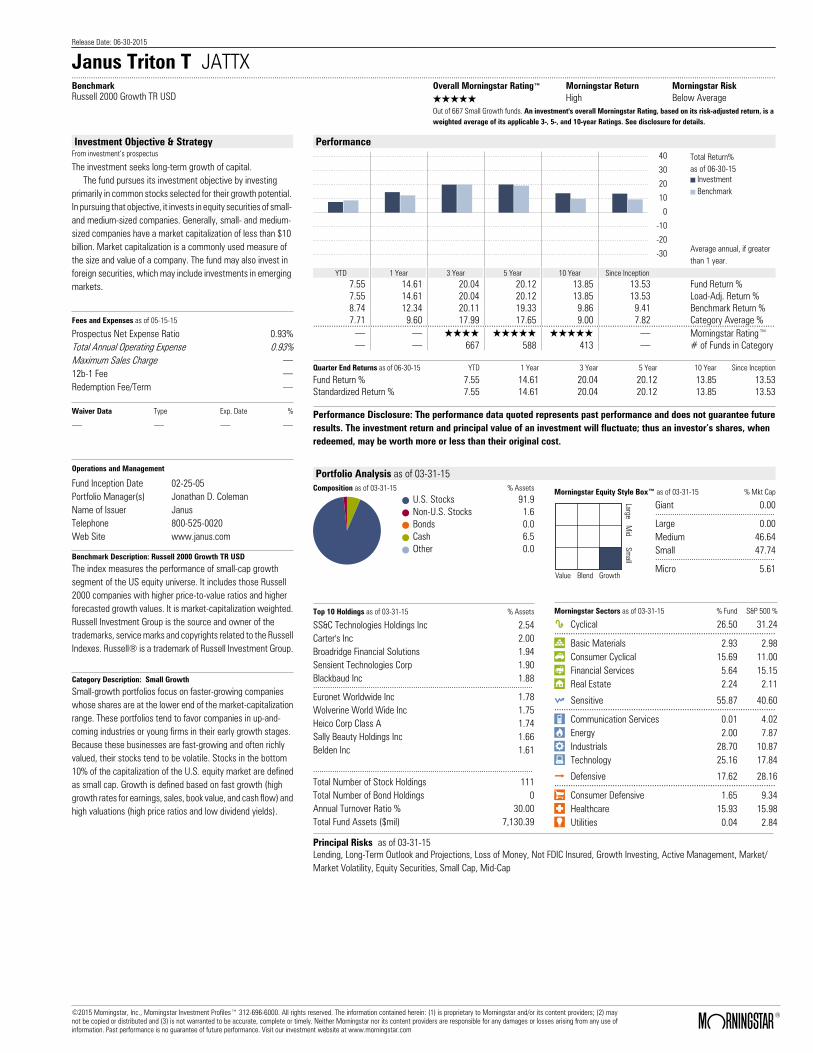
Release Date: 06-30-2015
Janus Triton T JATTX ..........................................................................................................................................................................................................................................................................................................................................BenchmarkRussell 2000 Growth TR USD
Overall Morningstar Rating™ Morningstar Return Morningstar RiskQQQQQ High Below AverageOut of 667 Small Growth funds. An investment's overall Morningstar Rating, based on its risk-adjusted return, is aweighted average of its applicable 3-, 5-, and 10-year Ratings. See disclosure for details.
Investment Objective & StrategyFrom investment’s prospectus
The investment seeks long-term growth of capital. The fund pursues its investment objective by investing primarily in common stocks selected for their growth potential. In pursuing that objective, it invests in equity securities of small- and medium-sized companies. Generally, small- and medium-sized companies have a market capitalization of less than $10 billion. Market capitalization is a commonly used measure of the size and value of a company. The fund may also invest in foreign securities, which may include investments in emerging markets.
Fees and Expenses as of 05-15-15
Prospectus Net Expense Ratio 0.93%Total Annual Operating Expense 0.93%Maximum Sales Charge .12b-1 Fee .Redemption Fee/Term .
Waiver Data Type Exp. Date %
. . . .
Operations and Management
Fund Inception Date 02-25-05Portfolio Manager(s) Jonathan D. ColemanName of Issuer JanusTelephone 800-525-0020Web Site www.janus.com
Benchmark Description: Russell 2000 Growth TR USD
The index measures the performance of small-cap growthsegment of the US equity universe. It includes those Russell2000 companies with higher price-to-value ratios and higherforecasted growth values. It is market-capitalization weighted.Russell Investment Group is the source and owner of thetrademarks, service marks and copyrights related to the RussellIndexes. Russell® is a trademark of Russell Investment Group.
Category Description: Small Growth
Small-growth portfolios focus on faster-growing companieswhose shares are at the lower end of the market-capitalizationrange. These portfolios tend to favor companies in up-and-coming industries or young firms in their early growth stages.Because these businesses are fast-growing and often richlyvalued, their stocks tend to be volatile. Stocks in the bottom10% of the capitalization of the U.S. equity market are definedas small cap. Growth is defined based on fast growth (highgrowth rates for earnings, sales, book value, and cash flow) andhigh valuations (high price ratios and low dividend yields).
Performance
10
20
30
40
0
-10
-20
-30
YTD YTD YTD YTD YTD YTD
Total Return%as of 06-30-15
InvestmentBenchmark
Average annual, if greaterthan 1 year.
YTD 1 Year 3 Year 5 Year 10 Year Since Inception7.55 14.61 20.04 20.12 13.85 13.53 Fund Return %7.55 14.61 20.04 20.12 13.85 13.53 Load-Adj. Return %8.74 12.34 20.11 19.33 9.86 9.41 Benchmark Return %7.71 9.60 17.99 17.65 9.00 7.82 Category Average %........................................................................................................................................................................................................... . QQQQ QQQQQ QQQQQ . Morningstar Rating™. . 667 588 413 . # of Funds in Category
Quarter End Returns as of 06-30-15 YTD 1 Year 3 Year 5 Year 10 Year Since Inception
Fund Return % 7.55 14.61 20.04 20.12 13.85 13.53Standardized Return % 7.55 14.61 20.04 20.12 13.85 13.53
Performance Disclosure: The performance data quoted represents past performance and does not guarantee futureresults. The investment return and principal value of an investment will fluctuate; thus an investor’s shares, whenredeemed, may be worth more or less than their original cost.
Portfolio Analysis as of 03-31-15Composition as of 03-31-15 % Assets
U.S. Stocks 91.9Non-U.S. Stocks 1.6Bonds 0.0Cash 6.5Other 0.0
Morningstar Equity Style Box™ as of 03-31-15 % Mkt Cap
LargeM
idSm
all
Value Blend Growth
Giant 0.00........................................................Large 0.00Medium 46.64Small 47.74........................................................Micro 5.61
Top 10 Holdings as of 03-31-15 % Assets
SS&C Technologies Holdings Inc 2.54Carter's Inc 2.00Broadridge Financial Solutions 1.94Sensient Technologies Corp 1.90Blackbaud Inc 1.88.......................................................................................................Euronet Worldwide Inc 1.78Wolverine World Wide Inc 1.75Heico Corp Class A 1.74Sally Beauty Holdings Inc 1.66Belden Inc 1.61
.......................................................................................................Total Number of Stock Holdings 111Total Number of Bond Holdings 0Annual Turnover Ratio % 30.00Total Fund Assets ($mil) 7,130.39
Morningstar Sectors as of 03-31-15 % Fund S&P 500 %
h Cyclical 26.50 31.24...............................................................................................r Basic Materials 2.93 2.98t Consumer Cyclical 15.69 11.00y Financial Services 5.64 15.15u Real Estate 2.24 2.11
j Sensitive 55.87 40.60...............................................................................................i Communication Services 0.01 4.02o Energy 2.00 7.87p Industrials 28.70 10.87a Technology 25.16 17.84
k Defensive 17.62 28.16...............................................................................................s Consumer Defensive 1.65 9.34d Healthcare 15.93 15.98f Utilities 0.04 2.84
Principal Risks as of 03-31-15Lending, Long-Term Outlook and Projections, Loss of Money, Not FDIC Insured, Growth Investing, Active Management, Market/Market Volatility, Equity Securities, Small Cap, Mid-Cap
©2015 Morningstar, Inc., Morningstar Investment Profiles™ 312-696-6000. All rights reserved. The information contained herein: (1) is proprietary to Morningstar and/or its content providers; (2) maynot be copied or distributed and (3) is not warranted to be accurate, complete or timely. Neither Morningstar nor its content providers are responsible for any damages or losses arising from any use ofinformation. Past performance is no guarantee of future performance. Visit our investment website at www.morningstar.com ß
®
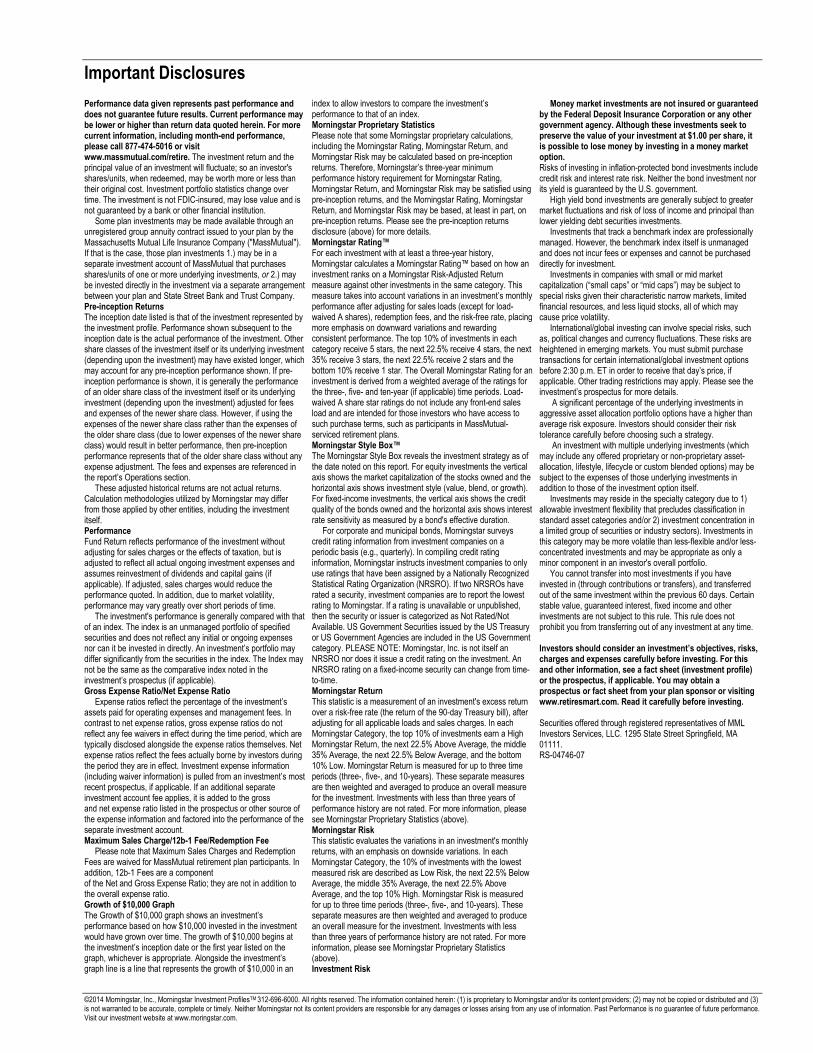
Important Disclosures
©2014 Morningstar, Inc., Morningstar Investment ProfilesTM 312-696-6000. All rights reserved. The information contained herein: (1) is proprietary to Morningstar and/or its content providers; (2) may not be copied or distributed and (3) is not warranted to be accurate, complete or timely. Neither Morningstar not its content providers are responsible for any damages or losses arising from any use of information. Past Performance is no guarantee of future performance. Visit our investment website at www.moringstar.com.
Performance data given represents past performance and does not guarantee future results. Current performance may be lower or higher than return data quoted herein. For more current information, including month-end performance, please call 877-474-5016 or visit www.massmutual.com/retire. The investment return and the principal value of an investment will fluctuate; so an investor's shares/units, when redeemed, may be worth more or less than their original cost. Investment portfolio statistics change over time. The investment is not FDIC-insured, may lose value and is not guaranteed by a bank or other financial institution. Some plan investments may be made available through an unregistered group annuity contract issued to your plan by the Massachusetts Mutual Life Insurance Company ("MassMutual"). If that is the case, those plan investments 1.) may be in a separate investment account of MassMutual that purchases shares/units of one or more underlying investments, or 2.) may be invested directly in the investment via a separate arrangement between your plan and State Street Bank and Trust Company. Pre-inception Returns The inception date listed is that of the investment represented by the investment profile. Performance shown subsequent to the inception date is the actual performance of the investment. Other share classes of the investment itself or its underlying investment (depending upon the investment) may have existed longer, which may account for any pre-inception performance shown. If pre-inception performance is shown, it is generally the performance of an older share class of the investment itself or its underlying investment (depending upon the investment) adjusted for fees and expenses of the newer share class. However, if using the expenses of the newer share class rather than the expenses of the older share class (due to lower expenses of the newer share class) would result in better performance, then pre-inception performance represents that of the older share class without any expense adjustment. The fees and expenses are referenced in the report’s Operations section. These adjusted historical returns are not actual returns. Calculation methodologies utilized by Morningstar may differ from those applied by other entities, including the investment itself. Performance Fund Return reflects performance of the investment without adjusting for sales charges or the effects of taxation, but is adjusted to reflect all actual ongoing investment expenses and assumes reinvestment of dividends and capital gains (if applicable). If adjusted, sales charges would reduce the performance quoted. In addition, due to market volatility, performance may vary greatly over short periods of time. The investment's performance is generally compared with that of an index. The index is an unmanaged portfolio of specified securities and does not reflect any initial or ongoing expenses nor can it be invested in directly. An investment’s portfolio may differ significantly from the securities in the index. The Index may not be the same as the comparative index noted in the investment’s prospectus (if applicable). Gross Expense Ratio/Net Expense Ratio Expense ratios reflect the percentage of the investment’s assets paid for operating expenses and management fees. In contrast to net expense ratios, gross expense ratios do not reflect any fee waivers in effect during the time period, which are typically disclosed alongside the expense ratios themselves. Net expense ratios reflect the fees actually borne by investors during the period they are in effect. Investment expense information (including waiver information) is pulled from an investment’s most recent prospectus, if applicable. If an additional separate investment account fee applies, it is added to the gross and net expense ratio listed in the prospectus or other source of the expense information and factored into the performance of the separate investment account. Maximum Sales Charge/12b-1 Fee/Redemption Fee Please note that Maximum Sales Charges and Redemption Fees are waived for MassMutual retirement plan participants. In addition, 12b-1 Fees are a component of the Net and Gross Expense Ratio; they are not in addition to the overall expense ratio. Growth of $10,000 Graph The Growth of $10,000 graph shows an investment’s performance based on how $10,000 invested in the investment would have grown over time. The growth of $10,000 begins at the investment’s inception date or the first year listed on the graph, whichever is appropriate. Alongside the investment’s graph line is a line that represents the growth of $10,000 in an
index to allow investors to compare the investment’s performance to that of an index. Morningstar Proprietary Statistics Please note that some Morningstar proprietary calculations, including the Morningstar Rating, Morningstar Return, and Morningstar Risk may be calculated based on pre-inception returns. Therefore, Morningstar’s three-year minimum performance history requirement for Morningstar Rating, Morningstar Return, and Morningstar Risk may be satisfied using pre-inception returns, and the Morningstar Rating, Morningstar Return, and Morningstar Risk may be based, at least in part, on pre-inception returns. Please see the pre-inception returns disclosure (above) for more details. Morningstar Rating™ For each investment with at least a three-year history, Morningstar calculates a Morningstar Rating™ based on how an investment ranks on a Morningstar Risk-Adjusted Return measure against other investments in the same category. This measure takes into account variations in an investment’s monthly performance after adjusting for sales loads (except for load-waived A shares), redemption fees, and the risk-free rate, placing more emphasis on downward variations and rewarding consistent performance. The top 10% of investments in each category receive 5 stars, the next 22.5% receive 4 stars, the next 35% receive 3 stars, the next 22.5% receive 2 stars and the bottom 10% receive 1 star. The Overall Morningstar Rating for an investment is derived from a weighted average of the ratings for the three-, five- and ten-year (if applicable) time periods. Load-waived A share star ratings do not include any front-end sales load and are intended for those investors who have access to such purchase terms, such as participants in MassMutual-serviced retirement plans. Morningstar Style Box™ The Morningstar Style Box reveals the investment strategy as of the date noted on this report. For equity investments the vertical axis shows the market capitalization of the stocks owned and the horizontal axis shows investment style (value, blend, or growth). For fixed-income investments, the vertical axis shows the credit quality of the bonds owned and the horizontal axis shows interest rate sensitivity as measured by a bond's effective duration. For corporate and municipal bonds, Morningstar surveys credit rating information from investment companies on a periodic basis (e.g., quarterly). In compiling credit rating information, Morningstar instructs investment companies to only use ratings that have been assigned by a Nationally Recognized Statistical Rating Organization (NRSRO). If two NRSROs have rated a security, investment companies are to report the lowest rating to Morningstar. If a rating is unavailable or unpublished, then the security or issuer is categorized as Not Rated/Not Available. US Government Securities issued by the US Treasury or US Government Agencies are included in the US Government category. PLEASE NOTE: Morningstar, Inc. is not itself an NRSRO nor does it issue a credit rating on the investment. An NRSRO rating on a fixed-income security can change from time-to-time. Morningstar Return This statistic is a measurement of an investment's excess return over a risk-free rate (the return of the 90-day Treasury bill), after adjusting for all applicable loads and sales charges. In each Morningstar Category, the top 10% of investments earn a High Morningstar Return, the next 22.5% Above Average, the middle 35% Average, the next 22.5% Below Average, and the bottom 10% Low. Morningstar Return is measured for up to three time periods (three-, five-, and 10-years). These separate measures are then weighted and averaged to produce an overall measure for the investment. Investments with less than three years of performance history are not rated. For more information, please see Morningstar Proprietary Statistics (above). Morningstar Risk This statistic evaluates the variations in an investment's monthly returns, with an emphasis on downside variations. In each Morningstar Category, the 10% of investments with the lowest measured risk are described as Low Risk, the next 22.5% Below Average, the middle 35% Average, the next 22.5% Above Average, and the top 10% High. Morningstar Risk is measured for up to three time periods (three-, five-, and 10-years). These separate measures are then weighted and averaged to produce an overall measure for the investment. Investments with less than three years of performance history are not rated. For more information, please see Morningstar Proprietary Statistics (above). Investment Risk
Money market investments are not insured or guaranteed by the Federal Deposit Insurance Corporation or any other government agency. Although these investments seek to preserve the value of your investment at $1.00 per share, it is possible to lose money by investing in a money market option. Risks of investing in inflation-protected bond investments include credit risk and interest rate risk. Neither the bond investment nor its yield is guaranteed by the U.S. government. High yield bond investments are generally subject to greater market fluctuations and risk of loss of income and principal than lower yielding debt securities investments. Investments that track a benchmark index are professionally managed. However, the benchmark index itself is unmanaged and does not incur fees or expenses and cannot be purchased directly for investment. Investments in companies with small or mid market capitalization (“small caps” or “mid caps”) may be subject to special risks given their characteristic narrow markets, limited financial resources, and less liquid stocks, all of which may cause price volatility. International/global investing can involve special risks, such as, political changes and currency fluctuations. These risks are heightened in emerging markets. You must submit purchase transactions for certain international/global investment options before 2:30 p.m. ET in order to receive that day’s price, if applicable. Other trading restrictions may apply. Please see the investment’s prospectus for more details. A significant percentage of the underlying investments in aggressive asset allocation portfolio options have a higher than average risk exposure. Investors should consider their risk tolerance carefully before choosing such a strategy. An investment with multiple underlying investments (which may include any offered proprietary or non-proprietary asset-allocation, lifestyle, lifecycle or custom blended options) may be subject to the expenses of those underlying investments in addition to those of the investment option itself. Investments may reside in the specialty category due to 1) allowable investment flexibility that precludes classification in standard asset categories and/or 2) investment concentration in a limited group of securities or industry sectors). Investments in this category may be more volatile than less-flexible and/or less-concentrated investments and may be appropriate as only a minor component in an investor's overall portfolio. You cannot transfer into most investments if you have invested in (through contributions or transfers), and transferred out of the same investment within the previous 60 days. Certain stable value, guaranteed interest, fixed income and other investments are not subject to this rule. This rule does not prohibit you from transferring out of any investment at any time. Investors should consider an investment’s objectives, risks, charges and expenses carefully before investing. For this and other information, see a fact sheet (investment profile) or the prospectus, if applicable. You may obtain a prospectus or fact sheet from your plan sponsor or visiting www.retiresmart.com. Read it carefully before investing. Securities offered through registered representatives of MML Investors Services, LLC. 1295 State Street Springfield, MA 01111. RS-04746-07


990500070