your future. your support. your say. document sets out the findings from the ‘your future. your...
TRANSCRIPT

YOUR FUTURE.
YOUR SUPPORT.
YOUR SAY. Initial Results from the consultation
(July 2014)
http://bromley.mylifeportal.co.uk/mps

Contents
Section Page
What is this document? 3
How was the consultation undertaken? 5
How many people responded? 10
Where do they live? 17
What are their health and care needs? 19
How do they find information, & seek advice and guidance? 24
What activities do they do? 35
What support do they get from family and friends? 41
What transport methods do they use? 47
What aids and equipment do they use? 51
What stops them using services? 55
Do they plan for the future? 58
• help people with caring responsibilities to feel better
supported and have their own needs met so they can
continue to care for their loved ones and friends
The Council is working to encourage the development
of a low level care and support system for adults in
Bromley which will make sure that people have:
What is this document? This document sets out the findings from the ‘Your
future. Your support. Your say.’ consultation which
was run by the London Borough of Bromley between
May and July 2014.
The consultation was formed of two elements:
1. an online consultation
2. face-to-face engagement sessions and focus
groups
What was the purpose of the
consultation? Bromley Council is committed to supporting the
development of a local care and support system for
adults across the borough which enables people to
remain as independent as possible.
This means that alongside our key partner
organisations, including local health services,
charities and voluntary sector providers, private
providers, and families themselves, we want to:
• help people to better self manage their own health
and social care needs
• help people to identify their own health and social
care needs at an early stage and involve them in
shaping a personalised care plan to meet those
needs Page 3

HOW WAS THE CONSULTATION
UNDERTAKEN? Who did the survey go to?
Where were the face-to-face engagement sessions and
focus groups held?

Page 5
Publicity
designs:
General poster and leaflet Blank poster for event Poster for event at the Mott Shop
Therefore, the consultation was promoted via a
number of universal and targeted communications
channels, including:
• public websites
• e-mail distribution lists
• posters and leaflets in public places
• focus groups with specific groups within the
community
Details of the specific groups and methods are
outlined in pages 5 and 6.
How was the consultation undertaken? The consultation was designed to seek feedback from
members of the public about their low level care and
support needs now and in the future.
In particular, the Council was keen to consult with
people:
• who are not currently in the ‘care system’
• who have ‘low level’ care needs
• who pay for their own care
• who the Council has not previously engaged with

• The survey ran for 3 weeks from Tuesday 27 May 2014 to
Sunday 15 June 2014
• It was circulated and promoted through:
our websites – Council website, Council intranet, Bromley
MyLife website
our resident e-mail database
our partners – Age UK Greenwich and Bromley, Alzheimer’s
Society (Bromley), Bromley Clinical Commissioning Group,
Bromley Ethnic Communities Programme, Bromley Healthcare,
Bromley Mencap, Bromley Mind, Carers Bromley, Citizens
Advice Bureau, Community Links Bromley, Community
Options, Deaf Access, Healthwatch Bromley, King's College
Hospital NHS Foundation Trust, and Oxleas NHS Foundation
Trust
a number of universal facilities - such as Council receptions,
Community House, churches, intu Bromley, libraries, and a
press release
• It was an online survey; however, we also allowed people to
complete a hardcopy of the survey or to telephone us to
complete the survey online for them
The survey
Page 6

• We undertook a number of engagement sessions between 30 May and
8 July 2014
• These were undertaken with the following groups of current service users
and other groups of residents:
Age Concern Ravensbourne’s Bertha James Centre
Alzheimers Society’s Dementia Café
Biggin Hill Community Care Association
Bromley Asian Cultural Association (BACA)
Bromley Ethnic Communities Programme Community Champions
Bromley Mencap’s Job Club
Carers Forum
Community Options Involvement Network (COIN)
Cotmandene Community Resource Centre (St Pauls Cray)
Kent Association for the Blind (KAB) Coffee Morning
‘Living Well’ at Holy Trinity Church (Beckenham)
Mottingham Community and Learning Shop
• We also developed and shared a template for group based discussions
to be conducted by other groups or organisations. Astley Day Centre
undertook this activity and sent us their comments.
Face-to-face engagement
sessions and focus groups
Page 7

Location of the
face-to-face engagement
sessions and focus groups
Page 8

• Through our face-to-face engagement sessions and focus groups, we
talked to people covering the following client groups:
Carers of people with care and health needs
Carers of people with dementia
Older people
People from ethnic and minority communities
People who are active within their local community
People who are homeless
People who have housing difficulties
People who have low income
People with a learning disability
People with a physical disability
People with alcohol and drug addiction
People with dementia
People with mental health needs
People with visual impairments and who are sight impaired
Face-to-face engagement
sessions and focus groups
Page 9

HOW MANY PEOPLE
RESPONDED? How many people responded to the survey?
How many people were spoken to via the face-to-face
engagement sessions and focus groups?
Who responded?

The survey:
• 672 people completed the
online survey
• 1 GP completed their specific
survey
• 6 professionals within the
Integrated Care Teams
completed their specific survey
Face-to-face engagement
sessions and focus groups:
• 260 people were consulted
with
• Through 13 face-to-face
engagement sessions and
focus groups
Page 11

What is your gender?
What this means:
• 6 in every 10 people who
responded are female which is
in line with both previous local
consultations and national
consultations
Option Number %
Female 387 61%
Male 252 39%
No response 33 -
Q35
Page 12
Male Female

What is your age?
What this means:
• 49% of people who responded
to this question were aged
between 50 and 69 years old
• 1 in 4 were aged under 50 years
old and 1 in 10 were aged over
80 years old
• This suggests that the survey
was successful at reaching the
target audience of people who
are not currently in the ‘care
system’
Option Number %
18-19 8 1%
20-24 24 4%
25-29 22 3%
30-34 25 4%
35-39 19 3%
40-44 33 5%
45-49 45 7%
50-54 74 11%
55-59 69 11%
60-64 89 14%
65-69 86 13%
70-74 49 8%
75-79 33 5%
80-84 32 5%
85 and over 38 6%
No response 26 -
Q36
Page 13
0 20 40 60 80 100
18-19
20-24
25-29
30-34
35-39
40-44
45-49
50-54
55-59
60-64
65-69
70-74
75-79
80-84
85 and over

What is your ethnicity?
What this means:
• Almost 9 in 10 of the people
who responded stated that they
were ‘white British’
• This is higher than the Bromley
resident population of 77%
(Census, 2011)
Option Number %
White British 550 87%
White Irish 9 1%
White Gypsy or Irish
Traveller 1 0%
Any other White
background 30 5%
White and Black
Caribbean 0 0%
White and Black African 3 0%
White and Asian 1 0%
Any other mixed
background 1 0%
Indian 13 2%
Pakistani 1 0%
Q37
Page 14
Option Number %
Bangladeshi 1 0%
Chinese 3 0%
Any other Asian
background 3 0%
African 6 1%
Caribbean 5 1%
Any other Black
background 0 0%
Arab 0 0%
Any other ethnic group 2 0%
No response 43 -
White British
White Irish
White Gypsy or Irish Traveller
Any other White background
White and Black Caribbean
White and Black African
White and Asian
Any other mixed background
Indian
Pakistani
Bangladeshi
Chinese
Any other Asian background
African
Caribbean
Any other Black background
Arab
Any other ethnic group

How did you hear about the
survey?
What this means:
• The vast majority (45%) of
people heard about this survey
via an e-mail from the Council
• This was followed by information
on websites (Council website
and Intranet) and ‘targeted’
e-mails
• A handful of people heard about
the
• This was in line with the
targeted audience of the survey
Option Number %
Carers Bromley 80 13%
Council website 78 13%
Council Intranet 61 10%
Bromley Mencap 52 8%
Community Links Bromley 17 3%
Bromley Healthcare website 15 2%
Bromley MyLife 8 1%
Bromley Clinical Commissioning Group website 5 1%
Oxleas NHS Trust website 4 1%
Age UK Bromley and Greenwich 2 0%
Alzheimer’s Society 2 0%
Bromley and Lewisham Mind/Mindcare 1 0%
Other – set out on the next page 326 53%
No response 56 -
Q38
Page 15
0 50 100 150 200 250 300 350
Carers Bromley
Council website
Council Intranet
Bromley Mencap
Community Links Bromley
Bromley Healthcare website
Bromley MyLife
Bromley Clinical Commissioning Group website
Oxleas NHS Trust website
Age UK Bromley and Greenwich
Alzheimer’s Society
Bromley and Lewisham Mind/Mindcare
Other

The following were listed as
‘other’:
Source Number
Council e-mail 276
Sent from relative, friend or professional 23
Church 5
Community Options 2
Library 2
Mottingham Community and Learning Shop 2
Social group or club 2
Burgess Autistic Trust 1
GP 1
Rethink 1
School 1
Staff e-mail 1
Streetlife 1
Can't remember 1
Blank 4
Q38
Page 16

WHERE DO THEY LIVE? Which parts of the community did we hear from?
Who responded?

Number of responses by
location in the borough 42
86 198
42
8
44
31
13
116
25
8
25
34 Other
or unknown
Page 18
Q2

WHAT ARE THEIR HEALTH
AND CARE NEEDS? How healthy are people?
What needs do they have?
Who responded?

Which of the following best
describes your situation?
Option Number %
Individual
Currently healthy and independent, but with concerns for the future 299 48%
Living with a long term condition or illness, needing no extra help or support 61 10%
Living with a long term condition or illness, needing some help or support 56 9%
Living with a long term condition or illness and needing long-term help and support 47 8%
Carers
Caring for someone with a long term condition or illness 105 17%
Caring for someone with a long term condition or illness and having own health and
care needs 55 9%
No response 49 -
What this means:
• The majority of people who
responded (48%) stated that
they are currently healthy and
independent, but with concerns
for the future
• This is an audience that we
rarely consult and engage with
• The next largest group (17%)
are people who are caring for
someone with a long term
condition or illness
0 50 100 150 200 250 300
Currently healthy and independent, but with concerns for thefuture
Living with a long term condition or illness, needing no extra helpor support
Living with a long term condition or illness, needing some help orsupport
Living with a long term condition or illness and needing long-term help and support
Caring for someone with a long term condition or illness
Caring for someone with a long term condition or illness andhaving own health and care needs
Q1
Page 20

Which of the following
describes your health?
What this means:
• More than half of the people
who responded (55%) stated
that their health was good or
very good, and a further 30%
stated it was fair
• 15% stated that their health was
bad or very bad
• This is not surprising as the
majority of people who
responded (44%) to the survey
stated that they are currently
healthy and independent, but
with concerns for the future
Option Number %
Very good 122 19%
Good 235 36%
Fair 193 30%
Bad 76 12%
Very bad 19 3%
Don’t know 4 1%
No response 23 -
0 50 100 150 200 250
Very good
Good
Fair
Bad
Very bad
Don’t know
Q10
Page 21
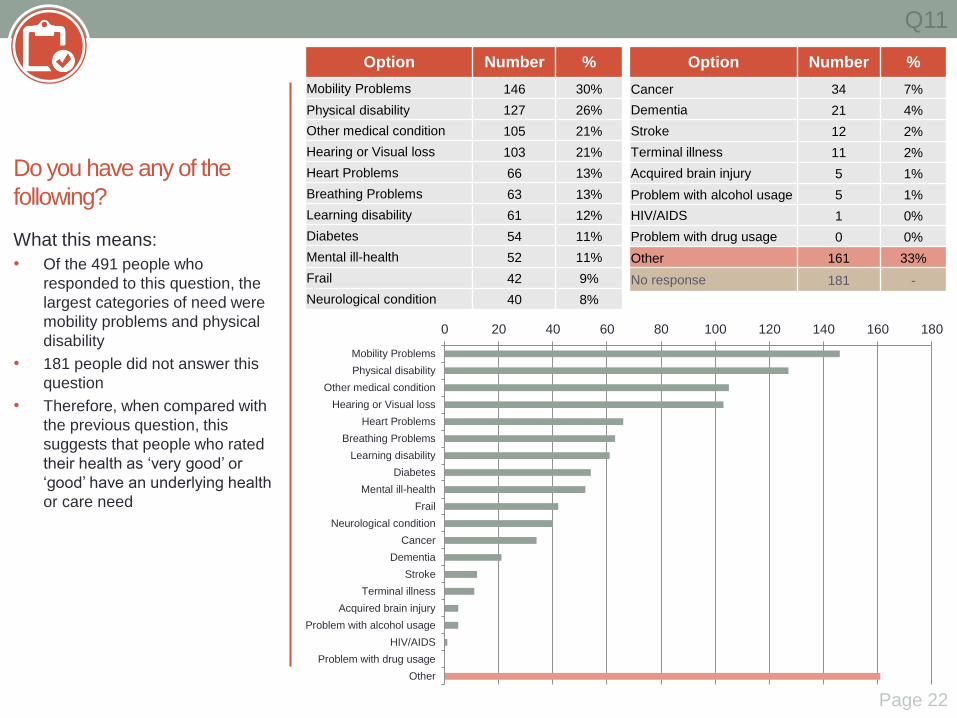
Do you have any of the
following?
What this means:
• Of the 491 people who
responded to this question, the
largest categories of need were
mobility problems and physical
disability
• 181 people did not answer this
question
• Therefore, when compared with
the previous question, this
suggests that people who rated
their health as ‘very good’ or
‘good’ have an underlying health
or care need
Option Number %
Mobility Problems 146 30%
Physical disability 127 26%
Other medical condition 105 21%
Hearing or Visual loss 103 21%
Heart Problems 66 13%
Breathing Problems 63 13%
Learning disability 61 12%
Diabetes 54 11%
Mental ill-health 52 11%
Frail 42 9%
Neurological condition 40 8%
Option Number %
Cancer 34 7%
Dementia 21 4%
Stroke 12 2%
Terminal illness 11 2%
Acquired brain injury 5 1%
Problem with alcohol usage 5 1%
HIV/AIDS 1 0%
Problem with drug usage 0 0%
Other 161 33%
No response 181 -
0 20 40 60 80 100 120 140 160 180
Mobility Problems
Physical disability
Other medical condition
Hearing or Visual loss
Heart Problems
Breathing Problems
Learning disability
Diabetes
Mental ill-health
Frail
Neurological condition
Cancer
Dementia
Stroke
Terminal illness
Acquired brain injury
Problem with alcohol usage
HIV/AIDS
Problem with drug usage
Other
Q11
Page 22

Which of the following
describes your level of
fitness?
What this means:
• The majority of people (44%)
who responded to the survey
stated that their level of fitness
was ‘very good’ or ‘good’
• 1 in 5 people stated their health
was ‘bad’ or ‘very bad’
• Again, this is not surprising as
the majority of people who
responded (44%) to the survey
stated that they are currently
healthy and independent
Option Number %
Very good 62 10%
Good 219 34%
Fair 243 38%
Bad 90 14%
Very bad 30 5%
Don’t know 2 1%
No response 26 -
Very good
Good
Fair
Bad
Very bad
Don’t know
0% 10% 20% 30% 40% 50% 60% 70% 80% 90% 100%
Q12
Page 23

HOW DO THEY FIND
INFORMATION, & SEEK
ADVICE AND GUIDANCE? How do people find information and seek advice and guidance?
Have they found what they need?
What format do they want the information in?
What did they tell us?

Have you found the right
information and advice for
your circumstances?
What this means:
• Almost half the people who
responded had found the right
information and advice that they
needed
• 1 in 4 people had not found all
the information that they
needed, and 7% had not found
the right information and advice
• Around 1 in 5 people stated that
they did not know if they found
the right information or that they
had not needed information
(Other)
Source Number %
Yes 282 46%
No 41 7%
Partially 152 25%
Don’t know 76 12%
Other 65 11%
No response -
Yes No Partially Don’t know Other
Q7
Page 25

Where would you go or
have you gone to find out
about help and support
available in Bromley?
What this means:
• The most common sources of
finding help are GP (66%) and
Bromley Council (55%)
• This is in line with both previous
local consultations and national
consultations
• This is followed by local and
national organisations, which
are focused on a particular
condition or situation
Source Number %
GP Practice 444 68%
Bromley Council 379 58%
Age UK Bromley and Greenwich 174 27%
National Organisation for a particular condition/situation 168 26%
Carers Bromley 152 23%
Citizen Advice Bureau 120 18%
Other Internet Site 119 18%
Bromley Mencap 95 15%
Other local voluntary organisation 54 8%
Bromley and Lewisham Mind/Mindcare 42 6%
Bromley MyLife 40 6%
Housing Association 28 4%
AskSara 3 0%
Other – set out on the next page 103 16%
No response 22 -
0 50 100 150 200 250 300 350 400 450
GP Practice
Bromley Council
National Organisation for a particular condition/situation
Age UK Bromley and Greenwich
Carers Bromley
Citizen Advice Bureau
Other Internet Site
Bromley Mencap
Other local voluntary organisation
Bromley and Lewisham Mind/Mindcare
Bromley MyLife
Housing Association
AskSara
Other
Q3
Page 26

The following were listed as
‘other’:
Source Number
Family and friends 14
Oxleas NHS Foundation Trust 10
Hospital 9
Bromley Healthcare 5
School and college 4
Alzheimers Society 3
Library 3
Bromley Y 2
Burgess Autistic Trust 2
Care at home provider 2
Care home 2
Church 2
Pharmacy 2
999 1
Bexley Council 1
Bromley Children Project 1
Bromley Parent Voice 1
BUPA 1
Source Number
Care Quality Commission 1
CASPA 1
Community Links Bromley 1
Debt charity 1
Experts by Experience 1
Harris Hospicare 1
Homeseekers 1
I-Care Day Centre 1
Kent Association for the Blind 1
Lifecare Centre (Dartford) 1
National user support group 1
Private care provider 1
Royal British Legion 1
Shaw Trust 1
Signal (Lewisham) 1
Specsavers 1
Vibrance 1
None 7
Q3
Page 27

From which of these did
you get the information you
needed?
What this means:
• When compared to the previous
question, the number of people
who have actually accessed
information from their GP
practice has reduced from
(44%) is a lot lower than the 1 in
7 people who state that they
would access information from
their GP practice
• This is the same for all sources
of information
• This suggests that most people
have responded before they
have actually sought information
– which is in line with the
targeted audience of the survey
Source Number %
GP Practice 258 44%
Bromley Council 214 37%
National Organisation for a particular condition/situation 105 18%
Carers Bromley 100 17%
Bromley Mencap 77 13%
Other Internet Site 75 13%
Age UK Bromley and Greenwich 69 12%
Citizen Advice Bureau 46 8%
Other local voluntary organisation 27 5%
Bromley and Lewisham Mind/Mindcare 23 4%
Bromley MyLife 19 3%
Housing Association 11 2%
AskSara 1 0%
Other – set out on the next page 136 23%
No response 91 -
0 50 100 150 200 250 300
GP Practice
Bromley Council
National Organisation for a particular condition/situation
Carers Bromley
Bromley Mencap
Other Internet Site
Age UK Bromley and Greenwich
Citizen Advice Bureau
Other local voluntary organisation
Bromley and Lewisham Mind/Mindcare
Bromley MyLife
Housing Association
AskSara
Other
Q4
Page 28

The following were listed as
‘other’:
Source Number
Hospital 10
Oxleas NHS Foundation Trust 7
Family and friends 6
Bromley Healthcare 4
Library 4
School and college 3
Cannot remember 2
Pharmacy 2
Alzheimers Society 1
Bexley Council 1
Bromley Parent Voice 1
Bromley Y 1
Burgess Autistic Trust 1
Care home 1
Care Quality Commission 1
CASPA 1
Church 1
Community Options 1
Source Number
Debt charity 1
Experts by Experience 1
Harris Hospicare 1
HMRC 1
Homeseekers 1
Kent Association for the Blind 1
Lifecare Centre (Dartford) 1
Local paper 1
Local user support group 1
Phoenix Centre 1
Police 1
Private care provider 1
Private counsellor or therapist 1
Royal British Legion 1
Shaw Trust 1
Vibrance 1
Not looked at/not relevant 38
None 21
Q4
Page 29

Where do you think would be
the best places for someone to
get information about help and
support in Bromley?
What this means:
• This is in line with the previous
questions which suggests that
GP practices and the Council
are the top two sources of
information for members of the
public
Source Number %
Bromley Council 424 66%
GP Practice 419 65%
Age UK Bromley and Greenwich 200 31%
Carers Bromley 185 29%
Citizen Advice Bureau 179 28%
National Organisation for a particular condition/situation 167 26%
Bromley Mencap 111 17%
Other Internet Site 87 14%
Other local voluntary organisation 82 13%
Bromley and Lewisham Mind/Mindcare 68 11%
Bromley MyLife 65 10%
Housing Association 35 5%
AskSara 5 1%
Other 69 11%
No response 28 -
Q5
Page 30
0 50 100 150 200 250 300 350 400 450
Bromley Council
GP Practice
Age UK Bromley and Greenwich
Carers Bromley
Citizen Advice Bureau
National Organisation for a particular condition/situation
Bromley Mencap
Other Internet Site
Other local voluntary organisation
Bromley and Lewisham Mind/Mindcare
Bromley MyLife
Housing Association
AskSara
Other

The following were listed as
‘other’:
Source Number
Library 15
Single point of information and
advice 9
Church 3
Betting shops 2
Hospitals 2
Leaflet drop 2
Local paper 2
Shopping centre 2
BUPA 1
Burgess Autistic Trust 1
Care Quality Assurance 1
Community House 1
Family and friends 1
HMRC 1
Source Number
Hospice 1
Kent Association for the Blind 1
Leisure Centres 1
Local Councillor 1
Local support group 1
National support group 1
Payday Lenders 1
Pubs 1
Royal British Legion 1
School and college 1
Supermarkets 1
Vibrance 1
Don't know 6
None 2
Q5
Page 31

What do you think would be
the best formats for such
information?
What this means:
• The majority of the respondees
stated that they would like
information via face-to-face
interactions and electronically
• The high proportion of
respondees stating
‘electronically’ is in line with the
target audience of the survey
and the main communication
channel used to promote the
survey
Option Number
Face to face 442
Electronically 434
Paper versions of information 366
Over the telephone 251
Other 40
No response 28
0 50 100 150 200 250 300 350 400 450
Face to face
Electronically
Paper versions of information
Over the telephone
Other
Q6
Page 32
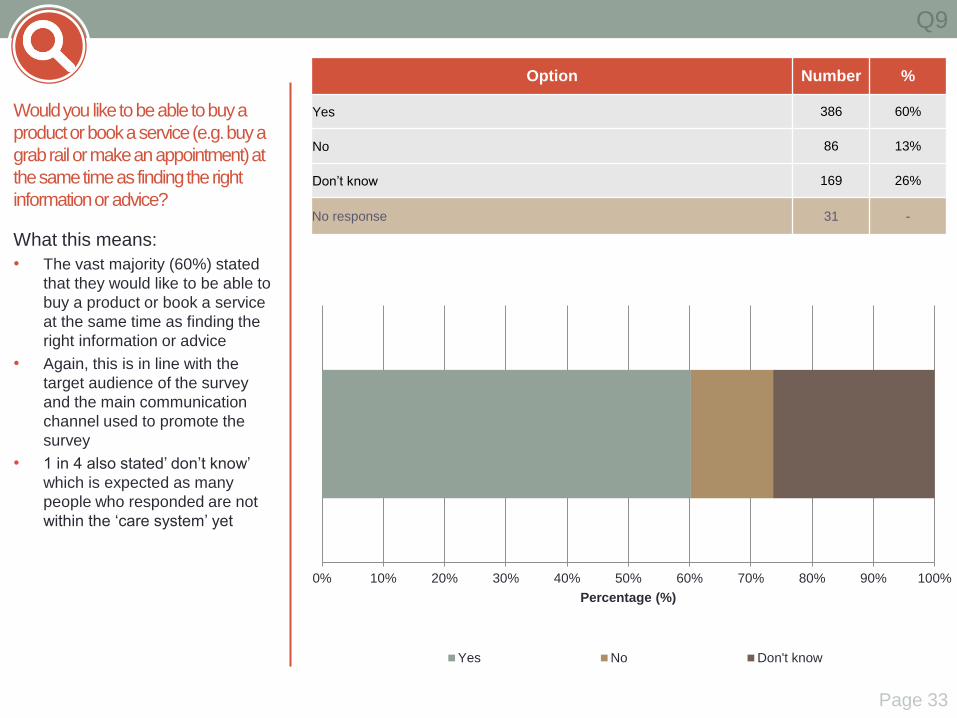
Would you like to be able to buy a
product or book a service (e.g. buy a
grab rail or make an appointment) at
the same time as finding the right
information or advice?
What this means:
• The vast majority (60%) stated
that they would like to be able to
buy a product or book a service
at the same time as finding the
right information or advice
• Again, this is in line with the
target audience of the survey
and the main communication
channel used to promote the
survey
• 1 in 4 also stated’ don’t know’
which is expected as many
people who responded are not
within the ‘care system’ yet
Option Number %
Yes 386 60%
No 86 13%
Don’t know 169 26%
No response 31 -
0% 10% 20% 30% 40% 50% 60% 70% 80% 90% 100%
Percentage (%)
Yes No Don't know
Q9
Page 33

If there was a service that could
help you to work out what support
you need and what is available to
help you, would you be interested?
What this means:
• The vast majority (65%) stated
that they would be interested in
a service that could help them
to work out what support they
need and what is available to
help them
Option Number %
Yes 400 65%
No 53 9%
Don’t know 115 19%
Other 44 7%
No response 60 -
0 10 20 30 40 50 60 70 80 90 100
Percentage (%)
Yes No Don't know Other
Q23
Page 34

WHAT ACTIVITIES DO
THEY DO? What activities do people take part in?
What other things would they like to do?
What did they tell us?

Do you take part in any of
the following activities?
What this means:
• Of the people who responded,
the most popular activities are
‘light’ and informal exercise,
such as gardening (55%), brisk
walking (34%) and gentle
exercise (32%)
• A much smaller number take
part in organised activities, such
as organised walks (10%) and
organised sport (5%)
• The most popular activities also
tend to have no financial cost
involved
Source Number %
Gardening 306 55%
Brisk walking 187 34%
Gentle exercise 178 32%
Swimming 100 18%
Gym sessions 78 14%
Cycling 69 12%
Organised walks 58 10%
Dancing 43 8%
Keep fit classes 40 7%
Source Number %
Running 38 7%
Sport with friends 36 6%
Organised sport 28 5%
Gym sessions – Fresh Start 9 2%
Led cycle rides 6 1%
Gym sessions – Heart Smart 6 1%
Other 136 25%
No response 117 -
0 50 100 150 200 250 300 350
Gardening
Brisk walking
Gentle exercise
Swimming
Gym sessions
Cycling
Organised walks
Dancing
Keep fit classes
Running
Sport with friends
Organised sport
Gym sessions – Fresh Start
Led cycle rides
Gym sessions – Heart Smart
Other
Q13
Page 36

What kind of social activities
do you regularly take part
in?
What this means:
• The vast majority of people (1 in
7) stated that they regularly ‘go
out to meet family/friends’
• More than 1 in 5 people are also
involved with ‘Voluntary and
charitable activities’ and ‘clubs’
Source Number %
Going out to meet family/friends 390 69%
Voluntary and charitable activities 152 27%
Clubs e.g. political, social, support (e.g. British Legion), sports 120 21%
Faith based activities 99 18%
Adult education 63 11%
Neighbourhood activities e.g. residents’ associations, community centres, etc. 53 9%
Lunch clubs 36 6%
Other 130 23%
No response 109 -
0 50 100 150 200 250 300 350 400 450
Going out to meet family/friends
Voluntary and charitable activities
Clubs eg political, social, support (eg British Legion), sports
Faith based activities
Adult education
Neighbourhood activities eg residents’ associations, community centres, etc
Lunch clubs
Other
Q14
Page 37
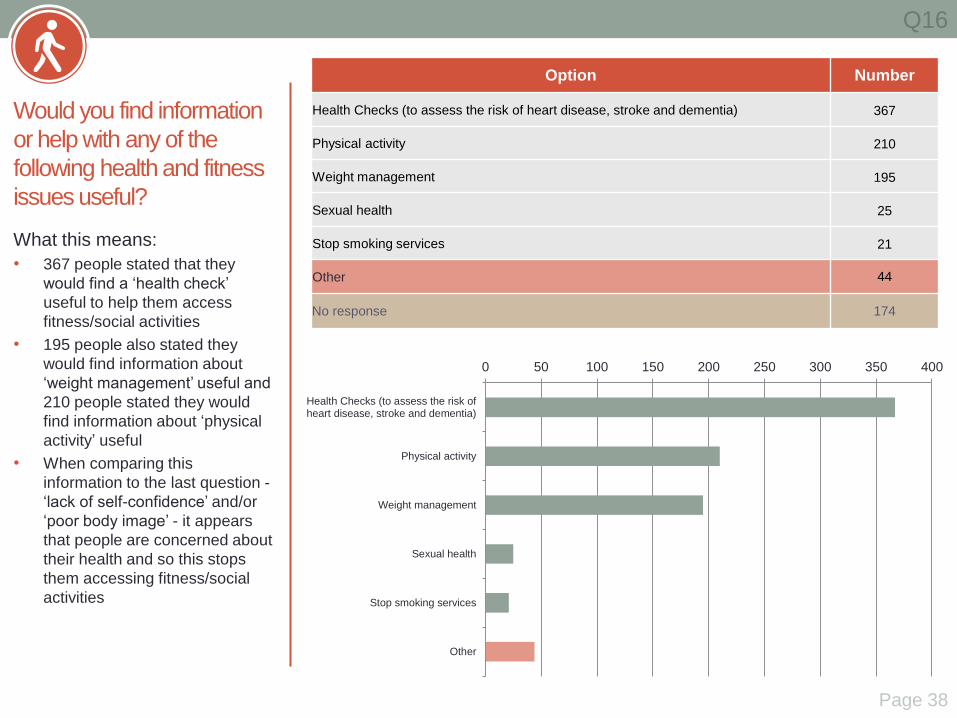
Would you find information
or help with any of the
following health and fitness
issues useful?
What this means:
• 367 people stated that they
would find a ‘health check’
useful to help them access
fitness/social activities
• 195 people also stated they
would find information about
‘weight management’ useful and
210 people stated they would
find information about ‘physical
activity’ useful
• When comparing this
information to the last question -
‘lack of self-confidence’ and/or
‘poor body image’ - it appears
that people are concerned about
their health and so this stops
them accessing fitness/social
activities
0 50 100 150 200 250 300 350 400
Health Checks (to assess the risk ofheart disease, stroke and dementia)
Physical activity
Weight management
Sexual health
Stop smoking services
Other
Option Number
Health Checks (to assess the risk of heart disease, stroke and dementia) 367
Physical activity 210
Weight management 195
Sexual health 25
Stop smoking services 21
Other 44
No response 174
Q16
Page 38
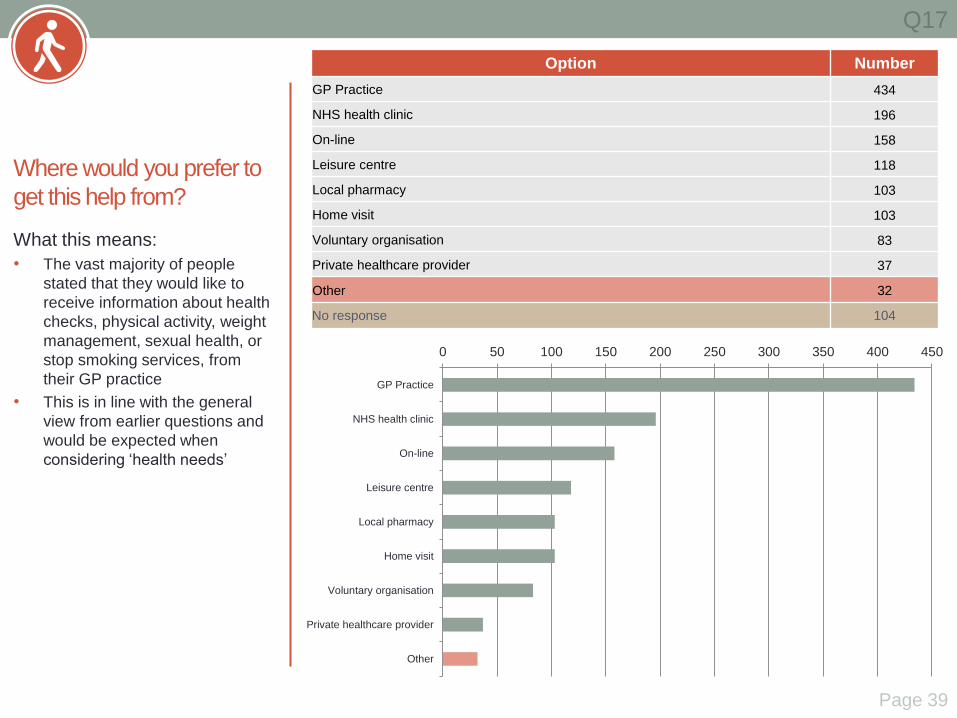
Where would you prefer to
get this help from?
What this means:
• The vast majority of people
stated that they would like to
receive information about health
checks, physical activity, weight
management, sexual health, or
stop smoking services, from
their GP practice
• This is in line with the general
view from earlier questions and
would be expected when
considering ‘health needs’
Option Number
GP Practice 434
NHS health clinic 196
On-line 158
Leisure centre 118
Local pharmacy 103
Home visit 103
Voluntary organisation 83
Private healthcare provider 37
Other 32
No response 104
0 50 100 150 200 250 300 350 400 450
GP Practice
NHS health clinic
On-line
Leisure centre
Local pharmacy
Home visit
Voluntary organisation
Private healthcare provider
Other
Q17
Page 39

Would you be interested in
taking part in any of the
following volunteering
activities?
What this means:
• The latest majority (36%) of
people who responded stated
that they would not be
interested in taking part in any
of the volunteering activities
• However, 1 in 4 people stated
that they would be interested in
‘peer support’ and 1 in 5 people
stated that they would be
interested in offering a ‘sitting
service’
Option Number %
No 104 36%
Peer Support i.e. supporting someone in the same situation as yourself 73 25%
Sitting service - to allow someone who usually spends their time looking
after a relative or friend to have some time of their own 57 20%
Volunteer drivers 48 17%
Travel Buddies – helping someone to become confident using public
transport 40 14%
Other 49 17%
No response 382 -
No
Peer Support ie supporting someone in the same situation asyourself
Sitting service - to allow someone who usually spends their timelooking after a relative or friend to have some time of their own
Volunteer drivers
Travel Buddies – helping someone to become confident using public transport
Other
0 20 40 60 80 100 120
Q34
Page 40

WHAT SUPPORT DO THEY
GET FROM FAMILY AND
FRIENDS? Do people belong to support networks or
self-management groups?
What did they tell us?

Do you have any family or
friends that could or do
provide help and support
to you?
What this means:
• The vast majority of the people
who responded (67%) stated
that they have family or friends
that could or do provide help
and support to them
• However, a significant number
(1 in 5) stated they do not
have any family or friends that
could or do provide help and
support to them
Option Number %
Yes 432 67%
No 124 19%
Don’t know 30 5%
Other 57 9%
No response 29 -
Yes No Don’t know Other
Q18
Page 42
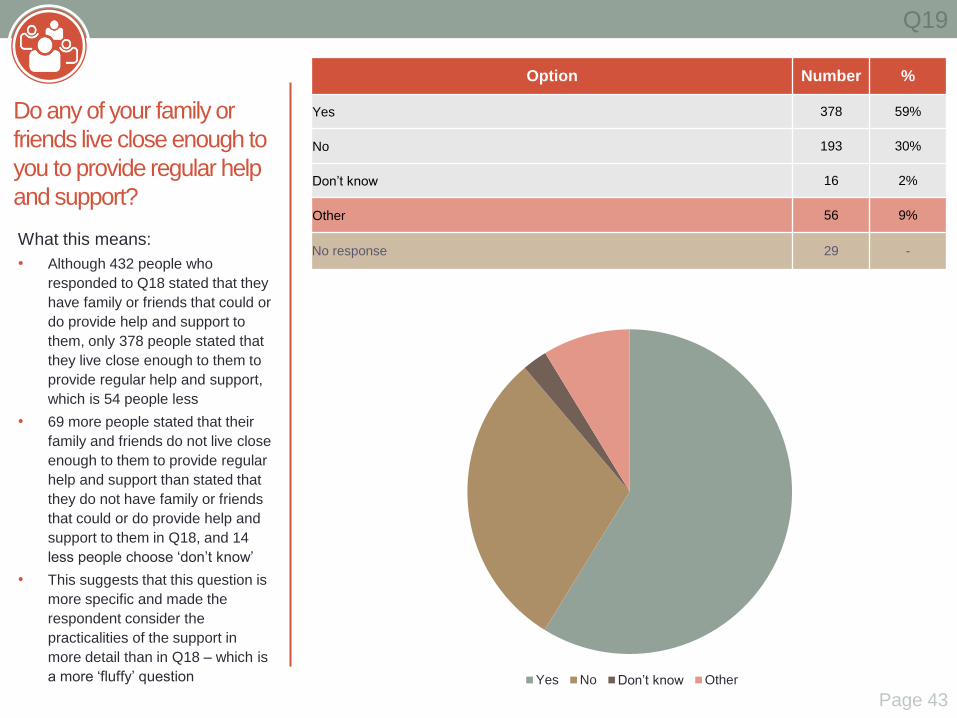
Do any of your family or
friends live close enough to
you to provide regular help
and support?
What this means:
• Although 432 people who
responded to Q18 stated that they
have family or friends that could or
do provide help and support to
them, only 378 people stated that
they live close enough to them to
provide regular help and support,
which is 54 people less
• 69 more people stated that their
family and friends do not live close
enough to them to provide regular
help and support than stated that
they do not have family or friends
that could or do provide help and
support to them in Q18, and 14
less people choose ‘don’t know’
• This suggests that this question is
more specific and made the
respondent consider the
practicalities of the support in
more detail than in Q18 – which is
a more ‘fluffy’ question
Option Number %
Yes 378 59%
No 193 30%
Don’t know 16 2%
Other 56 9%
No response 29 -
Yes No Don’t know Other
Q19
Page 43

If you have a relative or friend who
helps you to stay independent is
there anything they need to help
them continue to support you?
What this means:
• Almost half of the people (45%)
who responded to this question
stated that ‘it was not relevant’
or that they relative or friend
who is providing care or
support does not need anything
to help them continue to
provide the support
Q20
Page 44
Number %
Respite 16 9%
Better information and
advice 15 8%
Help with transport 11 6%
Financial support or greater
income 9 5%
More time 8 4%
Support networks,
companions or 'buddies', or
someone to talk to
7 4%
Group activities and places
to go 4 2%
More suitable housing,
accommodation or support
living arrangements
4 2%
Currently have unmet
needs 3 2%
Employment support 3 2%
Number %
Feel isolated 3 2%
Emergency help 2 1%
Emotional support and
encouragement 2 1%
Help with household chores
and gardening 2 1%
Bathing facilities 1 1%
Better long-term planning 1 1%
Debt help 1 1%
Easier processes for people
with Power of Attorney in
place
1 1%
Meals assistance 1 1%
Specific equipment 1 1%
No 36 19%
Don’t know 18 10%
Not relevant 48 26%
Respite
Better information and advice
Help with transport
Financial support or greater income
More time
Support networks, companions or 'buddies', or someone to talk to
Group activities and places to go
More suitable housing, accommodation or support living arrangements
Currently have unmet needs
Employment support
Feel isolated
Emergency help
Emotional support and encouragement
Help with household chores and gardening
Bathing facilities
Better long-term planning
Debt help
Easier processes for people with Power of Attorney in place
Meals assistance
Specific equipment
No
Don't know
Not relevant
0 10 20 30 40 50 60
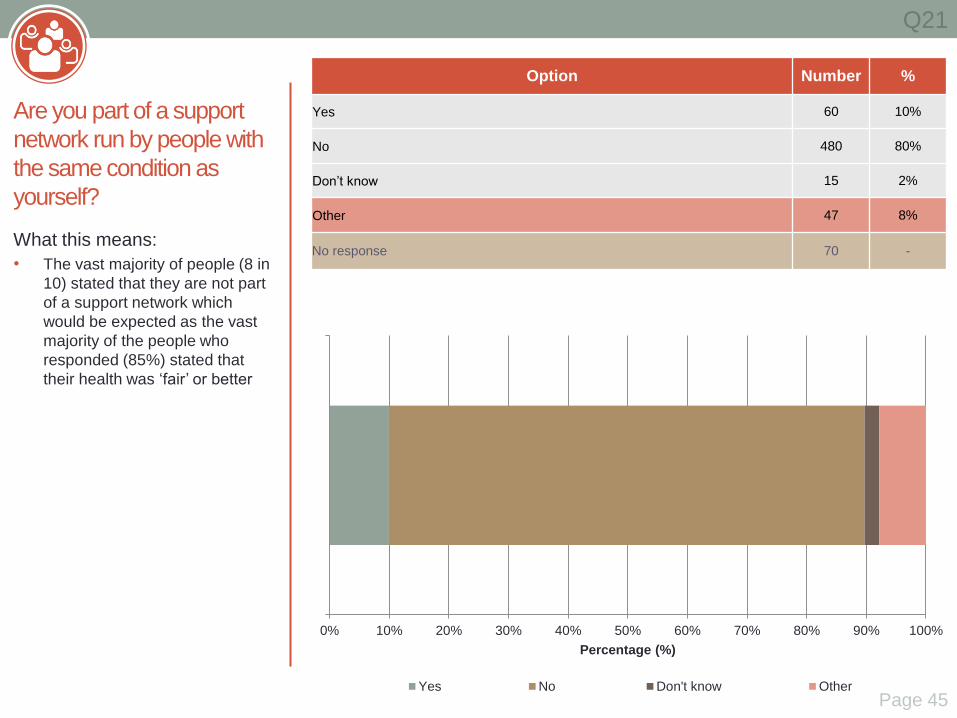
Are you part of a support
network run by people with
the same condition as
yourself?
What this means:
• The vast majority of people (8 in
10) stated that they are not part
of a support network which
would be expected as the vast
majority of the people who
responded (85%) stated that
their health was ‘fair’ or better
Option Number %
Yes 60 10%
No 480 80%
Don’t know 15 2%
Other 47 8%
No response 70 -
0% 10% 20% 30% 40% 50% 60% 70% 80% 90% 100%
Percentage (%)
Yes No Don't know Other
Q21
Page 45

Would you be interested in
joining and/or helping to run
such a support network?
What this means:
• 7 in 10 people who responded
stated that they would not be
interested in joining and/or
helping to run a support network
of people with the same
condition as themselves – which
is expected as the vast majority
of the people who responded
(85%) stated that their health
was ‘fair’ or better
• However, it should be noted that
1 in 5 people stated that they
would be interested in joining or
helping to run a support network
Option Number %
Yes 132 22%
No 255 43%
Don’t know 162 27%
Other 51 9%
No response 72 -
0% 10% 20% 30% 40% 50% 60% 70% 80% 90% 100%
Percentage (%)
Yes No Don't know Other
Q22
Page 46

WHAT TRANSPORT
METHODS DO THEY USE? How do people travel around the Borough?
Is there anything that stops people from travelling
around the Borough?
What did they tell us?

What form of transport do
you currently use?
What this means:
• The significant majority of
people use a car (74%) or public
transport (bus, 64% and train,
59%) which would be expected
as most people who responded
stated that they are healthy and
have ‘low level’ or no mobility
needs
• As would also be expected, very
few people who responded
stated that they use the
specialist schemes of taxi-card
(2%) and Dial-a-Ride (2%)
Option Number %
Car 476 74%
Bus 408 64%
Train 380 59%
Tram 117 18%
Taxi 104 16%
Bicycle 51 8%
Taxi-card 15 2%
Motorbike 14 2%
Dial-a-Ride 11 2%
Other 86 13%
No response 30 -
Car
Bus
Train
Tram
Taxi
Bicycle
Taxi-card
Motorbike
Dial-a-Ride
Other
0% 10% 20% 30% 40% 50% 60% 70% 80% 90% 100%
Q24
Page 48
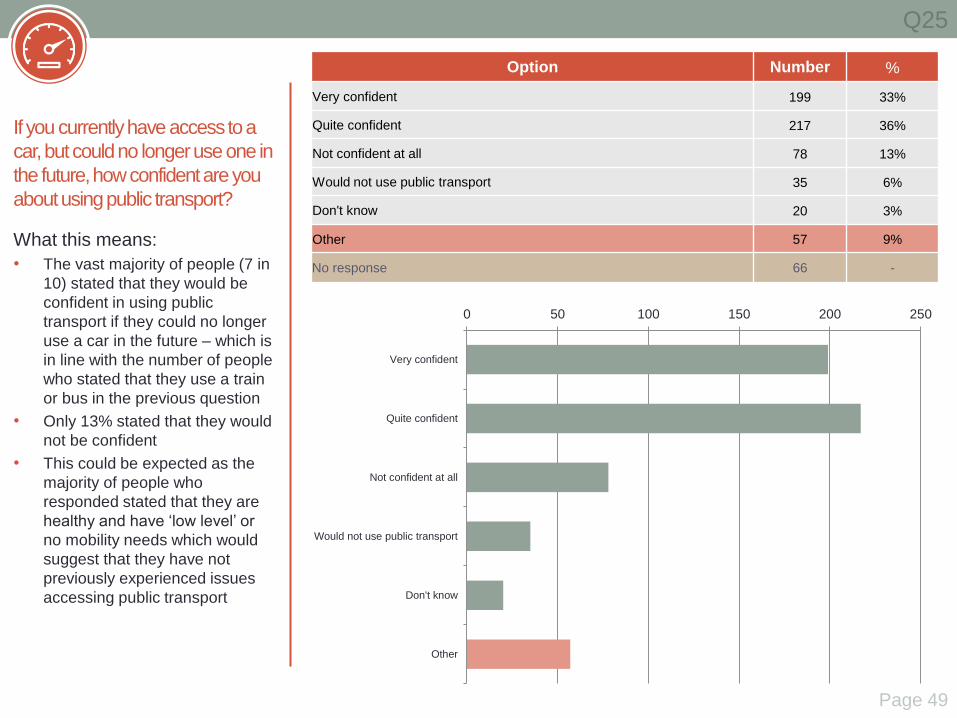
If you currently have access to a
car, but could no longer use one in
the future, how confident are you
about using public transport?
What this means:
• The vast majority of people (7 in
10) stated that they would be
confident in using public
transport if they could no longer
use a car in the future – which is
in line with the number of people
who stated that they use a train
or bus in the previous question
• Only 13% stated that they would
not be confident
• This could be expected as the
majority of people who
responded stated that they are
healthy and have ‘low level’ or
no mobility needs which would
suggest that they have not
previously experienced issues
accessing public transport
Option Number %
Very confident 199 33%
Quite confident 217 36%
Not confident at all 78 13%
Would not use public transport 35 6%
Don't know 20 3%
Other 57 9%
No response 66 -
Very confident
Quite confident
Not confident at all
Would not use public transport
Don't know
Other
0 50 100 150 200 250
Q25
Page 49

If, for whatever reason, you are not
confident in using public transport
would you like to have someone who
can help you do this until you are able
to travel on your own?
What this means:
• 1 in 4 people stated that they
would like to have someone who
can help them use public
transport in order to support
them to travel on their own
Option Number %
Yes 107 25%
No 161 37%
Don’t know 78 18%
Other 86 20%
No response 240 -
Yes No Don’t know Other
Q26
Page 50

WHAT AIDS AND EQUIPMENT
DO THEY USE? What aids and equipment do people already have in their
home?
Do people know where to go to buy aids and equipment if
they need it?
What did they tell us?

Do you have any of the
following equipment or aids
to help you live
independently?
What this means:
• As would be expected, the
significant majority (62%) of
people who responded to the
survey do not currently have
any equipment or aids to help
them live independently
• Of those that do, the most
popular are low level alterations
to the house – hand-rails, wet
room/shower, and equipment to
make it easier to use the
bathroom/toilet
• This is in line with 30% of
people who stated that they
have ‘mobility problems’ and
26% who stated that they have
a ‘physical disability’
Source Number %
Hand-rails 107 18%
Wet room/shower 88 15%
Equipment to make it
easier to use the
bathroom/toilet 80 14%
Alarm system if you need
help e.g. Carelink 47 8%
Stair-lift 35 6%
Ramps 23 4%
Equipment to make cooking
easier 22 4%
Source Number %
Pressure care equipment 19 3%
Hoists 17 3%
Medication reminder 13 2%
Mobility sensor 2 0%
None of these 362 62%
Other 73 12%
No response 86 -
Hand-rails
Wet room/shower
Equipment to make it easier to use the bathroom/toilet
Alarm system if you need help eg Carelink
Stair-lift
Ramps
Equipment to make cooking easier
Pressure care equipment
Hoists
Medication reminder
Mobility sensor
None of these
Other
0 50 100 150 200 250 300 350 400
Q27
Page 52

Do you think you might
have need for any of these
in the future?
What this means:
• All the options were quite
popular, which would be
expected, as people are being
asked to predict their needs in
the future
Source Number %
Hand-rails 133 24%
Wet room/shower 116 21%
Equipment to make it
easier to use the
bathroom/toilet 112 20%
Alarm system if you need
help e.g. Carelink 130 24%
Stair-lift 129 24%
Ramps 54 10%
Equipment to make cooking
easier 69 13%
Source Number %
Pressure care equipment 30 5%
Hoists 34 6%
Medication reminder 75 14%
Mobility sensor 31 6%
None of these 186 34%
Other 80 15%
No response 124 -
Hand-rails
Wet room/shower
Equipment to make it easier to use the bathroom/toilet
Alarm system if you need help eg Carelink
Stair-lift
Ramps
Equipment to make cooking easier
Pressure care equipment
Hoists
Medication reminder
Mobility sensor
None of these
Other
0 20 40 60 80 100 120 140 160 180 200
Q28
Page 53
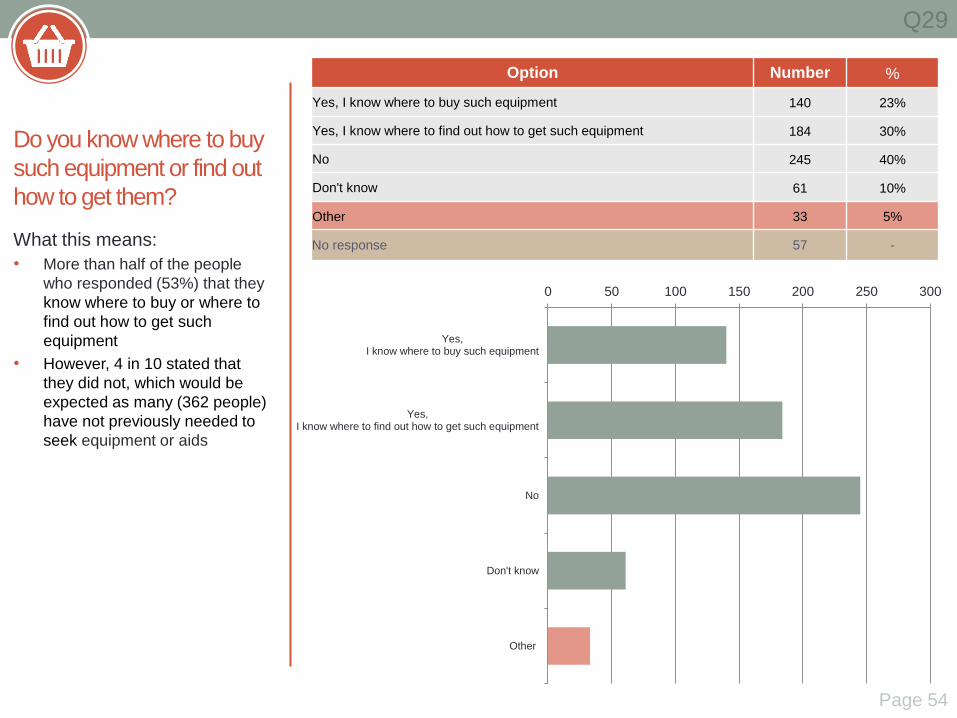
Do you know where to buy
such equipment or find out
how to get them?
What this means:
• More than half of the people
who responded (53%) that they
know where to buy or where to
find out how to get such
equipment
• However, 4 in 10 stated that
they did not, which would be
expected as many (362 people)
have not previously needed to
seek equipment or aids
Option Number %
Yes, I know where to buy such equipment 140 23%
Yes, I know where to find out how to get such equipment 184 30%
No 245 40%
Don't know 61 10%
Other 33 5%
No response 57 -
Yes,I know where to buy such equipment
Yes,I know where to find out how to get such equipment
No
Don't know
Other
0 50 100 150 200 250 300
Q29
Page 54

WHAT STOPS THEM
USING SERVICES? Does anything stop people accessing services or
support?
What did they tell us?

Have any of the following
prevented you from using a
service or will need to be taken
into account in the future?
What this means:
• The vast majority of people
(52%) who responded to this
question stated that financial
cost was the biggest barrier to
using a service
• Approximately a third of people
stated that they are ‘unable to
travel to the service’
Option Number %
Cost 179 52%
Unable to travel to the service 102 30%
Physical environment 43 12%
Language 21 6%
Religious or cultural requirements 6 2%
Other 109 32%
No response 327 -
Cost
Unable to travel to the service
Physical environment
Language
Religious or cultural requirements
Other
0 20 40 60 80 100 120 140 160 180 200
Q30
Page 56

If you would like to take part
in fitness/social activities, do
any of the following prevent
you?
What this means:
• The most popular reason for not
taking part in fitness/social
activities is the financial cost
(180 people)
• This is followed by 116 people
stating that they have ‘nobody to
go with’
• A significant number of people
stated that they have a ‘lack of
self-confidence’ (89 people)
and/or ‘poor body image’ (56
people)
Option Number
Too expensive 180
Nobody to go with 116
Committing to long term participation 104
Lack of self-confidence 89
No facilities nearby 77
Poor body image 56
Lack of skill 28
Long waiting list 17
Other 150
No response 228
0 20 40 60 80 100 120 140 160 180 200
Too expensive
Nobody to go with
Committing to long term participation
Lack of self-confidence
No facilities nearby
Poor body image
Lack of skill
Long waiting list
Other
Q15
Page 57

DO THEY PLAN FOR THE
FUTURE? Do people have plans in place if they have a sudden
deterioration in their health or condition?
What did they tell us?

If an emergency arose, such as
a sudden deterioration in your
health or condition, do you have
plans in place to deal with this?
What this means:
• The vast majority (67%) of
people who responded stated
that they do not have plans in
place if an emergency arose,
such as a sudden deterioration
in their health or condition
Option Number %
Yes 135 21%
No 424 67%
Don’t know 38 6%
Other 40 6%
No response 35 -
Yes No Don’t know Other
Q31
Page 59

This document was produced by:
Education, Care and Health Services
London Borough of Bromley
Civic Centre, Stockwell Close, Bromley BR1 3UH
July 2014