“you'll be glad to know that the oee alert ... -...

2
OEE Alert lets you see ALL of your Vorne XL Productivity devices on a single screen using both up-to-date operational information as well as historical perspective. Right Now View all of your Vorne XL TPT™ graphs on one screen. You also have the ability to customize the display for just the XL graphs you want to see - for example you might want to see all the devices on the Paint Line or all the devices in your Ft. Worth Plant. With simple drag-and-drop capabilities you can create as many display categories as you want. They can be created just for you or for everyone in the company. Additionally, a pop-up will display the current Down event next to the graph indicating the Reason Code and current duration. Message Alerts Set up rules for generating message alerts.You can specify by group of assets, when an alert should be raised and to whom it should be sent. This chart provides hover-over capability to view the Reason Code, Start Time and duration. In “Today” mode, the most current Down event is displayed until the next event occurs. This is extremely beneficial if you have this displayed on a big-screen TV in your plant. View all of your Vorne XL real-time displays on one screen. Configuration options allow you to view all or specific devices. “You'll be glad to know that the OEE Alert is providing the script for our morning production meeting. The data has uncovering heretofore unrecognized issues that are being addressed and fixed. We're seeing good returns and a desire to expand our implementation to other departments besides fill.” M.L. Lean Coach Major Pharmaceutical Company Every Asset. Every State. Real-time Instant Information Across the Plant. Real-Time Correcting and Annotating Downtime Reasons OEE Alert lets you evaluate the data that is collected by viewing each production event and changing the reason code if necessary. Comments can also be added (and viewed) to each event to provide more context as to what happened and why. Extensible - OEE Alert can be extended incorporating customer specific views and alerts - by request. Production state (Run, Down, Standby, Setup) over time, as well as summarized by state, for any period. Hour-by-hour statistics, showing how well your assets are doing from hour to hour. Top Losses, showing your top 5 or 10 most common loss reasons for all devices, for any period. Display View, direct display of the current data on the Vorne XL display.

Upload: letram

Post on 15-Mar-2018

216 views

Category:

Documents


1 download

TRANSCRIPT

OEE Alert lets you see ALL of your Vorne XL Productivity devices on a single screen using both up-to-dateoperational information as well as historical perspective.

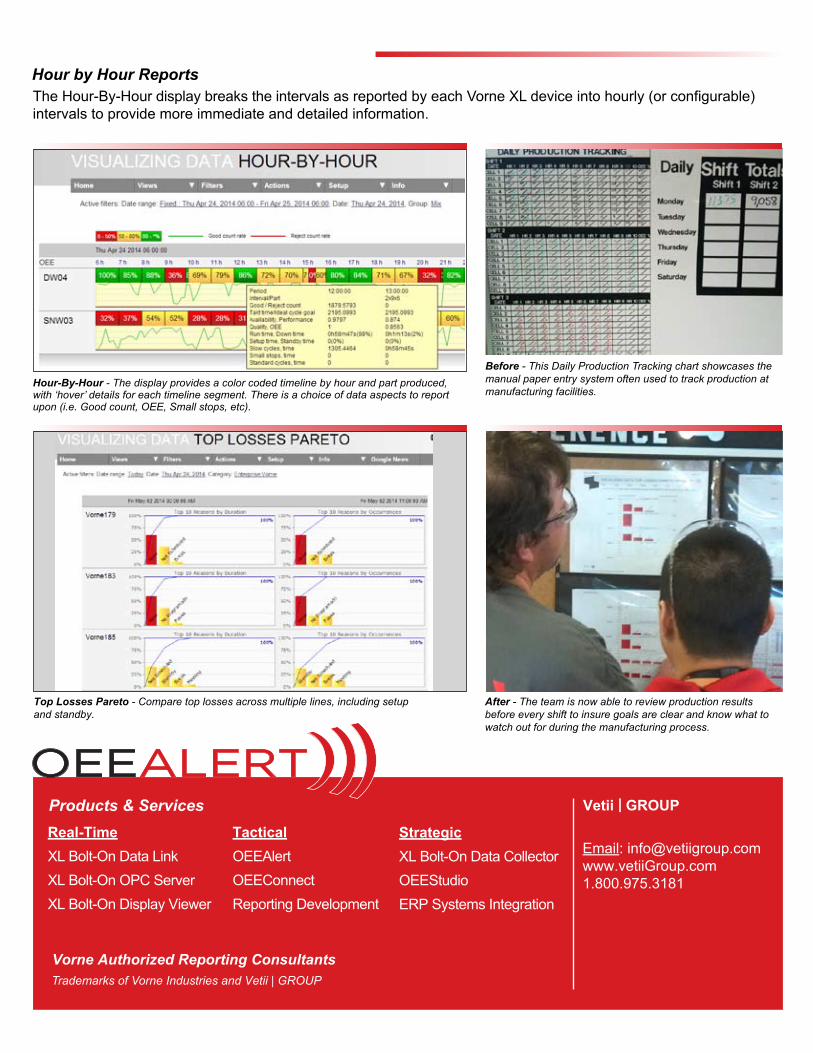
Right NowView all of your Vorne XL TPT™ graphs on onescreen. You also have the ability to customize the display for just the XL graphs you want tosee - for example you might want to see all the devices on the Paint Line or all the devices in your Ft. Worth Plant. With simple drag-and-drop capabilities you can create as many display categories as you want.They can be created just for you or for everyonein the company.Additionally, a pop-up will display the currentDown event next to the graph indicating theReason Code and current duration.

Message Alerts Set up rules for generating message alerts.Youcan specify by group of assets, when an alertshould be raised and to whom it should be sent.

This chart provides hover-over capability to view the Reason Code, Start Time and duration. In “Today” mode, the most current Down event is displayed until the next event occurs. This is extremely beneficial if you have this displayed on a big-screen TV in your plant.

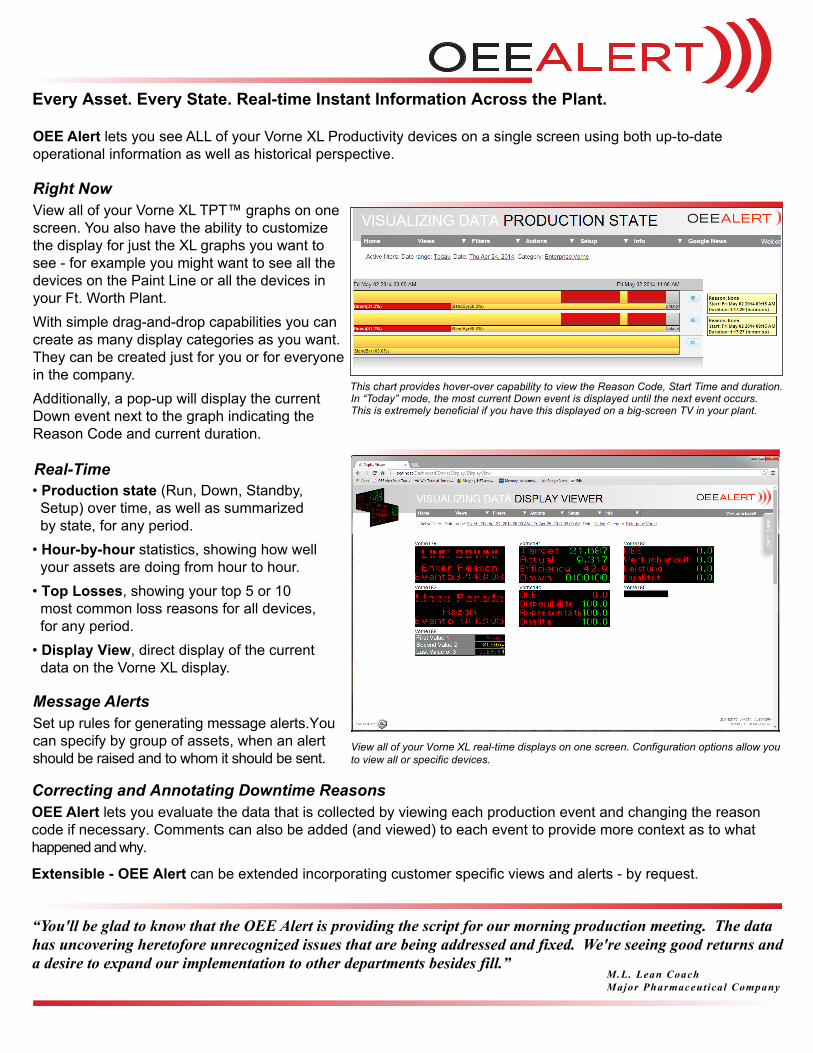
View all of your Vorne XL real-time displays on one screen. Configuration options allow youto view all or specific devices.

“You'll be glad to know that the OEE Alert is providing the script for our morning production meeting. The datahas uncovering heretofore unrecognized issues that are being addressed and fixed. We're seeing good returns and a desire to expand our implementation to other departments besides fill.”

M.L. Lean Coach Major Pharmaceutical Company

Every Asset. Every State. Real-time Instant Information Across the Plant.

Real-Time

Correcting and Annotating Downtime Reasons OEE Alert lets you evaluate the data that is collected by viewing each production event and changing the reasoncode if necessary. Comments can also be added (and viewed) to each event to provide more context as to whathappened and why.

Extensible - OEE Alert can be extended incorporating customer specific views and alerts - by request.

• Production state (Run, Down, Standby, Setup) over time, as well as summarized by state, for any period.• Hour-by-hour statistics, showing how well your assets are doing from hour to hour.• Top Losses, showing your top 5 or 10 most common loss reasons for all devices, for any period.• Display View, direct display of the current data on the Vorne XL display.