you can’t manage what you don’t measure total clinical ... · the philsophy: total clinical...
TRANSCRIPT

You Can’t Manage What You Don’t MeasureTotal Clinical Outcomes Management in the child
serving system
John S. Lyons, Ph.D.University of OttawaChildren’s Hospital of Eastern Ontario

Challenges in the Human Service System
Many different adults in the lives of the people we serveEach has a different perspective and, therefore, different agendas, goals, and objectivesHonest people, honestly representing different perspectives will disagreeThis creates the potential for conflict

The Philsophy: Total Clinical Outcomes Management (TCOM)
Total means that it is embedded in all activities with families as full partners.Clinical means the focus is on child and family health, well-being, and functioning.Outcomes means the measures are relevant to decisions about approach or proposed impact of interventions.Management means that this information is used in all aspects of managing the system from individual family planning to supervision to program and system operations.

Managing Tension is the Key to Creating an Effective System of Care
Philosophy—always return to the shared vision. In the child serving system the shared vision is the child and familyStrategy—represent the shared vision and communicate it throughout the system with a standard language/assessmentTactics—activities that promote the philosophy at all the levels of the system simultaneously

The Troubles IThe Troubles I’’ve seenve seen……....
People are more honest with researchers than People are more honest with researchers than clinicianscliniciansSubstance abusing girls Substance abusing girls ‘‘self esteemself esteem’’ plummets with plummets with treatmenttreatmentClinical factors donClinical factors don’’t predict service utilizationt predict service utilizationMethod matters with consumer satisfactionMethod matters with consumer satisfactionConsumer & Providers use assessment for advocacy Consumer & Providers use assessment for advocacy rather than accuracyrather than accuracyMeasures developed for research do not translate Measures developed for research do not translate well into service delivery applications well into service delivery applications
The Strategy: CANSSix Key Characteristics of a Communimetric Tool
Items are included because they might impact service planningLevel of items translate immediately into action levelsIt is about the child not about the serviceConsider culture and developmentIt is agnostic as to etiology—it is about the ‘what’ not about the ‘why’The 30 day window is to remind us to keep assessments relevant and ‘fresh’

Communication Measurement
Behaviors
Experiences
Assets
Relationships
Service Planning
Traditional Psychometric
Measures
The Child and
Family
}

Understanding our Marketplace:The Hierarchy of Offerings
I. CommoditiesII. ProductsIII. ServicesIV. ExperiencesV. Transformations
- Gilmore & Pine, 1997

TransformationBusiness Model
Design
CQI/QAAccreditation
Program Redesign
Case ManagementIntegrated Care
Supervision
Quality Improvement
Provider ProfilesPerformance/ Contracting
EvaluationService Transitions & Celebrations
Outcome Monitoring
Resource ManagementRight-sizing
EligibilityStep-down
Care PlanningEffective practices
EBP’s
Decision Support
SystemProgramFamily & Youth
TCOM Grid of Tactics TCOM Grid of Tactics
Services and Policy Research Perspective
Large databases are impressive but without clinical logic can be very misleadingMental health is different than health care in terms of the information used to make decisionsCommunimetric tools can be expected to have 100% use penetration

CANS Usage in the United States
States with CANS Presence:--Alaska --Kentucky --Montana --S. Carolina--Arizona --Louisiana --N. Carolina --Texas--California --Maine --N. Dakota --Utah--Delaware --Michigan --Ohio --Washington --Georgia --Minnesota --Pennsylvania
--Kansas --Missouri --Rhode Island
State-Wide CANS Usage:--Alabama --Illinois --Nebraska --Oregon--Colorado --Iowa --New Hampshire --Tennessee--Connecticut --Maryland --New Jersey --Virginia--Florida --Massachusetts --New York --W. Virginia--Indiana --Mississippi --Nevada --Wisconsin

Figure 5.2 Survival analysis of time to placement disruption for children/youth whose placement matches CANS recommendations (Match=0), those whose placed is at a lower intensity than recommended (match=1) and those whose placement is more intensive than recommended (match=-1).
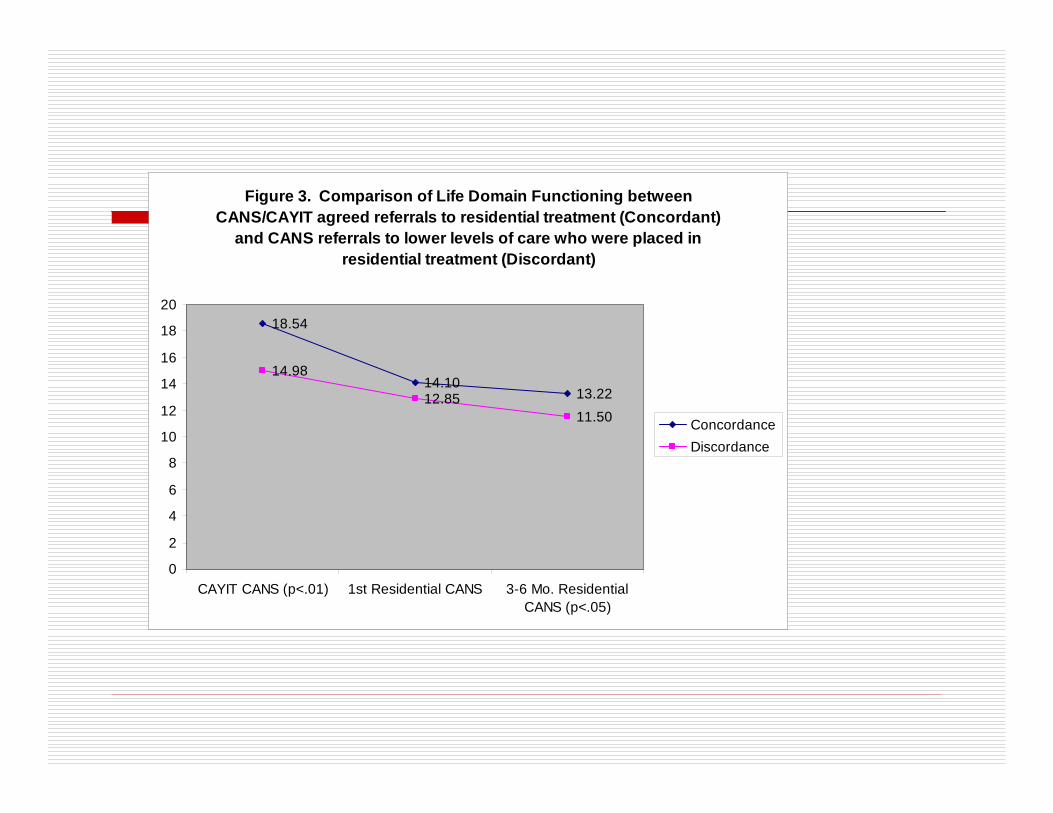
Figure 3. Comparison of Life Domain Functioning between CANS/CAYIT agreed referrals to residential treatment (Concordant)
and CANS referrals to lower levels of care who were placed in residential treatment (Discordant)
18.54
14.1013.22
14.98
12.8511.50
0
2
4
6
8
10
12
14
16
18
20
CAYIT CANS (p<.01) 1st Residential CANS 3-6 Mo. ResidentialCANS (p<.05)
Concordance Discordance

Figure 2. Trauma Symptoms comparison between CANS/CAYIT agreed referrals to residential treatment and CANS referrals to lower levels of care who were placed in residential treatment (Discordant)
5.39
4.76
3.734.15
4.77
4.66
0
1
2
3
4
5
6
CAYIT CANS (p<.01) 1st Residential CANS 3-6 Mo. ResidentialCANS
Concordance Discordance

Figure 4. Comparison of Emotional/Behavioral Needs between CANS/CAYIT agreed placements in residential treatment
(Concordant) and CANS referrals to lower levels of care who were placed in residential treatment (Discordant)
16.1113.34 12.91
12.32 12.6312.29
02468
101214161820
CAYIT CANS (p<.01) 1st Residential CANS 3-6 Mo. ResidentialCANS
Concordance Discordance

Figure 5. Comparison of high Risk Behaviors between CANS/CAYIT agreed placements in residential treatment (Concordant) and CANS
referrals to lower levels of care who were placed in residential treatment (Discordant)
14.13
10.459.419.66
9.00 8.44
0
2
4
6
8
10
12
14
16
CAYIT CANS (p<.01) 1st Residential CANS(p<.05)
3-6 Mo. ResidentialCANS
Concordance Discordance

Prevalence of actionable needs on the Fire Setting item of the CANS by demographic characteristics.
N % Confidence IntervalGender Actionable of percentage
Female 2,063 0.87 (0.52 - 1.38)Male 2,092 1.82 (1.29 - 2.48)
Race/EthnicityAfrican American 2,002 1.38 (0.91 - 2.00)Non-Hispanic White 1,900 1.21 (0.77 - 1.81)Hispanic 233 2.15 (0.70 - 4.94)
Age0 to 3 years 1,698 0.0 (0.0 - 0.22)4 to 6 years 565 1.06 (0.39 - 2.30)7 to 9 years 451 1.55 (0.63 - 3.17)
10 to 13 years 554 3.43 (2.08 - 5.30)14 to 16 years 572 3.67 (2.29 - 5.56)17+ years 89 3.37 (0.70 - 9.54)

The relationship of trauma experiences to the likelihood of having an actionable fire setting behavior.
Number of PercentTraumatic n Actionable None 1,061 0.49 (0.16 - 1.14)One 1,129 0.89 (0.43 - 1.62)Two 885 0.79 (0.32 - 1.62)Three 559 2.50 (1.38 - 4.17Four 296 1.35 (0.37 - 2.31)Five 151 3.97 (1.47 - 8.45)Six or more 119 8.40 (4.10 - 14.91)

Figure 1. Level of Need by Year for Admissions into Residential TreatmentN=2782
02468
1012141618
Beh/Emotion RiskBehaviors
Functioning Strengths
20032004200520062007

Figure 6. Comparison of total score for RTC, CMO, and YCM initial assessments by year
05
10
152025
303540
2003 2004 2005 2006 2007
YCMCMORTC

Figure 8. Average Improvement over the course of Residential Treatment by YearNote: higher score better improvement)
0
1
2
3
4
5
6
7
Beh/Emotion Risk Behavior Functioning
2003200420052006

6
6.5
7
7.5
8
8.5
9
9.5
0 0.25 0.5 0.75 1 1.25 1.5 1.75 2
Year
TOT Scale
ALL YCM CMO TRH GRH PCR RES
Outcome Trajectories by program type in New Jersey

7
7.5
8
8.5
9
9.5
10
10.5
-1 -0.5 0 0.5 1 1.5 2
Years (vs Start Date)
Item
Ave
rage
(x 1
0)
TOT (ALL) YCM CMO TRH GRH PCR RES
Start
Hinge analysis of outcome trajectories prior to and after program initiation


Percent of hospital admissions that were low risk by racial group Adapted from Rawal, et al, 2003
0%5%
10%15%20%25%30%35%40%45%50%
1998 1999 2000 2001 2002
% o
f Low
Ris
k A
dmis
sion
s White
AfricanAmerican
Hispanic

Key Decision Support CSPI Indicators Sorted by Order of Importance in Predicting Psychiatric
Hospital Admission
Add 11,2,3Psychosis
Add 13Anger Control
Add 12,3Impulse/Hyperactivity
Add 12,3Depression
Add 12,3Danger to Others
Add 12,3Judgment
Add 12,3Suicide
Start with 0 andRated asIf CSPI Item
Ratings of ‘2’ and ‘3’ are ‘actionable’ ratings, as compared to ratingsof ‘0’ (no evidence) and ‘1’ (watchful waiting).

Change in Total CSPI Score by Intervention and Hospitalization Risk Level (FY06)
51.2
34.134.231.0
24.4
17.5
47.4
35.2
26.4
22.1 24.218.0
0
10
20
30
40
50
60
SASS Assessment End of SASSEpisode
Mea
n CS
PI S
core
HOSP (high riskgroup)ICT (high risk group)
HOSP (medium riskgroup)ICT (medium riskgroup)HOSP (low riskgroup)ICT (low risk group)

Integrating Total Clinical Outcome Management into Program Planning
1. Problem Identification
2. Problem Analysis
3. Plan Development
4. PlanImplementation
5. Plan Evaluation