you cannot be serious: do partisans believe what they say? · 2019. 1. 18. · gaurav sood is a...
TRANSCRIPT
You Cannot be Serious:
Do Partisans Believe What They Say?
Markus Prior Gaurav Sood Kabir Khanna
Princeton University
March 5, 2013
Abstract
On factual survey questions about economic conditions, opponents of the president often report significantly worse economic performance than the president’s supporters. Scholars have so far interpreted this finding to mean that partisan respondents cannot even agree on matters of fact. We test an alternative interpretation: Partisans give the wrong answer even though they have, or could infer, more accurate information. To assess this hypothesis, we conduct experiments, embedded in two nationally representative surveys which ask respondents to answer knowledge questions about economic conditions. We manipulate respondents’ motivation to be accurate by offering them monetary incentives for correct answers or emphasizing the importance of accurate answers. Compared to the control condition, both treatments reduce partisan differences in reports of economic conditions by about half. We conclude that many partisans interpret knowledge questions about economic conditions as opinion questions, unless motivated otherwise. Typical survey conditions thus reveal a mix of what partisans know about the economy and what they would like to be true about it. Markus Prior is Associate Professor of Politics and Public Affairs in the Woodrow Wilson School and the Politics Department. Gaurav Sood is a post-doctoral research affiliate at the Woodrow Wilson School at Princeton University. Kabir Khanna is a doctoral student in the Politics Department at Princeton University.

2
Shortly after the Bureau of Labor Statistics released the unemployment statistics for September 2012, Jack
Welch, the former CEO and Chairman of General Electric, tweeted, “Unbelievable jobs numbers.. these
Chicago guys will do anything.. can’t debate so change numbers.” Welch alleged that the true unemployment
was higher than the 7.8 percent reported by the BLS. What remains unclear is whether Welch, chosen by
Fortune Magazine as the “manager of the century” in 1999, believed his own allegation.
In opinion surveys, partisans tend to similarly mischaracterize economic conditions. In 1988, for
example, at the end of President Reagan’s second term, the American National Election Study (ANES) asked
respondents if “compared to 1980, the level of unemployment in the country ha[d] gotten better, stayed
about the same, or gotten worse?” Even though the unemployment rate had declined from 7.1 percent in
1980 to 5.5 percent in 1988, only about 30 percent of strong Democrats said that “the level of
unemployment… ha[d] gotten better.” In contrast, over 80 percent of strong Republicans and nearly 70
percent of weak Republicans correctly reported that unemployment had declined. When the ANES in 1996
asked about changes during President Clinton’s first term, more Republicans than Democrats failed to
acknowledge good economic performance. Compared to 39 percent of Democrats, only 25 percent of
Republicans reported that the budget deficit “ha[d] decreased… during Clinton’s time as President”—despite
a sharp decline, from $255 billion in fiscal year 1993 to $22 billion in FY 1997 (Achen and Bartels 2006).
Opponents of the president are often significantly more likely than supporters to report poor economic
performance (Bartels 2002). The question this study aims to answer is whether they actually believe what they
say.
Political scientists have long recognized that people’s partisan predispositions influence their
evaluations of candidates and policies. One reason for this influence is that people tend to accept information
that is consistent with their preexisting political beliefs and discount information that contradicts their beliefs.
The American Voter (Campbell et al. 1960, 133) called this a “perceptual screen through which the individual
tends to see what is favorable to his partisan orientation. The stronger the party bond, the more exaggerated
the process of selection and perceptual distortion will be.” Subsequent research showed that partisan images
(“schemas”), selective exposure, and motivated information processing result in candidate evaluations that
3
correspond to an individual’s partisan leanings (Lodge and Hamill 1986; Zaller 1992; Rahn 1993; Taber and
Lodge 2006).
Recent work provides evidence that partisan perceptual bias is more widespread yet and even extends
to beliefs about objective conditions in the country (Bartels 2002; Jerit and Barabas 2012; Ansolabehere,
Meredith, and Snowberg 2013; see also Kuklinski et al. 2000). Not only do partisans often disagree about how
to interpret facts, they disagree about facts. For partisanship to systematically distort perception of reality
would add a whole new layer of bias. Without agreement on some key facts, democratic decision-making
becomes rather difficult. Hochschild (2001, 321), for example, argues that misperceptions can affect citizens’
application of political values to policy questions. People who get relevant facts wrong may easily get their
attitudes and preferences “wrong,” too. According to retrospective voting models (e.g., Fiorina 1981),
democratic accountability suffers when evaluations of past performance are determined by partisanship.
But do partisans really believe that objective conditions favor their side? Or do they just say so?
Demonstrations of perceptual bias described above are based on responses to survey questions. Two very
different explanations may account for partisan differences in reported beliefs about objective conditions.
One possibility is that partisans do not know any better. For a variety of reasons that we describe below, they
may never have received or already forgotten the correct information, and misinformation or partisan
inferences could produce answers that flatter their own party. But a second explanation is also conceivable:
Partisans give the wrong answer even though they have more accurate information or could easily infer it.
They may disregard this less biased information and instead, for expressive or strategic reasons, or to save
effort, give an answer that is more consistent with their partisan predispositions.
The implications of these two alternative explanations are very different. To the extent that partisans
give partisan congenial responses even though they have information that proves them wrong, the threat of
partisan bias for political reasoning is exaggerated because people can base their evaluations on more accurate
information than their answers to factual survey questions reveal. If, in contrast, partisans’ answers reflect
information they believe to be accurate, the reach of partisan bias would seem to extend into the realm of
fact.

4
In order to distinguish between these two explanations, we conduct two experiments that manipulate
respondents’ incentives to answer factual questions about the economy accurately. We offer some
respondents a monetary reward for correct answers. Others are encouraged to answer correctly to help
research. Respondents in the control group answer the knowledge questions in the traditional format, without
any accuracy prompts. If partisan differences persist unabated in our treatment groups despite incentives to
respond correctly, these differences are likely to reflect genuine beliefs. If not, we have shown that
respondents can in fact provide less biased answers when they are motivated to do so.
Theory and Hypotheses
The objective of this study is to understand how people respond to factual questions about objective
conditions. We propose that their answers are a function of a) the information of objective conditions they
have stored in memory, b) the information they can access in memory or infer on the spot, and c) their
willingness to report this information.
Information may take three principal states: correct information, incorrect information, and lack of
information (e.g., Kuklinski et al. 2000). Many people in many domains lack any information (Bennett 1995;
Delli Carpini and Keeter 1996). Holding incorrect information can result from unrepresentative personal
experiences (Conover, Feldman, and Knight 1986; Ansolabehere, Meredith, and Snowberg 2011), a
misreading of facts (Nyhan and Reifler 2010), or exposure to sources that deliberately or inadvertently
misrepresent facts (Bullock 2006). Selective exposure, attention, and processing can make it more likely that
people hold incorrect information or remain uninformed about conditions that do not favor their party (e.g.,
Lodge and Hamill 1986; Taber and Lodge 2006; Iyengar and Hahn 2009; Stroud 2011; Jerit and Barabas
2012). People may also hold correct or incorrect information without having been exposed to it when they
draw inferences based on other information (Kuklinski et al. 2000, 794-5). Partisan inference rules are
common because they are widely available and often salient (Lodge and Hamill 1986; Rahn 1993).
When respondents are asked to report objective conditions, the information they hold in memory
may thus reflect well on their party because they processed information in a biased way. Psychologists have
shown that motivation affects information processing. The two motivations most relevant in the present
5
context are accuracy and consistency (or directional) goals (e.g., Festinger 1957; Kruglanski 1990; Kunda
1990; Chaiken, Giner-Sorolla, and Chen 1996). The accuracy goal motivates people to “arrive at an accurate
conclusion, whatever it may be,” whereas the consistency goal motivates them to “arrive at a particular,
directional conclusion” (Kunda 1990, 480). The conclusion is typically set by people’s existing attitudes and
beliefs (Chaiken et al. 1996, 558). For consistency goals to operate in the political domain, respondents thus
have to (consciously or subconsciously) treat the question topic as relevant to their political identity (see Jerit
and Barabas 2012). Political scientists have used this theoretical perspective to explain partisan perceptual
bias, attitude change, and decision-making (e.g., Brady and Sniderman 1985; Lodge and Taber 2000; Redlawsk
2002; Taber and Lodge 2006; Nir 2011).
It is important to recognize, however, that accuracy and consistency motivations also operate during
the interview that is conducted to measure what people know (and think and feel). The psychological
literature makes it clear that memory searches and inference processes work differently depending on whether
a person is guided by accuracy or consistency goals (e.g., Kunda 1990; Chaiken et al. 1996; Kruglanski 1996).
Hence, the survey context may influence what information respondents access. Consistency goals could lead
respondents to terminate their memory search when it has produced information that reflects well on their
party, whereas accuracy-motivated respondents continue their search more evenhandedly. Consistency goals
could lead respondents who lack accessible information to rely on automatic partisan inference rules, whereas
accuracy-motivated respondents rely on less partisan rules (see Lodge and Taber 2000, 205-209).
Once memory searches or inferences have produced information, motivation may also affect
whether survey respondents report it faithfully or give an answer that differs from the accessible information.
Respondents may want to give an answer that is close to what they believe to be the truth (accuracy goal), but
also want their answer to reflect their existing feelings and beliefs (consistency goal). The accuracy goal
motivates them to report accessible information faithfully. The consistency goal may interfere, however,
when the accessible information clashes with respondents’ partisan predispositions or other information they
hold. It may lead respondents who care about their appearance to the interviewer to knowingly give a
consistent but incorrect response for symbolic (or expressive) purposes. Strategic reasons might lead them to
6
give consistent answers they know to be wrong in the hope of influencing public opinion. Or giving the
consistent answer may reduce dissonance in some other way. Work on motivated reasoning in psychology has
paid limited attention to the possibility that goals lead to conscious editing of survey responses. In her
influential article, Kunda (1990, 494), for example, devotes half a paragraph to it. In a departure from past
research on motivated reasoning in both psychology and political science, we focus on the impact of
motivation during the survey response.
Consistency pressure may lead partisan respondents to report the conditions they would like to see,
not the conditions they believe to be true. Partisan respondents may thus give incorrect answers in response
to factual questions even though they hold more accurate information in memory or could derive less
consistent answers if they wanted. For example, during a Republican administration, consistency pressures
may lead Democrats to report worse economic conditions than Republicans even though they know that
conditions are in fact better than they report or could counteract their automatic inference that conditions are
poor. Because the information respondents hold in memory is unobservable, we translate this claim into the
following testable hypothesis:
H1: Increasing accuracy motivation reduces the difference between Republicans’ and Democrats’
propensity to report unfavorable objective conditions.
If an increase in accuracy motivation that does not change the information available to respondents still
reduces partisan differences in reported conditions, it follows that respondents can counteract their own
partisan reflexes. Either they have accurate but inconsistent information in memory that they choose not to
reveal unless consistency pressure is countered by sufficient accuracy motivation. Or sufficient accuracy
motivation prompts respondents to counteract automatic partisan inferences. A correction of partisan
inferences does not necessarily increase the accuracy of the answer. When consistency and accuracy pressures
push in the same direction, counteracting consistency motivation may lead to answers that are both less
consistent and less accurate.
Several reasons may lead to the rejection of H1. If consistency pressures do not operate during the
survey response, respondents will give the answer they believe to be most accurate with or without accuracy
7
incentives. Alternatively, consistency pressures may be so powerful that appeals to accuracy do not
undermine them. Similarly, partisan inferences may be too ingrained to be corrected through greater effort.
H1null: Increasing accuracy motivation leaves unchanged the difference between Republicans’ and
Democrats’ propensity to report unfavorable objective conditions.
We evaluate the two competing hypotheses by experimentally manipulating how much weight respondents
give to the accuracy goal. A randomly selected subset of respondents receives an accuracy appeal or a
monetary reward for accurate answers to questions about objective economic conditions. This treatment
strengthens the accuracy goal relative to the consistency goal. If the operation of consistency motivation
during the response explains why we observe perceptual bias in surveys without accuracy incentives, then
respondents in the treatment group should provide answers that are less consistent with their partisan
predispositions and observed partisan perceptual bias should be lower.
To complete our argument about competing incentives, we also examine the effect of varying
consistency motivation. Greater consistency motivation should widen partisan gaps in reports of economic
conditions. It may also thwart the impact of accuracy incentives:
H2: Increasing consistency motivation increases the difference between Republicans’ and
Democrats’ propensity to report unfavorable objective conditions and attenuates the impact of
accuracy incentives.
We manipulate consistency motivation by randomly including an explicit political reference in the economic
knowledge questions.
Past research has found partisan bias in reports of economic conditions to be greater among
knowledgeable respondents (Shani 2006; Bartels 2008, 153-57) and on questions that received high levels of
media coverage (Jerit and Barabas 2012). According to Lodge and Taber (2000, 211), biased processing is
most likely among knowledgeable partisans “for it is sophisticates who typically hold the strongest attitudes,
with the most confidence, and who have the most facts at hand, thereby making them more able to assimilate
supporting evidence and better equipped to discredit arguments that challenge their established beliefs or
attitudes.” This suggests that politically knowledgeable people are most likely both to experience consistency

8
pressures and to hold accurate information (to have “the most facts at hand”) when they answer a question
about objective economic conditions.1 This combination makes it particularly likely that they will report a
consistent answer they know to be incorrect. Greater accuracy motivation thus has the potential to make a
particularly big difference for the most knowledgeable partisans:
H3: Increasing accuracy motivation reduces the difference between Republicans’ and Democrats’
propensity to report unfavorable objective conditions more strongly among partisans with high
political knowledge than among partisans with low political knowledge.
Research Design, Data, and Measures
To assess our hypotheses, we conducted two studies, in 2004 and 2008. In both studies, respondents
answered a series of knowledge questions about current economic conditions. In the Study 1, we manipulated
respondents’ motivation to respond accurately by offering a randomly chosen subset $1 for each correctly
answered knowledge question. In the Study 2, we used two treatments to increase respondents’ accuracy
motivation. One third of respondents received a monetary incentive of $2 for each correct answer. Another
third of respondents was presented with an accuracy appeal that emphasized the importance of accurate
answers for research purposes.
The explanation of the monetary incentive in Study 2 illustrates the first treatment:
We will pay you for answering questions correctly. You will earn 2000 bonus points ($2) for every correct answer you give. So, if you answer 3 of the 5 questions correctly, you will earn 6000 bonus points ($6). If you answer all 5 questions correctly, you will earn 10000 bonus points ($10). The more questions you answer correctly, the more you will earn. At the end of this study, you will see a summary of how many questions you answered correctly.
The wording of the accuracy appeal was as follows:
As you probably know the government gathers a lot of statistical information about the economy. We are interested in learning whether this information is finding its way to the general public. These are questions for which there are right and wrong answers. [in red font:] In order for your answers to be most helpful to us, it is really important that you answer these questions as accurately as you can. [end red font]. At the end of this study, you will see a summary of how many questions you answered correctly.
1 In fact, on the 1996 ANES question about changes in the budget deficit, Achen and Bartels (2006) find a decline of perceptual bias among the most informed partisans.

9
Respondents in the control group only saw a general introduction to the knowledge section which was
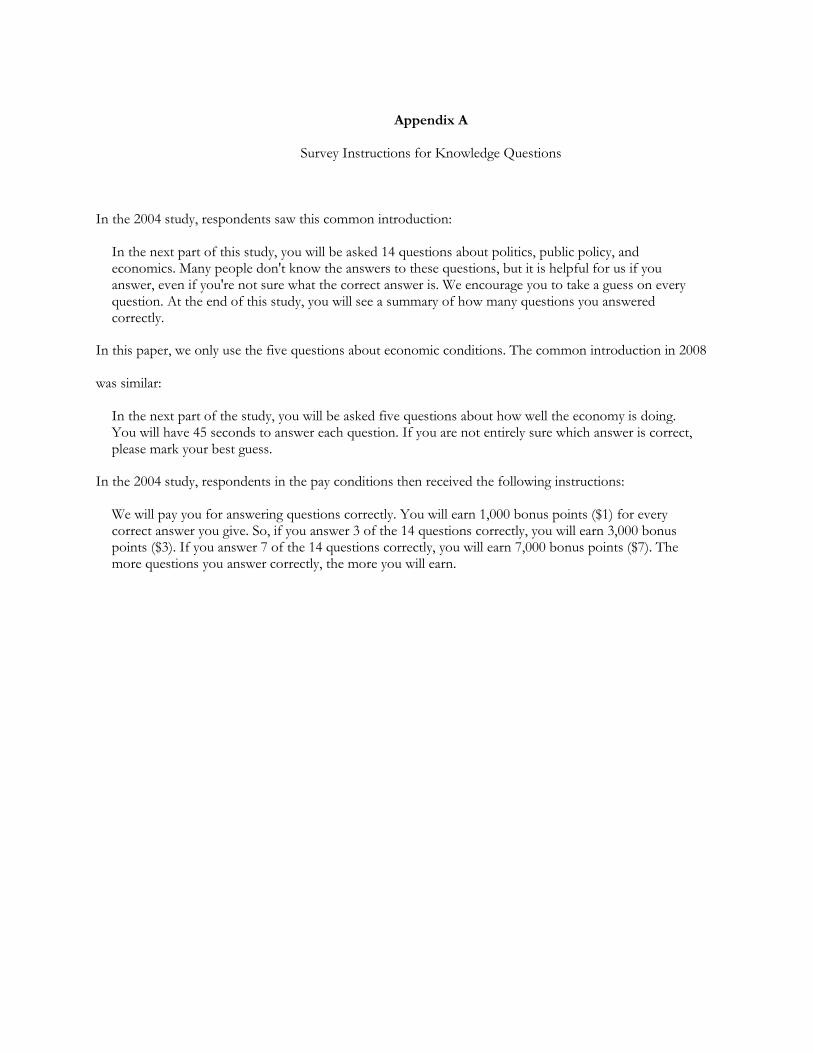
identical in all conditions and is shown in Appendix A along with complete 2004 instructions.2
To test H2, Study 2 also included a second (orthogonal) experimental treatment designed to increase
consistency motivation. For a random half of respondents, a reference to President Bush was added to each
of the five knowledge questions. This treatment makes it explicit that the question refers to the change in
economic conditions over the course of the Bush presidency. (See appendix table A1 for wording.) Even
without partisan cues, some policy issues may have enough partisan salience to trigger consistency goals. But
a political reference in the factual knowledge question should strengthen consistency motivation further by
politicizing the question explicitly. This design follows Achen and Bartels (2006, 24) who suggest that the
reference for President Clinton in the 1996 ANES questions about the budget deficit “may have encouraged
people… to connect their responses to their partisan predispositions.”
Both experiments were embedded in nationally representative surveys of U.S. residents conducted by
Knowledge Networks. Knowledge Networks interviews national probability samples over the Internet by
providing a large panel, selected through Random Digit Dialing, with WebTV units and/or free Internet
connections in exchange for taking surveys. The participants in this study constitute a randomly selected
subset of the KN panel and approximate a random sample of the U.S. adult population. Respondents
completed our surveys using an Internet browser or a WebTV unit. Subject payments are straightforward to
implement using the company’s system of “bonus points.”3 Study 1 was in the field between October 19 and
November 1, 2004. It was assigned to 775 panelists of whom 618 (80 percent) completed it. Study 2, 2 Screen completion times, which were measured in the 2008 study, provide a manipulation check: Median completion times were 9 seconds for the control group instructions, 30 seconds for the monetary incentive instructions, and 22 seconds for the accuracy appeal. 3 Respondents received credit for correct answers in the form of “bonus points.” Knowledge Networks sends their panelists checks for $25 when they reach 25,000 points (which they can also earn in other surveys they take). For all practical purposes, we consider our incentives direct cash rewards. The instructions in the pay conditions mentioned the bonus points as well as their dollar equivalents. Respondents in the pay conditions were reminded on every screen with a knowledge question that a correct answer would earn them a specific monetary reward. To facilitate payment for open-ended questions in the relevant experimental conditions, we specified in advance a range of answers (e.g., “within X percentage points of the true percentage”) that would earn compensation. Respondents were never told these ranges. At the very end of the interview, they learned the number of questions they answered correctly (and the rewards they had earned).
10
conducted from March 26 to April 8, 2008, was assigned to 1,633 panelists and completed by 1,511 (93
percent).4
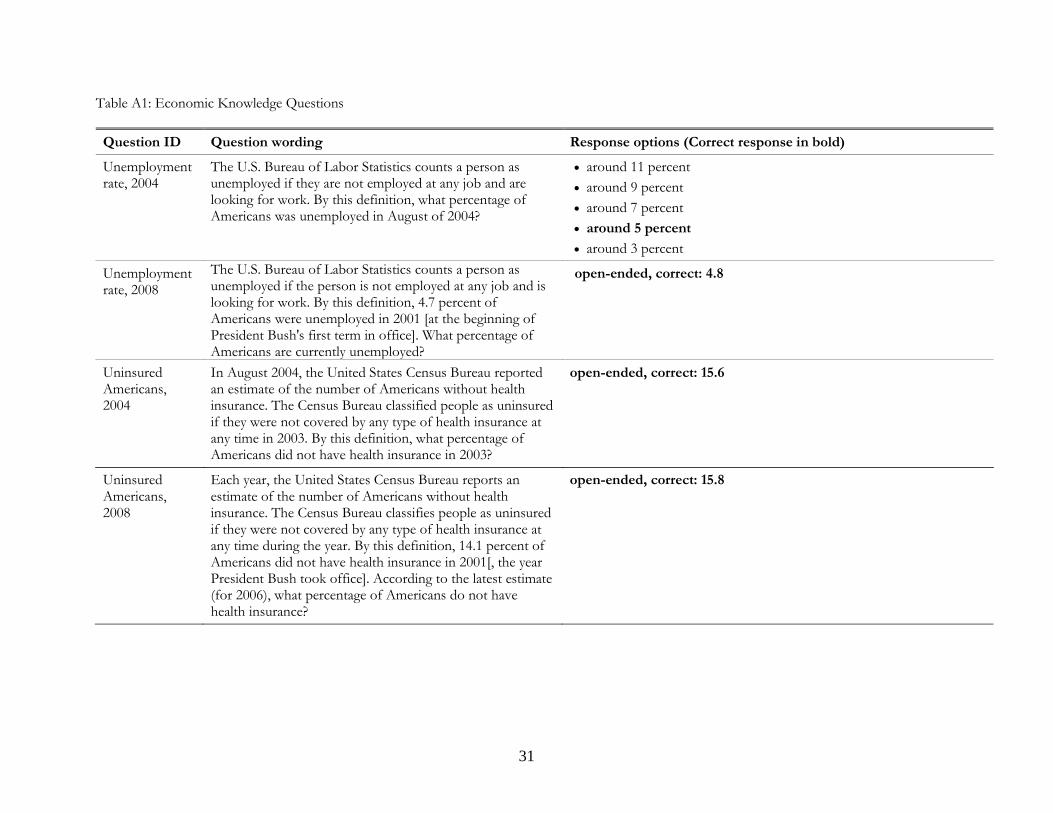
Each survey included five knowledge questions about objective economic conditions. Respondents
were asked to provide their best estimates of the unemployment rate (both studies), the federal debt (both),
health insurance coverage (both), the population share liable for estate tax (both), the poverty rate (2004) and
gas prices (2008). Five questions were open-ended, five multiple choice. (For question wording and response
options, see appendix table A1.) No ‘Don’t Know’ option was offered, in keeping with recommendations by
Mondak and Davis (2001) and Miller and Orr (2008). Respondents were encouraged to offer their best guess
if they were unsure about the right answer. While respondents could hit the “next question” button without
marking any answer, very few of them did.5
In both surveys, respondents’ time to complete the knowledge questions was limited in order to
make it as difficult as possible to consult help. In Study 1, respondents were allowed 60 seconds to read and
answer each knowledge question in the first survey. Whether or not respondents had selected one of the
response options, the next knowledge question appeared automatically after 60 seconds. Respondents could
also move to the next question sooner by clicking the “Next Question” button. In Study 2, respondents’
initial response time was limited to 45 seconds with a 10-second warning after 35 seconds. Respondents who
had not marked any response option after 45 seconds were told that “It is helpful for us if you answer this
question, even if you’re not perfectly sure. Please mark your best guess.” They then received another 45
seconds to complete the question. The software recorded the response selected when respondents moved to 4 We examined whether assignment to the experimental conditions affected completion rates (i.e., whether paying respondents for correct answers would affect the likelihood that they complete the entire interview). If it did, then we must estimate this indirect effect of the experimental manipulations as well as their direct effects. Part of this complication is avoided because the assignment of the experimental condition occurred only when respondents reached the knowledge section of the interview. Respondents who quit the survey before that point could not have been affected by the monetary incentive as we had not yet revealed that aspect of the survey. After respondents learned to which experimental condition they were assigned, only 7 (in 2004) and 8 (in 2008) quit the interview, and drop-out was evenly distributed across conditions (2004: 4 in the ‘pay’ condition, 3 in the control; 2008: 2 in ‘pay’, 4 in ‘accuracy appeal’, 2 in the control.) Hence, selection effects are very unlikely. Therefore, we consider experimental differences between respondents who completed the interview as valid estimates of the true treatment effects. 5 The average fraction of hitting “next question” without marking an answer was 3.2 percent in Study 1 and 1.7 percent in Study 2.
11
the next question. In both surveys, respondents were informed about this time constraint before the
knowledge battery. Respondents had the opportunity to pause the interview when they learned that they
would be asked political knowledge questions, but they could not stop the relevant timers once they saw the
first knowledge question.
In order to analyze all ten questions in one (hierarchical) model, we need a common metric for the
dependent variable, reported economic conditions. Drawing on ANES question wording, much of the work
on knowledge of economic conditions distinguishes accurate answers from over- and underestimates (e.g.,
Conover et al. 1986; Bartels 2002). To follow this convention, we trichotomize answers to all knowledge
questions into underestimates, correct answers, and overestimates. As Holbrook and Garand (1996) point
out, this scoring approach has advantages. We are theoretically more interested in the direction of the error
than in its extent. The scoring does not require treating closed-ended responses as point estimates. Most
importantly, it allows us to sidestep the question of how to deal with implausible responses to open-ended
questions. For example, about ten percent of respondents reported unemployment rates greater than 30
percent, uninsured rates of 50 percent and higher, and double-digit gas prices. Treating these responses at
face value would be somewhat arbitrary. Using a trichotomized coding, we can conveniently treat these as
overestimates.6
The downside of trichotomizing open-ended responses is the arbitrariness of the interval that is
treated as correct. To address this challenge, we present robustness tests using several different intervals for
the five open-ended questions. Our main scoring rule sets the “correct” interval so that each open-ended
question approximates the average percentage of correct responses across the five multiple-choice questions
of 33 percent. In robustness checks, we use alternative rules: (1) ranges set to approximate 23 percent
“correct” answers allowing for the fact that open-ended questions tend to be more difficult than multiple-
choice questions; (2) “correct” defined in absolute terms, within 10 percent of the correct answer; and (3) the
predetermined ranges for which respondents received payouts.
6 We make one correction even for trichotomized variables: Gas price responses of $100 or higher were divided by 100 on the assumption that they reflect a failure to include a decimal point.

12
The direction of consistency pressure depends on which party is considered responsible for
economic conditions. Our experiments occurred during the presidency of George W. Bush. To the extent
that respondents deem the incumbent’s party responsible and are affected by consistency pressure,
Republicans should report economic conditions as more favorable than Democrats. We thus score responses
so that overstating poor conditions constitutes pro-Democratic bias, and vice versa.7 No matter which
scoring rule we use, more respondents overstate than understate economic problems. (For example, 50
percent overstate and 15 percent understate across all 10 questions using our main scoring rule. The
exception is public debt which more respondents understate than overstate in both studies.) The expected
partisan bias (in the control group) is evident in Democrats’ greater propensity to overstate economic
problems (55 percent compared to 42 percent among Republicans). Our main task is to examine if
experimental treatments reduce this partisan difference in the propensity to overstate economic problems.
By the spring of 2008, a considerable portion of Republicans were dissatisfied with President Bush.
As Republicans, they would like to report strong economic conditions. But their dissatisfaction with Bush
creates a second, countervailing consistency pressure: They may not want to credit the president they have
come to dislike with positive economic outcomes. In order to focus on respondents for whom consistency
pressures are unambiguous, we exclude Republicans who disapprove of Bush’s handling of the economy
(15% of the 2008 sample, and 40% of Republicans). We also exclude two other groups for whom the
direction of consistency pressures is ambiguous, pure independents (16%) and Democrats who approve of
Bush (2%). Our 2004 survey does not include a measure of presidential approval, so we only exclude pure
independents. According to the 2004 ANES, which was in the field at about the same time as Study 1, 20
percent of Republicans disapproved Bush’s handling of the economy and 11 percent of Democrats approved
of it. The following analysis thus compares mostly Democrats with unfavorable views of Bush to Republicans
7 On the estate tax question, partisan consistency leads Republicans to overstate how many people pay estate tax (following the common Republican argument that many people and businesses are affected by it). On the other hand, partisan consistency leads Democrats to understate the estate tax base (to support the argument that only the very wealthy pay the tax).

13
with favorable views, but inability to exclude respondents with countervailing consistency pressures in Study
1 makes it marginally harder to show effects of accuracy incentives.
Model and Estimation
We use a hierarchical ordered logistic model to the estimate treatment effects. Each respondent i = 1,…, n
answers knowledge questions j = 1,…, k which are included in one of two surveys s = 1,2. All questions have
response categories c = (higher, correct, lower). The resulting proportional odds model has the form:
𝑙𝑜𝑔 �𝑃𝑟�𝑦𝑖𝑗𝑠 ≤ 𝑐�
1 − 𝑃𝑟�𝑦𝑖𝑗𝑠 ≤ 𝑐�� = 𝜅𝑐 − [𝑋𝑖𝛽 + 𝛼𝑖 + 𝛿𝑠]
𝛼𝑖~ 𝑁(0,𝜎𝛼 2 )
𝛿𝑠~ 𝑁(0,𝜎𝛿 2)
The model includes random effects for respondents (αi) to capture the dependence of observations from the
same respondent and random effects for surveys (δs) to capture dependence of observations from the same
survey.8 Pooling over polls using random effects is a common strategy for meta-analysis of similar studies (see
Berkey et al. 2007). 𝜅𝑐 denotes cut points, which are constrained to increase. This analytic strategy is the log-
odds counterpart of the conventional repeated measures analysis. Close replicas of this analytical strategy have
been used before (e.g., Iyengar et al. Forthcoming; Stegmueller et al. 2012).
The main components of Xi will be the experimental treatments, respondents’ party identification,
and the interaction between treatment and party ID. The resulting specification estimates the causal effect of
the various experimental treatments on the difference between Democrats and Republicans in responses to
the knowledge questions.
We estimate the model via maximum likelihood using the Stata library GLLAMM (Rabe-Hesketh,
Skrondal, and Pickles 2004, 2005). Within GLLAMM, we use adaptive quadrature (Naylor and Smith 1982) to
numerically integrate the marginal likelihood (which has no closed-form solution.) Adaptive quadrature has
been shown to be robust and preferable in many circumstances to quasi-likelihood methods, such as marginal
8 Another way to capture this dependence is by supplementing the standard ordered logistic model with clustered standard errors. Doing so does not change the results.

14
and penalized quasi-likelihood, and other numerical integration methods, such as ordinary quadrature (Rabe-
Hesketh, Skrondal, and Pickles 2002; Rabe-Hesketh, Skrondal, and Pickles. 2004).9
Results
To test if a monetary incentive reduces partisan differences in reported economic conditions, the first two
columns in Table 1 present joint estimates for 2004 and 2008 data. Responses, coded as underestimates,
correct estimates, and overestimates, are regressed on party ID, monetary incentives, and the interaction
between the two using a hierarchical ordered logit model. Column (1) uses a dummy to distinguish
Democrats from Republicans, whereas column (2) employs the 7-point party identification scale (scored from
strong Republican [0] to strong Democrat [6], but with no observations at the midpoint because pure
independents are excluded.)
[Table 1 about here]
In the control group, partisanship has a consistent impact on estimates of economic conditions in the
expected direction. The more strongly a respondent identifies with the Democratic Party, the more likely she
is to overstate economic problems. The effect of monetary incentives significantly reduces the impact of
partisanship on estimates of economic conditions. The main effect of monetary incentives captures their
effect on Republicans (column 1) or strong Republicans (column 2). In both specifications, Republicans
become significantly more likely to report unfavorable economic conditions when they are offered a
monetary incentive for correct answers. The interaction effect is significant and negative in both models,
indicating that the effect of incentives reverses among Democrats.
To test if experimental effects differed by strength of partisanship, we tested a fully-interacted
specification using indicator variables for levels of the 7-point scale against a model that constrained the
treatment interactions to be the same within each party. Allowing treatment effects to vary by strength of
partisanship did not improve model fit (χ2[4] = 3.6, p = .46), so we prefer column (1) as a more appropriate
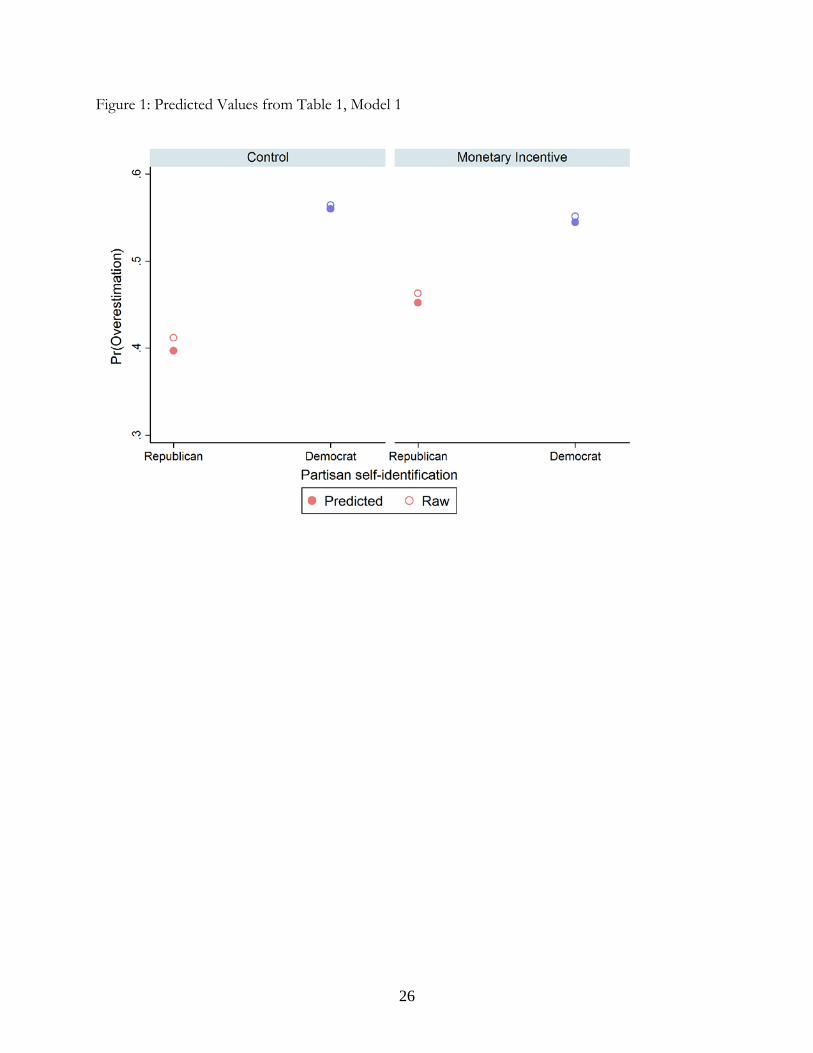
model specification. To illustrate the experimental effects, Figure 1 graphs predicted probabilities derived
9 For specific examples of problems with ordinary quadrature, see Albert and Follmann (2004) and Lesaffre and Spiessens (2001).
15
from model 1. It shows that monetary incentives reduce the gap between Democrats and Republicans in
overestimating the extent of economic problems. Figure 1 also shows the raw probabilities of overestimating
by party ID and treatment. They match the predicted values very closely.
[Figure 1 about here]
Columns (3) – (5) in Table 1 examine the robustness of the results to different definitions of “correct”
answers to open-ended knowledge questions. Whether we use the predetermined definitions for which
respondents received payouts, defined the range of “correct” in absolute terms (within 10 percent of the
correct answer), or score open-ended questions so that 23 (rather than 33) percent of responses are counted
as “correct,” the empirical results are statistically and substantively indistinguishable. Robustness tests
minimize concerns about idiosyncratic scoring of the dependent variable.
Next we test if an appeal to accuracy reduces partisan bias in the same way as a monetary incentive.
Columns (6) and (7) in Table 1 report the results for Study 2 using both incentive treatments. Substantively,
results are highly similar to the joint model in columns (1) and (2). Explaining the purpose of the questions to
respondents and telling them that “it is really important that you answer these questions as accurately as you
can” significantly reduces differences between Democrats and Republicans in reported economic conditions.
Although point estimates of the effect of the non-monetary accuracy appeal are slightly smaller than for the
monetary incentive, we cannot reject the hypothesis that these differences are due to sampling error and that
the accuracy appeal is as effective as a monetary incentive in reducing partisan bias.10 Again, allowing
treatment effects to vary between strong, weak, and leaning partisans does not improve model fit (χ2[4] =0.2,
p = 1.0), so we prefer to focus on model (6). Figure 2 graphs predicted values from this model to illustrate the
reduction in partisan bias through accuracy appeal and monetary incentive. As before, predicted and raw
probabilities match closely. Both show perceptual bias cut roughly in half by accuracy incentives.
[Figure 2 about here]
10 Equality constraints yield p values of .50 and .48 for the main and interaction effects, respectively.
16
Additional Robustness Checks
If incentives for correct answers motivate respondents to look up answers, it would be invalid to conclude
that respondents in the control group could report less biased estimates if only they were motivated to do so.
We designed our surveys so that respondents had little opportunity to consult help, and there is compelling
evidence that attempts to do so, if they occurred, did not distort our results. First, both surveys discouraged
respondents from looking up answers by limiting the time they had for each question and informing them
about these limits. As discussed above, time limits were 60 seconds in Study 1 and up to 90 seconds in Study
2 (although respondents were not told they would receive another 45 seconds if they did not check any
answer in the first 45 seconds).
Second, Study 2 included screen completion timers for all knowledge questions, allowing us to
exclude slow responses, which may indicate attempts to look up answers. The results in Table 1 are highly
robust to excluding long response times using a variety of different cutoffs. As shown in Appendix B, limiting
response times to less than 60, 45, or 40 seconds barely changes the estimates at all. An even more aggressive
filter of no more than 30 seconds, which excludes 42 percent of all responses, produces some changes, but in
opposite directions: The monetary incentive effect becomes slightly stronger, the accuracy appeal effect
slightly weaker. It seems highly unlikely that respondents looking up information could explain these
(marginal) changes.
Third, respondents who complete their surveys via a WebTV unit effectively do not have the
opportunity to use a web browser. Respondents who access the Knowledge Networks website through a dial-
up Internet connection cannot easily take advantage of online resources either. Realistically, only respondents
with high-speed connections could thus look up the correct answer in the allotted time. Allowing the
coefficients in models (1) and (6) in Table 1 to vary by availability of a high-speed connection does not
improve the model fit (χ2[3] = 2.4, p = .50 for (1); χ2[5] = 2.1, p = .83 for (6)), indicating that respondents
who might have the option to look up answers and respondents who do not have this option behave
17
indistinguishably in our studies. In sum, we find no evidence that respondents consulted help as they
answered the knowledge questions.11
Comparing the Effect of Accuracy and Consistency Motivation
So far, we have examined the effect of raising accuracy motivations on partisan bias in reports of economic
conditions. According to our second hypothesis, raising consistency motivations should have the opposite
effect and thus thwart the de-biasing impact of accuracy incentives. The 2008 Study manipulated consistency
pressure by randomly varying whether or not the five questions about objective economic conditions
mentioned President Bush. Up to now, the analysis averaged across this manipulation. The first column in
Table 2 allows all coefficients to vary by Bush reference. Compared to model (6) in Table 1, this improves
model fit significantly (χ2[6] = 14.0, p = .03).
[Table 2 about here]
Without accuracy incentives, partisanship has a marginally stronger impact on reported beliefs when the
question raises consistency pressures by mentioning the president: The coefficient for Democrats is a third
higher than without a Bush reference (p < .15, one-tailed). More importantly, the treatment effect of accuracy
incentives is lower when a Bush reference is present. Although this contrast seems to be more pronounced
for the accuracy appeal than the monetary incentive, we lack statistical power to say so with confidence.
Collapsing the two incentive treatments in column (2) of Table 2 does not reduce model fit significantly (χ2[4]
= 2.0, p = .74), so we base our interpretation on this simpler model.12
Results in column (2) show that the Bush reference significantly reduces the impact of accuracy
incentives. Without a Bush reference in the question, accuracy incentives reduce the partisanship coefficient
by over two thirds (βDem×Acc.Incentive = -.48, p = .004, one-tailed). When the question mentions Bush, not only is
partisan bias larger without incentives, but incentives have a reduced—yet still significant—impact
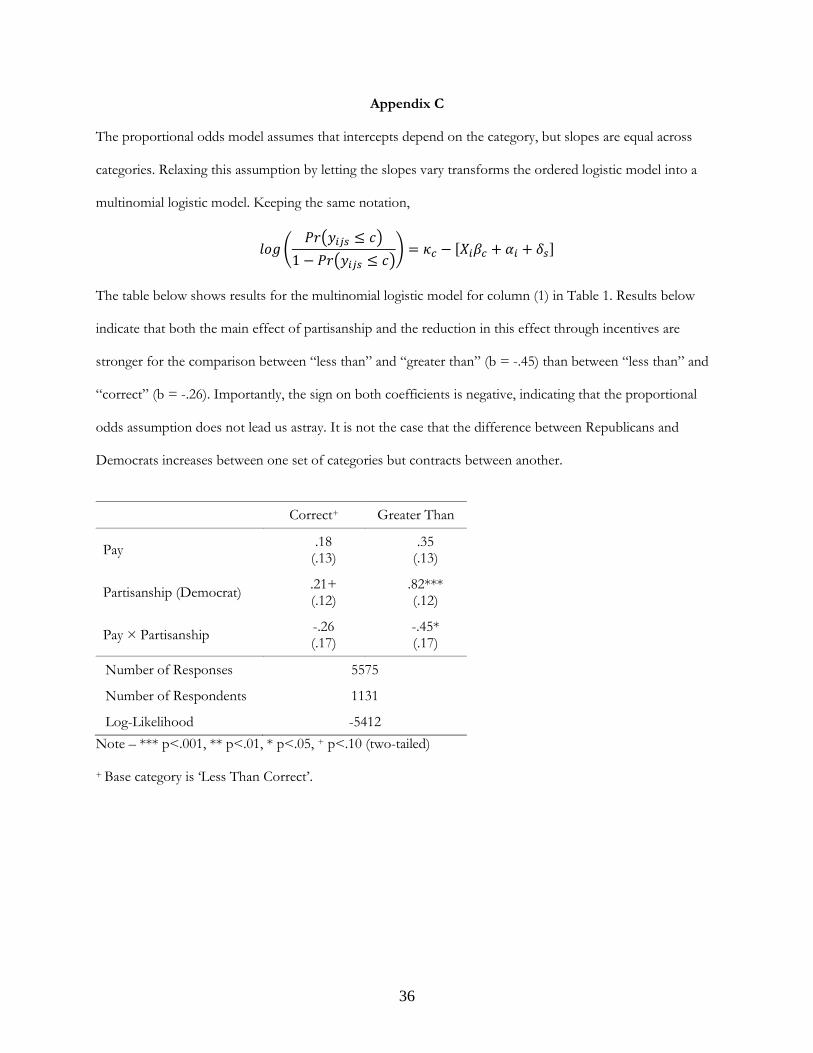
11 We also examined the consequence of relaxing the proportional odds assumption behind the ordered logit model. By assumption, proportional odds models force the effect of an independent variable to be the same across categories. Appendix C presents evidence that relaxing this assumption by allowing for separate coefficients for different categories does not change the substantive interpretation of results. 12 Model (2) in Table 2 fits the data significantly better than the equivalent model that averages over the Bush reference treatment (χ2[4] = 12.4, p < .02).
18
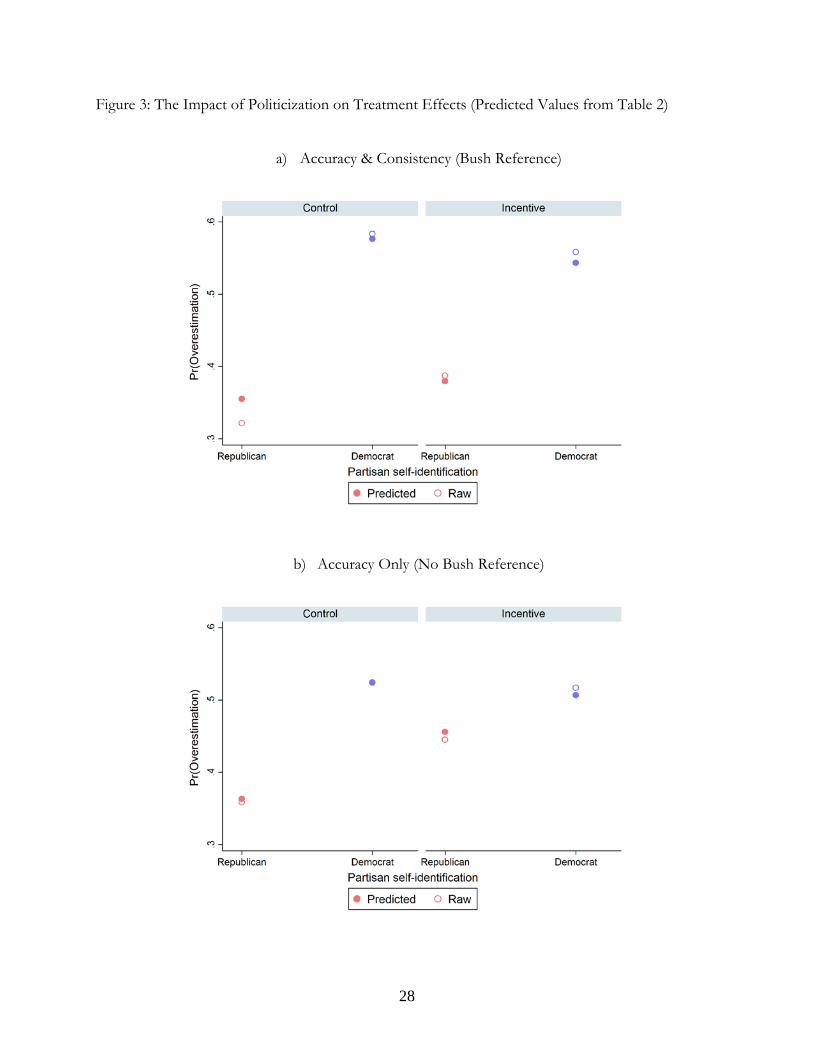
(βDem.×Acc.Incentive + βDem×Acc.Incentive×BushRef = -.25, p = .04 one-tailed). Figure 3 illustrates these results
graphically. With the Bush reference, accuracy incentives reduce the probability difference in overstating
economic problems between Democrats and Republicans from .22 to .16. Without the Bush reference, the
partisan gap declines from .16 to .05. These results support H2 and show that, just like accuracy motivation
reduces partisan bias, consistency motivation increases it. The two are not additive, however: When a cue
politicizes the question, the resulting consistency motivation is not as effectively counteracted by accuracy
incentives.
[Figure 3 about here]
The Role of General Political Knowledge
According to our final hypothesis, the effect of accuracy incentives should disproportionately reduce partisan
differences in reports of economic conditions among politically knowledgeable respondents because they
experience the strongest consistency pressures under control conditions and should be most likely to have
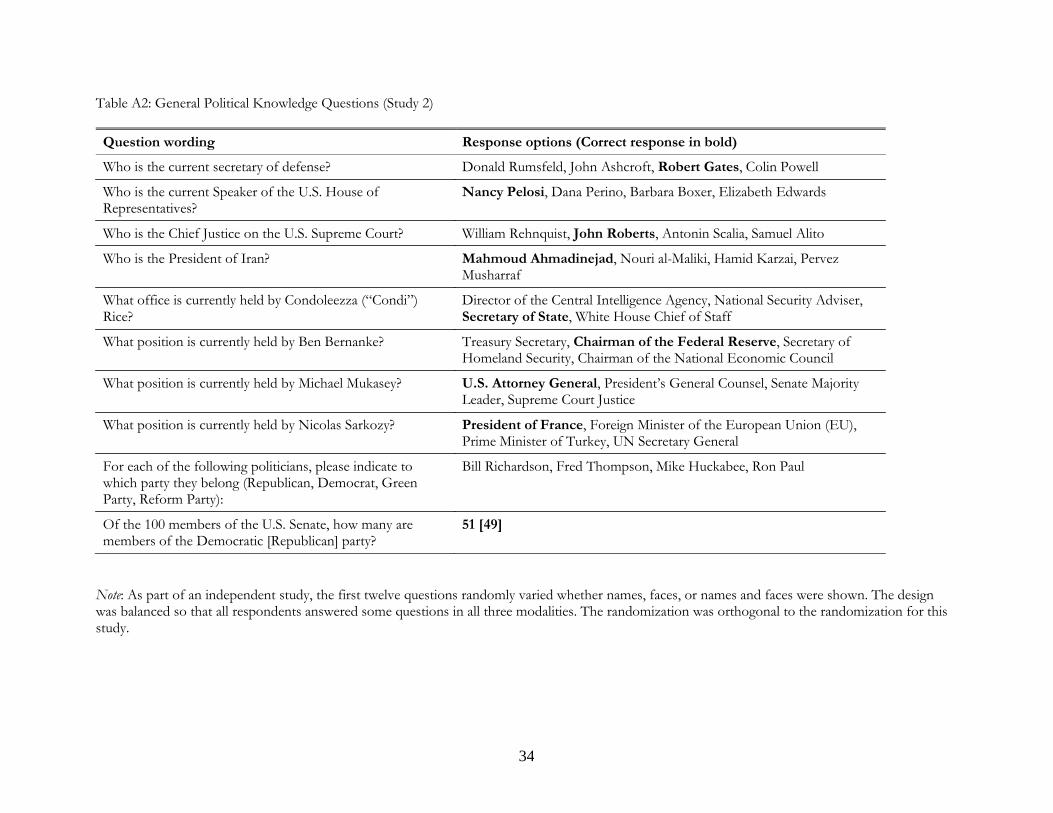
accurate information about the economy. To examine H3, we use a series of 13 unrelated general knowledge
questions asked earlier in the 2008 Study (listed in Appendix A). Figure 4a plots the relationship between
overestimating economic problems and general political knowledge for Democrats and Republicans in the
control group (thin lines) and with accuracy incentives (thick lines). Accuracy appeal and monetary incentive
are pooled because they generate almost identical patterns. Data are smoothed using locally weighted (lowess)
regressions. Only three Republicans in the control group answered fewer than four general knowledge
questions correctly, so we omit them from the analysis and do not attempt to characterize the relationship for
the least knowledgeable Republicans in the control group
[Figure 4a-c about here]
Two findings in Figure 4a stand out. First, the control group confirms previous research which found greater
partisan differences in reports of economic conditions among more knowledgeable respondents (Shani 2006;
Bartels 2008). The partisan difference narrows slightly at the very highest knowledge levels, suggesting that
the pattern Achen and Bartels (2006) show for one question (the 1996 ANES budget deficit item) holds more
generally.
19
Second, and previously unknown, the extent of partisan perceptual bias is unrelated to general
knowledge when respondents receive an accuracy incentive. The two thick lines are almost exactly parallel for
the entire observed range of general political knowledge. Both lines dip at high knowledge levels, indicating
that knowledgeable Democrats and Republicans are less likely to overstate economic problems. Regardless of
general knowledge, however, the difference between Democrats and Republicans with accuracy motivation is
constant and of the same modest magnitude observed at low knowledge levels in the control conditions.
To verify the statistical significance of treatment effects conditional on political knowledge and party
identification, we interact knowledge levels with the variables in model (6) in Table 1. Figure 4a indicates that
the relationship between treatment effect and political knowledge is non-linear in the control group. We
therefore include linear and quadratic knowledge terms. We again collapse the two accuracy treatments as
allowing them to vary does not improve model fit (χ2[6] = 2.7, p = .84). For convenience, general knowledge
is centered on the score of four. The predicted values in Figure 4b demonstrate that this model recovers the
main patterns in the raw data in Figure 4a.
Estimates in Table 2 (column 3) indicate that partisan differences in reports of economic conditions
are marginally significant among less knowledgeable partisans (4 correct out of 13) in the control condition.
As knowledge increases, Republicans become less likely to overstate economic problems (as indicated by the
significant negative main effect of knowledge), while Democrats do not (as indicated by the significant
interaction of knowledge and party ID of almost exactly the same magnitude as the knowledge main effect.)
The significant positive quadratic knowledge main effect and negative interaction with party ID indicate that
this trend reverses among the most knowledgeable respondents. A joint test of βPID×Knowledge and βPID×Knowledge2
confirms that the quadratic relationship in the control group between knowledge and reports of economic
conditions differs significantly by party ID of the respondent (χ2[2] = 5.7, p = .06).
Partisan differences at low knowledge (4 of 13) are essentially the same in treatment and control
group. The accuracy treatments do not significantly affect the partisan difference at this knowledge level
(βPID×Treat is not significant). The significant interaction effects of the treatment with both knowledge
components indicate that the accuracy incentives make Republicans significantly more likely to overstate
20
economic problems as knowledge increases, but that this effect begins to decline among the most
knowledgeable Republicans. The two significant three-way interactions confirm that the treatment effect
conditional on knowledge is different for Democrats, leading the most knowledgeable of them to lower their
rates of overstating economic problems. The joint significance level for βPID×Treat×Knowledge and
βPID×Treat×Knowledge2 is p=.11, suggesting that the reduction in the partisan gap through the treatment is
quadratic in knowledge. (The joint test of all three interaction terms including party ID and treatment is
significant at p=.007, confirming that the overall reduction in the partisan gap through incentives is not due to
chance.) In sum, the effect of accuracy motivation in reducing partisan differences in reports of economic
conditions is significantly greater among more knowledgeable partisans.
Figures 4a reveals partisan asymmetry in treatment effects. The average Democrat in the control
group overstates the extent of economic problems, so consistency motivation and accuracy motivation during
the survey responses push her in opposite directions. The accuracy goal would lead her to report better
conditions, but consistency pressures counteract this acknowledgement of economic reality. Figure 4a shows
that increased accuracy motivation indeed leads politically knowledgeable Democrats to give less consistent
answers. And Figure 4c, which plots the raw probabilities of answering the economic knowledge questions
correctly, shows that accuracy motivation raises the probability that knowledgeable Democrats acknowledge
unwelcome (positive) economic realities, either because they knew all along or because they are able to reduce
the impact of partisan inference rules when they are motivated to do so.
The average Republican in the control group also overstates economic problems, so for him greater
accuracy and greater consistency lead in the same direction: He would like the economy to be better, and a
more positive description of the economy would in fact be more accurate. The experimentally induced
accuracy motivation makes Republicans with medium to high general knowledge more likely to overstate
economic problems. They give answers that are both less consistent and, as Figure 4c shows, less accurate.
This result strongly suggests that, for this group, partisan bias under control group conditions emerges not
because they give consistent answers despite knowing better— after all, they are unable to give more accurate
answers even with accuracy incentives—but because they apply partisan inference rules. These inference rules
21
are not deeply ingrained, however: When motivated to do so, this group can counteract consistency
motivation and reduce reliance on partisan inferences.
Conclusion
Partisan bias in perceptions of objective economic conditions is smaller than previous research indicates. The
results of our experiments demonstrate that a portion of what scholars have treated as perceptual bias is in
fact the result of consistency pressure during the measurement of those perceptions. Even on questions
about objective conditions, partisan respondents like to have consistent views and give consistent answers to
survey questions, but, as we have shown, they can sacrifice some consistency when they are motivated to do
so. Both a monetary incentive for correct answers and an appeal to accuracy for research’s sake substantially
reduced partisan differences in reports of economic conditions. Increasing consistency motivation during the
survey also has the predicted consequences: Politicizing knowledge questions through references to the
president increased partisan differences. Put together, these experimental results show that motivated
reasoning during the survey interview leads to motivated responding.
Motivated responding resolves a puzzle that emerged in past studies of partisan perceptual bias:
Political knowledge and partisan bias appeared to be positively correlated (Shani 2006; Achen and Bartels
2006; Bartels 2008, 153-57). But why would individuals who are generally knowledgeable about politics be so
poorly informed about economic conditions? Our results show that accuracy motivation removes the
correlation between general knowledge and biased reports of economic conditions. It follows that politically
knowledgeable people do not in fact have stronger perceptual screens than less knowledgeable people. What
distinguishes more and less knowledgeable people is the stronger consistency motivation of the
knowledgeable in typical survey contexts without accuracy incentives.
Two mechanisms of motivated responding could explain our findings: Partisans are either wrong on
purpose or lazy. Partisans may access political information in memory that is more accurate but inconsistent
with their partisan predispositions and withhold it because of consistency motivation during the interview. Or
consistency motivation may prompt partisans to apply misleading partisan inference rules, when their
memory search fails to produce relevant information. If the first situation, raising accuracy motivation leads

22
partisans to report the more accurate information they otherwise withhold. In the second situation, accuracy
motivation prompts partisans to search their memory more thoroughly or apply a less partisan inference rule.
Our research design does not allow us to observe these mechanisms directly, but results suggest that both
operate. We find significant incentive effects among respondents with the highest levels of general political
knowledge. They are most likely to be informed about economic conditions, pointing to the first mechanism.
Yet, accuracy incentives also lead Republicans with medium-high levels of general knowledge to report
economic conditions that are less consistent with their partisan identity, but also less accurate. This pattern is
more easily explained by the second motivated responding mechanism.
No matter which mechanism operates, our findings indicate that, in the absence of accuracy
incentives, many partisans answer knowledge questions about economic conditions as if they are opinion
questions. Typical survey conditions thus reveal a mix of what partisans know about the economy and what
they would like to be true about it. As a result, the questions in the American National Election Studies
analyzed by Bartels (2002) and Shani (2006) overstate partisan bias in perceptions of objective conditions. It is
prudent for researchers to consider the survey response as an act of political expression when the question
touches on partisan considerations and even when it comes in response to a question about facts. Based on
our analysis we recommend the use of accuracy incentives in surveys to counteract respondents’ consistency
goals. Contamination from consistency motivation can also be avoided by removing political references from
survey questions about facts. When economic knowledge questions contained a reference to President Bush,
they generated more partisan bias in the control group which proved more resistant to accuracy incentives.
Our findings are by no means a wholesale challenge to the concept of motivated reasoning in
politics. Even our strongest treatment effects do not remove all differences between Democrats and
Republicans. And the motivated responding we document is a type of motivated reasoning, albeit a previously
underappreciated one. It is, however, necessary to distinguish motivated responding from motivated
information processing because the implications of the two are different. Motivated information processing
leads people to ignore, downplay, or dismiss arguments and information that clash with their existing beliefs
and attitudes. Motivated responding implies that partisans have, or can infer, more information that reflects
23
poorly on their party than scholars previously believed. What we do not know is how much this politically
inconvenient information affects their political judgments. It is possible that partisans engage in wishful
thinking, strategic behavior, or lazy partisanship during a survey interview, but confront their full store of
information, politically convenient or not, when they make their voting decisions.
Gerber and Huber (2009, 2010) shows that some partisan beliefs about the economy translate into
behavior. They demonstrate that in the aftermath of an election, supporters of the winning party increase
their prospective economic assessments and their intention to spend. Areas with high concentrations of
supporters of the winning candidate experience actual rises in consumption. These results imply that people’s
prospective beliefs about economic conditions depend on the party in power and are genuine enough to
influence actual consumption decisions. But the topic of our study is different. We examine perceptual bias in
retrospective assessments of economic conditions and ask if it reflects genuine beliefs or motivated
responding. Partisan differences in prospective economic assessments are not necessarily inconsistent with
rational expectations about future economic policy (see Gerber and Huber 2009, 418-420, 424). Genuine
partisan differences in beliefs about objective economic conditions, however, indicate a denial of reality that
would make rational economic behavior less likely. Gerber and Huber (2009, 418) expect that at some point
after a presidential election, “citizens learn how well their partisan-tinged beliefs about economic performance
will or will not coincide with economic realities.” It is precisely this learning process that becomes difficult if
partisan bias reaches even to perceptions of economic conditions.
Finally, even if partisans are aware of inconvenient facts, but still ignore them in their judgments, this
process is not as pernicious as misinformation. Genuine belief in false reality precludes doubt. Dismissal of
facts as irrelevant or contested, on the other hand, implies at least an initial seed of doubt and preserves the
possibility of recognizing one’s own biases. From a normative perspective, we prefer partisans who can
correct their own partisan distortions to partisans who hold on to their false beliefs even when they try to be
accurate.

Table 1: The Impact of Monetary Incentive and Accuracy Appeal on Reported Economic Conditions, by Partisanship of the Respondent
(1) (2) (3) (4) (5) (6) (7)
33% 33% Payout +/- 10% 23% 33% 33%
Pay .22* (.09)
.23* (.10)
.17* (.09)
.19* (.08)
.20* (.09)
.24* (.12)
.24+ (.13)
Accuracy Appeal .32** (.12)
.35** (.14)
Partisanship (Democrat) .65*** (.08)
.61*** (.08)
.60*** (.08)
.65*** (.08)
.79*** (.11)
Partisanship (7-point scale) .14*** (.02)
.16*** (.02)
Pay × Partisanship -.27* (.11)
-.06* (.02)
-.24* (.11)
-.25* (.11)
-.29* (.11)
-.32* (.15)
-.06* (.03)
Acc. Appeal × Partisanship -.43** (.15)
-.09** (.03)
Number of Responses 5575 5575 5575 5575 5575 4965 4965
Number of Respondents 1131 1131 1131 1131 1131 1002 1002
Log-Likelihood -5430 -5427 -5340 -5321 -5371 -5006 -5003 *** p<.001, ** p<.01, * p<.05, + p<.10 (two-tailed)
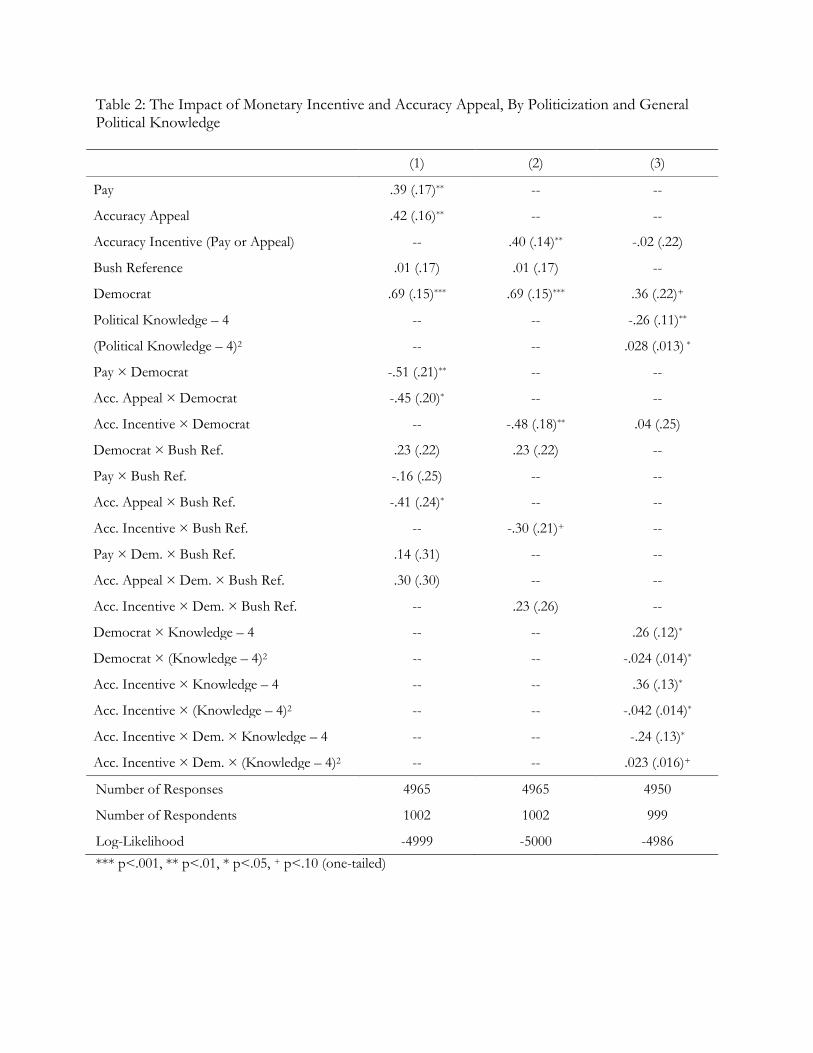
Table 2: The Impact of Monetary Incentive and Accuracy Appeal, By Politicization and General Political Knowledge
(1) (2) (3)
Pay .39 (.17)** -- --
Accuracy Appeal .42 (.16)** -- --
Accuracy Incentive (Pay or Appeal) -- .40 (.14)** -.02 (.22)
Bush Reference .01 (.17) .01 (.17) --
Democrat .69 (.15)*** .69 (.15)*** .36 (.22)+
Political Knowledge – 4 -- -- -.26 (.11)**
(Political Knowledge – 4)2 -- -- .028 (.013) *
Pay × Democrat -.51 (.21)** -- --
Acc. Appeal × Democrat -.45 (.20)* -- --
Acc. Incentive × Democrat -- -.48 (.18)** .04 (.25)
Democrat × Bush Ref. .23 (.22) .23 (.22) --
Pay × Bush Ref. -.16 (.25) -- --
Acc. Appeal × Bush Ref. -.41 (.24)* -- --
Acc. Incentive × Bush Ref. -- -.30 (.21)+ --
Pay × Dem. × Bush Ref. .14 (.31) -- --
Acc. Appeal × Dem. × Bush Ref. .30 (.30) -- --
Acc. Incentive × Dem. × Bush Ref. -- .23 (.26) --
Democrat × Knowledge – 4 -- -- .26 (.12)*
Democrat × (Knowledge – 4)2 -- -- -.024 (.014)*
Acc. Incentive × Knowledge – 4 -- -- .36 (.13)*
Acc. Incentive × (Knowledge – 4)2 -- -- -.042 (.014)*
Acc. Incentive × Dem. × Knowledge – 4 -- -- -.24 (.13)*
Acc. Incentive × Dem. × (Knowledge – 4)2 -- -- .023 (.016)+
Number of Responses 4965 4965 4950
Number of Respondents 1002 1002 999
Log-Likelihood -4999 -5000 -4986 *** p<.001, ** p<.01, * p<.05, + p<.10 (one-tailed)
26
Figure 1: Predicted Values from Table 1, Model 1

27
Figure 2: Predicted Values from Table 1, Model 6
28
Figure 3: The Impact of Politicization on Treatment Effects (Predicted Values from Table 2)
a) Accuracy & Consistency (Bush Reference)
b) Accuracy Only (No Bush Reference)
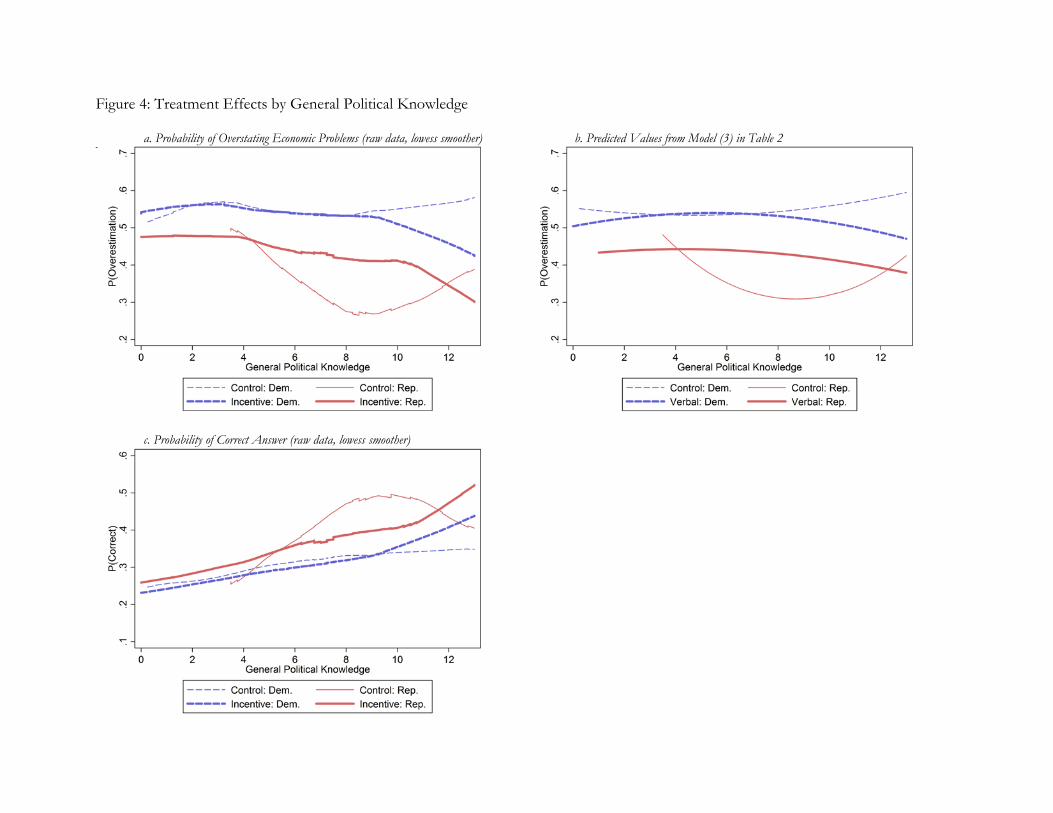
Figure 4: Treatment Effects by General Political Knowledge
a. Probability of Overstating Economic Problems (raw data, lowess smoother) b. Predicted Values from Model (3) in Table 2 cgs fds
c. Probability of Correct Answer (raw data, lowess smoother)
Appendix A
Survey Instructions for Knowledge Questions
In the 2004 study, respondents saw this common introduction:
In the next part of this study, you will be asked 14 questions about politics, public policy, and economics. Many people don't know the answers to these questions, but it is helpful for us if you answer, even if you're not sure what the correct answer is. We encourage you to take a guess on every question. At the end of this study, you will see a summary of how many questions you answered correctly.
In this paper, we only use the five questions about economic conditions. The common introduction in 2008
was similar:
In the next part of the study, you will be asked five questions about how well the economy is doing. You will have 45 seconds to answer each question. If you are not entirely sure which answer is correct, please mark your best guess.
In the 2004 study, respondents in the pay conditions then received the following instructions:
We will pay you for answering questions correctly. You will earn 1,000 bonus points ($1) for every correct answer you give. So, if you answer 3 of the 14 questions correctly, you will earn 3,000 bonus points ($3). If you answer 7 of the 14 questions correctly, you will earn 7,000 bonus points ($7). The more questions you answer correctly, the more you will earn.
31
Table A1: Economic Knowledge Questions Question ID Question wording Response options (Correct response in bold)
Unemployment rate, 2004
The U.S. Bureau of Labor Statistics counts a person as unemployed if they are not employed at any job and are looking for work. By this definition, what percentage of Americans was unemployed in August of 2004?
• around 11 percent • around 9 percent • around 7 percent • around 5 percent • around 3 percent
Unemployment rate, 2008
The U.S. Bureau of Labor Statistics counts a person as unemployed if the person is not employed at any job and is looking for work. By this definition, 4.7 percent of Americans were unemployed in 2001 [at the beginning of President Bush's first term in office]. What percentage of Americans are currently unemployed?
open-ended, correct: 4.8
Uninsured Americans, 2004
In August 2004, the United States Census Bureau reported an estimate of the number of Americans without health insurance. The Census Bureau classified people as uninsured if they were not covered by any type of health insurance at any time in 2003. By this definition, what percentage of Americans did not have health insurance in 2003?
open-ended, correct: 15.6
Uninsured Americans, 2008
Each year, the United States Census Bureau reports an estimate of the number of Americans without health insurance. The Census Bureau classifies people as uninsured if they were not covered by any type of health insurance at any time during the year. By this definition, 14.1 percent of Americans did not have health insurance in 2001[, the year President Bush took office]. According to the latest estimate (for 2006), what percentage of Americans do not have health insurance?
open-ended, correct: 15.8
32
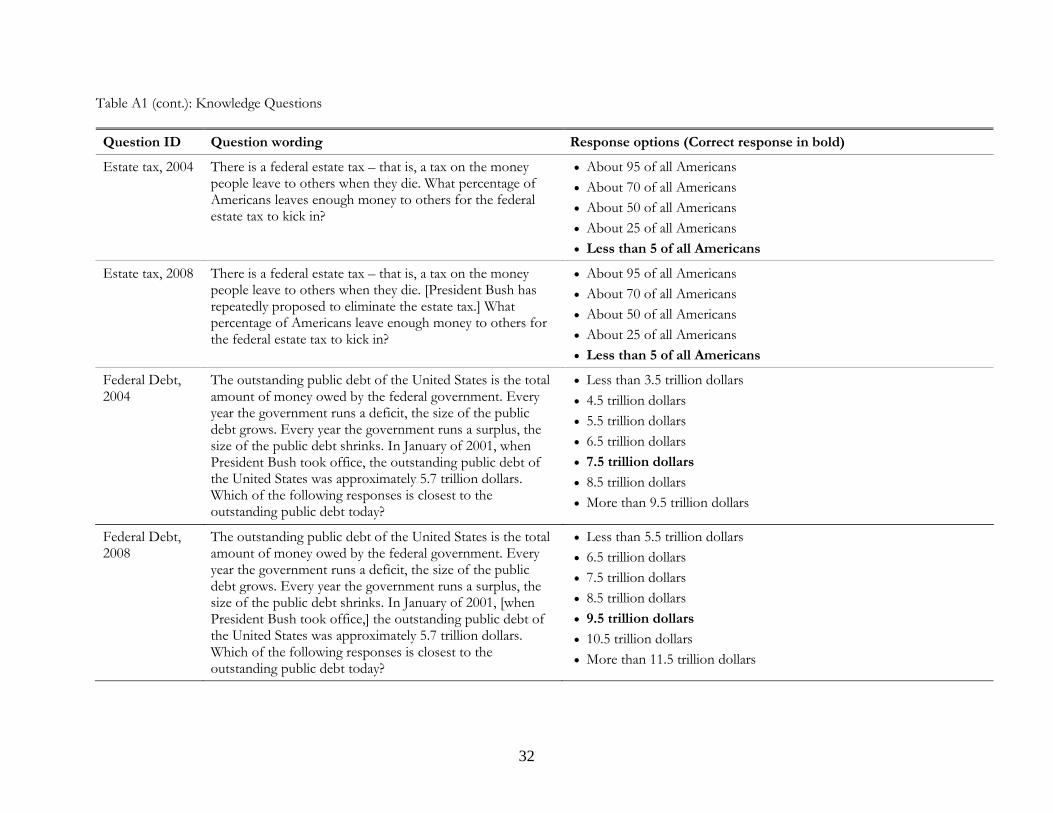
Table A1 (cont.): Knowledge Questions Question ID Question wording Response options (Correct response in bold)
Estate tax, 2004 There is a federal estate tax – that is, a tax on the money people leave to others when they die. What percentage of Americans leaves enough money to others for the federal estate tax to kick in?
• About 95 of all Americans • About 70 of all Americans • About 50 of all Americans • About 25 of all Americans • Less than 5 of all Americans
Estate tax, 2008 There is a federal estate tax – that is, a tax on the money people leave to others when they die. [President Bush has repeatedly proposed to eliminate the estate tax.] What percentage of Americans leave enough money to others for the federal estate tax to kick in?
• About 95 of all Americans • About 70 of all Americans • About 50 of all Americans • About 25 of all Americans • Less than 5 of all Americans
Federal Debt, 2004
The outstanding public debt of the United States is the total amount of money owed by the federal government. Every year the government runs a deficit, the size of the public debt grows. Every year the government runs a surplus, the size of the public debt shrinks. In January of 2001, when President Bush took office, the outstanding public debt of the United States was approximately 5.7 trillion dollars. Which of the following responses is closest to the outstanding public debt today?
• Less than 3.5 trillion dollars • 4.5 trillion dollars • 5.5 trillion dollars • 6.5 trillion dollars • 7.5 trillion dollars • 8.5 trillion dollars • More than 9.5 trillion dollars
Federal Debt, 2008
The outstanding public debt of the United States is the total amount of money owed by the federal government. Every year the government runs a deficit, the size of the public debt grows. Every year the government runs a surplus, the size of the public debt shrinks. In January of 2001, [when President Bush took office,] the outstanding public debt of the United States was approximately 5.7 trillion dollars. Which of the following responses is closest to the outstanding public debt today?
• Less than 5.5 trillion dollars • 6.5 trillion dollars • 7.5 trillion dollars • 8.5 trillion dollars • 9.5 trillion dollars • 10.5 trillion dollars • More than 11.5 trillion dollars

33
Table A1 (cont.): Knowledge Questions Question ID Question wording Response options (Correct response in bold)
Poverty rate, 2004
In August 2004, the Census Bureau reported how many Americans live in poverty. The poverty threshold depends on the size of the household. For example, a person under age 65 is considered to live in poverty if his or her 2003 income was below $9,573 and a family of four is considered to live in poverty if its 2003 income was below $18,810. By this definition, what percentage of Americans lived in poverty in 2003?
open-ended, correct 12.5
Gas price, 2008 According to the American Automobile Association (AAA), the national average price for a gallon of regular gasoline was $1.49 in January 2001 [at the beginning of George W. Bush's presidency in January 2001]. What is the current national average price for a gallon of regular gasoline?
open-ended, correct $3.27 (average during field period)
Note: For 2008 items, phrases in parentheses were randomly shown for half the sample.
34
Table A2: General Political Knowledge Questions (Study 2) Question wording Response options (Correct response in bold)
Who is the current secretary of defense? Donald Rumsfeld, John Ashcroft, Robert Gates, Colin Powell
Who is the current Speaker of the U.S. House of Representatives?
Nancy Pelosi, Dana Perino, Barbara Boxer, Elizabeth Edwards
Who is the Chief Justice on the U.S. Supreme Court? William Rehnquist, John Roberts, Antonin Scalia, Samuel Alito
Who is the President of Iran? Mahmoud Ahmadinejad, Nouri al-Maliki, Hamid Karzai, Pervez Musharraf
What office is currently held by Condoleezza (“Condi”) Rice?
Director of the Central Intelligence Agency, National Security Adviser, Secretary of State, White House Chief of Staff
What position is currently held by Ben Bernanke? Treasury Secretary, Chairman of the Federal Reserve, Secretary of Homeland Security, Chairman of the National Economic Council
What position is currently held by Michael Mukasey? U.S. Attorney General, President’s General Counsel, Senate Majority Leader, Supreme Court Justice
What position is currently held by Nicolas Sarkozy? President of France, Foreign Minister of the European Union (EU), Prime Minister of Turkey, UN Secretary General
For each of the following politicians, please indicate to which party they belong (Republican, Democrat, Green Party, Reform Party):
Bill Richardson, Fred Thompson, Mike Huckabee, Ron Paul
Of the 100 members of the U.S. Senate, how many are members of the Democratic [Republican] party?
51 [49]
Note: As part of an independent study, the first twelve questions randomly varied whether names, faces, or names and faces were shown. The design was balanced so that all respondents answered some questions in all three modalities. The randomization was orthogonal to the randomization for this study.

35
Appendix B Table B1. Robustness of Column (6), Table 1 to Different Completion Time Cutoffs
(1) (2) (3) (4)
All < 60 seconds
< 45 seconds
< 40 seconds
< 30 seconds
Pay .24* (.12)
.29* (.13)
.29* (.13)
.29* (.13)
.41** (.15)
Accuracy Appeal .32** (.12)
.20* (.12)
.22+ (.13)
.29 (.13)
.17 (.14)
Partisanship (Democrat)
.79*** (.11)
.79*** (.11)
.82*** (.12)
.82*** (.12)
.65*** (.13)
Pay × Partisanship -.32* (.15)
-.39* (.16)
-.42* (.17)
-.47** (.17)
-.48* (.20)
Acc. Appeal × Partisanship
-.43** (.15)
-.27+ (.15)
-.34* (.16)
-.29+ (.16)
-.22 (.19)
Number of Responses 4965 4660 4245 3896 2865
Number of Respondents 1002 999 993 981 864
Log-Likelihood -5006 -4669 -4252 3899 -2843 Note – *** p<.001, ** p<.01, * p<.05, + p<.10 (two-tailed)
36
Appendix C The proportional odds model assumes that intercepts depend on the category, but slopes are equal across
categories. Relaxing this assumption by letting the slopes vary transforms the ordered logistic model into a
multinomial logistic model. Keeping the same notation,
𝑙𝑜𝑔 �𝑃𝑟�𝑦𝑖𝑗𝑠 ≤ 𝑐�
1 − 𝑃𝑟�𝑦𝑖𝑗𝑠 ≤ 𝑐�� = 𝜅𝑐 − [𝑋𝑖𝛽𝑐 + 𝛼𝑖 + 𝛿𝑠]
The table below shows results for the multinomial logistic model for column (1) in Table 1. Results below
indicate that both the main effect of partisanship and the reduction in this effect through incentives are
stronger for the comparison between “less than” and “greater than” (b = -.45) than between “less than” and
“correct” (b = -.26). Importantly, the sign on both coefficients is negative, indicating that the proportional
odds assumption does not lead us astray. It is not the case that the difference between Republicans and
Democrats increases between one set of categories but contracts between another.
Correct+ Greater Than
Pay .18 (.13)
.35 (.13)
Partisanship (Democrat) .21+ (.12)
.82*** (.12)
Pay × Partisanship -.26 (.17)
-.45* (.17)
Number of Responses 5575
Number of Respondents 1131
Log-Likelihood -5412 Note – *** p<.001, ** p<.01, * p<.05, + p<.10 (two-tailed)
+ Base category is ‘Less Than Correct’.
37
References
Achen, Christopher H., and Larry M. Bartels. 2006. It Feels Like We're Thinking: The Rationalizing Voter and Electoral Democracy. Paper presented at the Annual Meeting of the American Political Science Association, Philadelphia.
Albert, Paul S., and Dean A. Follmann. 2004. "Modeling Repeated Count Data Subject to Informative Dropout." Biometrics 56(3): 667-677.
Ansolabehere, Stephen, Marc Meredith, and Erik Snowberg. 2011. "Mecro-Economic Voting: Local Information and Micro-Perceptions of the Macro-Economy." Unpublished manuscript.
Ansolabehere, Stephen, Marc Meredith, and Erik Snowberg. 2013. "Asking About Numbers: Why and How." Political Analysis 21(1): 48-69.
Bartels, Larry M. 2002. "Beyond the Running Tally: Partisan Bias in Political Perceptions." Political Behavior 24(2): 117-150.
Bartels, Larry M. 2008. Unequal Democracy: The Political Economy of the New Gilded Age. Princeton: Princeton University Press.
Bennett, Stephen Earl. 1995. "Americans' Knowledge of Ideology, 1980-1992." American Politics Quarterly 23(3): 259-278.
Berkey, Catherine S., David C. Hoaglin, Frederick Mosteller, and Graham A. Colditz. 2007. " A Random-Effects Regression Model for Meta-Analysis." Statistics in Medicine 14(4): 395-411.
Brady, Henry E., and Paul M. Sniderman. 1985. "Attitude Attribution: A Group Basis for Political Reasoning." American Political Science Review 79(4): 1061-1078.
Bullock, John G. 2006. "Partisanship and the Enduring Effects of False Political Information." Unpublished Manuscript.
Campbell, Angus, Philip Converse, Warren E. Miller, and Donald Stokes. 1960. The American Voter. New York,: Wiley.
Chaiken, Shelly, Roger Giner-Sorolla, and Serena Chen. 1996. "Beyond Accuracy: Defense and Impression Motives in Heuristic and Systematic Processing." In The Psychology of Action: Linking Motivation and Cognition to Behavior, edited by Peter M. Gollwitzer and John A. Bargh (pp. 553-578). New York: Guilford.
Conover, Pamela J., Stanley Feldman, and Kathleen Knight. 1986. "Judging Inflation and Unemployment - the Origins of Retrospective Evaluations." Journal of Politics 48(3): 565-588.
Delli Carpini, Michael X., and Scott Keeter. 1996. What Americans Know About Politics and Why It Matters. New Haven [Conn.]: Yale University Press.
Festinger, Leon. 1957. A Theory of Cognitive Dissonance. Stanford: Stanford University Press.
Fiorina, Morris P. 1981. Retrospetive Voting in American National Elections. New Haven: Yale University Press.
38
Gerber, Alan S., and Gregory A. Huber. 2009. "Partisanship and Economic Behavior: Do Partisan Differences in Economic Forecasts Predict Real Economic Behavior?" American Political Science Review 103(3): 407-426.
Gerber, Alan S., and Gregory A. Huber. 2010. "Partisanship, Political Control, and Economic Assessments." American Journal of Political Science 54(1): 153-173.
Hochschild, Jennifer L. 2001. "Where You Stand Depends on What You See: Connections among Values, Perceptions of Fact, and Political Prescriptions." In Citizens and Politics: Perspectives from Political Psychology, edited by James H. Kuklinski (pp. 313-340). New York: Cambridge University Press.
Holbrook, Thomas, and James C. Garand. 1996. "Home Economus? Economic Information and Economic Voting." Political Research Quarterly 49(2): 351-375.
Iyengar, Shanto, and Kyu S. Hahn. 2009. "Red Media, Blue Media: Evidence of Ideological Selectivity in Media Use." Journal of Communication 59(1): 19-39.
Iyengar, Shanto, Simon Jackman, Solomon Messing, Nicholas Valentino, Toril Aalberg, Ray Duch, Kyu Hahn, Allison Harrell, Stuart Soroka, and Tetsuro Kobayashi. Forthcoming. "Do Attitudes About Immigration Predict Willingness to Admit Individual Immigrants? A Cross-National Test of the Person-Positivity Bias." Public Opinion Quarterly.
Jerit, Jennifer, and Jason Barabas. 2012. "Partisan Perceptual Bias and the Information Environment." Journal of Politics 74(3): 672-684.
Kruglanski, Arie. 1990. "Lay Epistemic Theory in Social-Cognitive Psychology." Psychological Inquiry 1(3): 181-197.
Kruglanski, Arie W. 1996. "Motivated Social Cognition: Principles of the Interface." In Social Psychology: Handbook of Basic Principles, edited by E. Tory Higgins and Arie W. Kruglanski (pp. 493-520). New York: Guilford Press.
Kuklinski, James H., Paul J. Quirk, Jennifer Jerit, David Schwieder, and Robert F. Rich. 2000. "Misinformation and the Currency of Democratic Citizenship." Journal of Politics 62(3): 790-816.
Kunda , Ziva. 1990. "The Case for Motivated Reasoning." Psychological Bulletin 108(3): 480-498.
Lesaffre, Emmanuel, and Bart Spiessens. 2001. " On the Effect of the Number of Quadrature Points in a Logistic Random Effects Model: An Example." Journal of the Royal Statistical Society: Series C (Applied Statistics) 50(3): 325-335.
Lodge, Milton, and Ruth Hamill. 1986. "A Partisan Schema for Political Information Processing." American Political Science Review 80(2): 505-520.
Lodge, Milton, and Charles Taber. 2000. "Three Steps toward a Theory of Motivated Political Reasoning." In Elements of Reason: Cognition, Choice, and the Bounds of Rationality, edited by Arthur Lupia, Mathew D. McCubbins and Samuel L. Popkin (pp. 183-213). Cambridge ; New York: Cambridge University Press.
Miller, Melissa K., and Shannon K. Orr. 2008. "Experimenting with a "Third Way" in Political Knowledge Estimation." Public Opinion Quarterly 72(4): 768-780.

39
Mondak, Jeffery J., and Belinda Creel Davis. 2001. "Asked and Answered: Knowledge Levels When We Will Not Take 'Don't Know' for an Answer." Political Behavior 23(3): 199-224.
Naylor, John C., and Adrian F. M. Smith. 1982. "Applications of a Method for the Efficient Computation of Posterior Distributions." Applied Statistics 31: 214-225.
Nir, Lilach. 2011. "Motivated Reasoning and Public Opinion Perception." Public Opinion Quarterly 75(3): 504-532.
Nyhan, Brendan, and Jason Reifler. 2010. "When Corrections Fail: The Persistence of Political Misperceptions." Political Behavior 32(2): 303-330.
Rabe-Hesketh, Sophia, Anders Skrondal, and Andrew Pickles. 2002. " Reliable Estimation of Generalized Linear Mixed Models Using Adaptive Quadrature." The Stata Journal 2(1): 1-21.
Rabe-Hesketh, Sophia, Anders Skrondal, and Andrew Pickles. 2004. Gllamm Manual. London: Tech. Rep. 2001/01, Department of Biostatistics and Computing, Institute of Psychiatry, King’s College, University of London.
Rabe-Hesketh, Sophia, Anders Skrondal, and Andrew Pickles. 2005. "Maximum Likelihood Estimation of Limited and Discrete Dependent Variable Models with Nested Random Effects." Journal of Econometrics 128(2): 301-323.
Rabe-Hesketh, Sophia, Anders Skrondal, and Andrew Pickles. 2004. "Generalized Multilevel Structural Equation Modeling." Psychometrika 69(2): 167-190.
Rahn, Wendy M. 1993. "The Role of Partisan Stereotyping in Information Processing About Political Candidates." American Journal of Political Science 37(2): 472-496.
Redlawsk, David. 2002. "Hot Cognition or Cool Consideration? Testing the Effects of Motivated Reasoning on Political Decision Making." Journal of Politics 64(4): 1021-1044.
Shani, Danielle. 2006. Knowing Your Colors: Can Knowledge Correct for Partisan Bias in Political Perceptions? Paper presented at the annual meeting of the Midwest Political Science Association, Chicago.
Stegmueller, Daniel, Peer Scheepers, Sigrid Roßteutscher, and Eelke de Jong. 2012. "Support for Redistribution in Western Europe: Assessing the Role of Religion." European Socioligal Review 28(4): 482-497.
Stroud, Natalie Jomini. 2011. Niche News: The Politics of News Choice. New York: Oxford University Press.
Taber, Charles S., and Milton Lodge. 2006. "Motivated Skepticism in the Evaluation of Political Beliefs." American Journal of Political Science 50(3): 755-769.
Zaller, John. 1992. The Nature and Origins of Mass Opinion. New York: Cambridge University Press.