yoon thesis - university of canterbury
TRANSCRIPT

INVESTIGATIONS OF A TWO-STEP PROCESS FOR POTATO (Solanum tuberosum L.) MICROTUBER
PRODUCTION
A thesis submitted in fulfilment of the requirements for the degree of Doctor of Philosophy in Plant Biotechnology at the University of Canterbury.
Yoon, Kab Seog 2000

~ J l'r , \
THE LORD is my sheperd, I shall not be in want. He makes me lie in green pastures, He leads me quiet waters. He restores my soul; He guides me in paths of righteousness for His name's sake. Even though I walk through the valley of the shadow of death, I will fear no evil, for You are with me; Your rod and staff, they comfort me. You prepare a table before me in the presence of my enemies. You anoint my head with oil; My cup overflows. Surely goodness and love will follow me all the day of my life, and I will dwell in the house of the LORD forever. (PSALM 23: 1-6)
26 JUL zoao
ii

iii
ABSTRACT
Standard protocols for potato plantlet multiplication from nodal explants and for subsequent microtuberization were established. Liquid Murashige and Skoog (1962) basal media containing 3% (w/v) or 8% (w/v) sucrose without any exogenous plant growth regulators were used for plantlet multiplication or microtuberization respectively. More than 20 variations to the standard protocols, either during the plantlet multiplication step or the microtuberization step were investigated in relation to plantlet growth, microtuber number, average fresh microtuber weight and microtuber weight distribution. The responses of two potato cultivars ('Iwa' and 'Daeji') were compared. Time courses of some major changes in the media were also studied. Initially, it was found that sucrose disappearance from the standard microtuberization medium, microtuber initiation, development and cessation of further growth, invertase activity development in the medium, osmotic potential changes and pH changes in the medium appeared to be correlative events. However, the data from the different experiments in this study indicate that most of these changes are associated with the 8% sucrose medium but are not strictly related to microtuberization. Among the 21 variations to the standard protocols, whether during plantlet multiplication or during in vitro tuberization, medium replacement was most effective in inducing the formation of bigger and more microtubers.
In the course of this study, it was observed that at the end of the plantlet multiplication step the root had turned green. Even more interesting is that some of these green roots remained green after 10 weeks in darkness for the microtuberization step. A small-scale ultrastructural study confirms the occurrence of chloroplasts in the green roots during plantlet growth and also at the end of the microtuberization step in the dark.

ACKNOWLEDGEMENTS
I would like to thank Dr. David Leung for his endless supervision of this project. He always advised me when I felt my lackness ofbioscientific knowledge, encouraged me when I was depressed of my living life and was joked me when I was sad because of my progress delayed.
iv
Thank to Dr. Moon in Korea Institute of Machinery and Metals (KIlVlM) for his continued support over the distance. Dr. Yang in Korea Ginseng and Tobacco Research Institute, Dr. Joung in Korea Research Institute of Bioscience and Biotechnology, Dr. Seo in Chunnam National University and Dr. Bang in Iri National College of Agricultural Technology for their supports and discussions for potato microtubers commercialization were also appreciated.
My thanks to the staffs of the Plant and Microbial Science Department who have assisted me in various ways over the years, particularly Manfred for his TEM and Dougal and Matt for photograph, and technical assistances from Nicole and Vicki are gratefully acknowledged.
To all students, past and present in plant biotechnology laboratory, I am very grateful for your frendship and support, Kitti, Patalee, Martin, Simon, Suzan, Jason, Angela, Sincia. Visiting researchers Dr. Huh from Chunbuk National University and Dr. Eom from Kookmin University were also appreciated.
A very special thank to my family, particularly my wife Hee Je for continued support, encouragement and patience over my education and my whole life, and my son, Sang Chul and my daughter, Hye Mee, for their encouragement and support in domestic works.
Thank to my parents for their speechless support and long waiting and my brothers and sisters, Bo Hyun, Hyun Chul, Duk Hee and Myung Suk and also their families.

v
LIST OF CONTENTS
j\]JS1r~~1r --------------------------------------------------------------------------iii j\~~()~~~I)(;~rvI~~1rS -------------------------------------------------------iv ~IS 1r () F ~() ~1r~~1rS --------------------------------------------------------------v ~IS1r () F FI (; IJRES -----------------------------------------------------------------x ~IS1r ()F 1r j\]J~~S ----------------------------------------------------------------xiv ~IS1r ()F P~j\ 1r~S -----------------------------------------------------------------xv
I. ~iterature Review, j\im and Scope of this Research -----------------------1 1. J>otato -----------------------------------------------------------------------------------------------1 1.1 J>roduction of J>otato ----------------------------------------------------------------------------1 1.2 Diseases of J>otato -------------------------------------------------------------------------------2 1.3 Seed potato system ------------------------------------------------------------------------------3 2. Micropropagation ---------------------------------------------------------------------------------4 2.1 In vitro potato culture techniques -------------------------------------------------------------4 2.1.1 Meristem, shoot-tip, and segment cultures ------------------------------------------------5 2.1.2 In vitro potato mass propagation ------------------------------------------------------------6 2.1.2.1 Multimeristem culture for micropropagation -------------------------------------------7 2.1.2.2 In vitro shoot layering ----------------------------------------------------------------------7 3. Development of in vitro potato microtuberization -------------------------------------------8 3.1 Use of in vitro tubers --------------------------------------------------------------------------- 9 3.2 Factors affecting in vitro potato microtuberization ---------------------------------------11 3.2.1 Effect of phytohormonal growth inhibitors and growth retardants -------------------12 3.2.1.1 coumarins -----------------------------------------------------------------------------------12 3.2.1.2 ChI oro choline chloride (CCC) --------------'---------------------------------------------14 3.2.1.3 Abscisic acid (ABA) ----------------------------------------------------------------------14 3.2.1.4 Effect of TIBA (2,3,5-triiodobenzoic acid) --------------------------------------------15 3.2.2 Effect of growth promotors -----------------------------------------------------------------15 3.2.2.1 Cytokinin -----------------------------------------------------------------------------------15 3.2.2.2 2,4-D ----------------------------------------------------------------------------------------17 3.2.2.3 Gibberellins --------------------------------------------------------------------------------17 3.2.3 Environmental and other factors -----------------------------------------------------------18 3.2.3.1 Ethylene -------------------------------------------------------------------------------------18 3.2.3.2 Carbon dioxide -----------------------------------------------------------------------------19 3.2.3.3 Nitro gen -------------------------------------------------------------------------------------2 0 3.2.3.4 Mineral ions --------------------------------------------------------------------------------20 3.2.3.5 Activated charcoal in medium -----------------------------------------------------------21 3.2.4 Effect of growth conditions ----------------------------------------------------------------21 3.2.4.1 J>hotoperiod and light quality ------------------------------------------------------------21 3.2.4. 2 Temperature --------------------------------------------------------------------------------23 3.2.4.3 Carbon sources and osmotic control----------------------------------------------------24 3.2.4.4 Liquid medi urn -----------------------------------------------------------------------------2 6 4. Invertase activity ---------------------------------------------------------------------------------27
vi
5. Maltose as a carbon source in liquid medium ----------------------------------------------29 6. Genotypic differences --------------------------------------------------------------------------32 7. Aim and Scope of this Research --------------------------------------------------------------34
II. MATERIALS & METHODS ------------------------------------------------36 1. Stock culture and propagation of plant materials -------------------------------------------36 2. Systems for microtuberization -----------------------------------------------------------------36 2 .1 Bubbling jar culture ---------------------------------------------------------- -----------------36 2.2 Shaking flask culture --------------------------------------------------------------------------36 2.3 Solid-liquid binary culture --------------------------------------------------------------------37 2.4 Slanting jar culture and depth control (stationary culture) -------------------------------37 3. Plant multiplication: basal or standard protocol ---------------------------------------------37 4. Changes during plantlet multiplication -------------------------------------------------------38 5. Variations to the standard multiplication protocol ------------------------------------------38 5.1 Different carbohydrate treatments -----------------------------------------------------------38 5.2 Replacement of the standard multiplication medium -------------------------------------38 6. Microtuberization: basal or standard protocol -----------------------------------------------39 6.1 time course of microtuber initiation and growth ------------------------------------------39 7. Variations to the standard in vitro tuberization protocol-----------------------------------39 7.1 Varying concentration of sucrose in the tuberization medium --------------------------39 7.2 Retaining old multiplication medium on tuberization ------------------------------------39 7.3 pH treatments on tuberization ----------------------------------------------------------------39 7.4 Replacing microtuberization medium -------------------------------------------------------40 7.5 Osmotically equivalent media ----------------------------------------------------------------40 7.6 Media with initial carbon content equivalent to that of the 8% sucrose solution ---------
----------------------------------------------------------------------------------------------------41 7.7 Medium containing maltose ---------------------:---------------------------------------------41 8. Paper chromatography and HPLC analysis of sugars --------------------------------------41 9. Preparation of invertase and soluble protein from culture media -------------------------42 10. Partial purification of invertase ---------------------------------------------------------------43 11. Extraction of crude invertase from potato plantlet tissues --------------------------------43 12. Invertase assay ----------------------------------------------------------------------------------4 3 13 . Amylase assay -----------------------------------------------------------------------------------44 14. Phosphatase assay ------------------------------------------------------------------------------44 15. Protein quantification --------------------------------------------------------------------------44 16. SDS-P AGE --------------------------------------------------------------------------------------45 17. Non-denaturing PAGE and IEF ---------------------------------------------------------------45 18. Cytochemical methods for localizing invertase activity in gel ---------------------------46 18.1 Preparation of [Ag(NH3)2r solution method - electrophoresis -------------------------46 18.3 The use of glucose oxidase, peroxidase and 3,3' -diaminobenzidine (D.A.B.) for
detection of invertase activity following gel electrophoresis ---------------------------46 19. Ultrastructural analysis ------------------------------------------------------------------------4 7
20. Osmotic potential measurements -------------------------------------------------------------48 21. Mineral analysis ---------------------------------------------------------------------------------48 22. Data analysis -------------------------------------------------------------------------------------48

vii
III. RESUL TS -----------------------------------------------------------------------49 A. Preliminary trials with different potato microtuberization systems -49 B. Main Experiments --------------------------------------------------------------54 1. Effect of manipulation of tuberization medium on microtuberization --
---------------------------------------------------------------------------------------54 1.1 Standard Protocol -----~------------------------------------------------------------------------54 1.1.1 Time course of microtuber development -------------------------------------------------54 1.1.2 Carbohydrate changes in the standard tuberization medium --------------------------54 1.1.3 Invertase activity in the standard tuberization medium --------------------------------54 1.1.3.1 Preparation of invertase from the medium --------------------------------------------54 1.1.3.2 Optimum pH of invertase activity ------------------------------------------------------60 1.1.3.3 Change of invertase activity in the medium during tuberization -------------------60 1.1.3.4 Presence of invertase in parts of stems and roots that were submerged in liquid
medium -------------------------------------------------------------------------------------60 1.1.3.5 Invertase isozymes ------------------------------------------------------------------------60 1.1.3.6 Changes in soluble protein content during tuberization -----------------------------64 1.1.4 SDS-PAGE of proteins in the standard tuberization medium -------------------------64 1.1.5 pH changes in the tuberization medium --------------------------------------------------64 1.1.6 Osmotic potential change in the standard tuberization medium ----------------------64 1.1.7 Time course of mineral changes in the standard tuberization medium --------------69 1.2 Effects of varying the concentration of sucrose in the tuberization medium ----------69 1.2.1 Effect on microtuber formation ------------------------------------------------------------73 1.2.2 Effect on soluble protein contents oftuberization media ------------------------------73 1.3 Effect of different carbohydrates in the tuberization medium on tuberization --------73 1.3.1 The initial osmolality of media containing different carbohydrates was equivalent
to that of 8% sucrose (i.e the standard tuberization medium) --------------------------73 1.3.1.1 Microtuber formation ---------------------------------------------------------------------73 1.3.1.2 Osmotic potential changes of the different monosaccharide-containing media
during microtuberization ---------------------------------------------------------------------79 1.3.1.3 pH of the media changed during microtuber formation -----------------------------88 1.3.2 The effect of monosaccharide-containing media with carbon content that was
initially equivalent to that of 8% sucrose --------------------------------------------------88 1.3.2.1 Microtuber formation ---------------------------------------------------------------------88 1.3.2.2 Osmotic potential changes in the different microtuberization media used in 1.3.2-
----------------------------------------------------------------------------------------------------92 1.3.2.3 pH changes of the media used in 1.3.2 changed during microtuberization -------99 1.3.3 Substitution of sucrose with maltose -----------------------------------------------------99 1.3.3.1 Effect on microtuberization --------------------------------------------------------------99 1.3.3.2 Osmotic potential changes of the 8% maltose medium ----------------------------104 1.3.3.3 Time course of pH changes in the 8% maltose medium ---------------------------104 1.4 Effect of initial pH of tuberization medium ----------------------------------------------104 1.5 Effect of old multiplication medium mixed with tuberization medium --------------109 1.6 Effect of periodic refreshing of the standard tuberization medium -------------------119

viii
2. Manipulations during multiplication phase: effects on the during multi p I i ca ti 0 n ----------------------------------------------------------------------12 7
2.1 Standard plantlet multiplication medium containing 3 % sucrose ---------------------127 2.1.1 Plantlet development ----------------------------------------------------------------------12 7 2.1.2 Changes in the medium during potato development ----------------------------------127 2.1.2.1 Soluble proteins --------------------------------------------------------------------------127 2.1.2.2 Carbohydrates ----------------------------------------------------------------------------127 2.1.2.3 Invertase activity in the medium ------------------------------------------------------127 2.1.2.4 Change in the pH of the multiplication medium ------------------------------------134 2.1.2.5 Osmotic potential ------------------------------------------------------------------------134 2.2 Effects of variations to the standard multiplication medium ---------------------------134 2.2.1 Different carbohydrate media for plantlet multiplication ----------------------------134 2.2.1.1 Comparison of plantlet weights -------------------------------------------------------134 2.2.1.2 Time course of soluble protein changes in different carbohydrate media ('Iwa') --
--------------------------------------------------------------------------------------------------143 2.2.1.3 Time course of carbohydrate changes ------------------------------------------------143 2.2.2 Effect of replacing medium during multiplication on growth of plant lets --------143 2.2.3 Effect of manipulations during multiplication phase on microtuberization -------148 2.2.3.1 Influence of carbohydrates in multiplication media on microtuberization under
standard conditions --------------------------------------------------------------------------148 2.2.3.2 Effect of replacing treatment during multiplication on microtuberization ------154
3. Ultrastructural 0 bservations -----------------------------------------------159 3.1 Stem and leaf of in vitro potato plantlets (,Iwa') grown in liquid medium ----------159 3.2 Stem and leaf tissues submerged in liquid medium at the end of the standard
multiplication step ('I wa') ------------------------------------------------------------------159 3.3.1 Stem and leaf tissues after microtuberization in liquid medium in the dark ------168 3.3.2 Green roots in liquid tuberization medium ---------------------------------------------168 3.3.3 Microtubers in liquid medium -----------------------------------------------------------173 3.3.4 Floating cells in tuberization medium --------------------------------------------------173
IV. D ISCUSSI ON -----------------------------------------------------------------178 1. Is sucrose superior to glucose or fructose for potato microtuberization? --------------178 2. Can another disaccharide replace sucrose in the standard tuberization medium? ----179 3. Invertase activity in culture medium --------------------------------------------------------180 4. Relationship between osmotic potential changes in culture media and
microtuberization and plant multiplication ------------------------------------------------183 5. Correlation between time course of carbohydrate changes and that of microtuber
growth and plantlet growth -----------------------------------------------------------------184 6. Possible interaction between carbohydrate levels in tuberization medium and
gibberellin levels in stolon tips -------------------------------------------------------------185 7. Effect of medium-replacing treatments -----------------------------------------------------186 8. Effect of sucrose concentrations and the Varying pH in the media on microtuberization
-----------------------------------------------------------------------------------------------------187 9. Ultrastructural studies -------------------------------------------------------------------------189

ix
V. FUTURE S TUD IES-----------------------------------------------------------191
VI. CON CL USI ON ---------------------------------------------------------------192
VII. REFEREN CES --------------------------------------------------------------193
VIII. APPEND I CES -------------------------------------------------------------209
1. Composition of Murashige and Skoog's Basal Medium ---------------------------------209 2. Estimation of glucose: HBH method --------------------------------------------------------210 3. Protein concentration determination (Bradford' s assay) ----------------------------------211 4. Recipes for SDS-P AGE ------------------------------------------------------------------------212 5. Silver stain procedure --------------------------------------------------------------------------215 6. Native isoelectric focusing gel ----------------------------------------------------------------216 7. Desalting column preparation -----------------------------------------------------------------217

x
List of Figures
Figure 1. Preliminary trials of 4 different microtuberization procedures ------------------51 Figure 2. Time course of micro tuber growth ('Iwa' and 'Daeji') ---------------------------55 Figure 3a. Paper chromatographic analysis of carbohydrate changes in the standard
microtuberization medium (' I wa') ------------------------------------------------56 Figure 3b. Paper chromatographic analysis of carbohydrate changes in the standard
microtuberization medium (' Daej i') ----------------------------------------------57 Figure 4a. Time course of carbohydrate changes in the standard tuberization medium
('Iwa') --------------------------------------------------------------------------------58 Figure 4b. Time course of carbohydrate changes in the standard tuberization medium
('Daeji') ------------------------------------------------------------------------------59 Figure 5. pH profile of invertase activity in standard microtuberization medium ('Iwa') --
------------------------------------------------------------------------------------------61 Figure 6. Time course of invertase activity development in the standard tuberization
medium (' I wa' and 'Daej i') --------------------------------------------------------62 Figure 7. pH profiles of invertase activity in the extracts of 'Iwa' potato plantlets cultured
in the standard tuberization medium. The root and stem parts that were submerged in the medium were used for enzyme extractions ----------------63
Figure 8. Isozyme gel analysis of invertase ----------------------------------------------------65 Figure 9. Time course of soluble protein changes in the standard tuberization medium
('Iwa') ---------------------------------------------------------------------------------66 Figure 10. SDS-PAGE of various liquid media -------------------------------------------------67 Figure 11. Time course of pH changes in the standard tuberization medium ('Iwa') -----68 Figure 12. Time course of osmotic potential changes in the standard tuberization medium
('Iwa' and 'Daeji') -------------------------------------------------------------------70 Figure 13. Time course of major inorganic ions changesin the medium during tuberization
('Iwa') ---------------------------------------------------------------------------------71 Figure 14. Effect of sucrose concentrations on average fresh microtuber weight ('Iwa') ----
-------------------------------------------------------------------------------------------74 Figure 15. Effect of sucrose concentrations on average fresh microtuber weight ('Daeji') --
-------------------------------------------------------------------------------------------75 Figure 16. Microtuber fresh weight distribution in response to different sucrose
concentrations in the medium ('Iwa') ---------------------------------------------76 Figure 17. Microtuber fresh weight distribution in response to different sucrose
concentrations in the medium ('Daeji') -------------------------------------------77 Figure 18. Soluble protein changes in the media containing different sucrose
concentrations during tuberization ('Iwa') ---------------------------------------78 Figure 19. Effect of media osmotically equivalent to the 8% sucrose medium at the onset
of the in vitro tuberization step on the number of micro tubers formed ('Iwa') -------------------------------------------------------------------------------------------80
Figure 20. Effect of media osmotically equivalent to the 8% sucrose medium at the onset of the in vitro tuberization step on the number of microtubers formed ('Daeji') -------------------------------------------------------------------------------81
Figure 21. Average microtuber fresh weight in response to media osmotically equivalent

xi
to the 8% sucrose medium at beginning of the microtuberization step ('Iwa') -------------------------------------------------------------------------------------------82
Figure 22. Average microtuber fresh weight in response to media osmotically equivalent to the 8% sucrose medium at beginning of the microtuberization step ('IJaeji') -------------------------------------------------------------------------------83
Figure 23. Fresh microtuber weight distribution in response to media osmotically equivalent to the 8% sucrose medium at beginning of the microtuberization step ('Iwa') ---------------------------------------------------------------------------84
Figure 24. Fresh microtuber weight distribution in response to media osmotically equivalent to the 8% sucrose medium at beginning of the microtuberization step (' IJaej i ') -------------------------------------------------------------------------8 5
Figure 25. Osmotic potential changes of media that were osmotically equivalent to the 8% sucrose medium at beginning of the microtuberization step ('Iwa') ---------86
Figure 26. Osmotic potential changes of media that were osmotically equivalent to the 8% sucrose medium at beginning of the microtuberization step ('IJaeji') -------87
Figure 27. Time course of pH changes in monosaccharides-containing media that were osmotically equivalent to the 8% sucrose medium at the beginning of the microtu berization step (' I wa') -----------------------------------------------------89
Figure 28. Time course of pH changes in monosaccharides-containing media that were osmotically equivalent to the 8% sucrose medium at the beginning of the microtuberization step (' IJaej i') ---------------------------------------------------90
Figure 29 . Average microtuber fresh weight in response to media with carbon contents that were equivalent to that of the 8% sucrose medium at the beginning of microtuberization step (' I wa') ------------------------------------------------------9 3
Figure 30. Average microtuber fresh weight in response to media with carbon contents that were equivalent to that of the 8% sucrose medium at the beginning of microtuberization step (' Daeji ') -------.---------'-,..---------------------------------94
Figure 31. Microtuber fresh weight distribution in response to media with carbon contents that were equivalent to that of the 8% sucrose medium at the beginning of microtuberizati on step (' I wa') -----------------------------------------------------9 5
Figure 32. Microtuber fresh weight distribution in response to media with carbon contents that were equivalent to that of the 8% sucrose medium at the beginning of microtuberization step ('IJaeji') ---------------------------------------------------96
Figure 33. Osmotic potential changes of media with carbon contents that were equivalent to that of the 8% sucrose medium at beginning of microtuberization step ('Iwa') ---------------------------------------------------------------------------------97
Figure 34. Osmotic potential changes of media with carbon contents that were equivalent to that of the 8% sucrose medium at beginning of microtuberization step ('IJaeji') -------------------------------------------------------------------------------98
Figure 35. Time course of pH changes in monosaccharide-containing media with carbon contents that were equivalent to that of the 8% sucrose medium at the beginning of microtuberization step ('Iwa') ------------------------------------100
Figure 36. Time course of pH changes in monosaccharide-containing media with carbon contents that were equivalent to that of the 8% sucrose medium at the beginning of microtuberization step (' IJaej i') ----------------------------------101
xii
Figure 37. Microtuber fresh weight distribution in response to media containing maltose or sucrose ('1wa' and 'Daeji') --------------------------------------------------------103
Figure 38. Osmotic potential changes of media containing maltose or sucrose ('1wa') --105 Figure 39. Osmotic potential changes of media containing maltose or sucrose ('Daeji') ----
-----------------------------------------------------------------------------------------106 Figure 40. Time course of pH changes in media containing maltose or sucrose ('1wa') -----
-------------------------------------------------------------------------------------------107 Figure 41. Time course of pH changes in media containing maltose or sucrose ('Daeji') ---
-------------------------------------------------------------------------------------------108 Figure 42. Average fresh weight of micro tuber in response to the initial pH of the
tuberization medium (' 1wa') ------------------------------------------------------11 0 Figure 43. Average fresh weight of micro tuber in response to the initial pH of the
tuberization medium ('Daeji') ----------------------------------------------------111 Figure 44. Microtuber fresh weight distribution inresponse to the initial pH of the
tuberization medium ('1wa') ------------------------------------------------------112 Figure 45. Microtuber fresh weight distribution inresponse to the initial pH of the
tuberization medium ('Daeji') ----------------------------------------------------113 Figure 46. Effect of mixing old multiplication medium with fresh tuberization medium on
average microtuber fresh weight ('1wa') ------------------------------------------115 Figure 47. Effect of mixing old multiplication medium with fresh tuberization medium on
average microtuber fresh weight ('Daeji') --------------------------------------116 Figure 48. Effect of mixing old multiplication medium with fresh tuberization medium on
microtuber weight distribution ('1wa') --------------------------------------------117 Figure 49. Effect of mixing old multiplication medium with fresh tuberization medium on
micro tuber weight distribution (' Daej i') ----------------------------------------118 Figure 50. Effect of medium replacement on the number of microtubers formed ('Iwa') ----
-------------------------------------------------------~~--------------------------------120
Figure 51. Effect of medium replacement on the number of micro tubers formed ('Daeji')-------------------------------------------------------------------------------------------121
Figure 52. Effect of periodic medium replacement on average fresh weight of microtuber (' I wa') ---------------------------------------------------------------------------------122
Figure 53. Effect of periodic medium replacement on average fresh weight of micro tuber (' Daej i ') -------------------------------------------------------------------------------123
Figure 54. Effect of periodical medium replacement on fresh microtuber weight distribution ('I wa') ------------------------------------------------------------------124
Figure 55. Effect of periodical medium replacement on fresh microtuber weight distribution (' Daej i') ----------------------------------------------------------------125
Figure 56. Longitudinal shaped microtuber (L) by periodic medium replacement treatment compared to a round shaped by the standard tuberization medium ('1wa') ------------------------------------------------------------------------------------------------126
Figure 57. Time course of changes in the fresh and dry weights per plantlet during potato plantlet development ('I wa') -------------------------------------------------------128
Figure 58. Time course of changes in the fresh and dry weights per plantlet during potato plantlet development ('Daeji') -----------------------------------------------------129
Figure 59. Time course of soluble protein changes in the standard plantlet multiplication
xiii
medium (' I wa') -----------------------------------------------------------------------130 Figure 60. Time course of carbohydrate changes in the standard plantlet multiplication
medium (' I wa') -----------------------------------------------------------------------131 Figure 61. Time course of carbohydrate changes in the standard plantlet multiplication
medium (' Daej i') ---------------------------------------------------------------------132 Figure 62. pH profile of invertase activity in the plantlet multiplication medium ('Iwa') ---
-------------------------------------------------------------------------------------------133 Figure 63. Time course of invertase activity in the standard plantlet multiplication medium
(' I wa') ----------------------------------------------------------------------------------135 Figure 64. Time course of invertase activity in the standard plantlet mUltiplication medium
(' Daej i') --------------------------------------------------------------------------------136 Figure 65. Time course of pH changes in the standard plantlet multiplication medium
(' I wa') ----------------------------------------------------------------------------------137 Figure 66. Time course of pH changes in the standard plantlet multiplication medium
(' Daej i') --------------------------------------------------------------------------------138 Figure 67. Time course of osmotic potential changes in the standard plantlet multiplication
medium (' I wa') -----------------------------------------------------------------------139 Figure 68. Time course of osmotic potential changes in the standard plantlet multiplication
medium (' Daej i') ---------------------------------------------------------------------140 Figure 69. Time course of plantlet growth in response to media containing different
carbohydrates (' I wa') ----------------------------------------------------------------141 Figure 70. Time course of plantlet growth in response to media containing different
carbohydrates (' Daeji') --------------------------------------------------------------142 Figure 71. Time course of soluble protein changes in multiplication media containing
different carbohydrates (' I wa') -----------------------------------------------------144 Figure 72. Paper chromatography on time course of carbohydrate changes in the standard
mUltiplication medium with maltose instead of sucrose ('Iwa') -------------145 Figure 73. Effect of medium replacement treatments on plantlet development ('Iwa') --146 Figure 74. Effect of medium replacement treatments on plantlet development ('Daeji') ----
-------------------------------------------------------------------------------------------147 Figure 75. Effect of different plantlet multiplication media on average fresh weights of
microtubers harvested at the end ofthe standard tuberization step ('Iwa') --150 Figure 76. Effect of different plantlet multiplication media on average fresh weights of
microtubers harvested at the end ofthe standard tuberization step ('Daeji') ------------------------------------------------------------------------------------------------151
Figure 77. Effect of different plantlet multiplication media on fresh weight distribution of microtubers harvested at the end ofthe standard microtuberization step ('Iwa') -------------------------------------------------------------------------------------------152
Figure 78. Effect of different plantlet multiplication media on fresh weight distribution of microtubers harvested at the end of the standard microtuberization step (' Daej i ') --------------------------------------------------------------------------------153
Figure 79. Effect of medium replacement during multiplication on average fresh weight of microtubers formed at the end ofthe standard microtuberization step ('Iwa' and 'Daej i') ----------------------------------------------------------------------------156
Figure 80. Effect of medium replacement during plantlet multiplication on fresh weight

xiv
distribution of microtubers formed at the end of the standard microtuberization step (' I wa') ----------------------------------------------------------------------------15 7
Figure 81. Effect of medium replacement during plantlet multiplication on fresh weight distribution of microtubers formed at the end of a standard microtuberization step ('Daeji ') --------------------------------------------------------------------------158

xv
List of Tables
Table 1. Results of the preliminary trials in Fig. 1 at 10 weeks from the start of the microtuberization step ------------------------------------------------------------------52
Table 2. Presence of enzyme activities in the medium at the end of the preliminary tuberization experiments with 'Iwa' plantlets ----------------------------------------53
Table 3. Effect of varying sucrose concentrations on the number of micro tubers formed after 10 weeks in the dark --------------------------------------------------------------72
Table 4. Effect of media containing carbon contents that were initially equivalent to that of the 8% sucrose medium on the number of microtubers formed after 10 weeks in the dark ------------------------------------------------------------------------------------91
Table 5. Effect of maltose and sucrose on microtuber number (a) and average microtuber weight (b) -------------------------------------------------------------------------------102
Table 6. Effect of old multiplication medium mixed with fresh tuberization medium Table 7. Effect of different plantlet multiplication medium on the number of micro tuber
formed in 8% sucrose tuberization medium ('Iwa' and 'Daeji') ----------------114 Table 8. Effect of medium replacement during plantlet multiplication on the number of
microtubers formed at the end of the standard microtuberization step ('Iwa' and 'Daeji') ----------------------------------------------------------------------------------155

xvi
List of Plates
Plate 1. TEM view of chloroplast with small plasoglobulus in leaf of in vitro potato plantIet ('Iwa') grown in liquid medium ---------------------------------------------160
Plate 2. TEM view of mesophyll chloroplast in stem of in vitro potato plantlet ('Iwa') grown in white medium with thylakoid grana and a small plastoglobli ---------161
Plate 3. Typical chloroplast organization in the part of green stem that was submerged in the liquid plantIet multiplication medium --------------------------------------------162
Plate 4. Grana and thylakoids in the stem tissue that was submerged in liquid medium at the end of the standard multiplication step -------------------------------------------163
Plate 5. TEM view ofmesophyll chloroplast in leaf tissue that was submerged in liquid medium fixed at the end of the standard multiplication step ----------------------165
Plate 6. TEM view of chloroplast with small plastoglobli in leaf tissue submerged in liquid medium at the end of the standard multiplication step -----------------------------166
Plate 7a. Amyloplasts with large starch grains in stem tissue that was submerged after microtuberization in liquid medium in the dark -------------------------------------167
Plate 7b. Amyloplasts with large starch grains in leaf tissue that was submerged after microtuberization in liquid medium in the dark -----------------------------------168
Plate 8a. Chloroplast in cortical cells of photo autotrophic green roots ---------------------169 Plate 8b. Chloroplast in cortical cells of green roots -----------------------------------------170 Plate 9. TEM view of a plasid of cortical cells from non-green root tissue in liquid
tuberization medium --------------------------------------------------------------------171 Plate 10. Typical TEM view of dictyosome of storage parenchyma cells with a few
plastog10bli from non-green roots in liquid tuberization medium ----------------172 Plate 11. Plastid of tuber cells which remained largely undifferentiated with a large starch
grain in a non-greened microtuber in liquid medium -------------------------------174 Plate 12. Mitochodria had cristae, and a matrix with a low density, in non-greened
microtuber in liquid medium ---------------------------------------------------------175 Plate 13. Ovoid amyloplast of a non-green microtuber harvested at the end of the
microtuberization step had a larger stromal volume with wide electron transparent zone and lamellae were more or less parallel to each other --------176
Plate 14. Oval amyloplasts in cells floating in liquid microtuberization medium contained irregular shaped large starch grains --------------------------------------------------177

I. Literature Review, Aim and Scope of this Research
1. POTATO
The potato (Solanum tuberosum L.) belongs to the family Solanaceae. It is assumed that
tuber-bearing Solanum species were first domesticated and eaten by man in the region of
lake Titicaca in South America approximately 8,000 years ago (Hawkes 1978). The
multitude of remote highland settlements in the vast Andean Cordillera, which stretches
from Chile in the south to Venezuela in the north, provided numerous sites for selection
and preservation of unique cultivated forms of potato. South Americans called the potato
"batata", whereas Spaniards later called it ''patata ", from which the English name, potato
probably originated. The Spanish were the first Europeans to discover this tuber crop when
they invaded the Inca Empire in 1535. Around 1570 the crop was introduced to Spain and
then to Ireland in 1590 (Bronk 1975). More than a century passed after these initial
introductions to Europe before reports of widespread use of potato as food began to
appear. Later, immigrants from Scotland and Ireland to the American colonies were the
main conduits for potato introductions to North America.
1.1 Production of Potato
Potato is an annual crop plant, about 30-1 OOcm taltand vegetatively propagated through
tubers. The tuber bears the buds, commonly known as "eyes", which sprout on
germination and grow into plants.
The tubers, the size of which differs with age and cultivar, are grown in fields in ridges to
maintain developing tubers undersoil. The tubers start developing when the plant flowers,
and their formation ceases when fruit formation begins.
The potato as one ofthe most valuable food crops is grown in more countries than any
other crops except maize. Production volume of it ranks fourth in the world after rice,
wheat, and maize. Potatoes accumulate the highest amount of energy per hectare per day
during vegetative period, after sugarbeets, in tropical and subtropical countries. The potato
tuber contains by weight, around 75-80% water, 16-20% carbohydrates, 2.5-3.2% crude
protein, 1.2-2.2% protein, 0.8-1.2% minerals, 0.1-0.2% crude fat, 0.6% crude fiber,
essential vitamins and trace elements (Singh and Verma 1979, Hooker 1983).
For human consumption, potatoes are used in fresh or in processed forms. Processing of
potatoes for human consumption, already a major industry in the United States, is
expected to continue expanding in both North America and Western Europe.
2
The potato is of highland origin, and in this traditional environment farmers generally
cultivate no more than 1-2 ha in a number of distinct parcels of land, forming part of
complex multiple cropping systems. Recently potato production in developing countries
has spread gradually out of the traditional cultivation practice into commercially oriented
large-scale farming. Intensive horticultural systems are more common where land is scarce
and potatoes are expensive. In most areas, returns to potato growers are high on the
average but highly variable. For this reason, few farmers specialize in potato production,
and those who do tend to be large, financially well-off producers.
Seed tubers available to most developing-country farmers are costly and poor in quality.
For these reasons, improvements in seed-tuber systems are needed to increase yields and
reduce unit costs of production.
Research on true potato seed is also being conducted in developing countries. Early results
indicate numerous potential applications in seed programs as well as directly by farmers
growing table potatoes.
A wide range of techniques, including tissue culture and in vitro rapid multiplication, are
currently being adopted to clean, maintain, and reproduce basic stocks for later
multiplication and use by farmers. National programs are also experimenting with new
institutional models for producing and distributing high-quality planting materials to
farmers.
1.2. Diseases of potato
Different pathogens such as fungal, bacterial, viral, nematode, and abiotic diseases, affect
different parts of the potato plant. Many have their origin in the preharvest period, but
have effect on tubers before or after harvest. One serious disease in potato is the late blight
caused by the fungus, Phytophthora infestans, which also caused the historic famine of
1845-1849 in Ireland. Similarly, many viral and wilt diseases are also common.
Knowledge of the occurrence and intensity of diseases and pests and the damage caused by

these is essential in order to take up preventive measures, and to develop disease-resistant
variant methods. The motivating factor for potato improvement continues to be the
development of late blight resistant cultivars.
1.3. Seed potato system
The conventional breeding of potato involves selection, crossing programs for
recombination and mutation. Selection is limited to the variations detected so far.
Moreover, it takes a long time to select new varieties and the efficiency of selection is
limited. Starting with 100,000 seedlings it would take 6-8 years to obtain a better variety
(Wenzel 1980).
3
Potato is propagated by tubers to preserve the parental properties and also because the seed
setting is usually very poor. Even while propagating by tubers, sometimes variants appear
which are called "bud sports". Many variants do arise due to such vegetative mutations;
the frequency of which is rather low. Mutations have been induced in potatoes by X-rays,
UV and by chemical mutagens (Broertjes and Harten 1978). Practically all mutation work
has been done using tetraploid cultivars and performed on tubers. Mutants have been
obtained with success with regard to size, shape or colour of the tubers or leaves.
Mutations for earliness, increased resistance to different diseases and increased starch
content of tubers have been reported (Solomko 1965). Similarly, day neutrality was
induced in several cultivars by chemical mutagens (Upadhya et al. 1974). However, in
many cases mutations reveal themselves as periclinal chimeras, and hence show
pleiotropic effects. Breeding for disease resistance is also attempted using crosses with
S. demissum, which is resistant to many races of potato blight. First resistant gene RJ and
later R2 was transferred to potato, but it is still not possible to impart resistance to all races
of pathogen (Nelson 1984).
In order to make "normal" breeding methods possible, unconventional methods especially
in vitro culture techniques, should be incorporated in potato-breeding schemes. One of the
advantages would be to obtain "pure" monohaploid and dihaploid plants in large numbers
by employing anther and pollen culture. These "haploid" plants can be diploidized again
via the in vitro method to obtain homozygous lines, the availability of which would offer

the possibility of conventional crosses, and production of hybrid seeds, thus enabling the
conversion of potato from a tuber-propagated crop to a seed-propagated crop. This would
also have the advantage of producing virus-free plants, as tubers could carry many viral
diseases, but the cost associated with the true potato seed appears to be too expensive.
2. Micropropagation
Mass plant propagation by tissue culture techniques, a facet of plant biotechnology, has
developed into an important industry with considerable potential for the future (Vasil &
Vasi11986; Zimmerman et al. 1986). One of the key unresolved issues in mass
propagation remains the high cost of producing plants from tissue culture.
4
Two important discoveries in the 1950s and early 1960s contributed to the development of
modern methods for rapid mass propagation of plants in vitro or micropropagation. The
first watershed was a report by Morel and Martin (1952) demonstrating that dahlia plants
obtained from cultured shoot meristems were virus-free. This discovery led to the
widespread culture of orchid meristems for plant propagation (Morel 1965; Morel 1960).
The discovery of the role of cytokinins in shoot morphogenesis (Skoog & Miller 1957)
was the second turning point. Today, most of the plant tissue culture propagation industry
is based on culturing isolated shoot buds in media containing cytokinins. These plant
hormones stimulate the development of multiple axillary buds by inhibiting apical
dominance. Workers separate the newly formed buds by hand and reculture them to
produce more buds. Eventually, buds are allowed to grow into shoots, which are then
rooted in auxin-containing media to produce plants. Since each new plant arises from an
organized meristem, the genetic fidelity of the variety is largely maintained.
This method has been used effectively to propagate a large number of herbaceous
ornamentals, plus a few vegetables, fruits, and tree species. The entire process, however,
is extremely labour-intensive and costly. It is impractical for large-volume, low-cost crops
(potato, tomato, celery), or for plantation crops (rubber, coffee, tea, oilnut palm), and
forest species.

5
2.1. In vitro potato culture techniques
2.1.1. Meristem, shoot-tip, and nodal segment cultures
Meristem and shoot tip cultures in general have been reviewed in detail by many
researchers (Hu and Wang 1983; Kartha 1981; Quak 1979). Economical and technical
aspects of in vitro tissue culture techniques have been widely reviewed (Levin and Vasil
1989). According to the article, tissue culture techniques would be economically feasible
to get better quality of crop propagules such as potato, cassava, garlic, lilies, strawberries,
carnation, pelargonium, gerbera, etc., which are susceptible to virus and other pathogens.
Attempts have been made to increase the efficiency of the biological processes and to
reduce the costs associated with the use of controlled environments for the growth and
multiplication of cultures, and the acclimatization of plantlets in the greenhouse
environment. In vitro meristem culture in potato is an established possible method of
eliminating viruses (Bajaj and Sopory 1986; Wang and Hu 1985; Mellor and Stace-Smith
1977). In vitro meristem culture, sometimes combined with temperature or antiviral
chemical treatments, is the only effective method to date that eliminates viral infections
from systemically infected potato cultivars without inducing genetic changes (Wang and
Hu 1980). Cultured meristem is also the preferred material for cryopreservation of
germplasms (Kartha 1981, 1982). In vitro shoot tip.and nodal segment culture of disease
tested potato material provides a rapid rate of clonal multiplication. With the aid of
antiviral chemicals, shoot-tip culture is also capable of eradicating viral infections (Jordan
et al. 1983). Unlike plantlet regeneration from callus culture, the meristem, shoot-tip, and
nodal segment cultures provided genetic stability in the regenerated plantlets. According to
Denton et al. (1977), potato plants regenerated from shoot-tip culture showed no
differences in biochemical characters compared to the control plants. Meristem tip
propagation was used by Wright (1983) to develop two or three virus-free clones of 10
cultivars. Field trials with these clones, which extended over 4 years, showed no consistent
differences in yield or specific gravity of tubers among the clones of any of the 10
cultivars. Copeland (1982) compared potato nodal cuttings, consisting of a leaf attached
to a piece of stem, with the traditional way of planting a seed tuber which gives a 6 to 10
fold annual multiplication rate, and it was suggested that thousands of plants may be

produced over winter from one tuber by micropropagating plantlets under controlled
laboratory conditions. Nodal cuttings were kept at 25°C under fluorescent lights for 16
hours each day. Nodal cuttings, which grew quickly and in 3 weeks had reached 5 cm in
height, were ready by this time, for sub-division producing 3 to 4 more cuttings. Thus,
similar results were obtained that the number of plants multiplied 3 to 4 fold using 10
varieties in every three weeks.
2.1.2. In vitro potato mass propagation
6
The importation of high cost certified seed tubers could become a major constraint to
potato production. For example importation of certified seed tubers accounts for 40 to 50%
ofthe total production costs of a potato crop in Indonesia (Wattimena 1983). In other
countries such costs may reach 60% or more (Sawyer 1979). To overcome this problem,
tropical or subtropical countries have to look for alternative methods of potato propagation
that can be practiced locally and yet remain free of disease.
Micropropagation can be used to bulk up materials (1) after germplasm storage, (2)
obtained from breeding-selection program, (3) generated by genetic engineering, or (4) for
international quarantine-free distribution of propagated materials. Large-scale tests have
been carried out to use in vitro-produced plantlets as the propagules of main crops
(Wattimena et al. 1983). The Plant Resources Institute (Salt Lake City, Utah) has been
testing commercial propagation of potatoes through tissue culture since 1980. They put 10
varieties encompassing 100 lines through the tissue culture system (Upham 1982). Six
different micropropagation methods developed by various researchers for rapid in vitro
cloning of potatoes have been described and compared (Goodwin 1982).
Micropropagated certified stock of potatoes can be transferred to the field in the form of
rooted plantlets, in vitro produced microtubers, or ex vitro produced minitubers (produced
from in vitro derived plantlets). Stem cuttings from in vitro produced plantlets are also
used. Micropropagated seed stocks are reported to increase yield by 10-38% and show
great uniformity (Jones 1988). Seed potato tubers production by micropropagation is
expected to continue offering commercial opportunities in the following areas (Addy
1988): (1) Continued development of efficient micropropagation production systems that

7
in tum yield larger volumes of green house generated minitubers. This could reduce the
field generation number necessary to supply commercial seed from indexed nuclear stock.
(2) Rapid introduction of new cultivars through large volume micropropagation / green
house production systems. (3) Automated micropropagated systems that could increase the
volume and decrease the unit cost possibly with the implementation of robotics in these
systems. (4) Development of proprietary cultivars with rapid availability through efficient
propagation systems.
2.1.2.1. Multimeristem culture for micropropagation
The culture method was developed at the International Potato Center in Lima, Peru (Roca
et al. 1978). Rapid bud proliferation from excised shoot tips was enhanced by shake
culture. Both axillary buds and adventitious buds were developed from the shoot tip
explants and formed a multimeristem mass. The resulting shoots in tum were used to
regenerate complete plantlets by nodal selection cultures. This is the most broadly tested
(on 38 cultivars) of the potato micropropagation methods. Although callus-derived
adventitious shoots were involved, no genetic changes were detected, using both
biochemical and morphological criteria.
2.1.2.2. In vitro shoot layering
Shoot layering culture method was reported by Wang (1977) at the Academia Sinica,
Taipei, Taiwan. Through repeated layering and subculturing of a single shoot,
approximately 2,517 plantlets can be produced in 1 year. Large quantities of rooted shoots
of several cultivars are thus produced annually, to be utilized as part ofthe process of
virus-free potato production distributed to growers in Taiwan. Although growth regulator
free MS medium (Murashige and Skoog 1962) has been used satisfactorily in supporting
repeated subculturing and development of nodal explants (Hussey and Stacey 1981),
Wang (1977) found that the multiplication potential of axillary buds declined after 7 to 10
subcultures when no auxin was added. This loss in regeneration competence could be
completely eliminated by enriching the medium with O.005~M NAA. Both
micropropagation methods described above included approximately this amount ofNAA
8
in the multiplication medium. It was reported that after 56 days under an inductive
environment the microtuber weight from layered shoots was 3-5 times greater than for
nodal cuttings (Leclerc et al. 1994). Increased microtuber fresh weight from layered shoots
compared with nodal cuttings may be due to increased production of endogenous growth
regulators and gradients of these growth regulators. In addition, the increased leaf surface
area available for the perception of the photoperiodic stimuli and surface area in contact
with the medium may have contributed to the increased microtuber production. Favouring
vegetative growth of stolon segments and shoots prior to microtuber induction has been
reported to increase microtuber fresh weight (Chapman 1955; Garner and Blake 1989).
They suggested that greater microtuber yield can be achieved by increased vegetative area
of cultures prior to microtuber induction.
3. Development of in vitro potato microtuberization
Transplanting of tender vegetative plantlets from in vitro conditions to an external
environment is rather laborious and has a high failure rate unless proper hardening
procedures have been followed. On the other hand, dormant tubers could be harvested
from in vitro conditions, stored, shipped, and planted rather conveniently (Roca et al.
1979; Ranalli et al. 1994a,b). Thus, it became advantageous to develop an in vitro mass
tuberization method for potato propagation.
Many researchers have described techniques for mass propagation of microtubers (Estrada
et al. 1986; Chandra et al. 1988) and its potential use for seed tuber production (Wang and
Hu 1982; Wattimena et al. 1983). While microtubers generally originate as aerial
structures on the stem, occasionally a few microtubers may be formed in the medium
(Hussey and Stacey 1981, 1984). Akita and Takayama (1988a, b) reported a scale-up
culture using jar fermentor techniques consisting of a 2 step culture by a method similar to
the liquid shaken culture method reported by Estrada et al. (1986). Akita and Takayama
(1988a, b) suggested the culture efficiency can be improved by multiplication of the shoots
in the aerial phase and tuberization might be stimulated in the medium phase followed by
continuous submersion of shoots. Akita and Takayama (1994b) reported shoots were
cultured under the semi-continuous medium in which the medium surface level was raised

or lowered throughout the culture period. Tubers were induced and developed in every
area in this jar fennentor system.
Akita and Takayama (1994a) first reported that potato microtubers can be propagated
efficiently using an ebb-and-flow-type bioreactor (EFBR) system. Then Hulsher et al.
(1996) reported that 1,600-1,700 potato tubers could be produced by using an EFBR
system with a 10-liter culture vessel in 18 weeks (8 weeks for shoot multiplication and 10
weeks for tuber production). A similar type of culture system in which a slow rotating
cylinder was employed has been used for mass propagation of potato microtubers.
Microtubers were used as inoculants and multiplied further through induction of the
microtuber shoot complex (Joyce and McCown 1991; McCown and Joyce 1991).
9
An in vitro mass tuberization procedure which was reported at the fourth International
Congress of Plant Tissue Culture, has been used in seed potato production in Taiwan since
1975 (Wang 1978). Almost all the experiments carried out prior to 1978 involved only one
to a few excised stolons cultured in each vessel for tuber initiation studies rather than the
production of in vitro tubers in large quantity. Microtuberization was adopted at the
International Potato Center (CIP) for gennplasm storage and international distribution.
CIP's international gennplasm distribution plans for large volumes of potato were to
gradually replace in vitro plantlets with in vitro-produced microtubers. The in vitro mass
tuberization procedure was also adopted by McCown and co-workers at the University of
Wisconsin in developing a complementary method of clonal propagation for commercial
field planting (Wattimena et al. 1983). Improvements in the microtuber production method
are still required since most current systems have problems obtaining sufficiently large
microtubers for field planting (Ranalli et al. 1994) and a honnone-free medium is also
desirable to avoid off-types in the progeny of microtubers as a result of culture-induced
genetic variants.
3.1. Use of in vitro tubers
In vitro-derived storage organs are superior to shoots for micropropagation because they
are easily acclimatized, stored and transferred. Easy storage and transport of the storage
organs is also considerably advantageous in commercial production. On the other hand,
10
the efficiency of multiplication of storage organs is quite low compared with the
propagation of shoots. As storage organs are induced from buds developed on shoots by
modifYing the physiological conditions, prolonged cultivation is usually required for the
production of storage organs compared to the multiplication of shoots. In addition, only
small numbers of buds usually develop into storage organs. So, applications of new
techniques are now required to overcome the low propagation efficiency of storage organs.
The practical use of in vitro tubers was realized in the early eighties with a view to
producing disease-free seed potatoes for seed certification programs. In vitro tubers were
used for international exchange of germplasm especially to those countries where the
expertise for handling in vitro plantlets was not available. In vitro tubers were used to aid
transport of germplasm under adverse conditions such as continuous darkness and variable
temperatures, and as materials for medium-term conservation of potato germplasm. The
use of in vitro tubers has been reported in China, Taiwan, Korea and Australia in the
applied aspect of production of virus free potato seed.
Sluis and Rivera (1984) have reported that the in vitro tubers can be taken to the field as a
source of disease-free seed stock.
In a seed potato production scheme in Taiwan 36,300 in vitro tubers could be produced in
a period of four months in an area of 10 m2, where 1,210 culture flasks of 500ml capacity
were accommodated on the bench in the culture room (Wang and Hu 1982). These 36,000
"tuberlets", after three successive field multiplications under disease-free conditions,
produced 1 ,800 kg of seed potatoes which was sufficient for supplying seed potatoes for
2,000 hectares of land on a schedule of one third rotation per year. The yield from these
virus-free clones was 26% higher than that of the fanner seed stocks. These are a few
examples of application of this technology.
At the International Potato Center, Lima, Peru, this technique is being used for the
international distribution of potato germplasm after pathogen indexing to different
countries of the world. It is also being studied as an option for germplasm storage in vitro
(Schilde et al. 1982; Estrada et al. 1986). Thime & Pert (1982) have reported the same use
of in vitro tubers.
Many countries are using this technology in their potato production programs. The basic

techniques are already available in the literature and with a few modifications can be
applied in many countries. Studies are underway in many laboratories to induce the
maximum number of tubers per culture vessel and to increase mean tuber size. There are
studies in Israel to attempt even mechanized production and harvest of in vitro tubers.
3.2. Factors affecting in vitro potato microtuberization
11
Barker (1953), who used etiolated sprouts to induce microtubers published the first report
of in vitro tuberization by tissue culture methods in White's medium containing 80g/l
sucrose. A similar and more extensive study had also been completed independently but
concurrently (Mes and Mengo 1954). In a subsequent study, it was clearly demonstrated
that microtubers would form from stolons that were free of bacteria and fungi (Barker and
Page 1954).
Different aspects of in vitro tuberization have been studied. In vitro tuberization of potato
has been studied by numerous workers (Wang and Hu 1982; Estrada wt al. 1986). Work
on microtuberization in potato has mainly focused on the use of growth regulators (palmer
and Smith 1969; Wang and Hu 1982; Estrada et a/1986; Vecchio et al. 1994; Gopal et al.
1997; Gopal et al. 1998). It is well established that tuber formation in potato is regulated
by carbohydrate and phytohormone fluxes (Ewing and Struik 1992; Vreugdenhil and
helder 1992; Ewing 1995), and there is considerable variation in the results of these
studies (i.e. the response obtained depended upon a range of factors including sucrose
concentration, temperature, photoperiod, light intensity, and cultivar) (Hussey and Stacey
1984; Ortiz-Montiel and Losoya-Saldana 1987; Gamer and Blake 1989). Gopal (1996)
reported a faster rate of microtuberization and an earlier senescence of plantlets cultured
under continuous darkness, the faster rate may have resulted in fewer eyes in microtubers.
Then Gopal et al. (1997) described how the number of eyes affected performance for most
characters, including tuber yield in a crop raised from microtubers under short days of low
light intensity. Gopal et al. (1998) reported that short photoperiod (10 h of 6 -12
I-lmoVm2/s) and low temperature (day 20°C and night 18 °C) treatments had shown both
higher yields than long day and (16h of 38 - 50 /lmol/m2 Is) high temperature (day 28°C
and night 25 °C) treatments in 22 genotypes. Under short-day and low temperature

12
conditions the addition of BA increased microtuber yield and average microtuber weight.
They also observed microtubers produced in the dark had a significantly lower number of
eyes than those produced in light.
Since then the use of growth regulating materials to favor microtuberization has been the
object of intensive investigation (Watimena 1983; Wang and Hu 1985; Chandra et al.
1988). However, growth regulators failed to induce tuberization when the sucrose supply
was inadequate (Harmey et al. 1966). Sucrose appears to be the only carbon compound
necessary for induction ofmicrotuberization (Gregory 1956; Ewing 1985, 1990). Looking
at the literature published so far it is evident that the physiological reactions of in vitro
plantlets differ considerably from those of in situ plants, and also differ in many aspects
from those of in vivo plants. Unexpectedly, conditions for in vitro tuberization, determined
through numerous experiments, frequently do not coincide with in situ conditions. There
are discrepancies among different pUblications as to which are the optimal levels for each
of the factors involved.
The different factors included growth inhibitors and retardants (coumarin, ABA, CCC),
growth promoters and regulators (cytokinins, auxins, ethylene), carbon source (sucrose,
glucose, mannose) and growth conditions (temperature, photoperiod). But, a reliable
production method involving a medium free of any growth regulating agents has also been
reported (Garner and Blake 1989; Forti et al. 1991).
3.2.1. Effect of phytohormonal growth inhibitors and growth retardants
Compounds that inhibit vegetative growth frequently stimulate in vitro tuberization. Thus,
many kinds of growth retardants and growth inhibitors have been used for in vitro
tuberization studies. These compounds include ABA, CCC, MH, Alar, Amo-1681, and
coumarIn.
3.2.1.1. Coumarins
Coumarins are naturally occurring aromatic compounds which are found in a wide variety
of plant species (Shah 1945; Kosuge and Conn 1959). Coumarin and its derivatives are
known to. have pronounced effects on physiological processes in both plants and animals.

While coumarin is considered to be primarily a plant growth inhibiting compound,
researchers have also shown that coumarin can be a growth stimulant comparable to
indole-3-acetic acid (IAA); however, it is considered to have a very different mode of
action (Neumann, 1959; Neuman, 1960).
13
F or the first time the effect of coumarin on in vitro tu berization of potato explants was
reported in 1972 by Stallknecht. Different concentrations of coumarin were tried in the
medium for tuber induction. In the medium used in this study no tuberization occurred at
1.0 mg/l coumarin or in the control lacking coumarin. However, at a concentration of 10
mg/l, 30% of the explants produced tubers. Coumarin at 25 to 50 mg/l was the optimum
for the initiation of tubers. At 100 mg/l, the tuberization process was delayed, and the
tubers were small compared to the treatments of 25 and 50 mg/I. Tubers formed in the
coumarin-treated cultures were always larger in size than those grown in the medium with
added kinetin (2.5 mg/l). Tuber initiation with kinetin treatment varied from 10 to 14 days,
while the coumarin-treated shoots initiated tubers 2 to 3 days before. The time required for
100% tuberization varied from 15 to 20 days.
Stallknecht and Farnsworth (1982a) reported that high nitrogen, GA3, ABA, IAA and
NAA reduced the effectiveness of coumarin for the in vitro tuberization. GA3 and high
concentrations of nitrogen inhibit the uptake of coumarin by axillary shoots. The mode of
action of these growth regulators on the inhibition of coumarin is not well known. The
inhibitors of protein and nucleic acid synthesis i.e. chloramphenicol, para
fluorophenylalanine, actinomycin D and 5-fluorouracil were also evaluated for their
effectiveness in inhibiting coumarin-induced tuberization. Chloramphenicol at
concentrations from 25 to 100 mg/l almost completely inhibited tuberization. The amino
acid analog para-fluorophenylalanine inhibited tuberization only at a concentration of 100
llg/mI. Actinomycin D reduced tuberization from 70% to 10% with increasing
concentrations from 1.0 to 10 Ilg/ml. It also inhibited root growth and tuber diameter. 5-
fluoroacil delayed tuberization at 1.0 and 5.0 Ilg/ml whereas at 10.0 Ilg/ml tuberization
was reduced to 40%. However, it had no effect on any of the tuber characteristics
(Stallknecht and Farnsworth 1982b).
Palmer and Smith (1970) reported that the inhibitors of protein and nucleic acid synthesis

14
(ACTD, PFA, 2-TU, CHL, 5-FUDR) delayed in vitro tuber formation but failed to inhibit
the tuberization process when used in the medium.
3.2.1.2. Chlorocholine chloride (CCC)
Chlorocholine chloride (2-chlorethyl or trimethyl ammonium chloride) commonly called
CCC or cycocel is a commercial growth retardant used in many crops. Its effect is variable
in potato and it has been mainly used to induce tuberization under in vivo and in vitro
conditions.
De Stecco and Tizio (1982) also studied the positive effect of CCC on in vitro tuberization
of sprouts of potato cultured on basal medium without sucrose, while the controls did not
tuberize at all.
Research at the International Potato Center, Lima, Peru has shown that CCC can easily
induce in vitro tuberization. When included in MS nutrient medium at a concentration of
500 mg/l together with 5.0 mg/l BA and 8% sucrose, CCC is able to produce tubers in a
broad range of genotypes in a period of 4 weeks (Schilde et al. 1982; Estrada et a/1986).
The GA3-induced delay of in vitro tuberization can be overcome by the addition of CCC to
the medium. Tizio and Goleniowski (1985) reported that CCC (1 x lO-IM) inhibits the
synthesis and/or release of GA3-like substances from potato sprout sections cultured in
vitro. This effect is closely linked with precocious tuberization ofthe explants. They
further concluded that delayed root formation seems to be caused by a gibberellin or a
complex of several gibberellins.
3.2.1.3. Abscisic acid (ABA)
Abscisic acid (ABA) is generally considered as a tuberization promoter, however, its role
in tuber induction is a controversial matter. It appears that the role of ABA is primarily an
indirect one and it acts by suppressing shoot growth, stimulating movement of
carbohydrates to the tuber. ABA could playa role in cell and organ differentiation of
tuberous roots by inhibiting root apical meristem activity and cell elongation (Melis and
Van Staden, 1984).
Koda and Okazawa (1983) reported that ABA in the medium increased the tuberization

rate in combination with 2% sucrose. ABA, however, reduces or inhibits coumarin
induced tuberization (Stallknecht and Farnsworth, 1982a).
The inhibitor-complex and its probable main component, abscisic acid (ABA) is not the
hypothetical tuber initiation factor in potato shoot sections cultured in vitro, nor does it
seem to participate in the hormonal mechanisms proposed (Tizio and Maneschi, 1973).
However, BA suppressed the effect of ABA on tuber induction (Kim 1982).
15
The effects of ABA on potato tuberization have been investigated and ABA is normally
regarded as a regulator that reduces GA-promoted processes in plant development. It was
assumed that ABA is a promoting hormone in potato tuberization (Okazawa & Chapman
1962; Marschener et al. 1984). However, the function of ABA with respect to stolon
elongation, tuber initiation, and tuber growth is not clear. EI-Antably et al. (1967)
observed a stimulation of tuber formation by ABA applied to the leaves of long-day
grown potato plants. Wareing and Jennings (1980) found that ABA can replace the effect
of the leaf by promoting tuberization in induced cuttings. The promoting effect of
exogenous ABA was also demonstrated by the increasing numbers of tubers (Abdullah &
Ahmad 1980), the earlier initiation of tubers, and the formation of sessile tubers (Menzel
1980).
Inhibition oftuberization by ABA was also reported with the effect depending on
concentration and variety (Palmer & Smith 1969b; Hussey & Stacey 1984). The analysis
of endogenous ABA showed an increase of ABA level under tuber-inducing conditions
(Krauss & Marschner 1982) and a reduction of ABA content when N was supplied during
tuber formation (Marschner et al. 1984). Further studies are needed to clarify the
conflicting data concerning the effect of ABA on tuberization.
3.2.1.4. Effect of TIBA (2,3,5-triiodobenzoic acid)
TIBA (2,3,5-triiodobenzoic acid) has been reported by Lawrence and Barker (1963) to
retard tuber formation but fails to prevent it. Its effect was not overcome by addition of
IAA.

3.2.2. Effect of growth promotors
3.2.2.1. Cytokinin
16
The endogenous concentrations of different cytokinins vary in different parts of the potato
plant (Palmer and Smith 1969, 1970; Smith and Palmer 1970). Forsline and Langille
(1925) have confirmed the presence of four compounds with cytokinin-like activities in
the potato plant and reported that their concentrations changed in proportion to variation of
environmental conditions such as day length and temperature which have regulatory
effects on the tuberization process. Courduroux (1967) suggested that a specific tuber
forming substance may be related to cytokinin but he could not demonstrate a requirement
for cytokinins in tuber induction.
Palmer and Smith (1969) reported for the first time that cytokinin is required in the
tuberization of isolated stolons when cultured in vitro and showed an increase in the
tuberization frequency on various cytokinin-containing media. 2.5mgll kinetin (a-
furfuryl amino-purine) was more effective for tuber induction than other cytokinins.
Kinetin and SD 8339 [6-benzylamino-9-2 (tetrahydropyran-2-yl)-9H purine] at all
concentrations (0.25, 2.5 and 25.0mg/l) and N6 benzyladenine (BA) at 0.25 and 2.5mg/l
induced 80-100% tuber formation in 90 days, althollgh at 25 mg/l BA induced only 40%
tuberization. No tuber initiation in cultures without cytokinin in the medium was observed.
Their observation was supported by further investigations of exogenous cytokinins
(Kumar & Wareing 1974; Hussey & Stacey 1984). The level of endogenous cytokinins
was high in the induced tissue (Mauk & Langille 1978) and also during the later stage of
tuber growth (Obata-Sasamoto & Suzuki 1979). However, exogenous cytokinins may also
convert a stolon into a leaf-bearing shoot (Kumar & Wareing 1972). Smith and Palmer
(1970) also reported that kinetin was effective in stimulating starch accumulation in
excised potato stolons grown in vitro.
Furthermore kinetin (1.6 x 10·2mM) induced 100% tuber formation when sucrose was
present in the medium at 6 to 10%. However, sucrose without the presence of kinetin did
not induce tuberization. Reduced temperature was partially inhibitory to the kinetin
induced response. A maximum of 50% tuber formation occurred on stolons incubated at

17
15°C for 30 days in the presence of kinetin only. The response to kinetin varied at
different temperatures of incubation. Palmer and Barker (1972) also reported that kinetin
at 2.01lg/ml induced tuberization at 18°C in darkness. In the presence of kinetin, the rate of
shoot elongation declined substantially after 7 days, which coincided with the onset of
tuber initiation. In contrast, GA3 treated, and control stolons continued to elongate
throughout the period of incubation. Stallknecht (1972) reported that kinetin (2.5mg/l)
supplemented to the medium induced smaller tubers than coumarin induced tubers.
Mingo-Castel et al. (1976) reported that 5mg/1 kinetin in the medium induces in vitro
tuberization after 30 days in culture with 94% efficiency compared to 61 % in the absence
of kinetin. The sucrose concentration was 6% in both cases. Kim (1982) stated that
2.5mgll BA in the medium induced tuberization, whereas, Wang and Hu (1982) reported
that 10mg/1 BA in the medium with 8% sucrose induced in vitro tubers in total darkness
giving an average of 30 to 35 tubers per flask of 500ml. 2.0 mg/l BA and 6% sucrose in
the medium was found to be optimal for tuberization under short days (8 hours light).
Zeatin did not stimulate in vitro tuberization even when its concentration was high (10-
5M). However, it induced an increase in fresh weight of tubers when combined with high
sucrose concentration i.e. above 4% (Koda and Okazawa 1983). The use of 10 mgll BA,
100 mg/l chlormequat or 1 mg/l Alar 85 (active constituent diminozide) in the medium
stimulated tuber development in 10 varieties tested for in vitro tuberization (Kostrica et al.
1985).
3.2.2.2. 2,4-D
Mangat et al. (1984) had reported the effect of 2,4-D on in vitro tuberization. After 15
days, the percentage oftuberization was highest at the lower concentration of 2,4-D (i.e.
10-7 and 1O-6M) in comparison to the control (no 2,4-D). Individual tuber size was greater
in cultures without 2,4-D and at higher concentrations of2,4-D long stolons rather than
tubers were observed.
3.2.2.3. Gibberellins
Gibberellins (GAs) are cyclic, diterpenoid hormones with an essential role in plant growth
18
and development. They control a variety of growth responses in higher plants, including
stem elongation, fruit set, flower induction, seed germination, and mobilization of seed
reserves (Hooley 1994; Swain & Olszewski 1996). Gibberellins are growth hormones that
affect growth and dry matter distribution in the potato tubers and have been studied
widely. Most investigators agreed that the application of gibberellins in different forms
results in shoot growth (Menzel 1980). In potato (Solanum tuberosum), exogenous
application of GAs has a strong inhibitory effect on tuberization (Okazawa 1960; Tizio
1971). Harmey et al. (1966) had reported that GA3 inhibits in vitro tuberization while IAA
and maleic hydrazide (MH) stimulates it. The application of gibberellin inhibitors also has
the reverse effect on tuberization (Bodlaender 1964; Kumar and Wareing 1974).
Bottini et al. (1981) reported that an increased level of endogenous GA3 was found in CCC
treated plants and that GA3 delays tuberization in vitro. The sprouts cultured in a medium
containing 1 ppm GA3 did not tuberize at all. On the contrary they formed thin and highly
branched stoloniferous shoots which is a typical effect of this phytohormone.
Gibberellins are known to prevent tuber formation, even when other conditions are tuber
inducing as in the presence of high sucrose being one of the inducing factors in the
tuberization medium (Koda and Okazawa 1983; Vreugdenhil and Struik 1989).
Tuber fOlmation in potato is promoted by short photoperiods, cool temperatures, and low
rates of nitrogen fertilizer (Ewing 1990). GA activity was shown to decrease when leaves
were exposed to short days (Pont-Lezica 1970; Kumar & Wareing 1974), with as few as
two short days being sufficient to cause a decline in the GA activity of S. tuberosum subsp.
andigena leaves (Railton & Wareing 1973). It was shown that changes in GA activity
occurred not only in response to photoperiod, but also to the other environmental
conditions that affect tuberization. (a) High temperatures increased GA activity in buds
(Menzel 1983). (b) A continuous supply of nitrate in the hydroponic solution increased
GA activity in shoots and prevented tuberization (Krauss & Marschner 1982). (c) A
decrease in GAl level was observed when the stolon tips started to swell in in vitro
cultured single-node cuttings grown in a high-sucrose tuber-inducing medium (Xu et al.
1998). Furthermore, tuberization was improved by the application of inhibitors of GA
synthesis such as paclobutrizol or ancimydol (Menzel 1980; Hussey & Stacey 1984;
Ewing 1995; Jackson & Prat 1996).
3.2.3. Environmental and other factors
3.2.3.1. Ethylene
The role of ethylene on tuberization of potato has been a controversial issue. Some
scientists believe it induces tuberization while others feel it inhibits the tuberization
process. Bodlaender (1964) showed that the effect of ethrel depended very much on the
concentrations tested.
19
The tuberization process involves inhibition of axial growth and increase in radial
expansion ofthe tuber (Jolivet, 1959). Garcia-Torres and Gomez-Compo (1973) were the
first scientists who studied the effects of ethrel on in vitro tuberization of etiolated potato
sprouts, which was considerably advanced by a dose of 50 ppm ethrel. Ethrel also
increased the number of tubers, produced shorter and thicker stolons and reduced root
development. Some ofthese effects are opposite to those induced by gibberellic acid,
which is known to retard tuberization and promote elongation. When both substances were
simultaneously supplied to the medium they showed a clear antagonistic interaction. The
effect was reduced stolon elongation, increased stolon thickness and reduced root
development.
Palmer and Barker (1973) published a contradictory report on the action of ethylene. The
response of potato stolons, cultured in vitro, when ethylene was applied at 0.067,0.67 and
67!!M was that no tuber formation resulted, as in the control. They also reported that
ethylene influenced stolon growth but this may not be directly related to tuber initiation.
3.2.3.2. Carbon dioxide
Mingo-Castel et al. (1974) reported the findings that CO2 stimulated tuberization of
isolated potato stolons cultured in vitro. The stimulatory effect of CO2 is inhibited by
ethy lene, which is by itself also inhibitory to tuberization. There is an antagonistic action
of CO2 and ethylene on tuberization in vitro but CO2 and kinetin that was required for
tuberization were both inhibited by ethylene. CO2 could not overcome the ethylene
inhibition. Ethylene totally prevented root formation and development, inhibited stolon

20
elongation, and caused thickening and diageotropic growth of the stolon. In addition,
ethylene prevented the accumulation of both starch and red anthocyanin, which are often
present in the tuber. Three to five days of exposure to CO2 were required to obtain
induction oftuberization of stolons cultured in vitro. Bicarbonate ions did not alter starch
synthetase activity isolated from potato tubers in vitro. Koda and Okazawa (1983) reported
that gibberellin inhibited tuberization while the application of either ethrel, (2-chloroethyl
phosphonic acid) or l-aminocyc1opropane-l-carboxylic acid caused diageotropic growth
habit of the lateral shoot, but failed to induce tuberization at any of the concentrations
tried.
Hussey and Stacey (1984) found that the restriction of gas exchange inhibited tuberization
under a wide range of conditions and that ethylene accumulation appeared to be the major
factor in in vitro tuber initiation and growth inhibition.
3.2.3.3. Nitrogen
In general, a medium containing high nitrogen is inhibitory to in vitro tuberization,
especially the coumarin-induced ones. Compounds containing reduced nitrogen also
inhibit tuberization. Stallknecht and Farnsworth (1979) and Wattimena (1983) found that
low nitrogen (2.5mM) in both the explant and the tuberization media was best for
coumarin-induced tuberization. No tubers were formed ifhigh nitrogen (60mM) was
present in both explant and media. The inhibitory effect of nitrogen can be partially
relieved by using a high concentration of sucrose (Okazawa 1967). Stallknecht and
Farnsworth (1979) found that the inhibition of coumarin-induced tuberization at
intermediate levels of nitrogen could be overcome by adding 12% sucrose but not 6%
sucrose. Cytokinin-induced tuberization was not sensitive to the inhibitory effect of a high
nitrogen level in the medium. Whether reduction in nitrogen level in the medium will
further improve cytokinin-induced in vitro tuberization rate has been tested (Palmer and
Smith 1969; Wang and Hu 1982).
3.2.3.4. Mineral ions
The importance of the chemical environment in multiplication and microtuber induction in

21
vitro has been demonstrated for potato. Mineral composition as a chemical environment is
an important component of tissue culture media. There are few reports on the effect of
mineral nutrition during microtuberization. It has been shown that mineral nutrition
together with nitrogen strongly influenced the development of potato microtubers in vitro
(Sarkar and Naik 1998). It is, however, difficult to explain the differential effect of mineral
nutrition in association with inorganic nitrogen on microtuberization. Processes associated
with supplying minerals to plantlets in vitro have recently been investigated (Williams
1992,1993, 1995). An extension of this work in the present thesis is to clarify the effects
of minerals in microtuberization per se rather than in growth of plantlets.
3.2.3.5. Activated charcoal in medium
The presence of activated charcoal in nutrient media promotes cell and tissue culture by
the adsorption of various inhibitory metabolites or other substances released during growth
(Fridborg et al. 1978; Drew 1979).
It was suggested that charcoal probably affects the nitrogen biochemistry and
ammonium:nitrate ratio inside the plant, for it has been shown that nitrogen nutrition
strongly influences the development of microtubers (Garner and Blake 1989). Also, the
first stage in the sequence of anatomical events in tuber initiation is the change from
longitudinal to radial cell enlargement (Booth 1963), followed by radial cell division
(Plaisted 1957). The possibility that activated charcoal interacts in these stages cannot be
ruled out.
Bizarri et al. (1995) reported the effects of activated charcoal in hormone-free MS medium
supplemented with sucrose (8%, w/v) compared to medium containing growth regulators
(cytokinins, polyamine biosynthesis inhibitor and chlorocholine chloride) used for
microtuber induction and development. The results showed that the cultivars exhibited a
wide range of variations in the mean weight of microtubers, and nearly all plants produced
tubers. Medium containing activated charcoal gave the highest rate of tuberization and the
largest microtubers. Thus, they suggested that activated charcoal (0.2%, w/v) played a role
in optimizing conditions for rapid, mass tuberization, and produced large microtubers for
field planting.

3.2.4. Effect of growth conditions
3.2.4.1. Photoperiod and light quality
22
Light requirements for in vitro tuberization varied among different reports. Some used
continuous light, or alternating light, others alternating light and darkness with continuous
darkness. In general, at 20 to 25°C, darkness, or continuous low light intensity «500 Lux)
is known as the most effective for in vitro tuberization.
Barker (1953) for the first time described a comparison on induction of tubers in the dark
and under continuous illumination. Lawrence and Barker (1963) found that their culture
produced tubers only under continuous darkness or continuous darkness interrupted with a
low light intensity. Wang and Hu (1982) reported that a low light intensity of 100 lux for 8
hours is the optimum for in vitro tuberization. Schilde (1982) found that microtuber
production was faster when plantlets were induced to tuberize in the dark rather than an 8-
h photoperiod. Stallknecht and Farnsworth (1982) also produced microtubers under
darkness. Thieme and Pett (1982) observed in vitro tuberization when the photoperiod was
less than 12 h. Sattelmacher and Marschner (1978) and Mares et al. (1981) selected a 12-h
photoperiod to carry out their tuberization research. Hussey and Stacey (1981) observed
that microtubers were formed in cultures incubated for 16- and 24-h photoperiods, but not
an 8-hphotoperiod. Wattimena (1983) used 0,8,01',24 h of light per day and concluded
that the longer the photoperiod, the better the tuberization. But almost all the
experimenters induced tubers in the dark for their research (Claver 1956, 1967, 1977;
Stallknecht 1972; Palmer and Smith 1969, 1970; Mingo-Castel et al. 1974,1976; Schilde
et al. 1982, 1984; Estrada et al. 1986; Koda and Okazawa 1983; Mangat et al. 1984).
Hussey and Stacey (1984) obtained results further supporting the general view that
darkness is better for in vitro tuberization.
An intensity of 800 lux was used by Hussey and Stacey (1981). A slightly lower intensity
was used by Wattimena (1983). Wang and Hu (1982) used a very low intensity of 100 lux
and found that 35.4 microtubers were produced in each culture flask at this intensity,
compared to 27.3 and 13, at 1 and 4 kilolux respectively. The above discrepancies may
have partially resulted from whether or not cytokinin was used in the culture medium by
various workers. It seems that a longer photoperiod with higher light intensity is required

23
when cytokinin is not used. The reason for such a light requirement is still obscure.
In 1959, Makronosov et al. showed that a night break of 20 min in the middle of a dark
period of 14h inhibited tuber formation in Solanum tuberosum L. cv. Larch and in
Solanum demissum. Much later, phytochrome involvement in this response was confirmed
by showing reversibility of the inhibitory red light break effect by subsequent far-red
irradiation (Batitus and Ewing 1982). Recently Solanum tuberosum ssp. Andigena
expressing the potato P HYB cDNA displayed a typical response of photoperiodic
regulation of tuber formation (Jackson et al. 1996).
Wild species of Solanum, such as S. demissum or S. tuberosum ssp. Andigena, represent an
ideal model for studies of photoperiodic control of both flowering and tuber formation. In
long days (LD) they flower and in short days (SD) they form tubers (Konstantinova et al.
1991). Phytohormones are one of the signals that could take part in transducing the effects
of photoperiod on growth and morphogenesis, as was demonstrated in the case of tuber
formation using night break as an experimental tool (Machackova et al. 1998). Plants
grown under night break displayed many growth characteristics intermediate between SD
and LD. Under LD and night break regimes ABA levels in all organs were about one
fourth of those under SD. An opposite trend was found for gibberellin content: it was very
low in SD-grown plants and 4-10 times higher under both other conditions with the
exception of roots and stolons in night break. The levels of free indoleacetic acid and
cytokinin were high in LD- and night break-grown plants and much lower in SD-grown
plants, including tubers.
3.2.4.2. Temperature
Palmer and Smith (1970) found that at a temperature of 15°C no tuber induction was
achieved and at 35°C complete inhibition oftuberization occurred. Okazawa (1967) found
that temperature below 12°C was strongly inhibitory. Temperature over 28°C became
inhibitory. According to Hussey and Stacey (1981), the optimal temperature range was 20-
25°C with slightly faster tuberization at 20°C. However, Thieme and Pett (1982) obtained
their in vitro tubers at 8 to 10°C, and Wattimena (1983) detected only slight reduction in
tuber formation at lOOC compared to the optimal temperature of 15°C. Most workers

24
chose 20°C (Sattelmacher and Marschner 1978; Mares et al. 1981) or 25°C (Stallknecht
and Farnsworth 1982; Mingo-Castel et al. 1974, 1976, 1976) for their in vitro tuberization
studies. Neverthless the optimal temperature determined by Wattimena (1983) was 15°C.
He suggested the reason for the low temperature becoming the tuber-inducing agent was
that the high intensity of light might have resulted in a higher actual temperature inside the
culture vessels.
3.2.4.3. Carbon sources and osmotic control
The carbon source in the medium is a very important factor for in vitro tuberization.
Sucrose concentrations in the medium used vary from 2% to 12% in different reports.
Gregory (1956), working with one-node stem pieces from induced and non-induced
Kennebec potato plants, reported tubers from induced materials on 3% sucrose in a solid
medium beginning after 4 days. The non-induced materials tuberized within 25 days on 3-
10% sucrose. Okazawa (1955) found no tubers from stem cuttings on solid media with 2-
4% sucrose. However, tubers formed when the level was raised to 6-10%. Gregory (1965)
concluded that sugars are necessary as energy sources for enlarging tubers. He doubted
that sugar is the direct determining factor for tuber initiation, a view shared by Lawrence
and Barker (1963). Tuber formation is maximal at 8-12% sucrose (WN) on modified
White's (1943) solid medium (WS) dropping off sharply at 16% (Lawrence and Barker
1963). Palmer and Smith (1969) used only 2% sucrose in the medium and indicated that
the cytokinin concentration affected in vitro tuberization even at low sucrose
concentration. The same results were also reported by Palmer and Barker (1972), whereas
Claver (1977) obtained tubers using 2% sucrose in the medium without any additives.
Koda and Okazawa (1983) used 4% sucrose in the medium in combination with
cytokinins.
Mingo-Castel et al. (1976), Hussey and Stacey (1981, 1984), Palmer and Smith (1970)
have used 6% sucrose in the medium but they also used kinetin.
Other workers have used 8% sucrose in the medium (Wang & Hu 1982; Schilde et al.
1984; Estrada et al. 1986) with growth regulators, particularly, kinetin or coumarin for in
vitro tuberization while Lawrence and Barker (1963) used 8% sucrose alone in the

25
medium and obtained tubers. Fung et ai. (1972) reported that as the level of carbon source
increases the in vitro tuberization process is speeded up. They state that the osmotic
concentration of the medium is not the crucial factor for tuber initiation and growth, but
have not speculated on a specific role for carbohydrate in tuberization.
Fung et ai. (1972) cultured etiolated stolon nodes on White's medium to which sucrose
was added at 2,8 or 12%. The osmotic potential of the media was kept the same using
different concentrations of mannitol. Rapid tuber induction was observed on cultures
growing on 8 and 12% sucrose, but none on media to which only mannitol was added.
Only a few small tubers were formed after a great delay on low sucrose media, regardless
ofthe presence of mannitol. Thus, they concluded that microtuber induction was in
response to the high sucrose concentration, and was independent of the osmotic potential
of the medium.
The effect on in vitro tuberization of different carbon sources such as sucrose, glucose,
fructose, mannose and mannitol at concentrations ranging from 4 to 12% have been
studied in two potato clones. Sucrose at a concentration of 8% was found to be optimal for
good tuber size and number. Glucose and fructose at all the concentrations studied yielded
tubers of smaller size than sucrose. Mannose and mannitol failed to induce tuberization by
Tovar and Dodds (1987). Gamer (1987) attempted a similar experiment, when he used
mannitol to raise the osmolarity of Murashige and Skoog (1962) solid medium with 4%
sucrose to that of MS medium with 8% sucrose. He found that on media containing
mannitol microtuber induction was delayed by 4 weeks, and by the end ofthe experiment
(14 weeks), only a few microtubers had developed on that medium, compared to around
twice as many on 4% sucrose alone, and around four times as many on 8% sucrose. It was
assumed from these results that microtuber induction was inhibited by mannitol addition.
Oparka and Wright (1988) showed that sucrose uptake and its conversion to starch in
potato tuber discs was sensitive to the osmotic potential of the medium and of cells
themselves. They found that starch synthesis was optimal at 300mM mannitol, a value
remarkably close to the measured tissue osmolarity, but decreased sharply above and
below this. Gamer and Blake (1989) showed that the effect of 8% sucrose in solid MS
medium compared to 4% was to increase microtuber number and fresh weight. Khuri and
Moorby (1995) tested media containing sucrose, maltose, glucose or fructose
supplemented with 4% sucrose media, while keeping the osmotic potential of the media
constant. A concentration of about 400mM of sucrose in the medium was more suitable
for microtuber production than media supplemented with maltose, glucose or fructose.
When glucose was supplied at concentrations that had the same number of carbon atoms
as 8% sucrose, the high osmolarity inhibited microtuberization. They concluded that
sucrose acts as a suitable carbon source for uptake and utilization by the plantlets, but, at
8%, it also provides a favourable osmolarity for the development of microtubers.
3.2.4.4. Liquid medium
26
It is increasingly evident that the concentration and type of matrix used in nutrient media
can profoundly influence the response of tissue cultured in vitro (Ziv 1991). All large
scale plant propagation systems currently use semi-solid agar or similar media for the
multiplication phase of shoot buds (Aitken-Christie 1991, Levin et al. 1988). Excessive
liquid or humidity in culture vessels causes a condition known as vitrification
(hyperhydricity), in which cell walls fill with water and suffer metabolic and
morphological abnormalities (Schloupf et al. 1995). Because vitrification leads to severe
growth reduction, if not death, it has been acceptedas dogma that shooty cultures can
neither be maintained nor multiplied in submerged liquid cultures. Traditionally, liquid
cultures, whether in small flasks or in large bioreactors, have been used only for the
growth of highly dispersed non-morphogenic cell lines of embryogenic cultures.
There is now a proprietary procedure that prevents vitrification and allows growth of a
great variety of species in liquid media (Ziv 1991).
Growth in liquid medium offers the following advantages:
(1) Growth as well as handling of the cultures is simpler and more efficient. This enables
saving in space, time, and labor.
(2) Accurate monitoring and control oftemperature, pH, carbon dioxide, oxygen, and
ethylene in the bioreactors provide more uniform growth conditions.
(3) Contamination is minimized, since the automated bioreactor and the bioprocessor are
integrated and maintained in a single, closed, sterile system. The plant material is

neither handled directly nor exposed to a non-sterile environment during incubation
and transfer.
27
(4) Production in a large-scale bioreactor is more easily automated than it is in small,
individual culture vessels. It is also easier to automatically transfer cultures, or nutrient
media, in and out of a large vessel than from many individual flasks.
Work has been done on the advance of process developments of a large scale propagation
by meristem and shoot-tip culture (Escalada & Garcia 1982; Goodwin et al. 1980; Roca et
al. 1978; Henshaw & Roca 1976; Morel 1975; Roca 1975; Murashige 1974) and
proliferation by axillary shoots developed from in vitro cultured nodal cuttings (Espinoza
et al. 1984; Hussey & Stacey 1981; Roca et al. 1978; Nozaran et al. 1977). It has been
shown that the important factor influencing microtuberization is a multiplication step to
optimize in vitro shoot growth to obtain high quality potato seed tubers (Bryan et al.,
1981; Copeland 1982). Considerable research has been done on the nutritional (Wetherell
and Dougall 1976; Dougall 1981; Avila et al. 1994) and honnonal (Singha 1982) aspects
of culture media preparation; however, the physical state of the culture media and its
effects on the mechanisms that regulate explant growth have received less attention
(Singha 1982). It has been observed that liquid or low-agar concentration media increase
the growth of certain species cultivated in vitro (Singha 1982; Debergh 1983; Rossel et al.
1987). Low-agar concentration media increased root and shoot growth of apple plantlets
cultivated in vitro (Romberger and Tabor 1971; Singha 1982). Liquid media increased the
growth of cv. Spunta two-fold (Rossel et al. 1987), but up to now the growth mechanisms
have not been elaborated upon. Previous findings indicate that the improved growth in
species cultivated in liquid or low-agar concentration media is caused by greater
availability of water (Bouniols, 1974; Debergh, 1983) and nutrients (Singha 1982;
Debergh 1983). This availability may be induced by a lower resistance to diffusion of
materials released from plant cells and closer contact between the explant and the culture
medium (Romberger & Tabor 1971; Hammerschlag 1982; Singha 1982; Pierik 1990).
However these effects have not been fully proven yet.

28
4. Invertase activity
Plant tissues are either net exporters of carbohydrate (source organs) or net importers (sink
organs). Various types of sink organs range from those that are metabolically highly
active, such as meristems and young developing organs, to storage organs such as fruits,
seeds, and tubers. The factors governing the distribution of photo assimilate between the
various types of sink organs is a central question in plant physiology, particularly given
the importance of sink organ productivity for agriculture. The capacity of a sink to draw in
and metabolize photo assimilates seems in competition with the other sink organ.
In the majority of agriculturally important plants sucrose is the end product of
photosynthesis in source organs, and is the form in which carbohydrate is distributed
through the sieve element systems to sink organs. The initial cleavage of sucrose in sink
organs proceeds either by invertase or sucrose synthase. In potato tubers, the vast majority
of sucrose degradation is catalyzed by sucrose synthase and invertases play only a modest
role, if any.
Invertase (~-D-fructofuranosidase, E.C.3.2.1.26) is a highly polymorphic glycoprotein that
cleaves sucrose into hexose sugars (Myrback 1960). Investigation of plant tissues has
revealed more than one activity of invertase on the basis of pH optima, isoelectric points,
solubility characteristics and intra or extra-cellular localization. In plants, invertases can be
separated on the basis of pH optima into two groups, acid and alkaline. The soluble
alkaline invertase is thought to reside in the cytoplasm (Ricardo and ap Rees 1970). Two
types of acid invertase have been observed: a soluble (vacuolar) and a particulate form
(apoplasmic or cell-bound). In dicotyledenous plants these compartment-specific isoforms
are encoded by separate genes. The role of acid invertases in plants is complex and may
change in response to developmental (Strum et al.1995) and environmental signals such as
wounding (Matsushita and Uritani 1974; Strum and Chrispeels 1990), gravitropism (Wu et
al. 1993) and pathogen infection (Strum and Chrispeels 1990; Tang et aI.1996). Acid
invertases are considered to be important in growth, providing tissues with hexoses as a
source of energy and carbon. In developing seeds of fava bean (Vicia Java) apoplasmic
invertase in the seed coat is thought to result in a high concentrarion ofhexoses which are
taken up by the developing embryo (Weber et al. 1995). In some plants root apoplasmic

29
invertase is thought to facilitate phloem unloading by maintaining a steep sucrose gradient
between source (photosynthetic cells) and sink (heterotropic cells) regions ofthe plant
(Eschrich 1980; Morris and Arthur 1985). In other plants, such as carrot tap roots, where
phloem unloading occurs at least partially through membrane-located pumps (Daie 1984;
Hole and Dearman 1994), sucrose synthase, located in the cytoplasm, and vacuolar acid
invertase are considered to be more important in generating and maintaining the sucrose
gradient between source and sink tissue (Strum et al. 1995). Recently, vacuolar invertase
activity has been reduced in the fruit of tomato using antisense technology in order to
examine the role of soluble acid invertase in determining the sugar composition of tomato
fruit (Ohyama et al. 1995). Red ripening tomatoes accumulate hexose as a result of
hydrolysis of sucrose by either intracellular invertase or sucrose synthase. In transgenic
tomato fruit where invertase activity was low sucrose content was markedly elevated when
compared to wild-type fruit, clearly showing that the high activity of acid invertase in non
transgenic/normal ripening fruit prevents the accumulation of sucrose. An antisense
approach has also been used to reduce acid invertase activity in potato tubers (Zrenner et
al. 1996). In these plant vacuolar invertase appeared to control the hexose:sucrose ratio in
cold-store tubers.
In order to investigate the importance of the sucrose cleavage step for sink strength,
Sonnewald et al. (1997) expressed yeast invertase in transgenic potato tubers using a
tuber-specific promoter. Although there is strong evidence that the unloading of sucrose
from the phloem into tuber storage-parenchyma cells proceeds by direct cell to cell
transfer through plasmodesmata (symplastic unloading), there is still a possibility that
some sucrose moves into parenchyma cells via the extracellular space (apoplastic
unloading) (Oparka et al. 1992). Sonnewald et al. (1997) therefore decided to construct
two transgenic potato lines, one where the invertase was expressed in the cytosol and a
second where the invertase was targeted to the apoplast of potato tubers. The yeast
invertase has previously been expressed in the cytosol and apoplast of potato, tobacco, and
Arabidopsis plants using the 35S promoter to confer constitutive expression (von Shaewen
et al. 1990; Sonnewald et al. 1991; Btisis et al. 1997). Sonnewald et al. (1997) showed
that expression of the invertase in the cytosol led to a reduced tuber size and increased

30
tuber number per plant, whereas localization in the apoplast resulted in a marked increase
in tuber size and a decrease in tuber number. So, they suggested sink organ size could be
manipulated through modification of sucrose metabolism.
5. Maltose as a carbon source in liquid medium
For in vitro culture of plant tissues, sucrose is generally regarded as the standard
carbohydrate component of culture media (Evans et al. 1981; DunwellI985). However,
for the development of embryos and green plants from anthers, microspores and cultured
cells of a number of plant species, maltose has been shown to be better than sucrose,
glucose or fructose. Embryogenesis from anthers of Solanum tuberosum L. (Batty and
DunwellI989), Triticum aestivum L. (Last and Bretelll990; Orshinky et al. 1990),
Hordeum vulgare L. (Hunter 1988), and somatic embryogenesis from Brassica napus L.
and Brassica oleracea L. protoplasts (Loudon et al. 1989) and Medicago sativa L. calli
(Strickland et al. 1987) are some examples where maltose instead of sucrose, glucose, or
fructose in the culture medium led to an increase in the number of embryos or plants
regenerated from cell cultures. These observations are remarkable since sucrose is the
dominant source of energy and carbon supplied to non-photosynthesizing plant tissues
(Hawker 1985), whereas maltose plays only a minor role in plant carbohydrate
metabolism. Thus, sucrose would be expected to be a better carbohydrate source than
maltose for embryogenesis from anthers, and growth of calli. Furthermore, when sucrose
is supplied to non-photosynthetic plant tissues, it is frequently hydrolyzed by cell wall
invertases to glucose and fructose before entering the cells in which it is metabolized
(Lucas and Madore 1988). Hence, glucose and fructose would also be good carbohydrate
sources for supporting growth of cultured plant cells. In contrast, maltose is not known to
be supplied to non-photosynthetic plant cells; therefore, it would not be a better
carbohydrate source than sucrose, glucose or fructose for the culture of plant tissues.
The different effects of sucrose, glucose, and maltose upon embryogenesis have been
studied in greater details in barley (Sovari and Schider 1987; Hunter 1988; Finnie et al.
1989). Hence, barley is the best species to investigate further the different effects of these
sugars upon embryogenesis. However, the majority of the work on barley has been with

31
anthers, which are made up of a number of different tissues, such as microspores, phloem
tissue and the tapetum cell layer. Since microspores can be readily isolated from barley
anthers experiments on cultured microspores should be ideal for clarifying these previous
observations. Only limited work has been performed with barley microspore culture
(Hunter 1988), but the available results suggest that maltose is the better carbohydrate
source than other sugars for embryogenesis from microspores, as it is for anther culture. In
Abies alba, maltose was found superior to sucrose and glucose in terms of formation of
mature embryos (Hristoforoglu et al. 1992). Early experiments with Abies normanniana
had also indicated that maltose was superior to sucrose (N0rgaard and Krogstrup 1991,
N0rgaard 1992) but quantitative documentation was insufficient. Scott and Lyne (1994)
showed the effect of maltose using isolated microspores of Hordeum vulgare L. cv. Igri in
the presence of different sugars. Incubation of microspores in the presence of sucrose,
glucose or fructose resulted in the death of cells via some unknown toxic mechanism. In
contrast to this, maltose can sustain deVelopment of embryoids and calli from cultured
microspores. The only two enzymes known to metabolize maltose in plants are a
glucosidase and maltose phosphorylase. The former yields glucose and the latter produces
glucose and glucose I-phosphate. Finnie et al. (1989) suggested that the rate at which
sucrose was metabolized was the cause of the above observations but no data were
available for that hypothesis. Scott et al. (1995) found that cultures on sucrose differed
from those on maltose in that there was a significant accumulation of ethanol and a lower
adenylate energy charge. It was suggested microspores cultured on 40 mM sucrose die
because they metabolize the sugar rapidly, become hypoxic and, as a result, accumulate a
large quantity of ethanol within the cells. Metabolism of maltose is slower and there is
sufficient oxygen available to allow cells to survive in culture.
N0rgaard (1997) confirmed maltose was superior to sucrose in terms of the number of
mature somatic embryos of the conifer Abies nordmanniana formed as well as their
germination percentage. Optimum maltose concentrations varied between 3.4 and 4.3%,
but mixtures of glucose and maltose did not show as good results as pure maltose.
Khuri and Moorby (1995) tested media containing sucrose, maltose, glucose or fructose
supplemented with 4% sucrose media, while keeping the osmotic potential of the media

32
constant. A medium concentration of about 400 mM with only sucrose was more suitable
for microtuber production than media supplemented with maltose, glucose or fructose.
When maltose was supplied at concentrations, which had the same number of carbon
atoms as 8% sucrose, microtuberization was not inhibited. Although they concluded that
sucrose at 8% acts as a suitable carbon source for uptake and utilization by the plantlets,
the same concentration of maltose also provides a favourable carbon source for the
development of microtubers.
In their experiments, the effect of maltose was not clear because all the media they tested
were supplemented with 4% sucrose, so the effect seems to produced by a mixture of
sucrose and maltose not maltose alone.
6. Genotypic Differences
The discrepancies between the findings from papers are probably due at least in part the
use of different genotypes. Mostly, the genotypes exhibited a wide variation in harvest
index in response to applied treatments.
The effect of liquid and solid media on the growth of micropropagated potato shoots (cvs.
'Spunta', 'Kennebec' and 'Huinkul') was studied in relation to the availability of nutrients
and water in the culture medium (A vila ef [(7. 1996). Despite of the difference in cultivar,
similar trends were observed in that all the plantlets showed marked increases in
elongation and dry weight in liquid rather than in solid medium. The effects of activated
charcoal on induction and development of microtubers in potato (Solanum tuberosum L.
cvs. 'Monalisa', 'Primura' and 'Spunta') were studied by Bizzari et al. (1995). The
cultivars showed wide variations in the mean weight of microtubers, ranging from 44.6mg
(cv. 'Primura') to 77.5mg (cv. 'Spunta'), and nearly all plants produced tubers. But they
concluded that medium containing activated charcoal gave the highest rate of tuberization
and largest microtubers. The qualitative and quantitive aspects of the production of potato
microtubers (Solanum tuberosum L.) were also studied in a two-phase system
(Defemandez et al. 1995). Nodal cuttings of cvs. 'Spunta' and 'Bintje' were grown on
solid MS medium and then liquid tuberization medium added on top of it. The results
showed that the two-phase (overlayering the 60ml of solid propagation MS medium with

33
45ml of modified MS tuberization liquid medium) optimized the microtubers' weight
(769.5mg for cv. 'Spunta' and 498.1mg for cv. 'Bintje') and decreased the percentages of
abnormalities for both cultivars.
Rapid induction of microtubers was observed in the micropropagated, layered potato
shoots of cvs. 'Kennbec', 'Russet Burbank' and 'Superior' in medium devoid of growth
regulators (Leclerc et al. 1994). However, the microtuber weight per shoot was
significantly influenced by cultivar, culture type, and growth regulator and by both
cultivar-culture type and cultivar-growth regulator interactions. Layered shoots of cvs.
'Russet Burbank' and 'Superior' produced significantly greater microtuber weight and
number per shoot than cv. 'Kennebec'.
The effect of the use of growth retardants to improve micro tuber formation on potato
(Solanum tuberosum L. cvs. 'Arran Banner', 'Cara', 'Caribe' and 'Spunta') was studied by
Harvey et al. (1991). They showed that 50% ofthe nodal segments cultures ofcv.
'Desiree' tuberized in the absence of chloromequat and this was increased to 100% by
inclusion of 10-3M chloromequat in the medium whereas all nodal segments of cv. 'Cara'
tuberized in the absence of chloromequat and its addition reduced the percentage of
cultures that tuberized.
The induction of in vitro tubers in a broad range of potato genotypes was reported by
Estrada et al. (1986). It was shown that the formation of in vitro tubers was induced in
over 50 different genotypes possibly.

34
7. Aim and Scope of this Research
From the literature review, there does not seem to be a shortage of findings concerning the
factors that influence at least some aspects of microtuberization. It is particularly notable
that many studies took advantage of isolated potato stolons as a simple experimental
system for basic investigations into microtuberization. In these studies, quantitative data
about aspects of microtuberization in relation to effects of plant growth regulators or other
factors could usually be obtained rather conveniently.
From the applied research point of view, a two-step process such as that described by
Leclerc et al. (1994) and several other researchers is more appropriate for further research.
This comprises first growing in vitro plantlets from nodal explants and then introducing
microtuber formation on the plantlets, both steps being in liquid media without the need
for any exogenous plant growth regulators.
Research is needed to improve this process so that it will be a practical, efficient and cost
effective means to mass produce microtubers that are big enough to compete with field
produced seed potatoes for planting out. The long-term aim is for automation of this
process.
The goal of the present research is to fill in some knowledge gaps in a two-step practical
process towards the production of more and larger microtubers. One main problem
emerging from the literature review is that it is not clear whether the findings on tuberizing
isolated stolons can be applied meaningfully to a more complex two-step tuberization
process. Also, our understanding of the microtuberization process is incomplete due to a
lack of precise information on the changes of the medium. This might seem insignificant
as it would be expected that at some point of in vitro culture the medium components will
be depleted. Neverthless, a time course study of changes in sucrose in the medium, for
example, might shed some new light on the relationship between carbohydrate supply and
timing of microtuber initiation, microtuber growth and timing of cessation of microtuber
development, and may even yield new experimental opportunities to optimize the
microtuberization process further. At present, it is not clear whether sucrose in the medium

is required for all these aspects or only certain aspects of the microtuberization process.
However, it is particularly important to determine precisely the relationship between
sucrose status in the medium and, for example, cessation of microtuber development. If
sucrose depletion is correlated with cessation of microtuber growth, it would then be
interesting to see the outcomes of refreshing the medium at predetermined time points.
35
Finally, most published studies on a two-step process of micro tuber formation are
complicated by not studying the effects of experimental manipulations or medium changes
with due regard to the distinct nature ofthe two steps involved. For instance, in the study
of Khuri and Moorby (1995), the nodal explants were placed right from the beginning of a
two-step process on a medium containing 8% sucrose, which is known to induce
microtuberization. Not only could there be potential problems for plantlet growth in this
initially high concentration of sucrose, but also it is not possible to determine how much
direct influence the medium had on the different aspects of microtuberization. This and
associated problems have been addressed in this research.

36
II. MATERIALS AND METHODS
1. Stock culture and Propagation of Plant Materials
In vitro potato stock plants (Solanum tuberosum L. cv. Iwa and cv. Daeji) were regularly
propagated from nodal cuttings every 6-8 weeks on MS basal medium (Murashige and
Skoog 1962) supplemented with 30g! 1 (w/v) sucrose and solidified with 7g1 1 (w/v) agar.
All media in this work, unless indicated otherwise, were autoclaved (20 min., 121°C) after
the pH was adjusted to 5.8. A single nodal segment from a previously propagated stock
plant culture was placed in a clear polycarbonate jar (64mm IDx80mm, total capacity of
250 ml) containing 40ml of the medium. All cultures were incubated at 23°C under
continuous irradiation of60 I1mollm2/s at the top of the vessels from fluorescent lamps
(Philips).
2. Systems for microtuberization
2.1 Bubbling Jar Culture
Step 1: Multiplication
A 'home-made' screw-capped jar fermentor (total capacity of 1 liter) with sintered glass
bubbler was used in a 2-step procedure for microtuberization. Twenty segments of single
nodes excised from stock plants of 'Iwa' were transferred into the jar fermentor containing
200 ml of full-strength MS basal medium and 30 g II sucrose without plant growth
regulators. Explants were cultured with continuous sterile air supply (flow rate, 200
ml/min through 0.48 11M Millipore cellulose acetate membrane filter) at 25°C for 4 weeks
under continuous light.
Step 2: Microtuberization
The medimn was drained and refilled with 600 ml of growth regulator-free MS basal
medimn containing 80 gil sucrose. Jars were aerated with sterile air (flow rate, 200
mllmin) at 20°C in the dark.
2.2 Shaking flask culture
Aliquots of 20m 1 of the MS basal medium supplemented with 3% sucrose were dispensed

37
into 100 ml conical flasks. After autoclaving, three excised shoot tips from stock plant
cultures of 'Iwa' were placed in each culture vessel. Culture vessels after inoculation with
explants were left stationary for 3-4 days, and then they were placed on a reciprocal shaker
having 30 oscillations per minute in a culture room at 25 °C with continuous light for 4
weeks. For microtuberization, the medium was drained and refilled with 40 ml of the MS
basal medium supplemented with 8% sucrose. The cultures were kept on a reciprocal
shaker having 30 oscillations per minute at 20 °C in complete darkness for 10 weeks.
2.3 Solid-liquid binary culture
Solid culture was performed as described for stock plant culture propagation for the first 4
weeks in the light at 25 °C before 50ml of MS liquid medium containing 8% sucrose were
added for microtuberization. This binary culture system was kept at 20 °C for 10 weeks in
complete darkness.
2.4 Slanting jar culture and Depth control (Stationary culture)
Three shoot segments each with 2 nodes that were excised from the stock plants were
transplanted into clear polycarbonate jars (64 mm IDx80 mm), each containing 20 ml of
the MS basal medium with 4% sucrose. After shoot generation within 2 weeks, the jars
were slanted by about 15 degree to submerge the bottom part of the plantlets into liquid
medium up to 4 weeks under continuous light. Then the medium was drained off and
refilled with 50 ml of the MS basal medium containing 8% sucrose. The cultures were
then incubated at 20 °C in darkness for 10 weeks.
3. Plant multiplication: Basal or Standard protocol
Three stem segments, each comprising 2 nodes, were excised from the previously
propagated stock plant culture and were transferred to the same type of polycarbonate jars
containing 25 ml MS liquid culture medium. This medium comprising full strength MS
hormone-free medium was supplemented with 30 gil sucrose. The pH ofthe medium was
adjusted to 6.0 before autoclaving at 121 °C for 20min.

38
Cultures were kept in a growth room at 23°C, illuminated with fluorescent tubes (Philips)
giving an average irradiation of 60 ).tmol/m2/s at the top of the vessels. Explants were
cultured for 4 weeks before the tuberization phase began.
4. Changes during plantlet multiplication
For the time course experiments, all the plant materials in polycarbonate jars were
harvested weekly and their fresh weights were recorded. Then the dry weights of the
plantlets were obtained after 24 h in an oven at 80°C. Media samples (20ml) were also
collected and stored at 4 °C for monitoring the changes in carbohydrates, pH and invertase
activity. Three independent determinations were carried out to get the average value.
5. Variations to the standard multiplication protocol
5.1 Different carbohydrate treatments
MS basal medium was supplemented with or without, 30 g/ I sucrose or 30 gil maltose.
The sugar solutions were filtered through 0.22 flM membrane filters (type GS, Millipore
Corporation, U.S.A.) before being added to the rest of the autoclaved liquid MS medium
for shoot multiplication. After 4 weeks of the multiplication phase, the plantlets were
subjected to the standard tuberization protocol for 10 weeks. The effect of the two
variations, sugar-free and maltose, compared to the standard protocol (3% sucrose) on
changes during multiplication as well as possible effects on the number of microtubers
formed, and their weight distribution were studied.
5.2 Replacement of the standard multiplication medium
The effect of replacing the medium during multiplication on the subsequent
microtuberization process was evaluated in relation to average microtuber weight, number
of microtubers formed, microtuber weight distribution and carbohydrate changes during
multiplication. In this experiment, after 2 weeks of culture the standard multiplication
medium was drained off and replaced by 25 ml of fresh standard multiplication medium as
per the protocol. One week later, the medium was again replaced. Seven days later, the
plantlets were transferred to the standard microtuberization protocol.

39
6. Microtuberization: Basal or Standard protocol
After 4 weeks of the plantlet multiplication phase, the residual medium was drained off
and replaced by SOml of microtuberization medium at pH 6.0 consisting of full-strength
MS basal salt and organics solution containing no growth regulators, supplemented with
80 g/ I sucrose for tuberization. All the cultures were incubated at 20°C in darkness for 10
weeks.
6.1 Time course of microtuber initiation and growth
For the time course experiments, microtubers were harvested weekly, and fresh weight of
individual microtubers was measured. The media were also collected weekly for
measurement of pH, soluble protein contents, invertase activity, osmotic potential and
carbohydrate content.
7. Variations to the standard in vitro tuberization protocol
7.1 Varying concentration of sucrose in the tuberization medium
The variation involved addition of different concentrations of sucrose ranging from 2%-
20% to the MS basal medium. Microtubers were harvested 10 weeks following the transfer
of the plantlets from the multiplication medium to these tuberization media. The harvested
fresh microtubers were weighed individually.
7.2 Retaining old multiplication medium on tuberization
The effect of adding microtuberization media containing different concentrations of
sucrose at the end of 4 weeks of plantlet multiplication without first discarding the original
multiplication medium was studied. The cultures were harvested after 10 weeks following
the mixing of old multiplication medium with the appropriate tuberization medium.
7.3 pH variations in tuberization medium
Two variations to the pH of the standard tuberization medium, which was 6.0, were
attempted. Before autoclaving the media, the pH of the otherwise standard tuberization
40
medium was adjusted to 4.0 (the low pH variation) or 8.0 (the high pH variation). The pH
of the autoclaved media changed: the low pH medium rose to about pH 4.3 and the high
pH medium dropped to about 7.8. After 4 weeks of the standard multiplication protocol,
the plantlets were transferred to these tuberization media. The effect of the variations in
pH of the microtuberization medium was investigated in relation to number of tubers
formed, their average microtuber weight, and microtuber weight distribution.
7.4 Replacing microtuberization medium
To investigate if replacing the media during the microtuberization phase had any effect,
the standard tuberization medium was discarded and replaced with a fresh one of the same
composition at 1,2,3,4 and 5 week intervals. Microtubers formed in the different
treatments were harvested 10 weeks following the start of the microtuberization phase.
Harvested fresh microtubers were weighed individually.
7.5 Osmotically equivalent media
When required the media containing different monosaccharides were adjusted to be
osmotically equivalent to that of 8% sucrose (80 gil), using the van't Hoff law n=m/cRT
(Salisbury 1982). The molecular weights of carbohydrates used were 342 for sucrose, 180
for glucose and 180 for fructose. 8% sucrose solution has a molality of 80/342=0.234.
From the molecular weights, it was possible to calculate the amounts of other
carbohydrates to be added compared to 8% sucrose solution: 42.1 g glucose, 42.1 g
fructose and 21.05 g glucose and 21.05 g fructose mixture were added to the total volume
of 1,000 ml MS basal medium to generate media that were osmotically equivalent to the
standard microtuberization medium containing 8% sucrose.
In paper chromatography, the breakdown of sucrose was in autoclaved media detected.
Hence, each of the monosaccharide solutions was filter-sterilized using 0.22 IlM
membrane filters (type GS, Millipore Corporation, U.S.A.) before being added to the rest
of the autoclaved MS basal medium.

7.6 Media with initial carbon content equivalent to that of the 8% sucrose solution
41
In some variations to the standard microtuberization protocol, the media containing
different monosaccharides were adjusted to have carbon contents equivalent to that of the
standard microtuberization medium with 8% sucrose (80 gil). The molecular weights of
carbohydrates used were 342 for sucrose, which has a molecular formula of C12H220 11 , and
180 for glucose and fructose, which both have a molecular formula ofC6H120 6• 8%
sucrose solution has a molality of 80/342=0.234 and has double the amount of carbon in
its structure when compared to glucose and fructose. From the molecular weights, it was
possible to calculate the amounts of other carbohydrates to be added compared to 8%
sucrose: (0.234x180x2=) 84.2 g glucose, (0.234x180x2=) 84.2 g fructose. A 42.1 g
glucose + 42.1 g fructose mixture was added to total volume of 1,000 ml MS basal
medium to generate medium that had a carbon content equal to the standard
microtuberization medium containing 8% sucrose.
Each of the carbohydrate solutions was filter sterilized through a 0.22 IlM membrane filter
(type GS, Millipore Corporation, U.S.A.) and added to autoclaved MS basal medium.
7.7 Medium containing maltose
8% (w/v) maltose (analytical grade, sigma, USA) solution was tiltered, sterilized through
0.221lM membrane filters (type GS, Millipore corporation, U.S.A.) and then added to the
autoclaved MS basal medium. Both sucrose and maltose have the same molecular weight
(324) and formula ofC12H220 11 •
8. Paper chromatography and HPLC analysis of sugars
Media were collected from three jars at different stages of plantlet growth and microtuber
development and then filtered through Whatman No.1 filter paper.
Paper chromatography of sugars of the filtered media was carried out in ethylacetate
pyridine-water (10:4:3, v/v) and developed twice on Whatman No.1 paper (Hough and
Jones 1962). Sugars were visualized with a mixture of 4 g of diphenylamine in 100ml
acetone and 4ml of aniline in 96ml acetone with 20 ml of phosphoric acid as spraying

42
agent (Scott 1969). When media containing sucrose were autoclaved, traces of glucose and
fructose could be detected by paper chromatography in aliquots ofthe autoclaved media.
Changes of sugars in these media were also determined quantitatively by the HPLC
method. Sugars were separated on a 220x4.6 mm reverse-phase amino column using
acetonitrile-water (75:25, v/v) as the mobile phase (flow rate, 1.5 ml/min) at column
temperature of 30 DC. The sugar peaks were measured using a refractive index detector.
9. Preparation of invertase and soluble proteins from culture media
Media from 3 jars at different stages of culture were collected and pooled together before
being filtered through 1 layer of Whatman No.1 paper.
Several difficulties were encountered including the soluble protein contents being too low
for SDS-PAGE or IEF gel analyses and the frequent formation of precipitates during
enzyme preparation. The following attempts were made to concentrate protein and
increase the enzyme contents in solution.
1) The filtrates were dialyzed with 0.1 M sodium phosphate buffer or 0.1 M sodium
acetate buffer at 4 DC overnight and then concentrated using polyethylene glycol (MW
20,000).
2) The filtrates were brought to 70% (w/v) saturation by addition of solid ammonium
sulfate. The precipitates were collected by centrifugation at 15,000 r.p.m. for 15 min.
(Sorvall RC-5B with rotor type SS-34, Du Pont Instrument, U.S.A.), dissolved in 1ml
of 0.1 mM sodium acetate buffer (PH 5.2), and dialyzed overnight at 4DC against the
same buffer. The dialyzate containing the soluble invertase activity was stored at -20
DC until enzyme assays were carried out.
3) Desalting column preparation of invertase solution:
Desalting process was tried to prevent precipitates from the dialyzed solution. The
dialyzed solution was applied to a desalting column (3.0x5.0 cm) packed with Bio-gel
HTX (Bio-rad. Ltd.), pre-equilibrated with 0.1 mM sodium acetate buffer (PH 5.2).
10. Partial purification of invertase
The dialyzed solution was applied to a DEAE-cellulose column (1.5x30 cm), pre-
43
equilibrated with 50 mM sodium acetate buffer (PH 5.2). The column was washed with the
same buffer and then eluted with a linear gradient of 0 to 0.3 M NaCl in 500ml of the
buffer. The fractions containing active invertase were pooled and designated as medium
invertase.
11. Extraction of crude invertase from potato plantlet tissues
At specific times during multiplication and tuberization, roots and stems submerged in the
media as well as microtubers were frozen with liquid nitrogen and 5g of each sample was
ground in a mortar and pestle with 5 ml of 0.1 mM sodium acetate buffer (PH 5.2). The
slurry was squeeze-filtered through three layers of moistened synthetic cloth and the
supernatant fraction was retained following centrifuging at 15,000 r.p.m. for 15 min at 4
°C (Sorvall RC-5B with rotor type SS-34, Du Pont Instrument, U.S.A.). The supernatant
was dialyzed in the above buffer overnight at 4 °C and the dialyzate was used as crude,
cell-free invertase extracts. The enzyme extracts were stored at -20°C.
12. Invertase assay
Invertase activity was assayed by following the enzymatic release of glucose from sucrose
as substrate. Assay reaction mixture contained 200 ~l of 200 mM sodium acetate buffer
(PH 4.8), 200 ~l of filtered culture medium, and 100 )..11 of 20 mM sucrose solution.
Control was prepared containing 300 ~l of the same buffer, 200 )..11 of the filtered culture
medium but no sucrose solution. Mixed samples were incubated at 37°C from 3 h to 2
days. The release of reducing sugar was determined using the HBH reagent with glucose
as standard (Lever 1973). Following incubation, 20 )..11 of assay reaction mixture were
mixed with 5 ml HBH reagent, boiled for 5 min, and then cooled to room temperature
before absorbance at 490 run was read.
For the determination of pH optima of the enzyme activities, the following buffers were
used in the assay reaction mixture: 0.1 M sodium acetate buffer, pH 3.0-5.2; 0.1 M sodium
phosphate buffer, pH 6.2-8.0. Each data point was the average of three replicate assays.

44
13. Amylase assay
Prior to the assay, media from 3 jars of cultures were collected and pooled together before
being filtered through 1 layer of Whatman No.1 paper.
The filtrates were brought to 70% (w/v) saturation by the addition of solid ammonium
sulfate. The precipitates were collected by centrifugation at 15,000 r.p.m. for 15 min.
(Sorvall RC-5B with rotor type SS-34, Du Pont Instrument, U.S.A.), dissolved in 2 ml of
0.1 mM sodium acetate buffer (PH 5.2), and dialyzed overnight against the same buffer.
All the procedures were carried out at 4°C.
For the enzyme assay, 0.2% (w/v) soluble potato starch as a substrate was prepared fresh
before enzyme assays by heating 100 mg soluble starch to boiling in 50 ml distilled water.
Reaction mixture contained 0.5 ml of sodium citrate buffer (pH 5.0), 0.4 ml of the culture
medium and 0.2 ml of the substrate, and was incubated at 37°C for 30 min before 3ml of
iodine reagent were added to stop the reaction. Absorbance was read at 620 nm. For
enzyme control, the substrate was added following incubation of buffer and the filtered
medium at 37°C. Iodine stock for an iodine reagent was prepared by dissolving 6 g of
potassium iodide and 600 mg of iodine in 100ml distilled water. Fresh iodine reagent from
the stock was prepared by diluting 1 ml of iodine stock with 99 ml of 50 mM HCI.
14. Phosphatase assay
Phosphatase activity was assayed using p-nitrophenyl phosphate as a substrate. Assay
reaction mixture contained 0.25 ml of 0.1 M sodium citrate buffer solution (PH 5.0), 0.25
ml ofp-nitrophenyl phosphate (50 mM in the same buffer) and 0.25 ml of the medium and
was incubated at 30°C for 30 min. For control, the substrate was added after incubating
the buffer and medium for 30 min at 30 DC. 0.75 ml of 1 M NaOH was added to each
reaction mixture to stop the enzyme reaction and then the absorbance was read at 410 nm.
15. Protein quantification
The concentrations of soluble proteins in the filtered media were quantified using the
procedure of Bradford's macroassays (1976) and bovine serum albumin (BSA) was used
45
as the standard.
16. SDS-PAGE
Soluble proteins were resolved by SDS-PAGE (Laemmli 1970) which was performed, in a
'purpose-built' glass-plate apparatus using 10 to 15 % acrylamide gels. Current was
applied at 60rnA until the dye front reached the interface between the stacking and
separating gels and then the current was adjusted down to 25 rnA until the tracking dye
reached the bottom of the gel. After electrophoresis, polypeptides were visualized with
Coomasie brilliant blue R-250 (Ougham et al. 1987) and the silver stain (Ag(N03)2 )
method was also attempted (Chapman et al. 1988).
17. Non-denaturing PAGE and IEF
The procedure for non-denaturing PAGE was the same as that for SDS-PAGE except that
the gels, running buffer, and the sample buffer were free ofSDS or mercaptoethanol, and
the invertase-containing extracts (see 11) were not heated before eletrophoresis (Reisfeld
et al. 1962). The gel concentration was investigated from 10 to 15 % acrylamide for better
band resolution. Electrophoresis was carried out at 4 DC for native PAGE electrophoresis.
Current was applied at 65 mA until the dye front reached the interface between the
stacking and separating gels and then voltage was adjusted down to 200 V until the
tracking dye reached the bottom of the gel. The gels were stained for protein with
Coomasie Brilliant Blue when required.
For pI determination of invertase activity in the filtered media, thin layer isoelectric
focusing in Mini-PROTEIN II (Bio-Rad Laboratories, U.S.A.) was performed according to
the manufacturer's manual. Polyacrylamide gels containing ampholytes in the range of pH
3-10 were used. Voltage was applied at 200 V for 1.5 h and then the voltage was adjusted
to 400 V for 1.5 h Isoelectrofocusing was carried out at room temperature. After
isoelectrofocusing, the gel was cut into pieces with reference to the band position in the
lane stained for invertase activity as described in 18.3. Then the gel pieces were soaked in
50 mM KCl solution for overnight and the pH of the KCl solutions were determined.

18. Cytochemical methods for localizing invertase activity in gels 18.1 Preparation of [Ag(NH3)2r solution method
46
Preliminary trials were attempted to localize invertase activity on the native PAGE gels
using a modified cytochemical method based on [Ag(NH3)2) r. This reagent was prepared
as follows: One mol dm-3 of ammonium hydroxide was added to a 0.1 mol dm-3 solution of
silver nitrate until the initial precipitate of silver hydroxide redissolved to give a clear
solution. Sufficient glacial acetic acid (0.1 mol dm-3) was added dropwise to change the
pH either to 5.0 or to 7.0. This solution was added to sucrose (analysis grade) to give a
final concentration of 0.025 mol dm-3 and 1 % agar.
The solution was autoclaved and cooled to 45 DC, poured into sterile Petri dishes and
allowed to solidify. The preparations were kept in the dark at 4 DC until needed. A layer of
the silver agar preparation was placed over a native PAGE gel on which the enzyme was
separated and incubated for 2 hat 37 DC.
18.2 Tetrazolium salt reaction for detection of invertase activity following gel eletrophoresis
Another attempt to localize invertase on the native PAGE gels involved preparing a
tetrazolium staining solution. The staining solution 'was prepared as follows; 85 mM
citrate/phosphate buffer adjusted to pH 6.0 containing 100mM sucrose, 0.33mg/ml
phenazine methosulfate and 0.02 mg/ml glucose oxidase. This staining solution was
prepared and used in complete darkness. After native electrophoresis the gel plate was
immersed in this staining solution and incubated at 37 DC overnight. To stop enzymatic
staining the gel plate was immersed for 5 min in 10% (w/v) trichloroacetic acid.
18.3 The use of glucose oxidase, peroxidase and 3,3'-diaminobenzidine (D.A.B.) for detection of invertase activity following gel electrophoresis
Invertase activity was visualized after native gel eletrophoresis or thin layer isoelectric
focusing gel electrophoresis as described by Faye (1981). For staining the gels, the
following reaction mixture was used: 85 mM citrate/phosphate buffer adjusted to pH 6.5

47
containing 100 mM of sucrose, 0.02 mg/ml glucose oxidase (Sigma Chemical Co.,
U.S.A.), 0.12 mg/ml horseradish peroxidase (Sigma Chemical Co., U.S.A.), and 0.3 mg/ml
3.3-diaminobenzideine tetrahydrochloride (BDH Laboratory Supplies Poole, England). As
a control one of the enzyme preparations was boiled and loaded to a sample well before
the electrophoresis process. The gels were rapidly washed after electrophoresis with 85
mM citrate/phosphate buffer before incubation in the soluble staining reaction mixture.
Then the gels were incubated at 37 DC in a moist chamber overnight. To stop enzymatic
staining and to increase contrast the gels were immersed in 10% (w/v) trichloroacetic acid
solution for 5 min.
19. Ultrastructural analysis
The external morphological modifications of green and white roots, stems, tubers,
leaves and floating cells collected after the multiplication step and
microtuberization step were examined. The microplants formed in light and
microtubers formed in dark were dissected and prepared for transmission electron
microscopy. Tissues were fixed in 3.0% glutaraldehyde (biological grade) in
0.025 M phosphate buffer (PH 7.0) for 4 h or overnight at 20 DC, washed in the
same buffer and then post-fixed in 2% osmium tetroxide inthe same buffer for 12
h or overnight at 4 DC. Dehydration in acetone at 10% stages for 10 min each up
to the 90% stage, followed by three changes of 100% acetone over 1 hour and
embedding in Epon araldite epoxy resins, were carried out by standard methods.
Ultrathin sections were cut on a LKB ultramicrotome using a diamond knife,
stained with saturated uranyl acetate for 5 min and observed using a Hitachi HS-
7S electron microscope.
20. Osmotic Potential Measurements
The osmotic potentials of culture media, after filtration as described previously, were
measured and readings obtained directly from a Vapor Pressure Osmometer (5500
Wescor, Utah, U.S.A., standard deviation < 2 mmollkg). 1 III of medium was applied to a
sample disc (SS-033, Wescor, Utah, U.S.A), 6 mm diameter, following the manufacturer's

48
instructions for the Osmometer.
21. Mineral Analysis
The culture media, after filtration as described previously in 8, were sent to the Institute of
Environmental Science and Research Limited (Wellington Science Center, New Zealand)
for analysis of mineral contents via ICP mass spectrometry. The stated units used are g/m3
(or mg/I).
22. Data Analysis
The data on microtuber number and average microtuber weight were evaluated using the
Anaysis of Variance (ANOVA) of Stat isti x for Windows at a significance level p:S0.05
unless stated otherwise. Microtuber fresh weight distributions were classified according to
5 or 6 catagories (:S0.25, 0.25-0.50, 0.50-0.75, 0.75-1.0, > 1.0 g and >2.0 g) and converted
to percentages for comparison.

III. RESULTS
A. Prelinlinary trials with different potato nlicrotuberization systems
49
In liquid medium, the plantlets that were completely submerged could not form tubers
when incubated in darkness for 10 weeks. The depth of the liquid medium was also
important during the multiplication stage. If the liquid level was too low, the growth of
plantlets was inhibited. When the liquid level was too high, further growth of stems, roots
and leaves became retarded and the stem became stoloniferous. Depth control of the
medium is therefore an important consideration in the use ofliquid media for potato
microtuberization.
Of the 4 microtuberization systems trialled here (Fig. 1 ), the stationary system appeared to
be most promising as far as microtuberization is concerned (Table 1). This was adopted for
further investigation in this thesis.
A preliminary examination of the possible involvement of invertase activity in the medium
for sucrose which supplied during microtuberization was also carried out. It was found that
invertase activity was much higher in the 8% sucrose medium than that in the media
containing other carbohydrates (Table 2). It is also interesting that amylase activity was
not detected in any of these media while acid phosphatase activity was similar in all of the
media. Taken together, the relatively high invertase activity seemed to be associated with
8% sucrose tuberization medium.
The standard two-step stationary culture procedure used throughout the thesis was
modified slightly from the preliminary stationary culture system. In the first step of the
preliminary system, three plantlets with 2 nodes each were floated in 25ml of liquid
propagation medium containing 3% sucrose in MS basal salt solution (depth about 10mm
high). This first stage is to promote vegetative growth prior to microtuberization. It was
observed that vegetative growth was important to get a bigger microtuber in the next
tuberization step. Normally, roots and lower parts of the plantlets were submerged, but
upper parts (stem and leaf) of the plantlets remained over the surface ofthe aerial space in

50
liquid medium within a 250ml tissue culture container (64mm ID x 80mm).
After 4 weeks, when the plantlets were well established, the residual medium was drained
off and replaced to increase medium depth (15-20 mm) with 50ml of new
microtuberization medium containing 8% sucrose in MS basal medium.
In the second stage, the plantlets were incubated at 20°C in darkness. After 10 weeks, the
microtubers were harvested.

CULTURE MANIPULATION
MULTIPLICATION
(First Step)
STOCK PLANT ('Iwa')
2 Nodal Cutting
Culture in Liquid medium
3% Sucrose MS liquid medium
Drain off & replace medium
TUBER FORMING TUBER GROWTH
(Second Step)
Bubbling jar (A)
Shaking (B)
Whole plant
8% sucrose MS liquid
Stationary (C)
Binary (D)
Fig. 1. Preliminary trials of 4 different microtuberization procedures.
Please note: throughout the thesis, the in vitro plantlets of the 2 potato cultivars used for
experimentation are denoted as ('Iwa') and ('Daeji').
51

52
Table 1. Results ofthe preliminary trials in Fig. 1 at 10 weeks from the start ofthe microtuberization step.
A
Earliness of +++ induction Microtuber ++ numbers Tuber size +++
Tuber yield +++
Appearances Thick stems
Key: +++ good or most advanced ++ intermediate level + poor or less advanced
B C D
+ +++ ++
+ +++ ++
+ +++ +++
+ +++ +
Most tissues Thick stems Poor tuber growth submerged in rate; the medium; low productivity vitrification
evident

Table 2. Presence of enzyme activities in the medium at the end of the preliminary
tuberization experiments with 'Iwa' plantlets.
Medium3 Enzyme Activityb
Invertase Phosphatase Amylase
(nMlh/mg/protein) (nMlh/mg/protein) (nMlh/mg/protein)
8% sucrose 300 1600 0
Glucose 53 1200 0
Fructose 94 1400 0
Glucose+Fructose 14 1200 0
Maltose 00 1700 , 0
a. MS basal medium + the appropriate carbohydrates. All media except the 3%
sucrose medium were osmotically equivalent to the 8% (w/v) sucrose medium at
the beginning ofthe in vitro tuberization step.
b. Presence of the indicated enzyme activities in the media after 10 weeks from the
start ofthe in vitro tuberization step was examined. The activity of the enzymes
assayed was expressed as the nM reaction product formed per hour per mg of
protein indicated.
53

54
B. Main Experiments
1. Effect of manipulations of tuberization medium on microtuberization 1.1 Standard Protocol 1.1.1 Time course of microtuber development
In vitro potato plantlets(cvs. 'Iwa' and 'Daeji') with an upright vigorous shoot and a well
developed, long green root, cultured in a stationary liquid tuberization medium with 8%
sucrose for 10 weeks in darkness, formed about 3.0 microtubers per 3 plantlets per jar. All
the microtubers showed marked increase in fresh weight within 7 weeks of culture; after
from then until 10 weeks there appeared to be little or no further change (Fig. 2).
1.1.2 Carbohydrate changes in the standard tuberization medium
Composition of sugars in the medium exhibited remarkable changes while the microtubers
were formed (Figs. 3a and 3b). After 2 weeks in culture, the medium contained large
amount of glucose and fructose in addition to sucrose (Figs. 4a and 4b). The decrease of
sucrose in the medium was correlated with an increase in the levels of glucose and
fructose. After 6 weeks in culture, sucrose was almost completely converted (i.e. not
detectable with paper chromatography but trace amount fOlmd in HPLC analysis) to
glucose and fructose, which were present in similar-proportions. By week 8, sucrose was
no longer detectable even in HPLC analysis, but the levels of glucose and fructose in the
medium peaked. Then these sugars decreased in the medium slightly and in similar
amounts although this seems to have happened faster in the case of 'Daeji' than in 'Iwa'
(Figs. 4a and 4b).
It was apparent that the decrease in sucrose concentration of the medium accompanied the
beginning of microtuber formation and correlated notably with the cessation of microtuber
development.
1.1.3 Invertase activity in the standard tuberization medium 1.1.3.1 Preparation of invertase from the medium
Since invertase level appeared to be low in large volume of the liquid medium, it was
necessary to concentrate the enzyme. To this end, several general protein

55
0.7
0.6 ~ -..r::. 0.5 Ol 'ijj 3: ....
0.4 Ql .0 :::J -e (J 0.3 'E Ql Ol
0.2 !O .... Ql
~ 0.1
0 0 1 2 3 4 5 6 7 8 9 10 --....-Iwa
Weeks __ Daeji
Fig. 2. Time course of micro tuber growth ('Iwa' and 'Daeji'). The microtubers harvested
at the end of the microtuberization step (10 weeks) from each medium type with a
certain sucrose concentration was individually weighed shortly after harvest.
Each value represents the average tuber weight from two replicates jars.

F
G
5
5 1 2 3 4 5 6 7 8 9 10
Weeks
Fill_ l>- , .... rapt' eh"""''''IIr>m of , j"", rout"J< of c>foooyd",,, <""nR"" in tho , "'<>dan!
rub;:{;7,ation m<,jiwn rl"",'). SUi\iO! .,and,,,,1> f' - fru:toJ<, G- JI"""5<.oo S
''''''--
•

SFG0246810
Woeks
Fli. Jb T, .... """"" of corbohyd"uoc!wlj!., on POr>« d'!""""'ar2p/ty on ,n. <I>IIdonl
,u).orin';"" """'i"", {' u..jf ~ F- tn.:IO«. G- ~I"",'" ond S1 Jl>CroX
"

90
80
70 ~
:§ 60 Ol E ~ 50 ~ c 40 0 0
~ 30 :>
(/J
20
10
0 0 2 4 6
Weeks
8 10 -+-Sucrose
_Glucose
"""'"lIIr- Fructose
Fig. 4a. HPLC analysis of carbohydrate changes in the standard tuberization medium
(,Iwa').
58

90~-----------------------------------------.
80 ~-----------
~ 70+---~~------------~----------------~ 60 +------'-'
C 50+-------------~~ .lB c: 40 .. 8 ro 30+---- ............... ~------------~%7~--O'l ~ 20+------------..... -....... ~~~--_T------------------~ (J)
10~----=_~ ............................................ -------~---------- ................... ~--~
o~~--~------~------~~~~ __ ----~ o 2 4 6 8 10
Weeks I • Sucrose ___ Glucose
--*- Fructose
Fig. 4b. HPLC analysis of carbohydrate changes in standard tuberization medium
('Daeji').
59

60
concentration methods were attempted, including PEG sorption and ammonium sulphate
precipitation. A further challenging problem was encountered: proteins from the medium
tended to form precipitates during dialysis in buffer solution, or upon storage at 4 °e.
Freshly prepared samples were used to avoid these problems.
1.1.3.2 Optimum pH of invertase activity
The enzyme activity in the medium for microtuberization of 'Iwa' was determined over a
broad pH range (Fig. 5). The peak activity at around pH 5.0 suggests that the sucrose
hydrolyzing activity in the medium was an acid invertase and not an alkaline invertase.
1.1.3.3 Change of invertase activity in the medium during tuberization
The development of invertase activity in the medium for microtuberization of'Iwa' and
'Daeji' correlated well with the initiation and development of micro tubers (1.1.1) and with
carbohydrate changes in the medium (1.1.2). The enzyme activity increased in the first 6
weeks and then started to fall in the next 4 weeks (Fig. 6). The peak level of invertase
activity in the medium for tuberization of 'Daeji' plantlets was higher than that for 'Iwa'
and the subsequent decline in the case of'Daeji' was also more substantial than in that of
'Iwa'.
1.1.3.4 Presence of invertase in parts of stems and roots that were submerged in liquid medium
Submerged stems and roots of'Iwa' plantlets contained invertase activities but the
presence of invertase in microtubers was not detected. The dependence of enzyme
activities in roots or stems on pH ranging from 2 to 8 is shown in Fig. 7. The extract of
submerged potato stems and roots had two peak activity at around pH 4 and 6. There was
no evidence for alkaline invertase activity in either extract.
1.1.3.5 Invertase Isozymes
To determine the number of invertase isoenzymes in the tuberization medium, non-denaturing

Q) (J) o
250~----------------------------------------,
g £ 200 +-----------------~--~----------------------~ "0>2 ~ e .s c;, 150 +----------------+------+---------------------~ ~E .~ :c ~ ~ 100 T---~~---=~~--------~------------------~ Q) (J) (J) co co Q) t ID 50 +-------------------------~~----------------~ Q) .... > c
o +-----,-----~----_,------~----,_----_r~--~ 2 3 4 5 6 7 8 9
pH
Fig. 5. pH profile of invertase activity in the standard microtuberization medium (,Iwa').
61

62
01 8:X) E ...... .l: ......
700 "0 Q) !II (Il Q) 6CO Qj L.
Q)
500 !II 0 U """' ::J ,~
- Q) 01 .... 400 :2 e c: c. '-' 300 >. :!: > 1-:-: u 200 (Il -+-Daeji Q) !II 100 (Il 1:: Q)
> 0 c:
1 2 3 4 5 6 7 8 9 10
\fI.J::Er<s
Fig, 6, Time course of invertase activity development during microtuberization in standard
tuberization medium ('Iwa' and 'Daeji'),

400~------------------------------------~ Q)
~ 350 +-------------~._------~~~----------------I
~]f 300 ,-----------~--~~---------+--------------~ ~ K 250 +----------+---:::='<-------'\.---~----_\_--~--------~ '-"0)
~ ~ 200 +--------+-~------------------~------~----~ ._ J: - -... ~ ~ 150 +----=~<------------------------~----------~ Q) !/)
~ ~ 100 +-~~r_--------------------------------~--~ ~ Q) ~ ~ 50 +---~------~------------------------------~ c:
O+-----~----~----~----,_----~----,_----~
2 3 4 5 6 7 8 9
pH
Fig. 7. pH profiles of invertase activities in the extracts of the plantlets 'Iwa'.
63
-+-Root
--Stem

64
PAGE and non-denaturing thin layer isoelectric focusing gel electrophoresis were carried
out and then several methods were attempted to detect the enzyme activity on the gels. The
most satisfactory method involved the use of an auxilliary chromogenic system (Faye
1981). The gels immersed in the soluble staining system overnight showed a single stained
band in each sample lane on the gel (Fig. 8) with pI at around 6.75. The same band
appeared to be present in root extract and in multiplication medium.
1.1.3.6 Changes in soluble protein content during tuberization
Soluble protein content of the medium changed during tuberization of'Iwa' plantlets (Fig.
9). There was a sharp increase in 4-5 weeks reaching a maximum at/after 6 weeks in
culture. Subsequently there was little or no further change in the next 4 weeks.
1.1.4 SDS-PAGE of proteins in the standard tuberization medium
Analysis by SDS-P AGE of crude protein preparations from the standard microtuberization
medium revealed a number of proteins bands ('Iwa'). One ofthe major bands had an
apparent molecular mass of}O kD (Fig. 10).
1.1.5 pH changes in the medium during in vitro tuberization
The initial pH of the tuberization medium changed in the course of sucrose cleavage in the
medium during microtuber initiation and development ('Iwa'). There was a decline of the
pH to 4.3 during the first 2 weeks of culture. Then the pH started to increase to around 5
for the rest of the experiment (Fig. 11). This coincided with the completion of sucrose
cleavage in the medium.
1.1.6 Osmotic potential change in the standard tuberization medium
Osmotic potential of the medium was also measured to determine the correlation between
osmotic potential changes and sucrose cleavage in the medium (Fig. 12). It rose between 2
and 4 weeks reaching a peak at week 4 during in vitro tuberization of 'Iwa' plantlets, and

"",,",,' .. .. ' . -'" -. ~--. -
1 2 3 4
Fill_ ! . I""zy"" gol ..... I~>i. of inv ...... .oowillj. a singl. twd ".""h Ion< ott tho gel
wi<ll ,1 ., aro.onJ ~. 75 . Uno I, "",m, I...". 2: ~ I ..... J: m"""'ubt-riution
mo<!ilun, Lane 4: muitipli<otim m<diwn.
"
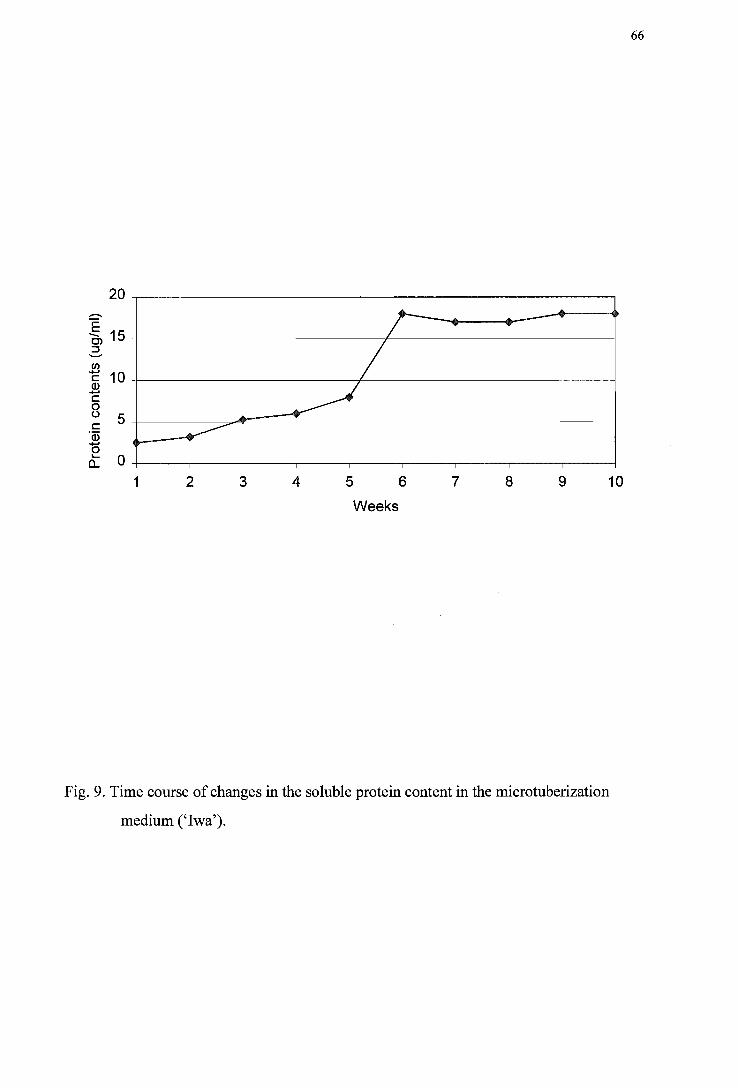
20
;--........
.§ 15 C>
/ ::J ........ II) +-' 10 c Q)
~ +-' C 0 () 5 c ...---'Q) +-' 0 '- 0 a...
1 2 3 4 5 6 7 8 9 10
Weeks
Fig. 9. Time course of changes in the soluble protein content in the microtuberization
medium ('Iwa').
66

"
.6_ 56-42- -31- -21 - -14- -
StSGFGFM, M,
"I 10 AmlYSIi by 11 N SOS·I'AGf. 0( .,opIes fi<>m """""I)' punfont liquod tncd,. It.
"..,... _ ~,th Ippar<fII ........"..Iar ..-. afJoO lD{,ndocaIN ,.1Ih arm'" htal)
,",unotcd .. .u_ks.
Lan< S-._ m,ctOOII:I<tI'"'_ .-.................... __ • L.- c;.. JV 'on;! """"""bm .. __ .... conWllI .... I ..... ...-.
Lan< F- _ ml ...... bm .. _ ....so .................... ""' ... , OF- _ m, • .........., ...... mcdo .... con ........ ~ ... &NcOOC • '" fNtoott.
1>1 • ........., m ............ '_ modi ... "" So"" .. rIo"'--, 101,' -..J.d mutllplal*l mcdi"", ............ l"'_1OM
All tho mlClOl""',,,,,,,, ........ _ .. ""',.......,.., 10 ..... kJor <UI\J.ft WId tb<
pion'''' ........ pI""', .... /II<d,um .. u how ..... d all<. 4 -. of c""'-.

6.2
5.95
5.7
5.45
~ 5.2
4.95
4.7
4.45
4.2
~ \ \ \ \ ~
o 1
~
2
.. /
/
3 4
...... /~~
5
Weeks
6 7 8
......
9
Fig. 11. Time course of pH changes in the medium during in vitro tuberization (,Iwa').
68
10

then dropped slightly but remained at a high level up to 10 weeks. A similar pattern of
changes in the osmotic potential of the medium was observed during tuberization of
'Daeji', except that it peaked at 3 weeks and at a smaller magnitude.
1.1.7 Time course of mineral changes in the standard tuberization medium
69
The levels of several major inorganic ions in the medium were measured in 'Iwa' plantlets
to identify whether mineral nutrients could contribute to the osmotic potential changes in
liquid medium. Among the minerals studied potassium and calcium contents decreased
more rapidly within the first 2 weeks of in vitro tuberization of 'Iwa' plantlets than later on
(Fig. 13).
1.2 Effects of varying the concentrations of sucrose in the tuberization medium
1.2.1 Effect on microtuber formation
Following 4 weeks of the standard plantlet multiplication protocol, the effects of culturing
the plantlets in media containing varying amounts of sucrose ranging from 0 to 20% (w/v)
on the number of microtubers formed, their average fresh weights and relative size
distribution were investigated.
Microtubers were initiated in the plantlets of both varieties 'Iwa' and 'Daeji' 2 weeks
after transfer from the multiplication medium to a wide range of sucrose-containing media,
except the sucrose-free medium on which the plantlets did not form microtubers after 10
weeks in darkness. The number of micro tubers formed by 'Iwa' varied from 2.0 to 3.3 per
3 plantlets in media containing sucrose concentrations ranging from 2 to 20%, with 4 to
8% appearing to be the best treatments (Table 3). Similarly, the number of micro tubers
formed by 'Daeji' plantlets did not seem to vary much among the different sucrose
treatments, possibly with the exception of the 20% sucrose medium (Table 3).
Overall the 'Iwa' plantlets appeared to form heavier microtubers than those of 'Daeji' in
response to sucrose ranging from 2% to 20% in the media (Figs. 14 and 15).
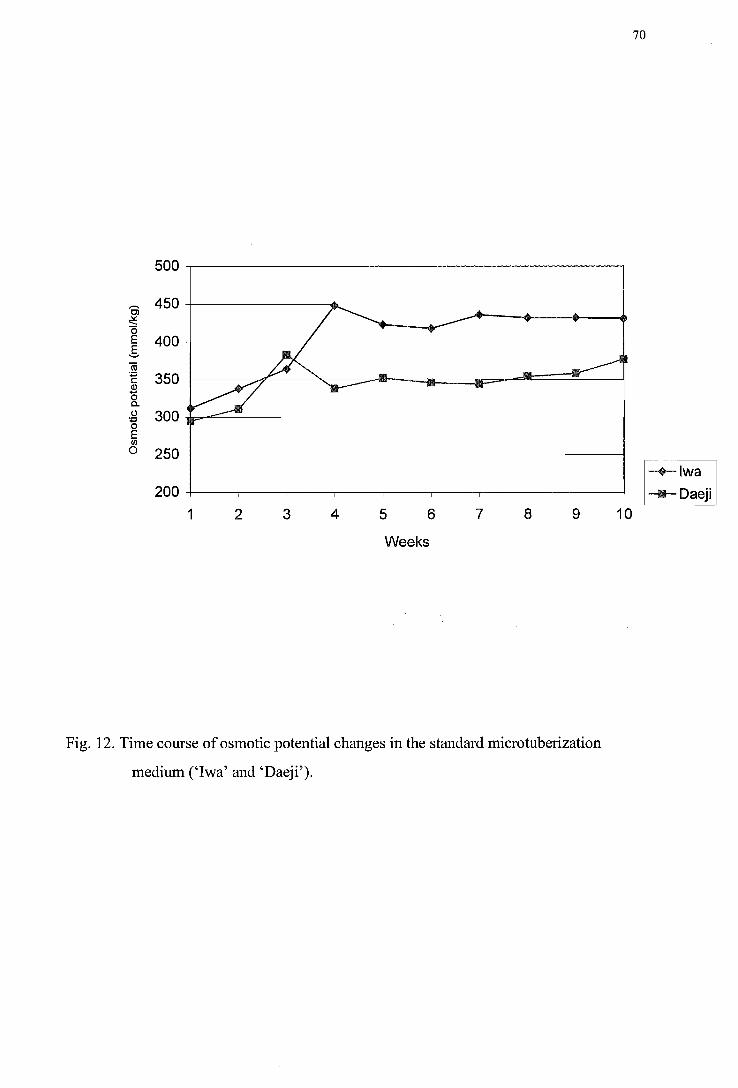
500
Cl 450 ~ :::: 0 E 400 5. ro :;::: 350 c Q) -0 0.. 0 300 :;::: 0 E en 0 250
200 1 2 3 4 5 6 7 8 9
Weeks
Fig. 12. Time course of osmotic potential changes in the standard microtuberization
medium ('Iwa' and'Daeji').
70
-+-Iwa
---Daeji 10

800
700
600 .--.. :::::: C)
E. 500 (/J -c Q)
c 400 0 (J
(J
.~ 300 C) ... 0 E 200
100
0
--+- Ca
III K
- - .. - - Mg
+-~----------------------------~ --Jr- Na
0 2 4 6 8 10
Weeks
Fig. 13. Time course of major inorganic ion changes in the standard microtuberization
medium (,Iwa').
71

72
Table 3. Effect of varying sucrose concentration on number of micro tubers formed after 10
weeks in the dark.
Number of microtubers produced per 3 plantlets in a jar
Sucrose concentration in 'Iwa' 'Daeji' media (%, w/v)
0 0 0
2 2.33 ± 1.06ab 3.83 ± 0.56a
4 3.16 ± 0.56b 3.20 ± 0.70a
6 3.25 ± 0.25b 3.00 ± 1.00a
8 2.66 ± 1.06b 2.57 ± 0.61 ab
12 3.00±1.11b 3.25 ± 0.50a
16 2.66 ± 1.06b 3.50 ± 1.90a
20 2.00 ± 0.12a 1.66 ± 0.16b
Superscripts with same letter are not significantly different according to Bonferoni
comparison of means at the 0.05 level.

73
Microtuber size in the case of'Iwa' increased from 0.43g (average weight from three
plantlets) in 2% sucrose medium to 0.60g in 6% sucrose medium and decreased from
0.79g in 8% sucrose medium to 0.32g in 20% sucrose. Similar trends were observed with
'Daeji' (Fig. 15).
An examination of the frequencies of microtubers in different weight categories (Figs. 16
and 17), confirms that 8% sucrose, the concentration used in the standard tuberization
medium, was the best tuberization medium and tended to favour the formation of larger
microtubers and fewer smaller ones in both varieties. The 2%, 16% and 20% sucrose
media resulted predominantly in the production of small microtubers (mainly less than
250mg).
1.2.2 Effect on soluble protein contents of the tuberization media
Changes in soluble protein contents ('Iwa') could be detected in the medium during
tuberization. The soluble protein contents of the tuberization media supplemented with
varying concentration of sucrose increased sharply reaching a maximum after 6 weeks in
culture (Fig. 18). In general, higher sucrose media tended to have higher contents of
soluble proteins. Subsequently there was little or no further change in the next 4 weeks.
1.3 Effects of different carbohydrates in the tuberization medium on microtu beriza tion
1.3.1 The initial osmolality of the media containing different monosaccharides was equivalent to that of 8% sucrose (i.e. the standard tuberization medium)
1.3.1.1 Microtuber formation
Following 4 weeks ofthe standard plantlet multiplication protocol, the effects of culturing
the plantlets in tuberization media supplemented with glucose and fructose, either singly or
in combination, were studied in comparison with standard 8% sucrose medium. The initial
osmolality of all these media was adjusted to be the same. The number of microtubers formed,
their average fresh weights and relative size distribution were investigated. Microtubers
were initiated in the plantlets of both varieties 'Iwa' and 'Daeji' 2 weeks after transfer
from the multiplication medium to the different tuberization media.

1
.......... 0.8 0)
..........
......
.c 0) 0.6 ·w s: '-Q)
..0 0.4 ::J ...... 0 '-()
:2 0.2
0 2% (bc)
4% (b c)
6% (a b)
8% (a)
12% (b c)
16% (d)
20% (cd)
Initial sucrose concentration in media
74
Fig. 14. Effect of sucrose concentrationsn average fresh microtuber weight (,Iwa'). The
microtubers harvested at the end ofthe microtuberization step (10 weeks) from
each medium type with a certain sucrose concentration were individually
weighed shortly after harvest. An average of the fresh weights of individual
microtubers was computed. Treatments with different letters are significantly
different according to Bonferoni's comparison of means at the 0.05 level.

0.8 ..-... 0.7 0> --..... 0.6 ..c 0>
0.5 .(j)
?!: 0.4 .... (J.) .0 0.3 :J ..... 0 0.2 .... . ~ 0.1 ::2:
0
2% (d)
4% (cd)
6% (ab)
8% (a)
12% (bc)
16% (cd)
Initial sucrose concentration in media
20% (d)
75
Fig. 15. Effect of sucrose concentrations on average fresh microtuber weight ('Daeji'). The
microtubers harvested at the end of the microtuberization step (10 weeks) from
each medium type with a certain sucrose concentration were individually
weighed shortly after harvest. An average of the fresh weights of individual
microtubers was computed. Treatments with different letters are significantly
different according to Bonferoni's comparison of means at the 0.05 level.

§ 80~--------------------------------------------------~ :;::: E 70 +---------------------------------------------.;:: ~ 60 +-------------------------------------~~---'5 .... 50 +--------11_----1 1-------------------tII!IlI-----.r::,...., .~ ~ 40 +-_l1li_-------11_----1 1------------__IIIIiIc-----tII!IlI-----
:;: 30 .... Q)
20 .c ~ .... 10 0 .... u
0 ~ 2% 4% 6% 8% 12% 16% 20%
Initial sucrose concentrations (%,w/v) in media
Fig. 16. Microtuber fresh weight distribution in response to different sucrose
concentrations in the medium ('Iwa').
76
I1lI 0.1-0.259
II1II0.25-0.59
00.5-0.75 9
00.75-1.09
II1II> 1.09
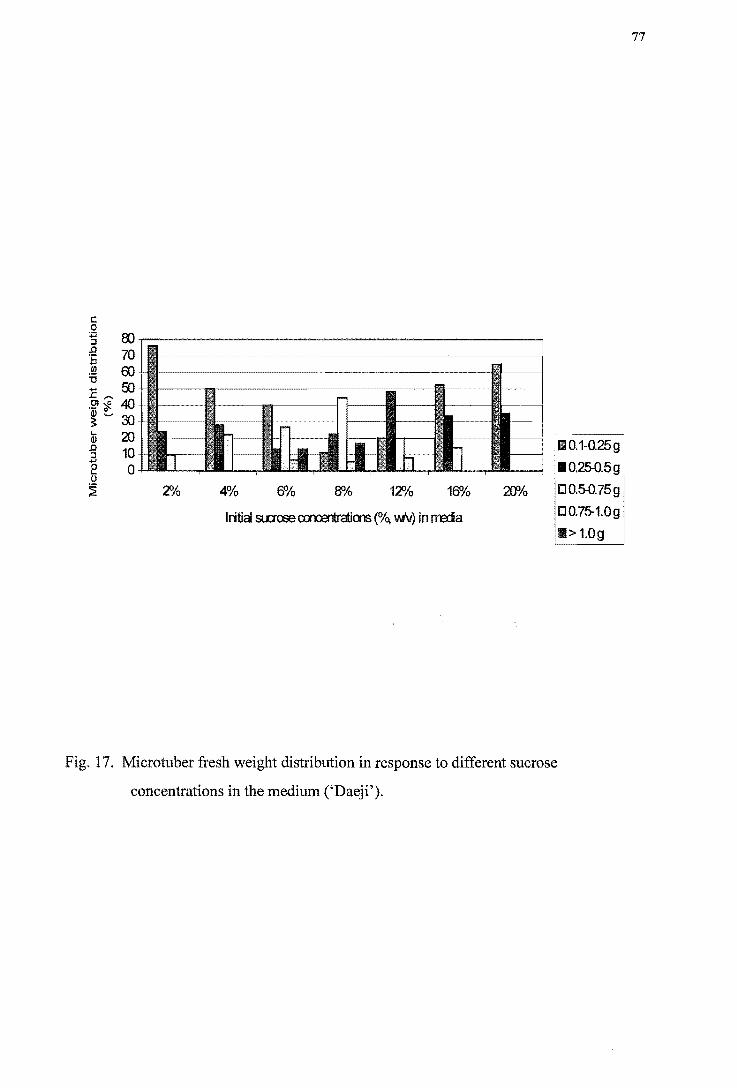
c o S oo~------------------------------------------~ ~ m+B~~~~~~~~~~~~~~~~~-----~~~ ~ 6O+B~~~~~~~~~ -~~~~~~~~~~~~ ~ ro+B~~~ __ ~~~~~~~~~=-~-m~~--r.~~-1 .t::."" .!;!l '$. 40 +II!!~-.......... II!I·~---, __ ~~-I 1--~-IIIIII-~--1 ___ ~~-11!1-------1
~ '-' 3) -t.I-~----III!II=-~--~ 20 .g 10 ..... e 0 o ~ 4% 6% S% 12'/0 16%
hitial SlUose cm:a1trations (% Wv) in rreda
20%
Fig. 17. Microtuber fresh weight distribution in response to different sucrose
concentrations in the medium ('Daeji').
II 0.1-0.25 9
1I0.25-0.5g
DO.5-0.75g
DO.75-1.0g
II> tOg
77

___ 20
E ........
g> 15 --II) -c 10 Q) -c
0 0 c 5
'Q) -0 L- 0 c..
1 2 3 4 5 6
Weeks
7 8 9 10
78
-.-12% sucrose
--III-- 8% sucrose
-l:r-6% sucrose
'-)E---.4% sucrose
--?lr2% sucrose
Fig. 18. Soluble protein changes in the media containing different sucrose concentrations
during tuberization (,Iwa').

79
The number of microtubers formed in a jar each containing 3 plantlets was similar in the
glucose and sucrose media, whereas it seemed higher in the fructose medium and that with a
mixture of glucose and fructose (Fig. 19) although the statistical analyses revealed no
significant differences among the 4 treatments (p~0.05). In contrast, the response of'Daeji'
plantlets to these media was different. The fructose or sucrose medium appeared to have
similar a effect and a number of micro tubers formed was apparently higher (p~0.05) than in
the glucose or glucose + fructose medium (Fig. 20).
It seems that 'Iwa' plantlets produced heavier microtubers in the medium initially supplied
with a mixture of glucose and fructose or the standard 8% sucrose microtuberization
medium than when glucose or fructose was supplied singly to the tuberization medium
(Fig. 21). The results obtained with 'Daeji' plantlets (Fig. 22) were different and showed
that the response to the different media were very similar overall although ANOV A might
show otherwise.
An examination of the frequencies of microtubers in different weight categories formed by
'Iwa' plantlets showed clearly that the tuberization medium containing sucrose or a
mixture of glucose and fructose rather than medium containing glucose or fructose
supplied singly tended to favour the production of larger microtubers and fewer smaller
ones, particularly those less than 250mg (Fig. 23). A similar frequency of micro tubers in
different weight categories in response to the different media were also observed with
'Daeji' plantlets (Fig. 24). In particular, the medium with glucose supplied singly resulted
predominantly in the production of smaller microtubers.
1.3.1.2 Osmotic potential changes of the different monosaccharidecontaining media during microtuberization
The initial osmotic potential ofthe different monosaccharide media was adjusted to be the
same as that of the 8% sucrose medium (Fig. 25 and 26). During microtuberization of 'Iwa'
plantlets, the osmotic potential ofthe sucrose medium, which was included for comparison,
first dipped slightly before increasing sharply within the first 4 weeks (Fig. 25). By contrast,
that of the other 3 media decreased. Then while the osmotic potential of the sucrose medium
decreased slightly before stabilizing at a relatively high level till the end of the
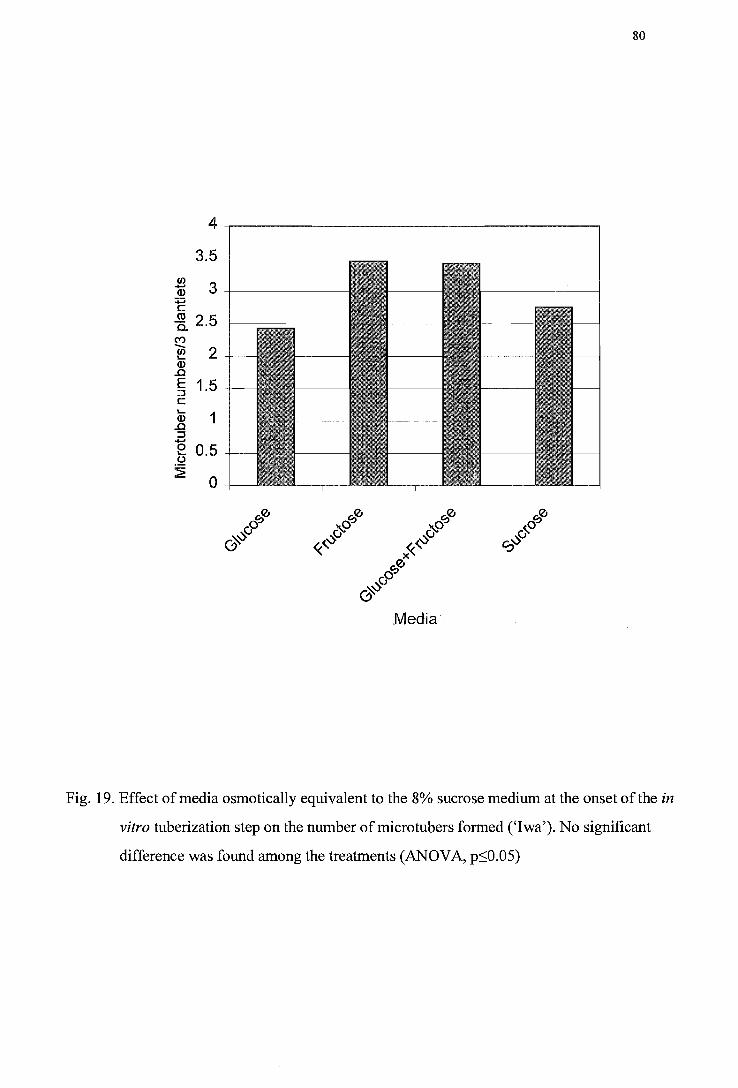
80
4
3.5 (J)
3 ..... Q)
:;:::; c ~ 2.5
('I) ....... 2 (J) ....
Q) ..c E 1.5 ::::J c ....
1 Q) ..c
::::J ..... 0 0.5 .... 0
~ 0
~0 cP &'5
Media
Fig. 19. Effect of media osmotically equivalent to the 8% sucrose medium at the onset of the in
vitro tuberization step on the number of micro tubers formed (,Iwa'). No significant
difference was found among the treatments (AN OVA, p~O.05)

81
3.5
(/) 3 ..... Q)
:;::; c
2.5 co 0..
C"') -~ 2 Q) .0 E ::l 1.5 c '-Q) .0 1 ::l ..... 0 '-0
~ 0.5
0
~, 010
0° &V
Media
Fig. 20. Effect of media osmotically equivalent to the 8% sucrose medium at the onset of
the in vitro tuberization on number of micro tubers formed ('Daeji'). Treatments
with different letters are significantly different according to Bonferoni's
comparison of means at the 0.001 level.
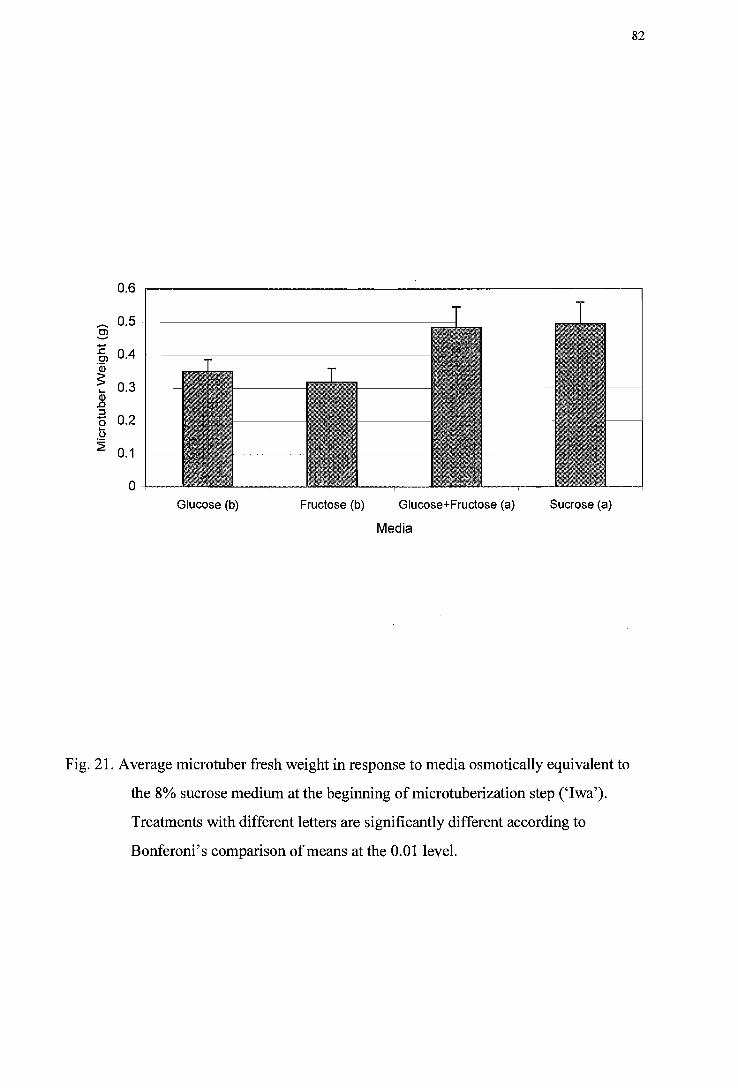
0.6
,......, 0.5 ~ -..c: 0.4 Cl 'Q) ~ 0.3 .... Q) .0 :J - 0.2 0 .... u ~ 0.1
a Glucose (b) Fructose (b) Glucose+Fructose (a)
Media
Sucrose (a)
Fig. 21. Average microtuber fresh weight in response to media osmotically equivalent to
the 8% sucrose medium at the beginning of microtuberization step ('Iwa').
Treatments with different letters are significantly different according to
Bonferoni's comparison of means at the 0.01 level.
82

0.7
0.6
0.5 OJ '-' .... ..c: OJ 0.4 'iii ~ ..... <I.l ..c 0.3 :J .... 0 ..... u ~
0.2
0.1
0 Glucose (c) Fructose (be) Glucose+Fructose (a)
Media
Sucrose (ab)
Fig. 22. Average microtuber fresh weight in response to media osmotically equivalent to
the 8% sucrose medium at the beginning ofmicrotuberization step ('Daeji').
Treatments with different letters are significantly different according to
Bonferoni's comparison of means at the 0.01 level.
83

---~ c: .Q :; .c 'c iii u :E Cl 'iii ~ .... Q) .c 2 e 0
~
60 50 40 30 20 10
0
~0 c.P
&oS
84
1I0.1-0.25g
1110.25-0.5 9
00.5-0.75 9
00.75-1.0g
III> 1.0 9
Fig. 23. Fresh microtuber weight distribution in response to media osmotically equivalent
to the 8% sucrose medium at the beginning of microtuberization step ('Iwa').

~ 60 c: .9 50 ::; .a .;:: 40 u; ;:; :E 30 en '(ii 3 20 lii .a 10 ::::J e u 0 ~
r-,0 cP &,s
Media
85
ElJO.1-0.25 9
.. 0.25-0.5 9
0°·5-0.75 9
0°·75-1.0 9
III> 1.0 9
Fig. 24. Fresh microtuber weight distribution in response to media osmotically equivalent
to the 8% sucrose medium at the beginning ofmicrotuberization step ('Daeji').

440 ,-..
~ 400 "0 E 5 360 (ij ~
320 c: Q) -0 Co () 280 ~ 0 E en 240 0
200 0 1 2 3 4 5 6 7 8 9 10 11
Weeks
86
-l1li-- Sucrose
---+- Glucose
-h.- Fructose
-o-Glucose+ Fructose
Fig. 25. Osmotic potential changes of media that were osmotically equivalent to the 8%
sucrose medium at the beginning of the microtuberization step (,Iwa').

400
380 OJ 360 ~ ..... "0 340 E 5 320 iii ~ 300 Q) -~ 280 0
:;::; 260 0 E
240 en 0
220
200 0 1 2 3 4 5
Weeks
6 7 8 9 10
-sucrose
-+-glucose
-fr- fructose
-0- glucose+ ructose
Fig. 26. Osmotic potential changes of media that were osmotically equivalent to the 8%
sucrose medium at the beginning of the microtuberization step ('Daeji').
87

88
microtuberization experiment (Fig. 25), that ofthe glucose medium continued to decline to a
level substantially lower than that the sucrose medium in the same culture period.
Although the fructose or fructose + glucose medium ended up with the similarly low levels
of osmotic potential as the glucose medium, for much ofthe culture period, the osmotic
potential ofthese two former media was higher than that ofthe glucose medium but was
still substantially lower than that ofthe sucrose medium. Within the first 4 weeks ofthe
microtuberization experiment with 'Daeji' plantlets, similar changes in the osmotic
potential levels ofthe four media were observed (Fig. 26). The osmotic potential ofthe
glucose medium was at lower levels than the fructose or a mixture of glucose + fructose
medium from week 5 to the end of the microtuberization experiment. During the same
culture period, the sucrose medium had higher osmotic potential levels than the other three
media (Fig. 26).
1.3.1.3 pH of the media changed during microtuber formation
Time course of pH changes in the media (1.3 .1.1) with equivalent osmolarity at the
beginning of the microtuberization step were measured to see any correlation with
microtuber formation. Despite the different carbohydrates, the patterns of pH changes in
the four media were similar during microtuberization experiments with 'I wa' (Fig. 27) and
'Daeji' plantlets (Fig. 28). Overall the pH seemed to dip during the first 4 weeks, and then
it went back up to pH nearly 5.5 by week 10.
1.3.2 The effect of monosaccharide-containing media with carbon content that was initially equivalent to that of 8% sucrose
1.3.2.1 Microtuber formation
Microtubers were initiated in the plantlets of both varieties 'Iwa' and 'Daeji' 2 weeks after
transfer from the standard multiplication medium to the three different monosaccharide
containing media with carbon content that was initially equivalent to that of the 8% sucrose
medium, in darkness. The number of micro tubers formed was largely similar (about 3 per 3
plantlets) among the 4 different media (Table 4).
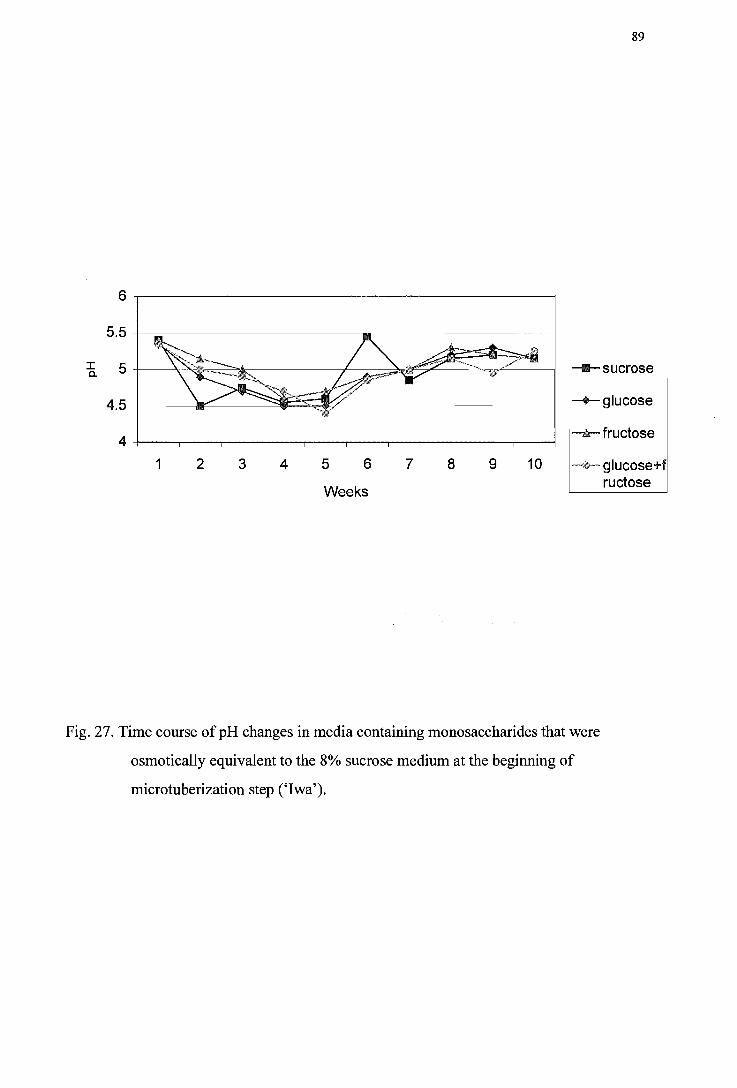
6 ~------------------------------------------~
5.5 -j-------------------.----------------j
4.5 +--------'111?-~;;t2~
4+---~--~----~--_r--~---~--_r-~----~--~
1 2 3 4 5 6 7 8 9 10
Weeks
89
-II- sucrose
-+-glucose
---t- fructose
-'"\@-- glucose+f ructose
Fig. 27. Time course of pH changes in media containing monosaccharides that were
osmotically equivalent to the 8% sucrose medium at the beginning of
microtuberization step (,Iwa').

90
6~----------------------------------------~
5.5 +-....-------------------------1
I 5+--~"--------II"""~-=-~~~ Co _sucrose
4.5 +-------' -+--glucose
1 2 3 4 5 6 7 8 9 10
Weeks
Fig. 28. Time course of pH changes in media containing monosaccharides that were
osmotically equivalent to 8% sucrose medium at the beginning of
microtuberization step ('Daeji').
fructose

91
Table 4. Effect of media containing carbon contents that were initially equivalent to that of
the 8% sucrose on number of microtubers formed after 10 weeks in the dark.
Microtuber numbers produced per 3 plantlets per jar
Media 'Iwa' 'Daeji'
Glucose 2.60± 0.25 2.46 ± 1.12
Fructose 3.01 ± 1.38 2.92 ± 0.57
Glucose+Fructose 3.42 ± 1.03 2.92 ± 1.45
Sucrose 2.75 ± 0.75 3.23 ± 0.52
No significant difference was found among the treatments (ANOVA, p:C:;0.05)

The 'Iwa' plantlets appeared to produce microtubers of similar size to those of'Daeji' in
response to the different media initially containing monosaccharides with carbon content
equivalent to that of 8% sucrose in the media (Figs. 29 and 30).
The potato plantlets seemed to respond better to the medium initially supplied with a
mixture of glucose and fructose or the standard 8% sucrose microtuberization medium
than in media with glucose or fructose supplied singly, although the statistical analysis
only supported this in the case of 'Iwa'.
92
From an examination of the frequencies of microtubers in different weight categories, it is
clear that despite having the same carbon content at least initially the tuberization medium
containing a mixture of glucose and fructose or the standard 8% sucrose medium rather
than medium containing either glucose or fructose tended to favour the production of
larger microtubers in both varieties (Figs. 31 and 32). Thus, for example, the frequency of
microtubers heavier than 1.0 g was 0 in the case of single monosaccharide media, but was
13%, when the 'Daeji' plantlets were cultured in the medium initially supplied with
glucose and fructose (Fig. 32).
1.3.2.2 Osmotic potential changes in the different microtuberization media used in 1.3.2
The initial osmotic potential of the monosaccharide media was much higher than that of
8% sucrose medium (Figs. 33 and 34). During the first 4 weeks of the microtuberization of
the 'Iwa' plantlets, the osmotic potential of the sucrose medium increased while that of the
other media decreased (Fig. 33). Then the osmotic potential ofthe sucrose medium
decreased slightly before stabilizing at a relatively high level till the end of the
microtuberization step. From week 5, the osmotic potential of the fructose medium was
virtually the same as that of the sucrose medium in the same time period. The osmotic
potential of the glucose medium continued to decline to levels lower than that of the
sucrose or fructose media in the same culture period. The osmotic potential of the mixed
glucose and fructose medium remained at the same levels but higher than other media
from week 4 to week 7 before dropping sharply to a level close to that of other media.

0.7~---------------------------------------------.
0.6 +----------------+------------1
1: 0.5 +----------------Cl
.~ 0.4 +-----------+-----
L..
~ 0.3 ::J +'
§ 0.2 ~
0.1
o Glucose (b) Fructose (b) Glucose+Fructose (a)
Media
Sucrose (a)
93
Fig. 29 . Average microtuber fresh weight in response to media with carbon contents that
were equivalent to that of the 8% sucrose medium at the beginning of the
microtuberization step (,Iwa'). Treatments with different letters are significantly
different according to Bonferoni's comparison of means at the 0.001 level.

94
0.7,--------------------------------------------------. 0.6+---------------------------------~------------------~
'@ :;:- 0.5 +----------------------------.s:::.
of 0.4 +-------------------------r----------
~ 0.3 +-----~---------::J
§ 0.2 +----
~ 0.1 +----
o --l---Glucose Fructose Glucose+Fructose
Media
Sucrose
Fig. 30. Average microtuber fresh weight in response to media with carbon contents that
were equivalent to the 8% sucrose medium at the beginning of the
microtuberization step ('Daeji'). No significant difference was found among the
treatments (ANOV A, p:S0.05)

~~
~ c: 60 0 :s 50 .c ·c
40 1ii '5 ~ 30 Cl 'ijj 20 :;: Cii 10 .c :::J
0 '0 ..... u ~
p.;)1lJ
vO &V
Media
1iliD0.1-0.25 9
.0.25-0.5 9
0°·5-0.75 9
0°·75-1.0 9
II> 1.0 9
Fig. 31. Microtuber fresh weight distribution in response to media with carbon contents
that were equivalent to the 8% sucrose medium at the beginning ofthe
microtuberization step (,Iwa').
95

~ c: 0
+> ::::J
€ ti ::0 ..... .r:: 01
'Qj ;: Qj .c 3 § ~
60
50
40
30
20
10
0
~0 (,0
&V 1l!J0.1-0.25g
III 0.25-0.5 9
0°·5-0.75 9
0°·75-1.0 9 .> 1.0 9
Fig. 32. Microtuber fresh weight distribution in response to media with carbon contents
that were equivalent to the 8% sucrose medium at the beginning ofthe
microtuberization step ('Daeji').
96
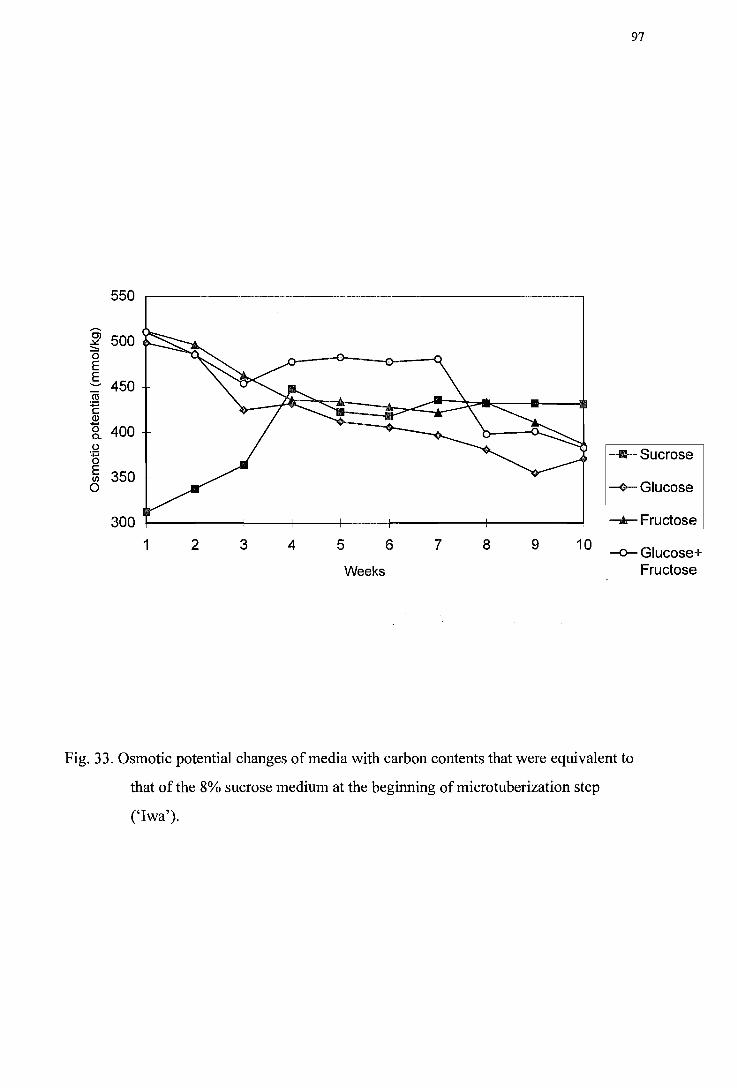
97
550
C; 500 ..I<:: --"0 E E
450 ~
"iii :;:::; c Q) -0 400 C-o
---Sucrose :;:::; 0 E 350 II)
-+-Glucose 0
300 -k- Fructose
1 2 3 4 5 6 7 8 9 10 --0- Glucose+
Weeks Fructose
Fig. 33. Osmotic potential changes of media with carbon contents that were equivalent to
that of the 8% sucrose medium at the beginning of microtuberization step
(,Iwa').
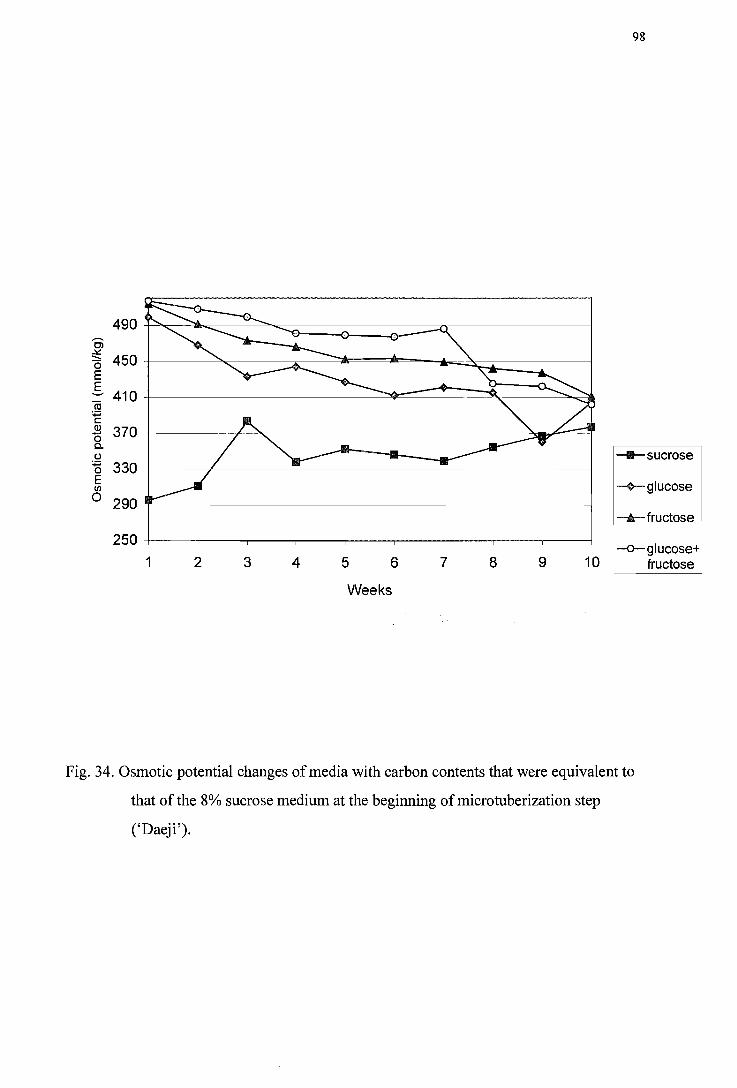
98
490 ~
OJ ~ :::::. 450 a E 5 410 "iii :;J t: Q) 370 ..... a c.. u __ sucrose
:;J 330 a E -+-glucose en 0 290
-.6r- fructose
250 -0-9 lucose+
1 2 3 4 5 6 7 8 9 10 fructose
Weeks
Fig. 34. Osmotic potential changes of media with carbon contents that were equivalent to
that of the 8% sucrose medium at the beginning of microtuberization step
('Daeji').

One notable difference between the monosaccharide and the sucrose media, particularly
during in vitro tuberization of 'Daeji' plantlets, was that the osmotic potential of the
former remained higher than that of the latter throughout much of the microtuberization
step (Fig. 34).
1.3.2.3 pH of the media used in 1.3.2 changed during microtuberization
99
The possible relationship between the time course of pH changes and tuber growth was
studied. There was a gradual decline in the pH of the media during the first 2-4 weeks, and
then the pH rose gradually to a level similar to that at the start of microtuberization (Figs.
35 and 36). Despite of the presence of different carbohydrates, there was no significant
difference in pH changes among the different media and the overall trends were similar in
'Iwa' and'Daeji'.
1.3.3 Substitution of sucrose with maltose 1.3.3.1 Effect on microtuberization
Following 4 weeks of the standard plantlet multiplication protocol, the effects of culturing
the plantlets in media containing 8% maltose which were osmotically equivalent to 8%
sucrose on the number of microtubers formed, their average fresh weights and relative size
distribution were investigated.
Microtubers were initiated in the plantlets of both varieties 'Iwa' and 'Daeji' 2 weeks after
transfer from the multiplication medium to either sucrose or maltose medium. The number
of micro tubers formed was similar (about 3 per 3 plantlets) in both treatments (Table 5a).
The 'Iwa' plantlets appeared to form microtubers of similar size in response to the two
osmotically equivalent media (Table 5b), but they produced bigger microtubers than
'Daeji' plantlets in response to the 8% maltose medium. Both varieties responded
similarly in the 8% sucrose medium.
From an examination of the frequencies of micro tubers in different weight categories, it is
clear that 'Iwa' plantlets tended to produce similar size distributions of micro tubers in both
disaccharide media (Fig. 37). However, 'Daeji' plantlets appeared to react to the maltose
medium by producing more microtubers in 0.1 to 0.25g category when compared to the
THE LIBRARY UNIVERSITY Of CANTERBURY
CHf1ISTCHURCH, NL

6 ~----------------------------------------~
5.5 +-----------------------~----------------~
4.5 +----'l~----=:::II~~~--------~
1 2 3 4 5 6 7 8 9 10
Weeks
100
-sucrose
-+-glucose
----k- fructose
_mit"- glucose+ fructose
Fig. 35. Time course of pH changes in response to monosaccharide-containing media with
carbon contents that were equivalent to that of the 8% sucrose medium at the
beginning ofmicrotuberization step (,Iwa').

I Co
5.5 -,---------------------------,
4.5+-----~~~~~~~--~~------------------~
4 +----,-----r----,----,-----r----,----,-----r----,---~
1 2 3 4 5 6 7 8 9 10
Weeks
101
--sucrose
-+-glucose
--k-- fructose
"""'$"-~ glucose+ fructose
Fig. 36. Time course of pH changes in response to monosaccharide-containing media with
carbon contents that were equivalent to that of the 8% sucrose medium at the
beginning ofmicrotuberization step ('Daeji').

102
Table 5a. Effect of maltose and sucrose on microtuber number (a) and average microtuber
weight (b).
(a) Microtuber number (microtubers produced per 3 plantlets per jar)
Media 'Iwa' 'Daeji'
Sucrose 2.75 ± 0.75 3.23 ± 0.52
Maltose 3.15 ± 0.64 3.00 ± 1.27
(b) Average microtuber weight (g)
Media 'Iwa' 'Daeji'
Sucrose 0.49 ± 0.06 0.45 ± 0.09
Maltose 0.54± 0.21 0.32 ± 0.05
No significant difference was found among the treatments (ANOV A, p~0.05)

~ .. 0
c 0
5 .c 'c U; 'i5 :E Ol
'Qi ;: '-Q) .c .a e u ~
60
50
40
30
20
10
0 Maltose 8%
Iwa Sucrose 8%
Iwa Maltose 8%
Oaeji Sucrose 8%
Oaeji
1l!iJ0.1-0.25 9
liliiii 0.25-0.5 9
0°·5-0.75 9
0°·75-1.0 9
liliiii> 1.0 9
Fig. 37. Microtuber fresh weight distribution in response to media containing 8% (w/v)
maltose or sucrose at the beginning of the microtuberization step ('Iwa' and
'Daeji').
103

104
sucrose medium (Fig. 38).
1.3.3.2 Osmotic potential changes of the 8% maltose medium
The initial osmotic potential of the maltose medium was the same as that of the standard
8% sucrose microtuberization medium. In the first five weeks during microtuberization of
both 'Iwa' and 'Daeji' plantlets, there was little change in the osmotic potential of the
maltose medium compared to the sucrose medium (Figs. 38 and 39). Then the osmotic
potential of the maltose medium showed a steady decrease.
1.3.3.3 Time course of pH changes in the 8% disaccharide media
During first few weeks ofmicrotuberization of both 'Iwa' and 'Daeji' plantlets, the pH of
both the maltose and sucrose media tended to decrease to a low point around 4 - 4.5 before
returning gradually in the following weeks to the level at start of microtuberization (Figs.
40 and 41). One exception was that the pH in the medium for 'Iwa' plantlets in sucrose did
not change initially until week 4 (fig. 40).
1.4 Effect of initial pH of the tuberization medium
Following 4 weeks of the standard plantlet multiplication protocol, the effects of culturing
the plantlets in media with an initial pH of 4.0 (low pH) or 8.0 (high pH) on the number of
microtubers formed, their average fresh weights and relative size distribution were
investigated.
Microtubers were initiated in the plantlets of both varieties 'Iwa' and 'Daeji' 2 weeks
after transfer from the multiplication medium to media at initial pH either higher or lower
than that of the standard microtuberization medium (PH 6.0). The number of micro tubers
formed by 'Iwa' plantlets was similar (about 3 per 3 plantlets) in high pH or (3.14 per 3
plantlets) in low pH treatments compared to 2.9 microtubers per 3 plantlets in standard
medium (PH 6.0), whereas in the case of'Daeji' about 3.5 microtubers per 3 plantlets in
high pH and about 5.3 microtubers per 3 plantlets in low pH medium were observed
compared to 3.1 microtubers per plantlets in standard medium (PH 6.0). The statistical
analysis indicated that significantly more microtubers were initiated by 'Daeji' plantlets in

105
480
OJ 440
.::£ - 400 (5 E .s 360 ro ~ 320 c Q) -0
280 0-0 ~ 0 240 E
.... / -...........
. -- -- ... /
~ K........... - - -........
~ (f)
0 200 ~
160 1 2 3 4 5 6 7 8 9 10
Weeks --8% Sucrose
--*- 8% Maltose
Fig. 38. Osmotic potential changes of media containing 8% (w/v) sucrose or maltose at the
beginning of the microtuberization step (,Iwa').

400
380 ........ Ol
::£ 360 ...... "0 E 340 E "-"
7ii 320 :.;::; c (]) 300 ..... 0 0.. t) 280
:.;::; 0 E 260 (/)
0 240
220
1 2 3 4 5 6 7 8
Weeks
106
9 10
--8% sucrose
"""""*- 8% maltose
Fig. 39. Osmotic potential changes of media containing 8% (w/v) sucrose or maltose at the
beginning of the microtuberization step ('Daeji').

107
6
5.5
I 5 c..
4.5
4 -+-sucrose
1 2 3 4 5 6 7 8 9 10 (8%)
Weeks -II- rraltose (8%)
Fig. 40. pH changes on media containing 8% (w/v) sucrose or maltose at the beginning of
the microtuberization step (,Iwa').

108
6 ,---------------------------------------------------,
5.5 +---------------------------------------------------~
~ 5 +----y~--------------_1~~----------~~-=~------~
4.5 +------~~--~-=~~--------------------------------~
4 +---~----~----r_--~----,_--_,----~----~--_,----~ 2 3 4 5 6 7 8 9 10
Weeks
---+-5 ucrose(8%)
-a-maltose(8%)
Fig. 41. pH changes on media containing 8% (w/v) sucrose or maltose at the beginning of
the microtuberization step ('Daeji').

109
response to the low pH medium (p:S0.05).
The 'Daeji' plantlets appeared to be more sensitive to the variations of the initial pH of the
tuberization than those of 'Iwa' as high or low pH treatments had adverse effects on
the average weight of micro tubers formed in 'Daeji', but not in 'Iwa'(Figs. 42 and 43).
The size distribution of microtubers formed by 'Iwa' plantlets was similar in all
treatmentsdespite the differences in the pH of the media at the beginning of the
microtuberization step (Fig. 44). By contrast, the size distribution of micro tubers formed
by 'Daeji' plantlets was adversely affected by the high or low pH medium (i.e. more
smaller tubers formed than in the standard tuberization medium), particularly when the pH
of the medium was high at the onset of the microtuberization step (Fig. 45).
1.5 Effect of old multiplication medium mixed with tuberization medium
Following 4 weeks of the standard plantlet multiplication protocol, the multiplication
medium was retained and then fresh microtuberization medium with varying
concentrations of sucrose ranging from 4 to 20% (w/v) was added. The actual sucrose
content in each jar was lowered following addition of the appropriate sucrose-containing
tuberization medium, as there was a 20 ± 3% increase in combined volume of both media.
The number of microtubers formed, their average fresh weights and relative size
distribution were recorded after 10 weeks of culture.
Microtubers were initiated in the plantlets of both varieties 'Iwa' and 'Daeji' within 2
weeks of transfer from the multiplication medium to a wide range of sucrose-containing
new media mixed with the retained old multiplication medium. The number of
microtubers formed was similar (about 3.5 per 3 plantlets) when 'Iwa' plantlets were
cultured in most sucrose treatments (Table 6) but was slightly lower (about 2.9 per 3
plantlets) in the 16% sucrose medium. The 'Daeji' plantlets reacted differently to the
different mixed media as more microtubers were formed (Table 6) in response to the '20%'
sucrose medium.
A reduction in microtuber size was observed when 'Iwa' or 'Daeji' plantlets were cultured
in media other than '12%' sucrose medium (Figs. 46 and 47).
From an examination of the frequencies of microtubers in different weight categories, it is

110
0.7 -,------------------------------,
0.6 +----+-----------------------1
§ 0.5 +--:E ., 0.4 +---.....
~ 0.3 +---g ~ 0.2 +---
0.1 +---
0+---High pH Low pH
pH treatments
Standard protocol
Fig. 42. Average fresh weight of micro tubers in response to the initial pH ofthe
tuberization medium (,Iwa'). High pH= pH 8.0; Low pH= pH 4.0 and standard protocol=
pH 6.0. No significant fifference was found among the treatments (ANOV A, p~0.05)
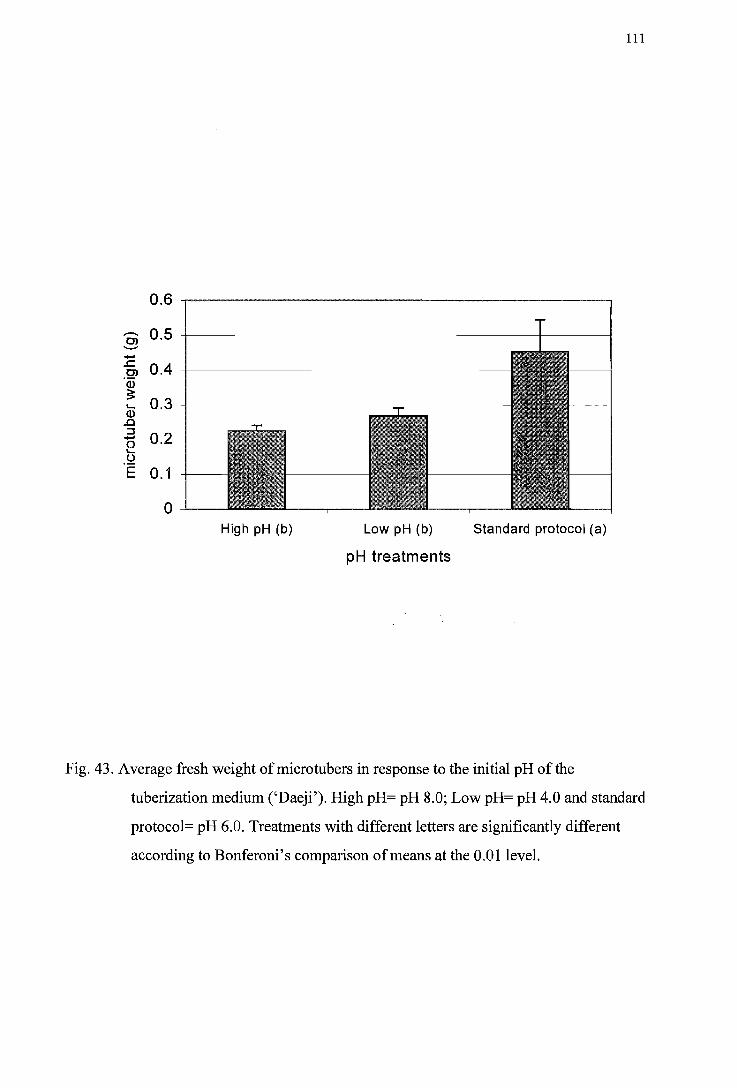
0.6
..-.. 0.5 OJ ........ .....
..c 0.4 OJ '(i) 3: 0.3 t.... (J.) .0 ::J 0.2 ..... 0 t....
.!:2 E 0.1
0 High pH (b) Low pH (b)
pH treatments
111
Standard protocol (a)
Fig. 43. Average fresh weight of micro tubers in response to the initial pH of the
tuberization medium ('Daeji'). High pH= pH 8.0; Low pH= pH 4.0 and standard
protocol= pH 6.0. Treatments with different letters are significantly different
according to Bonferoni's comparison of means at the 0.01 level.

~-~ c: 0 :p :J .0 .;:: --.~ '0 --.c 0) '0) ~ .... Q) .c :J --0 .... . ~
:::2:
60
50
40
30
20
10
0 High pH treated
Low pH treated Standard protocol
[jjJ0.1-0.25 9
[jjJ0.25-0.59
00.5-0.759
0 0.75-1.09
[jjJ> 1.0 9
Fig. 44. Microtuber fresh weight distribution in response to the initial pH of the
tuberization medium (,Iwa').
112

,...... ~ 0 '-' c 0 +' :J .c .;:: .... . !!! 1J .... .r:: Cl
'Qj ~ I.. Q) .c :J .... 0 I..
.2 :2:
80 70 60 50 40 30 20 10 0
High pH treated
113
m> 1.09
II1II0.75-1.0 9
DO.5-0.75 9
LON pH treated Standard protocol D 0.25-0.5 9 II1II0.1-0.259
Fig. 45. Microtuber fresh weight distribution in response to the initial pH of the
tuberization medium ('Daeji').

114
Table 6. Effect of old multiplication medium mixed with fresh tuberization medium.
(Number of microtubers produced per 3 plantlets per jar)
Media 'Iwa' 'Daeji'
4% Sucrose 3.71 ± 0.57 3.66± 0.26
8% Sucrose 3.60 ± 1.60 2.66± 1.50
12% Sucrose 3.60 ± 1.37 2.70± 1.78
16% Sucrose 2.88 ± 0.61 4.33 ± 0.33
20% Sucrose 2.70 ± 1.34 4.88± 1.86
No significant difference was found among the trea,tments (ANOVA, p:S;0.05)

0.7 ~--------------------,
0.6 +-----------..--.. 0)
:;:- 0.5 +-----------..c:: 0)
.~ 0.4 +-------
I-Q)
0.3 .c ::l ... 0 I-
0.2 t> :2:
0.1
0
4% sucrose 8% sucrose 12% sucrose 16% sucrose 20% sucrose
(c) (b) (a) (be) (c)
Tuberization media
Fig. 46. Effect of mixing old multiplication medium with fresh tuberization medium on
average microtuber fresh weight (,Iwa'). Treatments with different letters are
significantly different according to Bonferoni's comparison of means at the
0.001 level.
115

0.6 -.-------------------------.
0.5 -1-----------......... C) '-"' ..... "§, 0.4 -1-------
.~
Q)
f6> 0.3 .... ~ CtI ID 0.2 ..a :::J ..... o .2 0.1 :::?!
o 4% sucrose 8% sucrose 12% sucrose 16% sucrose 20% sucrose
(be) (ab) (a) (c) (c)
Tuberization media
116
Fig. 47. Effect of mixing old multiplication medium mixed with fresh tuberization
medium on average fresh microtuber weight ('Daeji '). Treatments with different
letters are significantly different according to Bonferoni's comparison of means
at the 0.001 level.

....... ~ ~ 60 c: 0 50 '+=I :::I .0 'I:: 40 iii '0 :E: 30 Cl .~
20 ... CIl .0 10 :::I e 0 0 :E
4% 8% 12% 16% 20% Sucrose concentration in the tuberization media before
mixing
110.1-0.25 9
.0.25-0.5 9
~. 0,5-0.75 9
00.75-1.0 9 .> 1.0 9
Fig. 48. Effect of mixing old multiplication medium with fresh tuberization medium on
microtuber weight distribution (,Iwa').
117

....... ~ ~ 70 c ~ 60 :::l ..c 50 .;::
]i 40 "0
1: 30 Cl
.~ 20 Q;
..c 10 .a e 0 0
~ 4% 8% 12% 16% 20%
Sucrose concentration in the tuberization media before mixing
mO.1-0.25 9
III 0.25-0.5 9
00.5-0.75 9
00.75-1.0 9
III> 1.0 9
Fig. 49. Effect of mixing old multiplication medium with fresh tuberization medium on
microtuber weight distribution ('Daeji').
118
119
clear that the '8%' and 12% sucrose media tended to favor the production of larger
microtubers in both varieties (Figs. 48 and 49). In particular, culturing in the '20%' sucrose
medium led predominantly to the production of smaller tubers, and microtubers heavier
than 1.0 g were not formed in the case of 4, 16, 20% sucrose media.
1.6 Effect of periodically refreshing the standard tuberization medium
The standard tuberization medium was discarded and replaced with fresh medium of the
same composition at 1,2,3,4,5 week intervals. All cultures were harvested at week 10,
and the number of microtubers formed, their average fresh weights and relative size
distribution were determined. In both 'Iwa' and 'Daeji' replacing medium, particularly
every 1 or 2 weeks, tended to increase the number of micro tubers formed compared to the
standard microtuberization protocol without medium change for the entire 10 weeks (Figs.
50 and 51). Also the effectiveness of replacing the medium in promoting the number of
microtubers formed seemed to decrease with a decrease in the frequency of medium
replacement.
Overall, replacing the medium during microtuberization appeared to have a positive effect
on the average microtuber weight achieved compared to the standard microtuberization
protocol. Both varieties displayed remarkably similar responses to the medium
replacement manipulation (Figs. 52 and 53). In contrast to the effect on microtuber
number, replacing the medium after 3 weeks rather than after 1 or 2 weeks seemed to have
a significant positive effect on the average microtuber weight at least in the case of'Iwa'
plantlets (Fig. 52).
From an examination of the frequencies of microtubers in different weight categories
(Figs. 54 and 55), it can be seen that medium replacement do not appear to have a
substantial effect on the size distribution of microtubers formed.
A major phenotypic change resulted from medium replacements as longitudinal shaped
microtubers were observed in most cases of replacement compared to round shaped
microtubers observed in the standard tuberization treatment (Fig. 56).

120
4.5
lB 4
Q) p 3.5 c ro a. 3 £2 ~ 2.5 Q) .0 E 2 :::l C .... 1.5 Q) .0 :::l
+-' 1 0 .... u :2 0.5
0 Every 1
(a) Every 2
(a) Every 3
(ab) Every 4
(ab) Every 5
(b)
Frequency of medium replacement
control (ab)
Fig. 50. Effect of medium replacement on the number of micro tubers formed ('Iwa').
Control= no medium change for entire 10 weeks ofthe microtuberization step.
Treatments with different letters are significantly different according to
Bonferoni's comparison of means at the 0.05 level.

5
4.5 (J) -Q) 4 -c ro 3.5 c.
£2 3 f!? Q)
..c 2.5 E ::J C 2 I-Q) ..c 1.5 ::J -0 I- 1 ()
~ 0.5
0 I
Every 1 (a)
Every 2 (ab)
Every 3 (abc)
Every 4 (bc)
Every 5 (bc)
Frequency of medium replacement (Weeks)
control (c)
121
Fig. 51. Effect of medium replacement on number of micro tubers formed ('Daeji').
Control= no medium change for entire 10 weeks of the microtuberization step.
Treatments with different letters are significantly different according to
Bonferoni's comparison of means at the 0.05 level.

cn O.9 .-------------------------------------------------~ ::- 0.8 +----------~ ~ 0.7 +----------'Q) 0.6 ~ 0.5 Q; 0.4 .g 0.3 '00.2 t5 0.1 ~ 0
Every 1 (b)
Every 2 (bc)
Every 3 (a)
Every 4 (ab)
Every 5 (ab)
Frequency of medium replacement (weeks)
Standard protocol
(a)
122
Fig. 52. Effect of periodical medium replacement on average fresh weight of microtubers
(,Iwa'). Standard protocol= no replacement. Treatments with different letters are
significantly different according to Bonferoni's comparison of means at the 0.01
level.
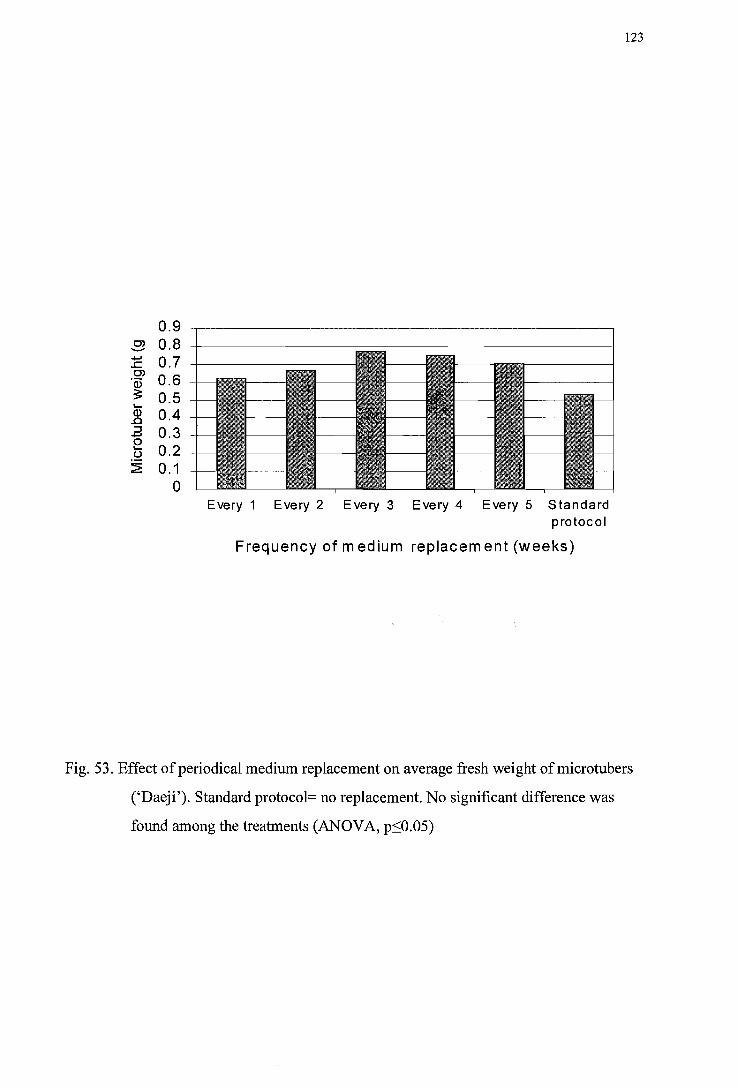
0.9 -9 0.8 ::E 0.7 C> .~ 0.6
0.5 .... ~ 0.4 .a 0.3 e () 0.2 ~ 0.1
o
123
Every 1 Every 2 Every 3 Every 4 Every 5 Standard protocol
Frequency of medium replacement (weeks)
Fig. 53. Effect of periodical medium replacement on average fresh weight of micro tubers
('Daeji'). Standard protocol= no replacement. No significant difference was
found among the treatments (ANOV A, p~O.05)

~ 35 ~----------------------------------------------~ S 30 +-----------------------:::l
,g 25 +-------------j
~ 20 .c .~ 15 ~ 10 .0
~ 5 ~ 0
Every week
2 Week 3 Week 4 Week 5 Week Standard protocol
Frequency of medium replacement
Fig. 54. Effect of medium replacement on fresh microtuber weight distribution (,Iwa').
Standard protocol= no replacement.
124
Ul 0.1-0.25 9
III 0.25-0.5 9
00.5-0.759
00.75-1.09
111 1.0-2.09
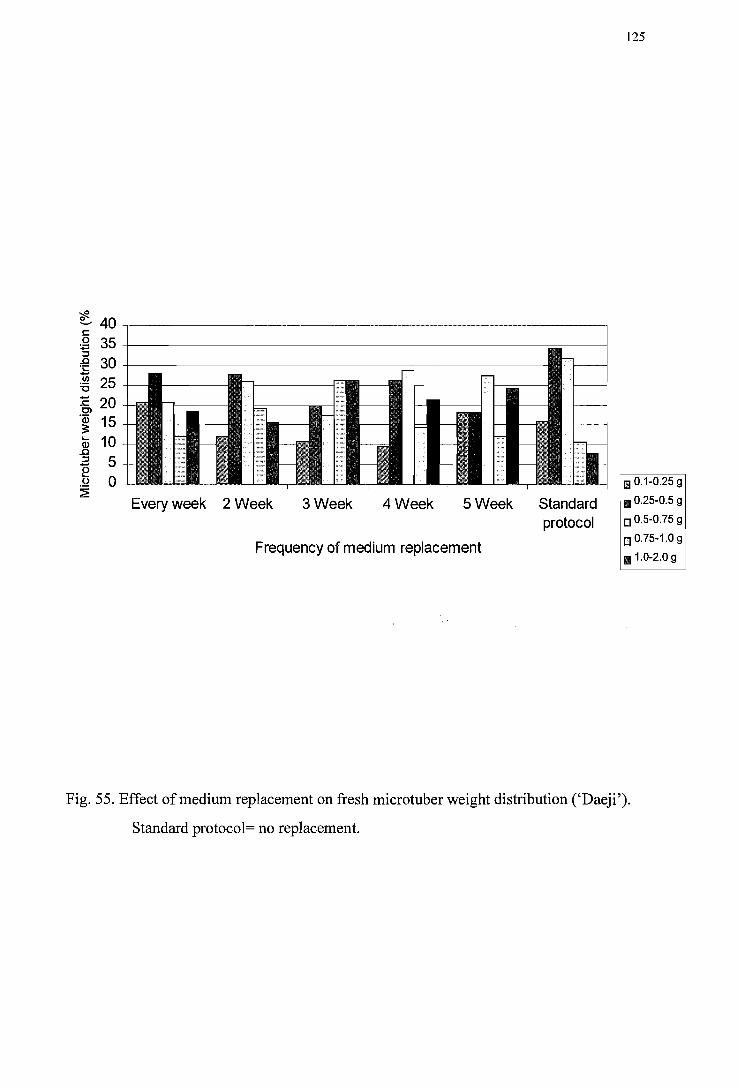
~ 40,----------------------------------------------------, c g 35+---------------------------------------------~~--~ :::I
€ 30 +-----------------------------------------------..... . ~ 25 "C
:c 20 0> .~ 15
CD 10 ..c .a 5 e u 0 ~
Every week 2 Week 3 Week 4 Week 5 Week
Frequency of medium replacement
Standard protocol
125
III 0.1-0.25 9
II 0.25-0.5 9
00.5-0.75 9
00.75-1.0 9
11 1.0-2.0 9
Fig. 55. Effect of medium replacement on fresh microtuber weight distribution ('Daeji').
Standard protocol= no replacement.

126
R
Fig. 56. A longitudinal shaped microtuber (1.,) obtained by periodic medium replacement
trealment during microtuberization compared 10 a round shaped microtuber (R)
by the standard tuberization prolocol.

127
2. Manipulations during the plantlet multiplication phase: effects on the cultures during multiplication
2.1 Standard plantlet multiplication medium containing 3% sucrose 2.1.1 Plantlet development
In the stationary liquid medium, 2-nodal potato shoot explants of both 'Iwa' and'Daeji'
developed into in vitro plants with an upright vigorous shoot and well-developed, long
green root after 4 weeks under continuous illumination. Both fresh and dry weights of the
plantlets increased during culture (Figs. 57 and 58).
2.1.2 Changes in the medium during potato plantlet development 2.1.2.1 Soluble proteins
During 'Iwa' plantlet development, the concentrations of soluble proteins increased in the
medium, particularly between weeks 3 and 4. This increase appeared to slow down after 4
weeks of culture (Fig. 59).
2.1.2.2 Carbohydrates
Preliminary paper chromatographic analysis of the medium revealed that the level of
sucrose initially present at the beginning of culture changed during plantlet development.
This was confirmed in the following HPLC analysis of the media for growing 'Iwa' and
'Daeji' plantlets (Figs. 60 and 61).
After 2 weeks of culture, glucose and fructose were detected in addition to sucrose. After 4
weeks in culture, sucrose completely disappeared from the medium with the further
increase in the levels of glucose and fructose therein. The monosaccharides appeared to be
present together in similar amounts in the medium.
2.1.2.3 Invertase activity in the medium
Invertase activity could be detected in the medium after 2 weeks of culture of'Iwa' plantlets.
The dependence ofthe enzyme activity on the pH of enzyme assays is shown in Fig. 62. A
major peak of activity was detected at around pH 5.0, indicating that the sucrose-cleaving
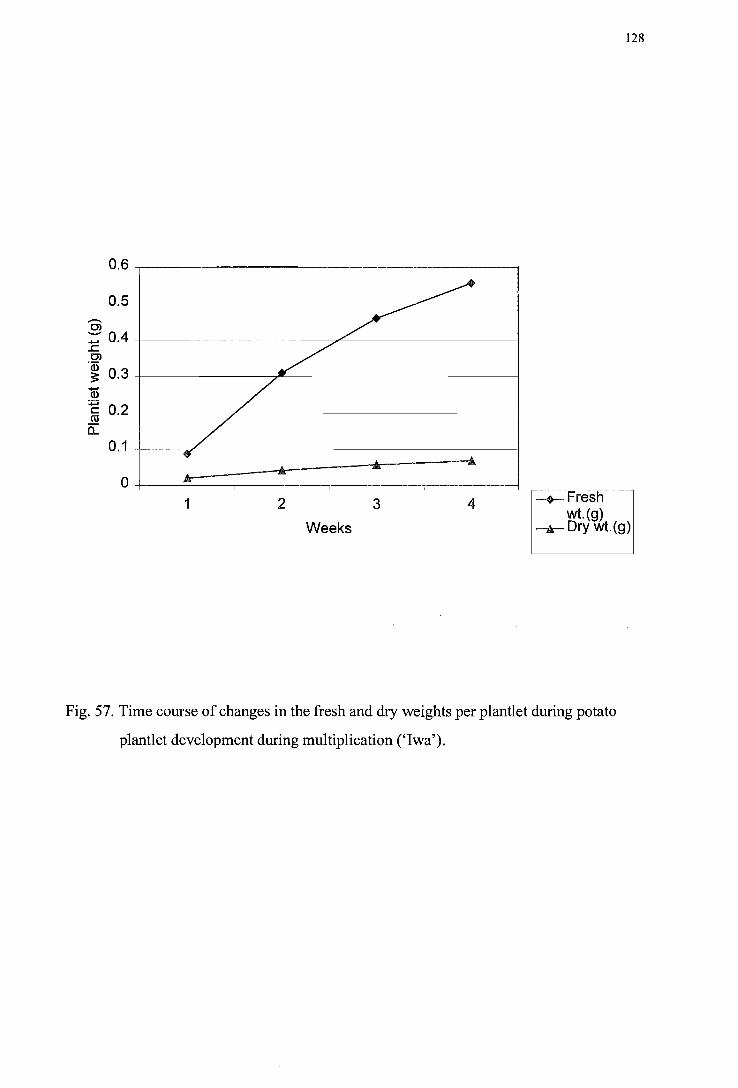
0.6
0.5
----C)
-:;:: 0.4 .c: C)
.~ 0.3 Q) :;:::; c 0.2 C\1 a..
0.1
o
/ • Jr
1
/ /
/
• • 2 3
Weeks
~
~
4
128
-+-Fresh wt.(g)
-.Ar- Dry wt.(g)
Fig. 57. Time course of changes in the fresh and dry weights per plantlet during potato
plantlet development during multiplication (,Iwa').

0.6
0>0.5 "-" ..... -§, 0.4 '03 3: 0.3
..... ~ 0.2 c ~ 0.1
o ~
~ ""
1 2
/ ~
-... 3
Weeks
/
..lIIII -4
-+-Fresh wt.
-II- Drywt.
Fig. 58. Time course of increases in fresh and dry weights per plantlet during potato
plantlet development during multiplication ('Daeji').
129

10~--------------------------------------~
E 15+-----------------------~----------------~ .... OJ :J '-' .... t:
~ 5+---------------------~----------------------~ o U t: ]i e 25+-----------------~~------------------------~ a.
O+-------_+--------·~------_+--------+_------_4
1 2 3 4 5 6
Fig. 59. Time course of soluble protein changes in the standard plantlet multiplication
medium ('Jwa')
130
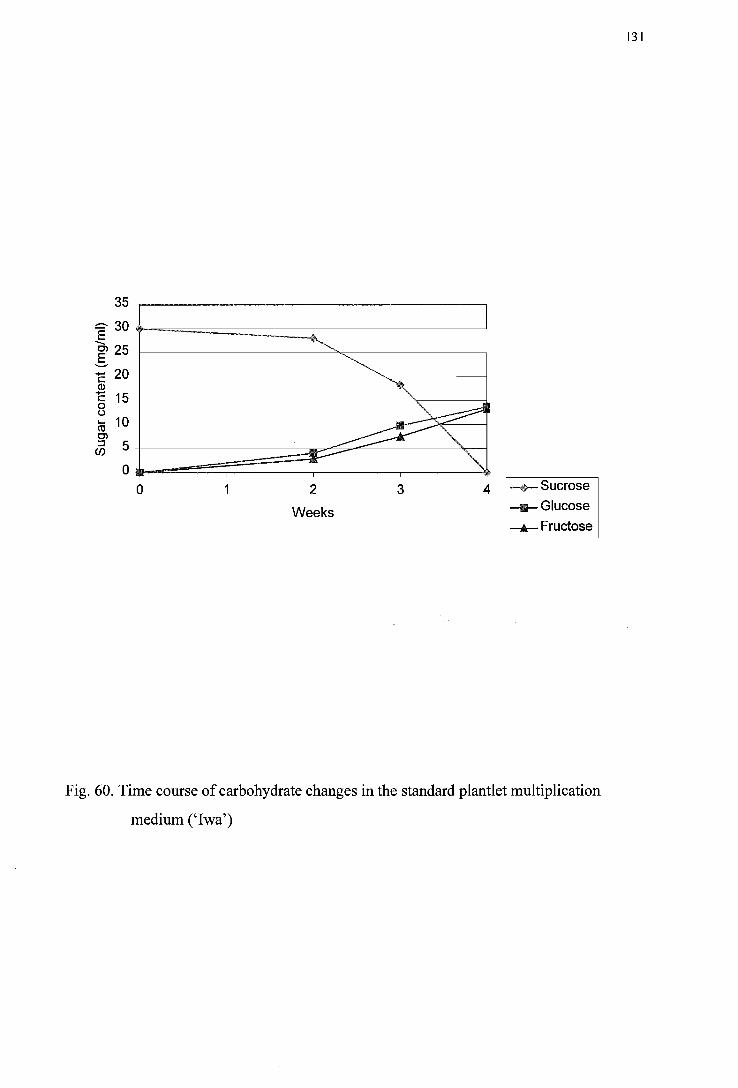
35,--------------------------------------,
E30t--=====~======~------------~ -~ 25 +----------------------==---------------~ ,S C 20 +---------------------------~----------~ (!)
C 15 o +-------------------------------~------~
()
ro 10 +-----------------------------~~~~--~ ~
~ 5 +-------------------~~~=---------~~
O~~~~==!=----~----~~ o 2
Weeks
3 4 -+- Sucrose ___ Glucose
--*- Fructose
Fig. 60. Time course of carbohydrate changes in the standard plantlet multiplication
medium ('Iwa')
131
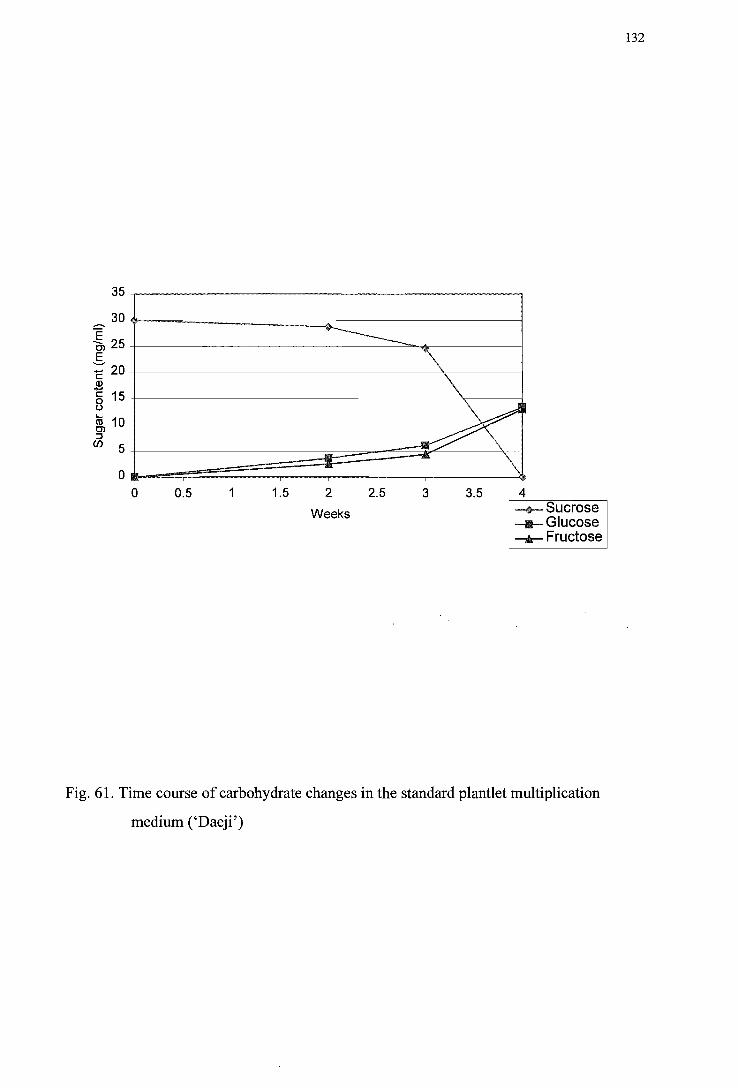
.-..
35
30
~ 25 E :;:- 20 r::: 2 r::: 15 8 ro 10 Cl ::J
CI) 5
o o 0.5
'?--------" \ ~ ~
1.5 2 2.5 3 3.5
Weeks
\ 4 -+-Sucrose __ Glucose -.tr- Fructose
Fig. 61. Time course of carbohydrate changes in the standard plantlet multiplication
medium ('Daeji')
132

133
500 (]) CIl
8'2 400 :::J .-- (]) OJ ....
::2: e c:: c. 300 ""'OJ ~ E 'S ........ • - ..c:: 13 ..... 200 co ~ (]) CIl CIl co co (])
a5~ 100 > .£
0 2 3 4 5 6 7 8 9
pH
Fig. 62. pH profile of invertase activity in the plantlet multiplication medium (,Iwa').

134
activity in the multiplication medium was an acid invertase.
The activity of invertase in the medium during growth of'Iwa' plantlets increased sharply
reaching a maximum level after 3-4 weeks in culture (Figs. 63 and 64). Subsequently
beyond the typical plantlet multiplication step the activity seemed to decrease.
2.1.2.4 Change in the pH of the multiplication medium
While the pH of the medium was initially adjusted to pH 5.8 which is close to the pH
optimum for invertase activity in the medium, it was of interest to see if this remained so
throughout the culture period during development of'Iwa' and 'Daeji' plantlets and
invertase development in the medium. The pH of the multiplication medium was measured
every week for 4-5 weeks of culture. There was a gradual decline of pH during the first 3
weeks of culture. After 3 weeks, the pH increased slightly (Figs. 65 and 66).
2.1.2.5 Osmotic potential
Osmotic potential of the medium rose during development of'Iwa' plantlets (Fig. 67) until
week 4 before dropping rapidly when the multiplication stage was prolonged beyond the
typical experimental period up to 6 weeks. The pattern of osmotic potential changes in the
medium during development of'Daeji' plantlets appears to be different (Fig. 68). There
was an initial increase in osmotic potential which then remained the same throughout
plantlet development before starting to decrease a week after the end of the multiplication
stage.
2.2 Effects of variations to the standard multiplication medium 2.2.1 Different carbohydrate media for plantlet multiplication 2.2.1.1 Comparison of plantlet weights
When the standard multiplication medium was modified to contain no sugar or 3% (w/v)
maltose instead of sucrose, it was found that sucrose was not required for the 2-nodal
potato shoot explants of both varieties under continuous illumination in a stationary liquid
medium. The fresh weight of plantlets increased markedly within 3 weeks of culture
(Figs. 69 and 70).

135
'2 2000 'OJ e 1800 c... Cl E 1600 .....
.s::. ..... "C
1400 <Il U) co <Il
1200 ~ <Il U)
1000 0 (J ::J "8l 800 ::;: 5 ~ 600 'S U 400 « <Il U)
200 (Il 1:: <Il > a .s
1 2 3 4 5
Weeks
Fig, 63, Time course of invertase activity in the standard plantlet multiplication medium
(,Iwa')

136
'2
~ 1000 0-Ol
~ 800 "0 (I) IJJ <II (I)
~ (I) 600 IJJ 0 U :::l rn :2 400 S .?;-
~ <II 200 (I) IJJ <II t: (I) > E 0
/"
/ / ~
/ V
2 3 4
Weeks
Fig. 64. Time course of invertase activity in the standard plantlet multiplication medium
('Daeji')
5
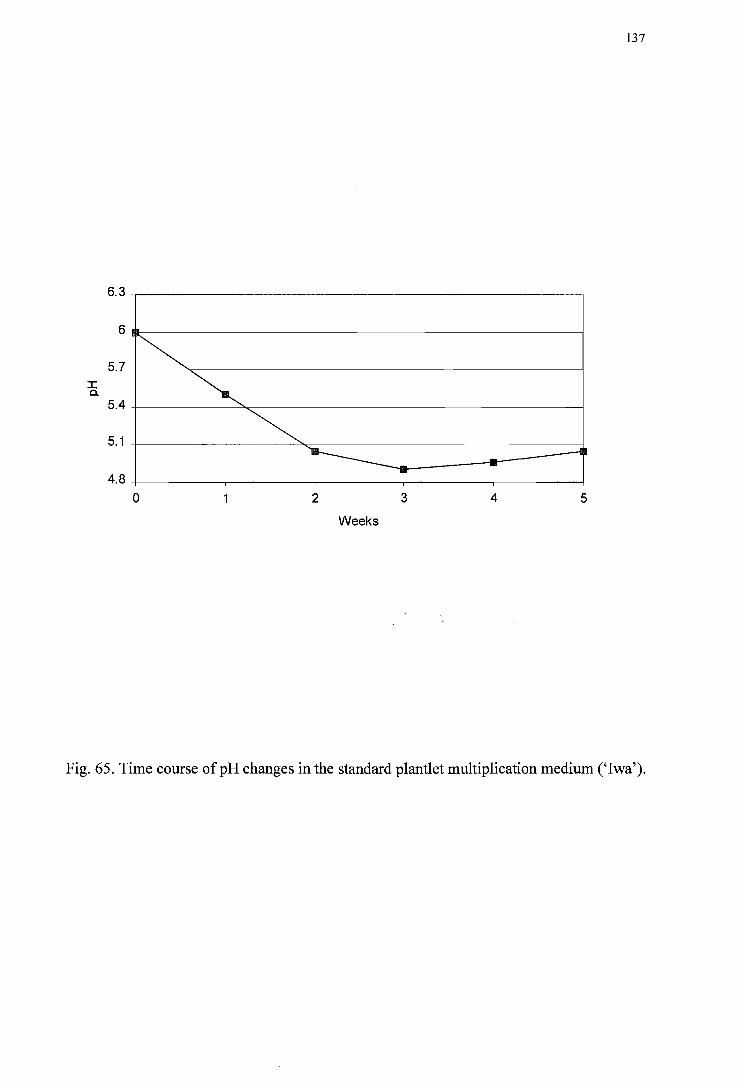
::c a.
6.3
6
5.7
5.4
5.1
4.8
~ ~ ~
o
137
'----- -1111 ~
2 3 4 5
Weeks
Fig. 65. Time course of pH changes in the standard plantlet multiplication medium (,Iwa').

I
6.3 --.-----------------------,
6~~----------------------------------------~
5.7 +--------=~--------------------j c. 5.4 +-_______________ -"'"'-......:::--________________________ ----1
5.1 +---------~~~--------~
4.8 -+-----.,-----,-----~~==---__I
o 1 2 3 4
Fig. 66. Time course of pH changes in the standard plantlet multiplication medium
('Daeji').
138

139
....-- 275 0>
:::.::: ....... "0 250 E E ........ co 225 +; c:: <I.l 200 -0 a. () +; 175 0 E tJ)
0 150 0 1 2 3 4 5 6
Weeks
Fig. 67. Time course of osmotic potential changes in the standard plantlet multiplication
medium (,Iwa').

140
........ 225 Cl ~ ....... 0 E E 200 '-'
ro :;::; c: (]) ...... 0
175 a. 0
:;::; 0 E II)
0 150 0 1 2 3 4 5 6
Weeks
Fig. 68. Time course of osmotic potential changes in the standard plantlet multiplication
medium ('Daeji').

0.6 ........ 0'1
0.5 '-" ..... ..c:: 0'1
0.4 'w :s:
..c:: 0.3 In Q) .... ...... 0.2 ..... Q)
:;::::; c 0.1 ro 0::
0 0 1 2 3
Weeks
4
141
5 -+- Sugar-free
-B-3% Sucrose
-*- 3% Maltose
Fig. 69. Time course ofplantlet growth in response to media containing different
carbohydrates (,Iwa').

142
0.6 ....... Cl 0.5 '-' -£ Cl 0.4 'Qi :;:
£ 0.3 (/) Q)
~ 0.2 -Q)
:;::; c
0.1 til a::
0
0 1 2 3 4 5 -+- Sugar-free
-11-3% sucrose V\eeks
-lir-3% maltose
Fig. 70. Time course of plantlet growth in response to media containing different
carbohydrates ('Daeji').

143
The plantlets in sucrose and maltose media had thicker and stronger stems compared to the
weak appearances of the plantlets developed in sugar-free medium.
2.2.1.2 Time course of soluble protein changes in different carbohydrate media ('Iwa')
Soluble protein contents of all 3 media increased during plantlet development (Fig. 71).
By week 4 of culture, there was little difference in the protein contents of the 3% sucrose
and 3% maltose-containing media. However, the sugar-free medium appeared to have
lower levels of soluble proteins.
2.2.1.3 Time course of carbohydrate changes ('Iwa')
No sugar was detected in the modified multiplication medium without any added sucrose
during plantlet multiplication. Maltose was apparently retained up to 4 weeks of culture in
the medium supplemented with 3% (w/v) maltose in which little or a negligible amount of
glucose was sometimes detected (Fig. 72).
2.2.2 Effect of replacing medium during multiplication on growth of plantlets
At the end of the multiplication step (i.e. after 4 weeks of culture), the plantlets grown in
the medium that was replaced at the end of week 2 had developed thicker and stronger
stems than those from the standard multiplication protocol. The fresh weights of the 'Iwa'
and 'Daeji' plantlets from the medium that was replaced were also substantially greater
than those in the standard multiplication protocol (Figs. 73 and 74). However, there was
little difference in the dry weights of the plantlets between the two treatments at this point.

E 10 --C> 2- 8 ...... c Q)
6 ...... c 0 u c 4 'w ...... e 2 c. Q)
::c 0 ::J 0 1 (J) 2 3 4 5
Weeks
144
-+-3% sucrose
___ 3%
6 maltose
-;k-Sugarfree
Fig. 71. Time course of soluble protein changes in containing different carbohydrates
multiplication media ('Iwa').

'"
M o 1 2 3 4
W&eks
ri~ . 72. P, P<" chromalOgraphy OIl time coo"",, of c.rOOhydr". <"""ie, in the ,und.,,"
m~tlpli<",joo m«lium with '0. 1",,,, in'''',," of _""" (I" .... ). S"!IOr sundanl"
M"ma l"""

2
1.8
1.6 §1.4 -..c: .2> 1.2 Q)
~ 1 I/)
ii3 0.8 ~
a5 0.6 a.. 0.4
0.2
o
~ or ~
!f
.,.. ,,,",
1 2
T
A /
/ /
/ T/ ~ ~ -- .....
~
,~y.
"" -"IIi
3 4
Weeks
Fig. 73. Effect of medium replacement treatment on plant development (,Iwa').
146
-+-Nonreplacement Fresh wt.
__ Non-replacement Dry wt.
-Jr- Replacement Fresh wt.
--1~ "Replacement Drywt.

1.6 ""' 1.4 Cl '-' 1.2 .... !: Cl 1 '(jj
0.8 ~ .... 0.6 Q) :;::;
0.4 c (1\ ...--:::::::: c:: 0.2
0 ~r. :; .....
1 2 3 4
Fig. 74. Effect of medium replacement treatment on plant development ('Daeji').
147
-+-Standard J:Xctocd Fresh v.A: .
_Standard J:Xctocd Dyv.A: .
-Ir- ReJjocerrent treated Fresh v.A:.
-'.7E.-' ReJjocerrent treated Dy v.A:.

2.2.3 Effect of manipulations during multiplication phase on microtu berization
2.2.3.1 Influence of carbohydrates in multiplication media on microtuberization under standard conditions
148
The effects of prior culturing of the plantlets in multiplication media containing different
carbohydrates on the number of microtubers formed, their average fresh weights and
relative size distribution following 10 weeks of the standard microtuberization protocol
were investigated.
Visual examination suggested that the thicker and more vigorous shoots transferred from
the multiplication media containing carbohydrates seemed to form more microtubers
which were bigger than those formed by the thin and weak shoots transferred from sugar
free multiplication medium. The number of micro tubers formed by 'Iwa' or'Daeji'
plantlets was found to be similar (about 3 per 3 plantlets) in the standard 8% sucrose
containing microtuberization medium regardless of whether the plantlets were transferred
from the carbohydrate-free or the 3% maltose, or the standard 3% sucrose-containing
multiplication media (Table 7).
The standard protocols, i.e. the transfer of 'Iwa' and plantlets from the standard
multiplication medium containing 3% sucrose to the standard microtuberization medium
containing 8% sucrose led to the highest average microtuber weight when compared to the
transfer from the modified multiplication medium containing no sugar or 3% maltose to
the standard microtuberization medium (Fig. 75). It is also interesting to note that these
latter two protocols had virtually indistinguishable effects as far as average microtuber size
is concerned. In the case of the same experiments with 'Daeji', the statistical analysis
revealed no significant differences among the 3 treatments (Fig. 76; p:::;0.05).
From an examination of the frequencies of micro tubers in different weight categories (Fig.
77 and 78), it is clear that both the 'Iwa' and 'Daeji' plantlets transferred from the
multiplication medium containing 3% sucrose, the concentration used in the standard
multiplication medium, tended to form larger microtubers and fewer of the smaller ones
when compared to the other two protocols (Figs. 77 and 78).

Table 7. Effect of different plantlet multiplication media on the number of microtubers
formed in 8% sucrose tuberization medium.
Number of micro tubers formed per 3 plantlets per jar
Multiplication medium 'Iwa' 'Daeji'
treatments
Sucrose-free 2.33 ± 1.06 2.20 ± 1.06
Maltose 3.l6 ± 1.56 2.80 ± 0.62
Sucrose 2.70 ± 0.23 3.20 ± 0.62
No significant difference was found among the treatments (ANOVA, p:S0.05)
149
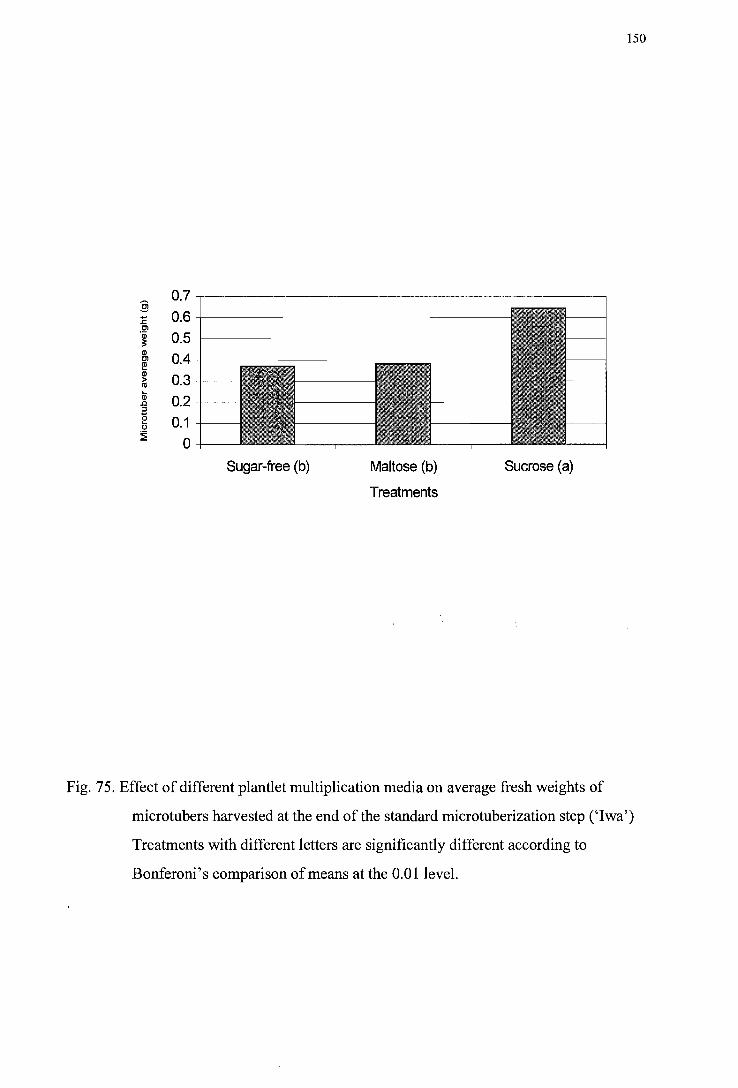
150
0.7 El
0.6 :E Cl .OJ 0.5 ~ (])
0.4 Cl ~ (])
0.3 > m Qj 0.2 .c :l e 0.1 0
~ 0
Sugar-free (b) Maltose (b) Sucrose (a)
Treatments
Fig. 75. Effect of different plantlet multiplication media on average fresh weights of
microtubers harvested at the end of the standard microtuberization step ('Iwa')
Treatments with different letters are significantly different according to
Bonferoni's comparison of means at the 0.01 level.

0.7 -r------------------------, U)
;; 0.6 + ................. ~------~~----~--~ ........ ~------1 0)
.~ 0.5 +---- ............................................... ----------------1 (J)
~ 0.4 +-__________ ~ _____ _ (J)
1:0 0,3 +---.... (J)
.g 0.2 +---e o 0.1 +--_ ~
o+--Sugar-free Maltose
Treatments Sucrose
151
Fig. 76. Effect of different plantlet multiplication media on average fresh weights of
microtubers harvested at the end of the standard microtuberization step
CDaeji'). No significant difference was found among the treatments (ANOVA,
p~O.05)

~ 80 § 70
:;:::;
il 60 .;::
~ 50 1: 40 Cl
.~ 30 (jj 20 ..c ::J § 10 ~ 0
Sugar-free Maltose
Treatment
Sucrose
IiillO.1-0.25g
II1II 0.25-0.5 9
0°.5-0.75 9
0°.75-1.0 9
II1II> 1.0 9
152
Fig. 77. Effect of different multiplication media on fresh weight distribution of
microtubers harvested at the end of the standard microtuberization step (,Iwa').

'""' ~ c .Q 'S ..c ·c in 'C .E Cl
'03 :5: .... Q) ..c :::l e u ~
60
50
40
30
20
10
0 Sugar-free Maltose
Treatments
Sucrose
E!I 0.1-0.25 9
I11III0.25-0.59
0°.5-0.759
0°.75-1.09
111>1.09
Fig. 78. Effect of different plantlet multiplication media on fresh weight distribution of
microtubers harvested at the end of the standard microtuberization step
('Daeji').
153

2.2.3.2. Effect of replacing medium during multiplication on microtu beriza tion
Following 10 weeks of the standard microtuberization protocol, the effects of prior
culturing the plantlets on multiplication media that were replaced during potato plantlet
multiplication on the number of microtubers formed, their average fresh weights, and
relative size distribution, were investigated.
154
In both 'Iwa' and 'Daeji' cultivars, replacing the multiplication medium did not seem to
have a substantial effect on the number oftubers formed in the subsequent standard
tuberization protocol (Table 8). The thicker and more vigourous shoots resulting from
replacing the multiplication medium of 'Iwa' and 'Daeji' plantlets, led to the subsequent
formation of larger microtubers (Fig. 79) than found on the plantlets grown in the standard
multiplication multiplication protocol (i.e. the medium was not changed).
An examination of the frequencies of micro tubers formed by 'Iwa' or 'Daeji' plantlets in
different weight categories revealed that replacing the medium during the standard
multiplication step led to the production of some microtubers heavier than 2.0g (Figs. 80
and 81). This category was rarely observed in other treatments including the standard
multiplication and microtuberization protocols.

Table 8. Effect of medium replacement during multiplication on the number of
microtubers formed at the end of the standard microtuberization step.
Medium treaments 'Iwa' 'Daeji'
Replaced 3.20 ± 1.31 3.23 ± 1.35
Standard protocol 2.71 ± 0.23 2.90 ± 0.76
No significant difference was found among the treatments (ANOV A, p:"S0.05)
155

156
1.4
1.2 0> --...... 1 ..c 0> '(i)
0.8 s: .... Q) .c 0.6 :::J ...... 0 ....
0.4 u ~
0.2
0 Replaced-Iwa (a) Standard-Iwa (b) Replaced-Daeji (a) Standard-Daeji (b)
Fig. 79. Effect of medium replacement during multiplication on average fresh weights of
microtubers harvested at the end of the standard microtuberization step.
Treatments with different letters are significantly different according to
Bonferoni's comparison of means at the 0.05 level.

o~ 40 ......... c 35 0
:;:::; ::J
30 .0 ·c --.!Q 25 "0 ---§, 20 .(0 s: 15 ..... (1)
10 .0 ::J --0 5 ..... . ~ :2! 0
Replaced Standard protocol
Fig. 80. Effect of medium replacement during multiplication on fresh weight
distribution of micro tubers harvested at the end of the standard
microtuberization step (,Iwa'). Standard protocol= no medium
replacement.
11°.1-0.259
11°.25-0.59
0°.5-0.759
0°.75-1.09
11 1.0-2.0 9
11>2.09
157

........ 40 '*' '-"
c 35 0
:.;::: 30 ::J
..c .;:: +-' 25 .~ "C +-' 20 .c C'l '(j) 15 3: .... Q) 10 ..c ::J +-' 5 0 .... . 2 ~ 0
Replaced Standard protocol
Fig. 81. Effect of medium replacement during plantlet multiplication on fresh
weight distribution of microtubers harvested at the end of the standard
microtuberization step ('Daeji').
158
Dl/0.1-0.25 9
Dl/0.25-0.5 9
00.5-0.75 9
00.75-1.0 9
.1.0-2.0 9
Dl/> 2.0 9

159
3. Ultrastructural Observations
In the course of this study, several observations seem to deserve more in-depth
physiological and biochemical investigations. First, some parts of the stem and leaves of
plantlet were submerged in the liquid multiplication and microtuberization medium.
Second, at the end of the plantlet multiplication step, the roots turned green and some
remained so in the subsequent microtuberization step. Third, some white clusters of cells
became floating freely in the medium during the microtuberization step. The implications
of these observations for the efficiency of plantlet growth or microtuberization are
unkown and could be significant. In the present study, it was decided to conduct an
ultrastructural survey with particular emphasis on the features of chloroplasts or plastids
in the various tissues of 'Iwa'.
3.1 Stem and leaf of in vitro potato plantlets grown in liquid medium
The upright, vigorous shoot tissues of plantlets that were above the liquid medium surface
at the end of the standard multiplication step had well-developed chloroplasts with typical
ultrastructural features (Plates 1 and 2). The granal stacks were relatively small and the
grana formed irregular continuous stacks, interconnected by stroma thylakoids. Within the
stroma plastoglobuli were found (Plate 1). In the stem, granal stacks of the chloroplasts
displayed a few large continuous stacks mostly regular in shape, occupying most of the
org<melle (Plate 2). Plastoglobuli were also found. In the chloroplasts of both leaf and stem,
no starch grains were found.
3.2 Stem and leaf cells submerged in liquid medium at the end of the standard multiplication step
Some chloroplasts in green stems that had been submerged in liquid medium throughout
the multiplication step possessed starch grains (Plate 3). The matrix of chloroplasts
contained plastoglobuli. Microbodies

, .
.... I III-I._.~ , ........... ..... -..II p.....+" .. - ' ... n ......... ' .. k~',~ ,_.., •
....... ,....,I..rl ... 'P"""'''1..,...1 __ \~ ... _ 111._,
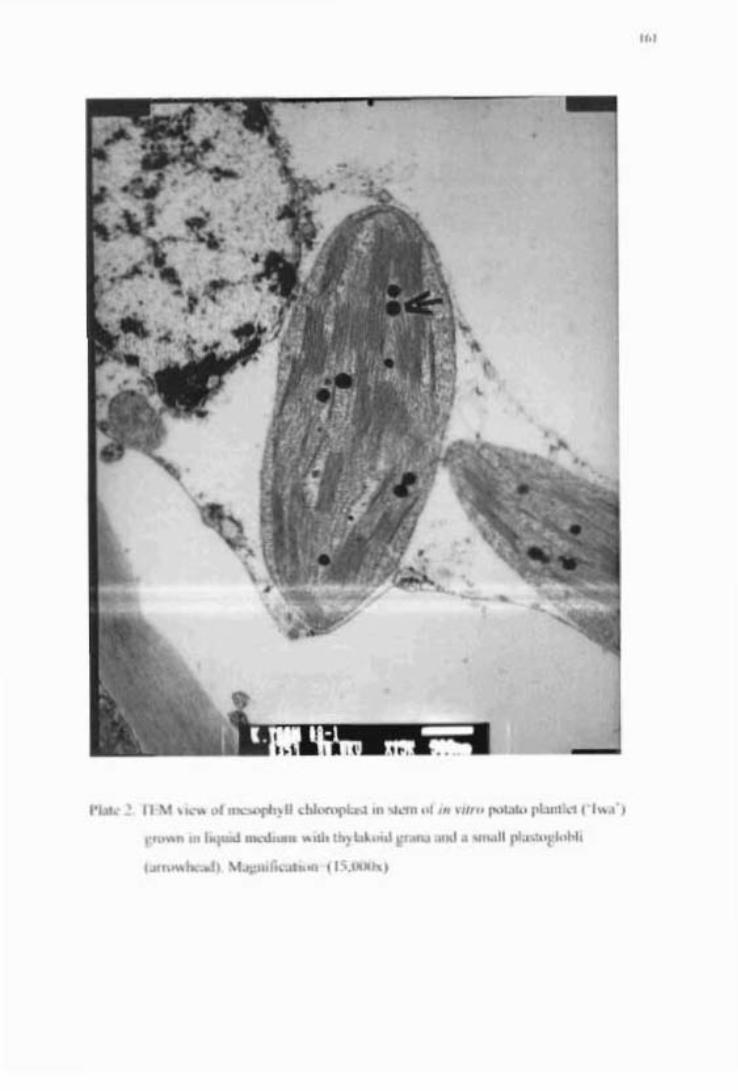
.'
~._._d'_""~w.....a ......... _,....... .........
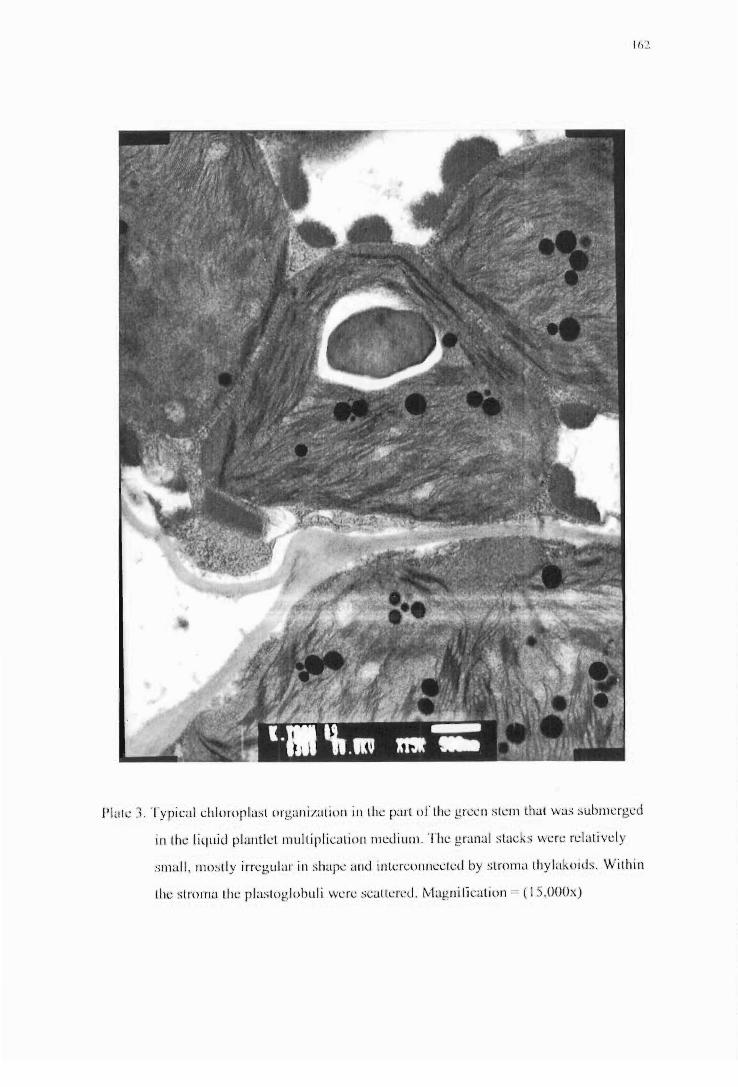
11>2
PI<,le J. Typical ehlororlast (lrg~1I1izatiIJIl ill Ik p~ lrt or lite greell skill lhat W;J.S sublllcrgcd
in thL.~ liquid plalltll:l mulliplieali(lll mcdillill. Til l'; granal stacks were rclatiwly
sma ll , mostl y irregular in share and inlcrcolllicctl:d by s troma thylakllid s . \Vilhin
the s lrnrn'l lhe plaslogllJhuli were scallcn:d. [vlagllilicatioll = ( 15,O()()x)

163
Microbodies were also observed alongside chloroplasts (Plate 4). Chloroplasts were also
found in the parenchyma of leaves that were submerged in liquid medium, but
ultrastructural features appeared to be in a more compressed state. In these chloroplasts, the
granal stacks were mostly parallel to the long axis of the organelle (Plate 5). They
represented a type of chloroplast that contained less developed thylakoids and plastglobuli
(Plate 6) than those found in the non-submerged stem.
3.3.1 Stem and leaf after microtuberization in liquid medium in the dark
Amyloplasts with large starch grains were dominant in stem or leaf submerged in liquid
medium at the end of the standard microtuberization step. The amyloplast had an irregular
appearance (Plates 7a and 7b).
3.3.2 Green roots in liquid tuberization medium
At the end of 10 weeks of the standard microtuberization step, some roots that remained
green and some were white. Both types of roots were harvested for TEM study. Green
roots maintained their typical root anatomy. The cortical cells contained abundant
chloroplasts, mostly plano-convex in shape, located at the periphery of the cell (Plates Sa
and Sb). These showed typical cortical cell ultrastructure. Their chloroplasts had well
differentiated thylakoids, plastoglobuli and starch grains. Granal stacks were more
abundant, while some had a complex and irregular shape. Overall the chloroplasts found in
the green roots were very similar to the chloroplasts found in leaves.
In contrast, the plastids of cortical cells from non-greened roots remained largely
undifferentiated and in some cases had starch granules. Within the stroma matrix of the
plastid ovoid starch grains were often surrounded by an electron transparent zone (Plate 9).
Dictyosomes were typical of storage parenchyma cells from active and young tissues, and
showed vescicles of varied sizes (Plate 10).

•
.. ,----------------..
I ....... ' , .. _ .... ...,~,.j ... """ ___ .... ~opl.I"I"'OI_h_ ...

- ••• .... ... - .... .. .......... ,t"' .. -a"~..... . ....... , <N
,....... '1-, ................ -1 ....... _ _ .. _
, '."

'.
1'1.00< b II \' ,""" ,~-... ......... M~ ..... II rl;bl.'!;~_, on 1<-., ,......, _""..J .. IkI",I."""'.H ;0 ...., ...... ,~ 'b,,'_lotd .... '''rb ....... "<p II Io;oJ 1.; ..
... ~, ... 'fI"llh)b~ .... ,..., ..... ~_ I ........... ". "' ......... ,.J M"""' ........ ,2U.IlO(k)

«Ok' 0'''' """",,, ... '" ..... ,' '" 101"..! ".,J,"", ,,, U~· .... ,~ " ..... ' ........ (1<000"
, ..

,.
"""'" ........... , ......... _._ .................. _ ... _ ... d
..... -_ ............ ..,. ........... ' - ........... ~
.'-""' .. "~,-,

.......... Ib' ;;'~"""""'''-'''~_'''''f''''''''''' I ............ .. ...". ...... __ , 1_~I<>o_;' . J:..hoIo ,;_,~ ... ; ..... ,;

- -----.
e e.
• , •
""'"" '" , hI<.,,,,",~ ... .., ..oI ... ft "* _ ..... t........... .. ................ _ .. _ h. __ -.I.., ... ~ ........ , .. .-.--' ..... _

•
" . , 1/ ' • ,< •
, ... "
"",,,," II J, ,,.,.. ,.,., 1'1"" oJ ,,.. .. ",""" ",II, t""" """,,''''''''' '''' .. '''+" '" , .. ,"'""".'" ""......,,, 'lo< pLo~ .. ........... ..I ~". ond">a<."_,, ""'" [".n
"""~ ~, .. " .... ~ .. ..,.., ... -... .. -l.!S.IXI<"1
",

'"
, • • , • • , • , • . ' • ) • t "
.. • , • •
• •
'"

173
3.3.3 Microtubers in liquid medium
In non-greened microtubers in liquid medium in the dark, the plastids of tuber cells
remained largely undifferentiated and had large starch grains which suggests some
organelles were destroyed by the long-term dark period. Microbodies had a granular matrix
with a crystalloid center (Plates 11 and 12). Mitochondria (Plate 12) had cristae, and a
matrix with a low electron density, which is characteristic of those from inactive or aged
tissues.
In secondary microtubers, ovoid amyloplasts had a larger stromal volume with wide
electron transparent zone and the lamellae were more or less parallel to each other (Plate
13). Mitochondria had a more electron dense matrix and more well-developed cristae
suggesting that they were functionally active organelles. The space between lamellae was
very narrow. Starch granules showed irregular shapes.
3.3.4 Floating cells in liquid tuberization medium
Oval amy lop lasts were found in cells floating in liquid microtuberization medium. They
contained large starch grains, which had irregular shapes (Plate 14). The amyloplast
envelopes were less tortuous. Other organelles were also clearly evident. The origins of
these non-green cells remained obscure.

'"
""'" 11 , ................ _ ~ ...... ,._~ ... ",) ...... " ................. _~
.. _ .. ... _ ........ _~_ ........... _"'_ "' ... "" .... I0.0I .... _
_ ..... , ... ". J ...... "-, ....... t~I .... "
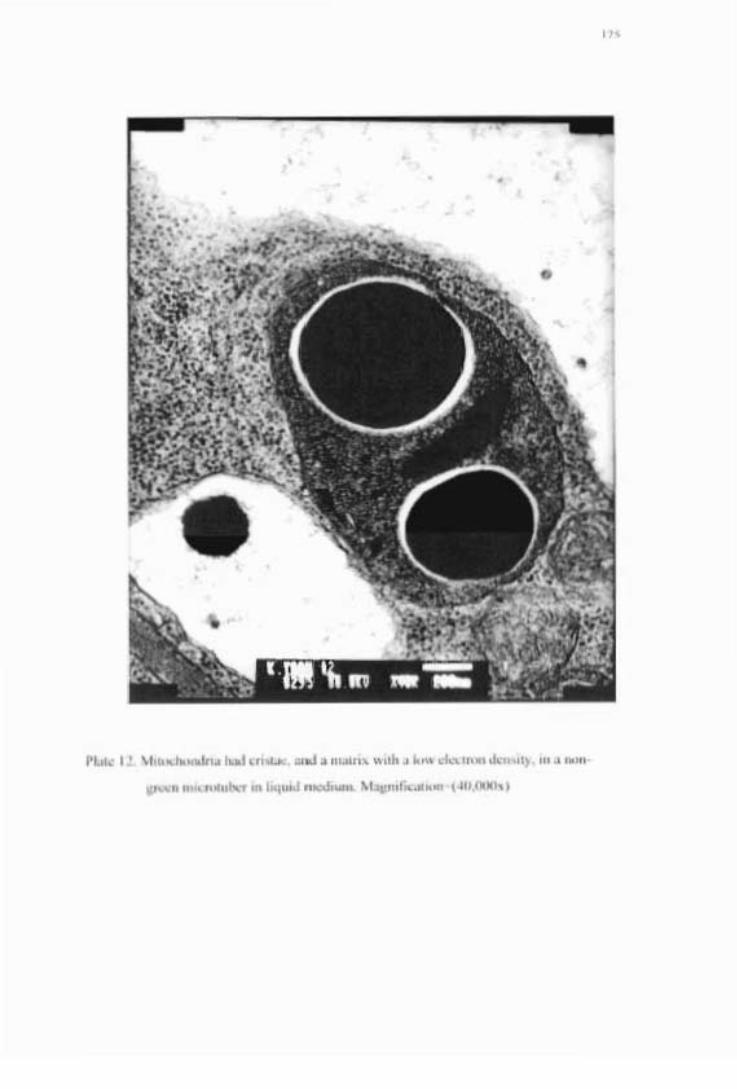
• •
_,~ ~.......-..tuJ ......... """ ...... "~ ..... ,, .... .t.. ..... __ .......
-----,,' ~ ....... """, ... ,

•
'r
•• • • • \ . .
~ . , . •
•
. ~
___ 'WI ...... .u "'~'I"'· """' ... '" '" ~"" "",011<1 •• __ -..
'''-'''''''''' "","""
..

-... _..u."""~",u.,,, .. , __ ''''. __ ''' ...... noaI .. ,I.", ... " ...... _d~'t""" _ ... ,. '" .,,.f _ "U ....... ,

IV. Discussion
The advantages of studying the manipulations of media on the plantlet multiplication or
microtuberization step separately become clear in the following discussion on the major
findings ofthe present study.
178
1. Is sucrose superior to glucose or fructose for potato microtuberization?
There are studies comparing the effects of different carbohydrates on potato
microtuberization although there is no clear explanation in the literature on the functions
of carbohydrates in microtuberization medium compared at concentrations ranging from 4
to 12% (Chandra et al. 1988).
For example, it was observed that 8% sucrose was optimal for the development and
growth of microtubers, while smaller microtubers were obtained on medium containing
glucose or fructose, and none on that containing mannose or mannitol (Khuri & Moorby
1995). These authors also observed that fewer microtubers were produced on glucose than
sucrose medium. Previous studies did not examine the microtuberization response of well
grown in vitro potato plantlets to different carbohydrates. In particular, it has not been
established whether sucrose is superior to its constituent sugars, glucose and fructose.
Hence in this present study, the effects of glucose and fructose on potato microtuberization
were studied singly or as a mixture of glucose and fructose and compared to sucrose in the
standard tuberization medium (Fig. 19-24).
In addition, two possible criticisms of this type of study were addressed. To avoid any
initial difference in osmotic potential or carbon content among the different media, the
three monosaccharide-containing media were adjusted to be osmotically or carbon content
equivalent to the standard tuberization medium containing 8% sucrose. The results on
microtuber number and average microtuber weight did not show any clear advantage of
the sucrose-containing medium over the other three monosaccharide-containing media.
However, an examination of the microtuber size distribution revealed that while there was
no difference between the sucrose- and the glucose + fructose-containing media, they were
superior to the glucose-containing medium as they favored the formation of more larger
microtubers than the latter medium. The effect of the fructose medium more resembled

179
that ofthe sucrose- or the glucose + fructose-containing medium. Taken together, our
results seem to indicate that the invertase-mediated hydrolysis of sucrose in the standard
tuberization medium is not essential for microtuberization.
2. Can another disaccharide replace sucrose in the standard tuberization medium?
Most potato (Solanum tuberosum L.) anther culture protocols recommend sucrose as the
sole carbon source (Sopory 1979; Wenzel et al. 1983). However, some studies have
suggested that sucrose may not be the ideal carbohydrate for all tissue culture systems
(Ben-Hayyim & Neumann 1983; Fowler 1978; Keller et al. 1975; Kochba & Speigel-Roy
1973). In particular, maltose (an a 1-4 linked glucose disaccharide) has been found to
improve embryo induction and development in anther culture of petunia (Raquin 1983),
somatic embryogenesis of alfalfa (Medicago sativa) (Strickland et al. 1987) and anther
culture in potato (Batty and Dunwe1l1989) and in a number of other species, particularly
conifers.
In this study, similar tuberization results were obtained with maltose medium and the
standard sucrose-containing tuberization medium (Table 4(a), 4(b); Fig. 37). Khuri &
Moorby (1995) investigated microtuberization on media supplementied with 4% sucrose
and one of the following sugars: sucrose, maltose, glucose or fructose, while adjusting the
initial osmotic potential of the media to be equivalent to 8% sucrose. They found that
significantly fewer microtubers formed on media with 4% sucrose supplemented with
monosaccharides or maltose than with sucrose (equimolar media). However, their
experiments were more complicated than ours for direct comparison. Particularly, there are
two different aspects of experimental design. Firstly, in their study, the effect of a mixture
of sucrose and maltose was studied, not maltose alone. Secondly, maltose was supplied in
the media right from the beginning of plantlet multiplication rather than from the onset of
microtuberization (this study).
There have been, however, few suggestions as to why the sucrose and maltose could have
different effects upon the various plant tissues under in vitro conditions.
In biochemical terms the observations are unusual, since sucrose is the major carbohydrate
180
source supplied to non-photosynthetic plant tissues in vivo, and, hence, it would be
expected to be the optimum carbohydrate source for supporting growth of plant tissues in
vitro. Furthermore, when sucrose is supplied to non-photosynthetic plant tissues, it is
frequently hydrolyzed by cell wall invertases to glucose and fructose which then enter the
cells in which sucrose is metabolized (Lucas & Madore 1988). Hence, glucose and
fructose would also be expected to be good carbohydrate sources for supporting growth of
cultured plant cells. In contrast, maltose is not known to be supplied to non-photosynthetic
plant cells; therefore, it would not be expected to be a better carbohydrate source for the
culture of plant tissues than sucrose, glucose or fructose.
The effect of substituting sucrose with maltose or other sugars in a liquid medium on the
response of wheat anther culture was investigated (Datta & Wenzel 1987). Maltose instead
of sucrose, glucose or fructose in the culture medium led to increase in the number of
embryos or plants regenerated from cell cultures. They measured sugar concentrations in
the culture media indicating that sucrose was rapidly hydrolyzed much earlier than
maltose. From our experiment, a negligible amount of glucose was detected up to
harvesting time from the maltose medium by paper chromatography. So it is assumed that
extracellular maltose was absorbed through the cell membrane except for a little
hydrolysis in the medium during microtuber growth.
3. Invertase activity in culture media
From the time course observation, invertase activity increased during rapid growth of
microtubers and then decreased when rapid growth of microtubers stopped (Fig. 6).
Invertase (a-D-fructofuranosidase, E.C. 3.2.1.26) is a highly polymorphic glycoprotein
that cleaves sucrose into hexose sugars (Myrback 1960). Investigation of plant tissues has
revealed more than one activity of invertase on the basis of pH optima, isoelectric points,
solubility characteristics and intra or extra-cellular localization. On the basis of pH optima,
plant invertases can be broadly divided into two groups, acid and alkaline enzymes. The
soluble alkaline invertase is thought to reside in the cytoplasm (Ricardo & ap Rees 1970).
Two types of acid invertases have been described: a soluble (vacuolar) and a particulate
form (apoplasmic or cell-wall bound enzyme). The physiological role of acid invertases in

181
plants is complex and may change in response to developmental (e.g. Strum et al. 1995)
and environmental signals such as wounding (Matsushita & Uritani 1974; Strum &
Chrispels 1990) or gravitopism (Wu et al. 1993) and pathogen infection (Strum &
Chrispeels 1990; Benhamou et al. 1991; Scholes et al. 1994; Wright et al. 1995; Tang et
al. 1996).
In the case of cultured cell, the enzyme is secreted into the medium (Thomas et al. 1981;
Thorpe & Meier 1973; Zamski &Wyse 1985; Masuda et al. 1988). Two extracellular
invertases were found in the growth medium of the suspension cultures which were
probably identical to those in the soluble fraction of callus and seedlings of sugar beet.
Extracellular invertase activity in the medium appeared on day 3, when the cells had begun
logarithmic growth, and thereafter increased steadily, although its activity was low. These
authors suggest that some of the soluble acid invertase passes through the plasma
membrane and then some binds to the cell wall, while the rest is secreted into the medium.
Furthermore, one of the two invertases, which was found only in the medium, might be
secreted directly, and not via the wall, into the medium. Both extracellular invertases had
an optimum pH of 5.0, but showed different profiles of activity with changes in pH. Thus,
these authors concluded that the invertase found in the medium might be present in a
soluble form, and bound to the cell wall, in intact plants.
In the present study, the enzyme detected in the multuplication and tuberization media was
of the acid type (Figs. 5 and 62), because the stem and roots submerged in the medium
seemed to have invertase with two optimal activities at around pH 4 (Fig. 7). This suggests
that there might be a preferential release of acid invertase from the submerged tissues to
the medium.
Analysis by SDS-PAGE of crude protein preparations from liquid medium revealed a
dominant protein band, which had an apparent molecular mass of 30 kD. Interestingly,
invertase from tubers and leaves of potato detected on SDS-PAGE also had a molecular
mass of 30 kD (Burch et al. 1992). The most satisfactory method to detect invertase
isozymes after non-denaturing gel electrophoresis involved the use of an axillary
chromogenic system. The gel slabs immersed in soluble staining system overnight showed
a single stained band with a pI of 6.75 on the upper side of the gel (Fig. 8). A similar band

182
appeared to be present in root and stem and in the multiplication medium. A potential
biotechnological application from this observation is that the spent tuberization medium or
plantlet multiplication medium or potato plantlets in vitro could be a source of a particular
isozyme of invertase.
Sonnewald et al. (1997) found that expression of yeast invertase in the cytosol of potato
plant cells led to a reduced tuber size and an increase in tuber number per plant, whereas
accumulation of enzyme in the apoplast resulted in a marked increase in tuber size and
decrease in tuber number. It was suggested that manipulating sugar levels in various
subcelluar compartments can have profound effects on sink organ development and that
manipulating sugar-metabolism can increase sink size. All have important
biotechnological implications.
Sucrose breakdown can occur through two possible pathways in the plant. Sucrose can be
broken down into glucose and fructose by invertase (~-D-fructofuranoside
fructohydrolase, EC 3.3.3.26). It can also be broken down into fructose and UDP-glucose
by sucrose synthase (UDP-D-Glc:D-Fru 2-a-D-glucosyltransferase, EC 2.4.1.13) (Avigad
1982; Morel & ap Rees 1986).
In liquid medium we found accumulation of the same amounts of glucose and fructose
while sucrose level was declining, suggesting that invertase, rather than sucrose synthase,
was acting on sucrose in the medium during plantlet development or microtuber growth.
During the first 3 or 4 weeks, the pH of the plantlet multiplication or microtuberization
medium respectively dropped toward being more acidic. This means the medium was
more optimal for the acidic invertase activity therein and this was therefore probably the
cause of the rapid sucrose hydrolysis at 2-6 weeks.
It can be argued from the time course of invertase activity (Fig. 6) that the initial increase
was a response to the presence of sucrose in the medium. When the sucrose disappeared
from the medium during tuberization or plantlet growth, the increase in enzyme activity
stopped suggesting that the plantlets can produce and/or release the invertase into the
medium in response to the sucrose as the required stimulus. Thus the time course of
invertase activity correlates with the changes in sucrose status of the medium rather than
with plantlet growth or microtuber growth.

183
4. Relationship between osmotic potential changes in culture media and microtuberization and plantlet multiplication
From the first report (Barker 1953) until recently, microtuberization was studied mostly
using sucrose in the medium as an energy source for developing tubers. Few researchers
investigated the possible osmotic role played by sucrose. One popular experimental
approach has been to substitute other carbohydrates for sucrose, particularly sugar
alcohols, in the tuberization medium. Fung et al. (1972) cultured etiolated stolon nodes on
White's medium (1943) to which sucrose was added at 2,8 or 12%. The osmotic
potentials of the media were made equal using different concentrations of mannitol. Later,
it was found that mannitol inhibited microtuberization (Garner 1987).
The use of each of four exogenous sugars or sugar alcohols as an osmoticum (sucrose,
glucose, mannitol and sorbitol) is widely accepted in plant tissue culture work, although
each is favored for different applications. Glucose is recommended by a number of
workers as a very suitable exogenous sugar for routine tissue culture work (Gamborg et al.
1975; Michayluk and Kao 1975; Evans et al. 1980). Other workers favor sucrose as a
exogenous sugar for routine tissue culture (Murashige and Skoog 1962; Shepard and
Totten 1977; Bidney and Shepard 1980; Shahin and Shepard 1980). Sucrose alone is
favored for regeneration of Solanum (Gleddie et al. 1983; Mukherjee et al. 1991),
compared to combinations of glucose and mannitol, or glucose and fructose. Sorbitol was
found to be beneficial in culturing meristem tip explants of Malus robusta when glucose,
sucrose and fructose proved unsuitable (Pua and Chong 1984), although in this case the
sugar alcohol was not intended primarily as an osmoticum. It has also been useful in
improving apricot culture (Marino et al. 1989, 1993). Mannitol is metabolized in some
plants (Trip et al. 1964; Tholakalabavi et al. 1994) and is taken up by potato plants in vitro
and transported to the shoot (Lipavska and Vreugdenhil 1996); however, for other plants,
mannitol is regarded as an inert osmoticum (Oparka and Wright 1988; Wright and Oparka
1990; Do and Cormier 1991).
Khuri & Moorby (1995) reported osmolarity of base medium as 4% sucrose supplemented
with additional sucrose (4%), maltose (4% equivalent osmotically to that of sucrose),

184
glucose (4% equivalent osmotically to that of sucrose) or fructose (4% equivalent
osmotically to that of sucrose), with an unsupplemented 4% sucrose as a control. The base
medium was one on which Solanum tuberosum cv. Estima explants were grown for 12
weeks comprising the plantlet multiplication and in vitro tuberization stages. The osmotic
potential of all media rose slightly until week 9, but by week 12 it was the same as that at
week 1.
Two possible criticisms can be directed again these earlier studies. Firstly, although many
attempts were made to adjust the different media to have the same osmotic potential, there
was no consideration (except the study of Khuri and Moorby 1995) given to the possiblity
that the osmolarity of the media might become different during culture. Second, there was
no attempt to compare the changes in osmolarity of the media separately during plantlet
multiplication and tuberization.
Many researchers suggested that microtuber induction might depend on the osmotic shock
of high sucrose solution. In the present study, microtubers were initiated in the presence of
a wide range of sucrose concentrations.
Osmotic potential of the standard tuberization medium rose between 2 to 5 weeks before
dropping slightly to a steady level until harvest. This pattern of osmotic potential changes
seemed to correlate with microtuber growth. However, an examination of the osmotic
potential changes in other media investigated here casts doubt on the overall significance
of osmotic potential changes in the tuberization medium in relation to microtuber initiation
and growth. For example, in the tuberization medium 8% maltose, the pattern of osmotic
potential was different from that of the 8% sucrose medium, to the marked increase of
microtuber fresh weight within 7 weeks of culture. Osmotic potential changes in
multiplication medium was well matched with plantlets biomass increase in the first 4
weeks of culture. It dropped rapidly when that stage was prolonged up to 6 weeks. It was
assumed that glucose and fructose were utilized as a carbon source for the plantlet growth
after sucrose hydrolysis.
5. Correlation between time course of carbohydrate changes and that of microtuber growth and plantlet growth

Sucrose hydrolysis has been widely reported in cell culture media (Maretzki et al. 1974;
Thomson & Thorpe 1987; Tremblay & Tremblay 1995) and in media for
micropropagation (George 1993).
185
Here, compositions of sugar in the standard microtuberization medium also exhibited
remarkable changes (Figs. 3 and 4) during the rapid phase of microtuber growth (Fig. 2;
week 3 to week 6) as did the compositions in the standard multiplication medium (Figs. 60
and 61) during planlet growth (Figs. 57 and 58).
After 6 weeks of culture, sucrose in the tuberization medium was almostcompletely
converted to glucose and fructose, which were present in similar proportions. The
cessation of further microtuber growth seems to correlate with the disappearance of
sucrose rather than the depletion of carbohydrate from the medium per se.
Breakdown of maltose in the medium could be expected to yield two glucose molecules,
but the paper chromatographic result showed maltose in the medium remained mostly
intact up to 10 weeks, a finding similar to that in the study ofKhuri & Moorby (1995).
This indicates that there was negligible breakdown of maltose and maltose was utilized via
another metabolic pathway to support the development of microtubers.
6. Possible interaction between carbohydrate levels in tuberization medium and gibberellin levels in stolon tips
Phytohormones, particularly gibberellins (Gas), have been suggested to playa prominent
role in control oftuberization (Ewing 1987; Vreugdenhil and Struik 1989). Exogenous
application of GA promotes stolon elongation and inhibits tuber formation (Smith &
Rappaport 1969; Kumar & Wareing 1972). It has also been reported that decline of GA
activity in potato (Solanum tuberosum L.) plants is associated with tuberization (Okazawa
1959, 1960; Smith & Rappaport 1969; Pont Lezica 1970; Railton & Wareing 1973; Krauss
& Marschner 1982). Although the inhibiting effect of GA on potato tuberization is well
studied, the interaction between GA and other regulating factors on the control of
tuberization is still a matter of debate.
Xu et al. (1998) reported much higher levels of GAl in the tip of stolons growing in media

186
with 1 % sucrose, than with 8% sucrose, suggesting that sucrose could modulate
endogenous GA levels in the stolon tip. The significance of this finding lies in another
observation that endogenous GAl level was high during stolon elongation and remained
high under non-tuber-inducing conditions but decreased when stolon tips started to swell
under tuber-inducing conditions. Thus GAl levels in the stolon tips were negatively
correlated with sucrose concentration in the medium indicating that the endogenous GA
levels could be closely associated with the sucrose concentration in the medium.
It is possible that sucrose acts as a regulator by influencing endogenous GA levels during
tuber formation.
Evidence supporting the role of sucrose as an regulatory signal includes a study increasing
the level of sucrose in the stolons by antisense expression of the ADP-Glc
pyrophosphorylase cDNA and thus preventing starch formation in the tubers. This led to
an increased number of tubers being initiated, even though they did not grow very large
(Muller-Rober et al. 1992).
The present study the result of varying sucrose levels in the standard tuberization medium
is consistent with the idea that different levels of sucrose in the medium could modulate
GA levels affecting tuber formation.
Since sucrose in the medium was actually hydrolyzed during tuber initiation and the active
phase of microtuber growth (e.g. Fig. 4), the idea that sucrose in the medium could
modulate GA levels associated with tuberization should be refined further to include the
uptake of glucose and fructose from the medium as being an integral part of the signalling
pathway. This is certainly consistent with the results of our experiments of supplying
glucose and fructose instead of sucrose in the medium right from the start of the
tuberization step (Fig. 19).
7. Effect of medium-replacing treatments
Replacing the medium during microtuberization appeared to have a positive effect on in
vitro tuberization of both potato cultivars when compared to the standard
microtuberization protocol (Figs. 51-55). In both cultivars, it was observed that medium
replacement during in vitro tuberization tended to favour the production of more larger

187
microtubers. In particular, more microtubers were formed in the category of 1-2 g when
the medium was replaced every 3 weeks, in comparison with the standard
microtuberization protocol with one medium lasting for 10 weeks (Figs. 54 and 55).
Replacing the multiplication medium did not seem to have a substantial effect on the
number of tubers formed in the subsequent standard tuberization protocol (Table 8).
However, in both 'Iwa' and 'Daeji' cultivars, thicker and more vigourous shoots resulting
from replacing the multiplication medium led to the subsequent formation of larger
microtubers when compared to the plants grown in the standard multiplication protocol,
i.e. the medium was not changed before transfer to the standard tuberization protocol (Fig.
79). It has been reported that favouring vegetative growth of stolon segments and shoots
prior to microtuber induction increases microtuber fresh weight (Chapman 1955; Garner &
Blake 1989). There was a slight difference between genotypes as the 'Iwa' plantlets
appeared to form heavier microtubers than those of 'Daeji' in response to the standard 8%
sucrose-containing tuberization medium regardless of whether the multiplication medium
was replaced or not (Figs. 79).
Perhaps, the most remarkable effect of medium replacement during plantlet multiplication
on the subsequent in vitro tuberization compared to all other treatments in the present
study was that some microtubers fonned were heavier than 2 g (Figs. 80 and 81). Thus, it
seems that there was a carry-over effect of the physiological state of potato plants grown in
the multiplication step. Similar carry-Dver effects have been shown in strawberry
(Anderson et al. 1982), oil palm (Corley et al. 1986) and potato (Satellknecht and
Farnsworth 1979) with manipulation of nitrogen level in the medium.
In the present study, the positive influence of medium replacement during plantlet
multiplication or in vitro tuberization could result from a periodical fluctuation in supply
of nutrients, particularly nitrogen and carbohydrates, to the potato plantlets. This might
change the endogenous hormonal balance of the plantlets during growth and tuberization.
8. Effect of sucrose concentrations and varying pH in the media on microtu beriza tion
Effect of sucrose concentration

188
We found no tuber formation in sucrose-free medium, a result similar to the findings of
other researchers using different protocols (Xu et al. 1998; Lawrence & Barker 1963).
Microtubers were induced in media containing sucrose ranging from 2 to 20% (w/v)
(Table 3). The number of micro tubers formed in this range of2 to 12% sucrose appeared
not to be substantially different (Table 3), but more than 16% sucrose in the medium
resulted in a reduction in the number of microtubers.
It was established a long ,time ago that a high sucrose concentration (5% as opposed to
1 %) favoured in vitro tuberization of potato from cultured stolon tips of Aram chief potato
in Knop's nutrient solution (Mes & Menge 1954). A high sucrose concentration (8% rather
than 2%) also seems to enhance microtuber development in the presence of growth
regulators in the medium (Harmey et al. 1966). On media free of growth regulators, 8%
sucrose coupled with transfer to short days promoted microtuber formation (Gamer &
Blake 1989). Thus the consensus seems to be that a concentration of about 8% sucrose
gives better yield of microtubers. The present results confirm that well-grown in vitro
potato plantlets responded similarly to isolated stolons in culture.
Microtuber size or weight is a more important microtuber character than microtuber
number because small sized microtubers are more vulnerable to storage loss (Naik &
Sarkar 1997) and are unsuitable for direct field planting (Jones 1988). The production of
heavier microtubers could substantially increase yield of potato propagules in the green
house and field (Wiersema et aI1987).
The data in the present study on the effect of different sucrose concentrations in the
tuberization medium on the average fresh weight of micro tubers formed are in general
agreement with the studies in the literature using different protocols or different culture
systems (Wang & Hu 1982; Hussey & Stacey 1984; Akita & Takayama 1988a,b; Gamer
& Blake 1989; Leclerc et al. 1994; Muller-Rober et al. 1990; Akita & Takayama 1994a,b;
Akita & Ohta 1998). In both potato varieties, the 8% sucrose medium was different from
the other sucrose media because the frequency of micro tubers heavier than 1.0 g was
observed mainly with the 8% sucrose medium (Figs. 16 and 17).
Effects of varying pH in the tuberization medium
The results in this study showed that microtuber number, hence initiation of in vitro

189
tuberization in 'Iwa', was not influenced by the culturing of plantlets in tuberization media
at different pH. In contrast, the data on average microtuber weight seems to indicate a
huge genotypic difference between 'Iwa' and 'Daeji', plants in the reaction to the initial
pH of the tuberization medium. 'Iwa', unlike 'Daeji', was relatively insensitive to initial
pH higher or lower than that of the standard tuberization medium (Figs. 42 and 43).
Among all the media variations in this study, pH produced the only this difference
between the two cultivars. In the literature, there are many reports on differences among
potato cultivars/varieties in response to manipulations of in vitro tuberization. Overall our
results showed similar trends in responses to the different microtuberization treatments by
'Iwa' and 'Daeji' plantlets.
Few research papers have been published on the influence of medium variations on the
weight or size distribution of microtubers formed by well-grown plantlets.
Here, the data on the frequencies of microtubers in different weight categories (Figs. 44
and 45) mirrored the result on average microtuber weight showing that the 'Daeji' rather
than 'Iwa' plantlets were more sensitive to the high or low pH media resulting in higher
frequencies of smaller microtubers being formed in these media.
9. Ultrastructural studies
Green root of in vitro potato plantlet
Greening of plant tissue in the light indicates the presence of chloroplasts, which are
usually associated with leaf or stem of plants grown in light. No worker has published
detailed analysis of the greening of potato roots of plantlets grown in vitro and the fate of
the green roots of the plantlets during microtuberization which usually took place in
darkness for several weeks (e.g. 10 weeks in the present study) has received no prior
attention. Since ultrastructural study of green roots of the potato plantlets has not been
done and only a limited time was available to complete this thesis, it was decided to
initiate a small-scale electron microscopy study of the materials from the 2-step process
for microtuber production. Electron microscopy of potato leaf and stem tissues of the
'Iwa' potato plantlets reveals chloroplasts with well developed grana and stroma

190
thylakoids which are typical of organelles involved in normal photosynthesis. Greening of
potato root tissue during the plantlet multiplication step is also due to chloroplast
formation therein, but these organelles are more diverse in structure compared with those
ofthe leaf and stem. Chlorophyll formation is dependent on light induction (Castelfranco
and Beale 1983), and it must therefore be assumed that the roots of the potato plantlet can
respond to light during plantlet growth, otherwise the grana and thylakoid partitions would
not have differentiated.
Plant roots usually grow underground as heterotrophic organs, depending on the shoot and
leaves for their energy source. Roots may become green when exposed to light or when
they develop as adventitious organs (Torrey and Clarkson 1975). In roots of the epiphytic
Ochidaceae (Benzing et al. 1983) and in the aerial roots of mangroves (Gill and Tomlinson
1977), photosynthesis by this organ does, in fact, contribute to the carbon economy of
whole plant. Although many roots, in vivo or in vitro, can become green when grown
under light, we do not know to what extent the root, as an organ, has retained its potential
for photosynthesis and photoautotrophy. Photo autotrophic green roots of Acmella
oppositifolia have been maintained in vitro for over 2 years (Flores et al. 1993). Many in
vitro root cultures can generate green shoots, suggesting that the root cells remain
totipotent (Peterson 1975).
Overall, the chloroplasts found in the green roots after 10 weeks in the dark during the
microtuberization step were very similar to those found in green leaves ofthe plantlets
from the plantlet multiplication step. The possibility that the chloroplasts in the roots
might contribute to energy or biosynthetic requirement for microtuber formation cannot
be ruled out. It is also not clear what would be the influence, if any, that the sucrose in the
microtuberization medium might have on the metabolic capacity ofthe root chloroplasts.

191
v. Future Studies
1. Time course of changes in major mineral elements and nitrogen in the medium in
relationship to the medium replacement treatments will be needed so that we have a more
complete picture of the effects of these treatments apart from sucrose addition.
2. The low invertase activity in tuberization medium is possibly because the root-bound
surface invertase might be a main source of invertase in medium. So, this enzyme should
be extracted and then its changes can be investigated in relation to sucrose utilization,
plantlet growth and microtuberization.
3. cDNA clone for invertase can be obtained and will allow a study ofthe changes in
invertase gene expression in tissues submerged in the liquid media during plant
propagation and tuberization.
4. The present study can be made more complete if the changes of osmotic potential in the
media at various times of the medium replacement treatments involving monosaccharide
containing or the maltose media.
5. This research has led to the formulation oftissue culture media that are suitable not only
for potato plantlet multiplication and tuberization but also for relative ease of invertase
production and isolation, and recovery of inverted sugars. Some preliminary attempts to
purify the acidic invertase from the microtuberization medium were initiated here.
When dialyzed ammonium sulfate precipitable fraction (60%w/v) ofthe tuberization
medium was separated using an anion exchange column (l.Sx23cm) a broad invertase
activity peak resulted and all the fractions had a low level of enzyme activity. Therefore it
can be assumed that the enzyme from the medium was not absorbed onto the anion
exchanger. Further experiments will be needed to confirm this and develop a more
workable enzyme purification scheme.
6. Metabolism of maltose by the potato plantlets will need to be investigated to see how
this disaccharide can replace sucrose for microtuberization.
7. The contribution of the green roots of the potato plantlets to microtuberization could be
a new fascinating research topic using physiological and biochemical approaches.

192
VI. Conclusion
Automation of micropropagation and production of microtubers is a final long-term goal
that may benefit from this study. For this purpose, production of more bigger microtubers
that can compete with traditional seed potatoes is essential.
The standard 2-step process comprising plantlet multiplication and then microtuberization
yield bigger microtubers compared to other studies using isolated stolons in culture.
Among the 21 experimental variations to the standard protocols, whether during plantlet
multiplication or during in vitro tuberization, medium replacement was most effective in
inducing the formation of bigger and more microtubers. The treatment of medium
replacement during the plantlet multiplication step led to an increase in fresh weight and
vigour of the plantlets that would subsequently produce heavier and round-shaped
microtubers whereas during tuberization it resulted heavier but longitudinal-shaped
microtubers. This manipulation during plantlet growth seems to be more desirable. From
the measurement of osmotic potential changes and invertase activity development in the
media, it seems that these and possibly other changes in the media may not be strictly
related to microtuberization.
VII. References
Abdullah Z. N. and Ahmad R. (1980) Effect of ABA and GA3 on tuberization and some chemical consetuents of potato. Plant Cell Physiol. 21: 1343-1346.
Addy N. A. (1988) Opportunities and challenges for private industry, Am. Potato 1. 65: 221-227.
Aitken-Christie 1. (1991) Automation. In: Microprpagation, Debergh P. C. and Zimmerman R. H. (eds), Kluwer Academic Pulishers, pp. 363-388.
193
Akita M. and Ohta Y. (1998) A simple method for mass propagation of potato (Solanum tuberosum L.) using a bioreactor without forced aeration. Plant Cell Rep. 18: 284-287.
Akita M. and Takayama S. (1994a) Simulation of potato (Solanum tuberosum L.) tuberization by semicontinuous liquid medium surface level control. Plant Cell Rep. 13: 184-187.
Akita M. and Takayama S. (1994b) Induction and development of potato tubers in ajar fermentor. Plant Cell Tiss. Org. Cult. 36: 177-182.
Akita M. and Takayama S. (1988a) Mass production of potato tubers using jar fermentor techniques. Acta Hort. 230: 55-61.
Akita M. and Takayama S. (1988b) Studies of in vitro tuberization of potato (Solanum tuberosum L.) 4. Effects of hormonal conditions on tuberization. (Abstrct.), Jpn. Soc. Hort. Autumn Meeting pp. 266-267 (in Japanese).
Amchemproducts Inc. (1969) Tech. Servo Data Sheet E-172. pp. 1-64. Anderson H. M., Abbott A. J. and Wiltshire S. (1982) Micropropagation of strawberry
plants in vitro-effect of growth regulators on incidence of multi-apex abnormality. ScientiaHorticulturae 16: 331-341.
Avigad G. (1982) Sucrose and other disaccharides. In: Encyclopedia of Plant Physiology, (Loewus F. A. and Tanner W., eds.), Vol. 13, Springer-Verlag, Berlin, pp. 217-347.
Avila A. de L., Pereyra S. M., Collino D. J. and Arguello 1. A. (1994)Effects of nitrogen source on growth and morphogenesis of three micropropagated potato cultivars. Potato Res. 37: 161-168.
Avila A. de L., Pereyra S. M. and Arguello J. A. (1996) Potato micropropagation: Growth of cultivars in solid and liquid media. Potato Res. 39: 253-258.
Bajaj Y. P. S. and Sopory S. K. (1986) Biotechnology of Potato Improvement. In: Biotechnology in Agriculture and Forestry (Bajaj, Y. P. S., ed.), Vol. 2, SpringerVerlag, Berlin and Heidelberg, pp. 429-454.
Barker W. G. (1953) A method for the in vitro culturing of potato tubers. Science 118: 384.
Batitus E. J. and Ewing E. E. (1982) Far-reversal of red light effect during long night induction of potato (Solanum tuberosum L.) tuberization. Plant Physiol. 69: 672-674.
Batty N. and Dunwell 1. M. (1989) Effect of carbohydrate source on the response of potato anthers in culture. Plant Cell Tiss. Org. Cult. 18: 221-226.
Behnke H. (1989) Structure ofthe phloem. In: Tranport of photo assimilates. (Barker D. and Milburn J., eds), Longman Scientific, Harlow.
Benhamou N., Gemier 1. and Chrispeels M. J. (1991) Accumulation of ~-fructosidase in the cell walls of tomato roots following infection by a fungal wilt pathogen. Plant Physiol. 97: 739-750.
Ben-Hayyim G. and Neumann H. (1983) Stimulatory effect of glycerol on growth and somatic embroygenesis in Citrus callus cultures. Z. Pflanzenphysiol. 110: 331-337.
194
Benzing D. H., Friedman W. E., Peterson G. and Renfrow A (1983) Shootlessness, velamentous roots and the pre-eminence of Orchidaceae in the epiphytic biotope. Am. J. Bot. 70: 121-133.
Bidney D. L. and Shepard J. F. (1980) Colony development from sweet potato petiole protoplasts and mesophyll cell. Plant Sci. Lett. 18: 335-342.
Bizarri M., Borghi L. and Ranalli P. (1995) Effects of activated charcoal effects on induction and development of micro tubers in potato (Solanum tuberosum L.). Ann. Appl. BioI. 127: 175-181.
Bodlaender K. B. A (1964) De invloed van groei regulerende stoffen op aardappelen. Berdrijfsontwikkeling 3: 596-601.
Booth A. (1963) The role of growth substances in the development of stolon. Proc. Easter School Agric. Sci. (Univ. Nottingham), 10: 99-113.
Bottini G. A., Goleniowski M. and Tizio R. (1981) Effect of (2-chloroethyl) Trimethylammonium chloride upon gibberellin levels in potato plants (Solanum tuberosum L.) and influence ofthese phytohormones on tuberization in vitro. Zeitschrift fiir Pflanzenphysiologie 103(2): 149-155.
Bouniols A (1974) Neoformation de bourgeons in vitro a partir de Fragments de racime d'endive (Cichorium intybus L.): influence du degre d'hydratation des tissus, et ses consequences sur la composition en acides amines. Plant Sci. letters 2: 363-371.
Bradford M. M.(1976) a rapid and sensitive method for the quantative of microgram quantities of protein utilizing the principle of protein-dye binding. Anal. Biochem. 72: 248-254.
Broertjes C. and Harten van AM. (1978) Application of mutation breeding methods in the improvement of vegetatively propagated crops, An interpretive literature review. Esevier, Amsterdam.
Bronk B. (1975) Plants consumed by man. Academic Press, London New York. Brown C. L. and Sommer H. E. (1982) Vegetative propagation of dicotyledonous trees. In:
Tissue Culture in Forestry, (Bonga J. M. and Durzan D. J., eds.), Martinus Nijhoff / Dr W Junk, The Hague, pp. 109-149.
Bryan J. E., Jackson M. T. and Melendez N. J. (1981) Rapid multiplication techniques for potatoes. International Potato Center, Lima, Peru.
Burch L. R., Davies H. V., Cuthbert E. M., Machray G. C., Hedley P. and Waugh R. (1992) Purification of soluble invertase from potato. Phytochem. 31: 1901-1904.
Biisis D., Heinecke D., Sonnewald u., Willmitzer L., Raschke K. and Heldt H. W. (1997) Solute accumulation and decreased photosynthesis in leaves of potato plants expressing yeast-derived invertase either in the apoplast, vacuole or cytosol. Planta 202: 126-136.
Castelfranco P. A. and Beale S. I. (1983) Chlorophyll biosynthesis, Recent advances and areas of current interest. Annu. Rev. Plant Physiol. 34: 241-278.
Chandra R., Dodds J. H. and Tovar P. (1988) In vitro tuberization in potato (Solanum tuberosum L.). Newslett. IntI. Assoc. Plant Tissue Culture. No. 55: 10-20.
Chapman H. W. (1955) Potato tissue cultures. Am. Potato 1. 32: 207-210. Chapman J., McGarry A, Carmignac D. F. and Gahan P. D. (1988) Cytochemical

195
methods for localization of invertase activity in plant tissues. Histochemistry 90: 215-217.
Claver F. K. (1956) The tuberization of Shoots of potato and callus culture in vitro. De la Revista de la Facultad de Agronomia (3a. epoca), T. XXXII (entregu la), 11-122.
Claver F. K. (1967) Influence of long day and temperature on tuberization of shoots and plantlets of potato in vitro. Revista de Investigacieones Agropecuarias, INTA, Buenos Aires, Rep. Argentina Series 2, Biologia y Producci6n Vegetal, IV (12): 223-230.
Claver F. K. (1977) Tuberization in vitro and culture of potato sprouts contaminated with Rhizoctonia solani. Boletin de la Sociedad Argentina de Botaruca XVIII, 1-2,91-96.
Copeland R B. (1982) Micropropagation of potatoes. Agric. Nor. Irel. 57: 250-253. Corley R H. V., Lee C. H., Law I. and Wong C. Y. (1986) Abnormal flower development
in oil palm clones. The Planter, Kuala Lumpur, 62: 233-240. Courduroux 1. (1967) PhD thesis, Univ. Clermont-Ferrand. Daie J. (1984) Characterization of sugar transport in storage tissue of carrot. 1. Am. Soc.
Hort. Sci. 109: 718-722. Datta S. K. and Wenzel G. (1987) Plant Science 48: 49-54. Debergh P. C. (1983) Effects of agar brand and concentartion on the tissue culture
medium. Physiol. Plant. 59: 270-276. Deferandez O. S., Martinez L. and Guinazu M. (1995) Qualitative and quantitive
production of potato microtubers (Solanum tuberosum L.) in two-phase system. Biocelll9: 57-63.
Denton I. R, Westcott R 1. and Ford-Lloyd B. V. (1977). Phenotypic variation of Solanum tuberosum L. cv. Dr. McIntosh regenerated directly from shoot-tip culture. Potato Res. 20: 131-136.
De Stecco V. L. and Tizio R (1982) The action ofCCC on tuberization of sprouts of potato tubers cultured in vitro in a mineral medium deprived of sugars. Physiolgie Vegetale, C R Acad., Sci. Paris Series III, 294 (10): 901-904.
Do C.B. and Cormier F. (1991) Accumulation ofpeonidin 3-glucoside enhanced by osmotic stress in grape (Vilis vinifera L.) cell suspension. Plant Cell Tiss. Org. Cult. 24: 49-54.
Dougall D. K. (1981) Media factors affecting growth. 1. Exp. Bot. 21: 277-280. Drew R L. K. (1979) Effect of activated charcoal on embryogenesis and regeneration of
plantlets from suspension cultures of carrots (Daucus Carota L.). Ann. Bot. 44: 387-389.
Dunwell 1. M. (1985) Anther and ovary culture. In: (Bright S. W. 1. and Jones M. G. K. eds.), Hijhoff ISBN-90-247-3190-9, pp. 1-44.
EI-Antably H. M. M., Wareing P. F. and Hillman 1. (1967) Some physiological response to d,l-abscisin (dormin). Planta 73: 74-90.
Escalada M. and de Garcia E. C. (1982) Propagaci6n in vitro de Solanum tuberosum comometodo para la obtenci6n de plantas libres de virus. Agronomia Tropical 21: 91-103.
Eschrich W. (1980) Free space invertase, its possible role in phloem unloading. Ber. Dtsch. Bot. Ges. 93: 363-378.
Espinoza N., Estrada R, Bryan 1. and Dodds 1. H. (1984) Tissue culture

micropropagation, conservation, and export of potato germplasm. Specialized Technology Document, International Potato Center, Lima Peru.
Estrada R., P. Tovar 1. H. and Dodds J. H. (1986) Induction of in vitro tubers in a broad range of genotypes. Plant Cell, Tissue and Organ Culture 7: 3-10.
Evans D. A., Sharp W. R. and Flick C. E. (1981) Growth and behavior of cell cultures: embryogenesis and organogenesis. In: Plant Tissue Culture (Thorpe T. A. ed.) Academic Press, New York, pp.45.
196
Evans D. A., Wetter L. R. and Gamborg O. L. (1980) Somatic hybrid plants of Nicotiana glauca and N tabacum obtained by protoplast fusion. Physiol. Plant. 48: 225-230.
Ewing E. E. (1985) Cuttings as simplified models of the potato plant. In: Potato Physiology. (P. Li, ed.), Academic Press, Orlando, FL. ISBN 0-12-447660-0, pp. 154-207.
Ewing E. E. (1987) The role of hormones in potato (Solanumtuberosum L.) tuberization. In: Plant hormone and Their Role in Plant Growth and Development. (Davies P. 1., ed.), Martinus NijhoffPublisher, Boston, pp. 515-538.
Ewing E. E. (1990) Induction of tuberization of potato. In: The molecular and Cellular Biology ofthe Potato. (Vayda, M. E. and Park, W. D. eds.), C.A.B. International, Wallinford, pp. 25-41.
Ewing E. E. (1995) The role of hormones in potato (Solanum tuberosum L.) tuberization. In "Plant hormones: physiology, biochemistry and molecular biology" (Davies P. J. ed.), Kluwer, Dortrecht, pp. 698-724.
Ewing E. E. and Struik P. C. (1992) Tuber formation in potato: induction, initiation and growth. Hort. Rev. 14: 89-198.
Faye L. (1981) A new enzymatic staining method for the detection of radish P-fructosidase in gel elctrophoresis. Analytical Biochemistry 112: 90-95.
Finnie S. 1., Powell W. and Dyer A. F. (1989) The effect of carbohydrate composition and concentration on anther response in barley. Plant Breeding 103: 110-119.
Flores H. E., Dai Y. R., Cuello J. L., Maldonado-Mendoza I. E. and Loyola-Vargas V. M. (1993) Green roots: photosynthesis and photoautotrophy in an underground plant organ. Plant Physiol. 101: 363-371.
Forsline P. L. and Langille A. R. (1975) Endogenous cytokinins in Solanum tuberosum as influenced by photoperiod and temperature. Physiol. Plant. 34: 73-75.
Forti E., Mandolino G. and Ranalli P. (1991) In vitro tuber induction: influence ofthe variety and of the media. Acta. Hort. 300: 127-132.
Fowler M. W. (1978) Regulation of carbohydrate metabolism in cell suspension cultures. In: Frontiers of Plant Tissue Culture. Thorpe T. A. (ed.), IAPTC, Calgary, pp. 443-452.
Fridborg G., Pedersen M., Landstrom L. E. and Eriksson T. (1978) The effect of activated charcoal on tissue cultures: adsorption of metabolites inhibiting morphogenesis. Physiol. Plant. 43: 104-106.
Fung M. L., Irvine B. R. and Barker W. G. (1972) In vitro tuberization ofthe cornmon potato (Solanum tuberosum) is not a response to the osmotic concentration of the medium. Can. 1. Bot. 50: 603-605.
Gamborg O. L., Shyluk J. P. and Kartha K. K. (1975) Factors affecting the isolation and callus formation in protoplasts from the shoot apices of Pisum sativum L. Plant Sci.

Lett. 4: 285-292. Garcia-Torres L. and Gomez-Campo C. (1973) In vitro tuberization of potato sprouts as
affected by ethrel and gibberellic acid. Potato Res. 16: 73-79. Gamer N. (1987) The development and dormancy of microtubers of potato (Solanum
tuberosum L.) produced in vitro. PhD thesis, Wye College, University of London. Gamer N. and Blake J. (1989) The induction and development of potato microtubers in
vitro on media free of growth regulating substances. Ann. Bot. 63: 663-674.
197
George E. F. (1993) Plant propagation by tissue culture. Part 1. The technology. Exegetics Ltd., England.
Gill A. M. and Tomlinson P. B. (1977) Studies of the growth of red mangrove (Rhizophora mangle L.) 4: The adult root system. Biotropica 9: 145-155.
Gleddie S., Keller W. and Setterfield G. (1983) Somatic embryogenesis and plant regeneration from leaf explants and cell suspensions of Solanun melongena (eggplant). Can. J. Bot. 61: 656-666.
Goodwin P. B. (1982) Methods for the rapid propagation of potato. In: Potato Production in the Humid Tropics. (L. 1. Harmworth, J. A. T. Woodford, and M. E. Marvel, eds.), International Potato Center, Far East and Southeast Asia Regional Office, Los Banos, Laguna, Philippines, pp. 181-196.
Goodwin P. B., Kim Y. C. and Adisarwanto T. (1980a) Propagation of potato by shoot-tip culture. 1. Shoot multiplication. Potato Res. 23: 9-18.
Goodwin P. B., Kim Y. C. and Adisarwanto T. (1980b) Propagation of potato by shoot-tip culture. 2. Rooting of proliferated shoots. Potato Res. 23, 19-24.
Gopal J. (1996) In vitro selection, genetic divergence and cross prediction in potato. PhD. thesis, Punjab Agricultural University, Ludhiana, India.
Gopal J., Minocha 1. L. and Sidhu 1. S. (1997) Comparative performance of Potato crops raised from micro tubers induced in dark versus micrtubers induced in light. Potato Res. 40: 407-412.
Gopal J., Minocha 1. L. and Dhaliwal H. S. (1998) Microtuberization in potato (Solanum tuberosum L.). Plant Cell Rep. 17: 794-798.
Gregory L. E. (1965) Physiology oftuberization in plants. In: Encyclopedia of Plant Physiology. (Ruhland W., ed.), Vol. 15, Springer-Verlag, Berlin, pp. 1328-1354.
Gregory L. E. (1956) Some factors for the tuberization in the potato plant. Ann. Bot. 41: 281-288.
Hammerschlag F. (1982) Factor influencing in vitro multiplication and rooting of the plum rootstock myrabalan (Prunus cerasifera Ehrh.). J. Am. Soc. Hort. Sci. 107: 44-47.
Harmey M. A., Crowley M. P. and Clinch P. E. M. (1966) The effect of growth regulators on tuberization of cultured stem pieces of Solanum tuberosum. Eur. Potato J. 9: 146-157.
Harvey B. M. R., Crothers S. H., Evans N. E. and Selby C. (1991) The use of growth retardants to improve microtuber formation by potato (Solanum tuberosum L.). Plant Cell Tiss. Org. Cult. 27: 59-64.
Hawker J. S. (1985) Sucrose. In: Biochemistry of Storage Carbohydrates in Green Plants. (Dey P. M. and Dixon R. A. eds). Academic Press, Orlando, Fl. pp. 1-51.
Hawkes 1. G. (1978) History of potato. In: The Potato Crop: the scientific basis for improvement. (Harris P. M., ed), Chapman and Hall, London, pp. 1-69.
198
Henshaw G. G. and Roca W. M. (1976) Report ofa planning Conference on Exploration and Maintenance of Gennplasm Resources. CIP, Lima, Peru.
Hole C. C. and Deannan J. (1994) Sucrose uptake by the phloem parenchyma of carrot storage root. J. Exp. Bot. 45: 7-15.
Hooley R (1994) Gibberellins: perception, transduction and responses. Plant Mol. BioI. 26: 1529-1555.
Hooker M. P. (1983) Research for potato in the year 2000. Int. Potato Center, Lima, Peru. Hristoforoglu K., Grasl A and Schmidt J. (1992) Somatic embryogenesis from mature
embryos of Abies alba. Proc. Int. Conifer Biotechnology Working Group, N. C. State University, Raleigh.
Hu C. Y. and Wang P. 1. (1983) Meristem, shoot tip, and bud culture. In: Handbook of Plant Cell Culture. (Evans D. A, Sharp W. R, Ammirato P. V. and Yamada Y. eds.), Vol. 1., Chapter 5, Macmillan, NY, pp. 177-227.
Hulscher M., Krijsheld H. T. and Jongedijk E. (1996) Mass propagation of potato tubers in jar fennentors. Acta Hort. 440: 533-537.
Hunter C. P. (1988) In: Plant Regeneration from Microspore-derived Embroids and Plants of Hordeum vulgare L. PhD Thesis, Wye College, University of London.
Hussey G. and Stacey N. J. (1981) In vitro propagation of potato (Solanum tuberosum L.). Ann. Bot. (London) [N.S.] 48, 787-796.
Hussey G. and Stacey N. J. (1984) Factors affecting the fonnation of in vitro tubers of potato (Solanum tuberosum L.). Ann. Bot. 53: 565-578.
Jackson S. D. and Prat S. (1996) Control oftuberization in potato by gibberellins and phytochrome B. Physiol. Plant. 98: 407-412.
Jackson S. D., Heyer A, Dietz 1. and Prat S. (1996) Phytochrome B mediates the photoperiodic control of tuber fonnation in potato. Plant J. 9: 159-166.
Jolivet E. (1969) Physiologie de la tuberization. Annals Physiol. Veg. 11: 265-301. Jones E. D. (1988) A current assessment of in vitro culture and other rapid multiplication
methods in North America and Europe. Am. Potato J. 65: 209-220. Jordan M., Montenegro G. and Apablaza G. (1983) Regeneration ofPVX-free plantlets of
six potato cultivars by shoot-tip culture and Virazole treatment in vitro. Cienc. Invest. Agrar. 10: 45-52.
Joyce P. and McCown B. H. (1991) Microtuber propagation of potatoes. US patent No. 5047343.
Kartha K. K. (1981) Meristem culture and cryopreservation - method and application. In: Plant Tissue culture: Methods and Applications in Agriculture. (Thorpe T. A., ed.), Academic Press, New York, pp. 181-211.
Kartha K. K. (1982) Cryopreservation of gennplasm using meristem and tissue culture. In: Application of Plant Cell and Tissue Culture to Agriculture and Industry. (Tomes D. T., Ellis B. E., Hamey P. M., Kasha K. J., and Peterson R L., eds.), University of Guelph, Guelph, Ontario, Canada, pp. 139-161.
Keller W. A, Rajhathy F. and Lacapra J. (1975) In vitro production of plants from pollen of Brassica campestries. Can J. Gen. Cytol. 17: 655-666.
Khuri S. and Moorby J. (1995) Investigations into the role of sucrose in potato cv. Estima microtuber production in vitro. Ann. Bot. 75: 295-303.
Kim Y. C. (1982) In vitro tuber fonnation from proliferated shoot of potato (Solanum

tuberosum L.) as a method of aseptic maintenance. PhD. thesis, Jeon Buk National University, Korea.
199
Kochba J. and Spiegel-Roy P. (1973) Effect of culture media on embroyd formation from ovular callus of shamouti orange (Citrus sinensis). Z. Pflanzenphysiol. 69: 156.
Koda Y. and Okazawa Y. (1983) Influences of environmental, hormonal and nutritional factors on potato tuberization in vitro. Jap. J. Crop Sci. 52(4): 582-591.
Konstantinova T. N., Aksenova N. P. and Chailakhyan M. Kh. (1991) Influence of spectral quality of light on reproductive development of Solanum andigena under different daylength. Dokl. Akad. Nauk. SSSR 316: 252-255. (In Russian).
Kostrica P., Polreichova B. and Domkarova 1. (1985) The use of in vitro tuber formation for the maintenance of potato genetic resources. Genetika a Slechteni 21(4): 269-278.
Kosuge T. and Conn E. E. (1959) The metabolism of aromatic compounds in higher plants. 1. ofBiol. Chern. 234, 2133-2137.
Krauss A. and Marschner H. (1982) Influence of nitrogen nutrition, daylength and temperature on contents of gibberellic and abscisic acid and on tuberization in potato plants. Potato Res. 25: 13-21.
Kumar D. and Wareing P. F. (1972) Factors controlling stolon development in the potato plant. New Phytol. 71: 639-648.
Kumar D. and Wareing P. F. (1974) Studies on tuberization of Solanum andigena. New Physiol. 73: 833-840.
Killin C., Barker L., Burkle L. and Frommer W. B. (1999) Update on sucrose transport in higher plants. J. Exp. Bot. 50: 935-953.
Laemli U. K. (1970) Cleavage of structural proteins during the assembly ofthe head of bacteriophage T4. Nature 227: 680-685.
Last D. 1. and Bretell R 1. S. (1990) Embryo yield in wheat anther culture is influenced by the choice of sugar in the culture medium. Plant Cell Rep. 9: 14-16.
Lawrence C. H. and Barker W. G. (1963) A study oftuberization in the potato, Solanum tuberosum. Am. J. Potato Res. 40: 349-356.
Leclerc Y., Donnelly D. J. and Seabrook J. E. A. (1994) Microtuberization oflayered shoots and nodal cuttings of potato: The influence of growth regulators and incubating periods. Plant Cell. Tissue and Organ Culture 37: 113-120.
Lever M. (1973) Colorimetric and fluorometric carbohydrate determination with phydroxybenzoic acid hydrazide. Biochemical Medicine, 7: 274-281.
Levin R, Gaba V., Tal B., Hirsch S. and DeNola D. (1988) Automated plant tissue culture for mass propagation. Bio/Technology 6: 1035-1040.
Levin R and Vasil 1. K. (1989) Progress in reducing the cost of micro propagation. News!. Int. Assoc. Plant Tissue Cult. 59: 2-12.
LipavskaH. and Vreugdenhil D. (1996) Uptake of mannitol from the media by in vitro grown plants. Plant Cell Tiss. Org. Cult. 45: 103-107.
Loudon P.T., Nelson R S. and Ingram D. S. (1989) Studies of protoplast culture and plant regeneration from commercial and rapid-cycling Brassica species. Plant Cell Tiss. Org. Cult. 19: 213-224.
Lucas W. 1. and Madore M. A. (1988) Sugar uptake in higher plants. In: The Biotechnology of Plants, (Preiss 1., ed.), Academic Press, NY, Vo1.14, pp. 35-84.
Machackova 1., Konstantinova T. N., Sergeeva L. 1., Lozhikova V. N., Golyanovskaya S.

200
A., Dudko N. D., Eder 1. and Aksenova N. P. (1998) Photoperiodic control of growth, development and phytohormone balance in Solanum tuberosum. Physiol. Plant. 102: 272-278.
Makronosov A. T. and Lundina T. N. (1959) On the role of light and dark periods in the photoperiodic reduction of potato -Dokl. Akad. Nauk SSSR 127: 924-927. (in Russian)
Mangat B. S., Kerson G. and Wallace D. (1984) The effect of2,4-D on tuberization and starch content of potato tubers produced on stem segments cultured in vitro. Am. Potato J. 61: 355-361.
Mares D. 1., Marschner H. and Kruss A. (1981) Effect of Gibberellic acid on growth and carbohydrate metabolism of developing tubers of potato (Solanum tuberosum). Physiol. Plant. 52: 267-274.
Maretzki A., Thorn M and Nickell L. G. (1974) Utilization and metabolism of carbohydrates in cell and callus culture. In: Tissue Culture and Plant Science (Street H. E. ed.), Academic Press, London, pp. 329-361.
Marino G., Magnanini E., Battistini S. and Righetti B. (1989) Effect of hormones and main carbon energy sources on in vitro propagation of apricot (Prunus armeniaea L.) cvs. 'San Castrese' and 'Portici'. Acta Hort. 293: 355-362.
Marino G., Bertazza G., Magnanini E. and Altan A. D. (1993) Comparative effects of sorbitol and sucrose as main carbon energy sources in micropropagation of apricot. Plant Cell Tiss. Org. Cult. 34: 235-244.
Marschener H., Sattelmacher B. and Bangerth F. (1984) Growth rate of potato tubers and endogenous contents of indolylacetic acid and abscisic acid. Physiol. Plant. 52: 16-20.
Masuda H., Takahashi T. and Sugawara S. (1988) Acid and alkaline invertases in suspension cultures of sugar beet cells. Plant Physiol. 86: 312-317.
Matsushita K. and Uritani I. (1974) Changes in invertase activity of sweet potato in response to wounding and purification and properties of its invertases. Plant Physiol. 54: 60-66.
Mauk S. C. and Langille A. R. (1978) Physiology oftuberization in Solanum tuberosum L. cis-Zeatin riboside in the potato plants; its identification and changes in endogenous levels as influenced by temperature and photoperiod. Plant Physiol. 62: 438-442.
McCown B. H. and Joyce P. 1. (1991) Automated propagation of micro tubers of potato. In: Scale-up and automation in plant propagation. (Vasil I. K. ed.), Academic Press, San Diego, pp. 95-110.
Melis R. 1. M. and van Staden 1. (1984) Tuberization and hormones. Zeitschrift fUr Pflanzenphysiologie 113(3): 271-283.
Mellor F. C. and Stace-Smith R. (1977) Virus-free potatoes by tissue culture, In: Applied and Fundamental aspects of plant cell, tissue and organ culture. (Reinert J. and Bajaj Y. P. S., eds.), Springer, Berlin Heidelberg New York, pp. 616-635.
Menzel C. M. (1980) Tuberization in potato Solanum tuberosum cultivar Sebago at high temperatures: response to gibberellin and growth inhibitors. Ann. of Bot. 46: 259-266.
Menzel C. M. (1983) Tuberization in potato Solanum tuberosum cultivar Sebago at high temperatures: response to gibberellin and growth inhibitors. Ann. Bot. 46: 259-266.

201
Mes M. G. and Mengo 1. (1954) Potato shoot and tuber cultures in vitro. Physiol. Plant. 7: 637-649.
Michayluk M. R. and Kao K. N. (1975) A comparative study of sugars and sugar alcohols on cell regeneration and sustained cell division in plant protoplasts. Z. Pflanzenphysiol. 75: 181-185.
Mingo-Castel A. M. and Negm F. B., and Smith O. E. (1974) Effect of carbon dioxide and ethylene on tuberization of isolated potato stolons cultured in vitro. Plant Physiol. 53: 798-801.
Mingo-Castel A. M., Smith O. E. and Kumamoto J. (1976a) Studies on the carbon dioxide promotion and ethylene inhibition oftuberization in potato explants cultured in vitro. Plant Physiol. 57: 480-485.
Mingo-Castel A. M., Young R. E. and Smith O. E. (1976b) Kinetin-induced tuberization of potato in vitro: On the mode of action of kinetin. Plant Cell Physiol. 17: 557-570.
Morel G. and Martin, C. (1952) Gguerison de Dahlias atteints d'dune maladie a virus. Compo Rend. Acad. Sci. Ser. D. 235: 1324-1325.
Morel G. (1960) Producing virus-free Cymbidium. Am.Orchid Soc. Bull. 29: 495-497. Morel G. (1965) Clonal propagation of orchids by meristem culture. Cymbidium Soc.
News 20: 3-11. Morel G. (1975) Meristem culture techniques for the long term storage of cultured plants.
In: Crop Genetics Resources for Today and Tomorrow. (Frankel O. H. and Hawkes 1. G., eds), Cambridge Univ. Press. Pp. 327-332.
Morel S. and ap Rees T. (1986) Sucrose metabolism in developing tubers of Solanum tuberosum. Phytochem. 25: 1579-1585.
Morris D. A. and Arthur E.D. (1985) Effect of gibberellic acid on patterns of carbohydrate distribution and acid invertase activity in Phaseolus vulgaris. Physiol. Plant. 65: 257-262.
Mukherjee S. K., Rathinasabapathi B. and Gupta N. (1991)Low sugar and osmotic requirements for shoot regeneration from leaf pieces of Solanum melongena L. Plant Cell Tiss. Org. Cult. 25: 13-16.
Muller-Rober B. T., Kobmann J., Hannah L. C., Willmitzer L. and Sonnewald U. (1990) One of two different ADP-pyrophosphorylase genes from potato responds strongly to elevated levels of sucrose. Mol. Gen. Genet. 224: 136-146.
Muller-Rober B. T., Sonnewald U. and Willmitzer L. (1992) Inhibition of the ADPglucose pyrophosphoryiase in transgenic potatoes leads to sugar-storing tubers and influences tuber formation and expression of tuber storage protein genes. EMBO 1. 11: 1229-1238.
Murashige T. and Skoog F. (1962) A revised medium for rapid growth and bio assays with tobacco tissue cultures. Physiol. Plant. 15: 473-497.
Myrback K. (1960) Invertases. In: The enzymes (Boyer P. D., Lardy H. and Myrback K. eds.) (2nd edn.). Academic Press, NY, pp. 379-396.
Naik P. S. and Sakar D. (1997) Influence oflight-induced greening on storage of potato microtubers. Biologia Plantarum 15: 473-497.
Nelson R. R. (1984) Strategy for breeding for disease resistance. In: Crop Breeding. A contemporary basis. Pergamon Press, Oxford, pp. 32-50.
Neuman J. (1959) An auxin like action of coumarin. Science 129: 1675-1676.

Neuman J. (1960) The nature ofthe growth-promoting action of coumarin. Physiol. Plant. 13,328-341.
Nozeran R L., Bancilhon-Rossignol L. and Grenan S. (1977) Nouvelles possibilites d'oblertion et de multiplication rapide de clones sains de pomme de terre (Solanum tuberosum L.). C. R Hebd. Seances Acad. Sci. Paris, 285: 37-40.
N0rgard J. V. (1992) Somatic embryogenesis in Abies nordmanniana Lk., PhD thesis, Botanic Garden, University of Copenhagen.
N0rgard J. V. (1997) Somatic embryo maturation and plant regeneration inAbies nordmanniana Lk. Plant Science 124: 211-221.
N0rgard J. V. and Krogsrup P. (1991) Cytokinin induced somatic embryogenesis from immature embryos of Abies nordmanniana Lk. Plant Cell Rep. 9: 509-513.
202
Obato-Sasamoto H. and Suzuki H. (1979) Activities of enzymes relating to starch synthesis and endogenous levels of growth regulators during tuberization of isolated potato stolons cultured in vitro. Z. Pflanzenphysiol. 95: 69-75.
Obata-Sasamoto H. and Suzuki H. (1979) Activity of enzymes relating to starch synthesis and endogenenous levels of growth regulators in potato stolon tips during tuberization. Physiol. Plant. 45: 320-324.
Ohyama A., Ito H., Sato T., Nishimura S., Imai T. and Hira M. (1995) Suppression of acid invertase activity by antisense RNA modifies the sugar composition of tomato fruit. Plant Cell Physiol. 36: 369-376.
Okazawa Y. (1955) Physiological studies on the mechanism oftuberization of potato plants. Proc. Crop Sci. Jpn. 23: 247-248.
Okazawa Y. (1959) Studies on the occurrence of natural gibberellin and its effect on the tuber formation of the potato plants. Proc. Crop Sci. Soc. Jpn. 28: 129-133.
Okazawa Y. (1960) Studies on the relation between the tuber formation of potato and its natural gibberellin content. Proc. Crop Sci. Soc. Jpn. 29: 121-124.
Okazawa Y. (1967) Physiological studies on tuberization of potato plants. J. Fac. Agric., Hokkaido Uni. 55: 267-336.
Okazawa Y. and Chapman H. W. (1962) Regulation of tuber formation in the potato plant. Physiol. Plant 15: 413-419.
Oparka K., Viola R, Wright K. M. and Prior D. A. M. (1992) Sugar transport and metabolism in the tuber. In: Carbon partitioning within and between organisms. (Pollock C. J., Farrar J. F. and Gordon A. J. eds.) BIOS. Scientific Publishers, Oxford, pp 1-26.
Oparka K. and Wright K. M. (1988) Influence of cell tugor on sucrose partioning in potato tuber storage tissues. Planta 175: 520-526.
Ortiz-Montiel G. and Losoya-Saldana H. (1987) Potato microtubers: technology validation in Mexico. Am. Potato J. 64: 535-544.
Orshinky B. R, Mcgregor L. J., Johnson G. 1. E., Hucl P. and Kartha K. K. (1990) Improved Embroid induction and green shoot regeneration from wheat anthers cultured in medium with maltose. Plant Cell Rep. 9: 365-369.
Ougham H. J., Jones T. W. A. and Evans M. L. 1. (1987) Leaf development in Lolium temulentum L.: progressive changes in soluble polypeptide complement and isozymes. J. Exp. Bot. 38: 1689-1696.
Palmer C. E. and Barker W. G. (1972) Changes in enzyme activity during elongation and

tuberization of stolons of Solanum tuberosum L. cultured in vitro. Plant and Cell Physiology 13: 681-688.
Palmer C. E. and Barker W. G. (1973) Influence of ethylene and kinetin on tuberization and enzyme activity in Solanum tuberosum L. stolons culture in vitro. Ann. Bot. (London) [N.S.] 37: 85-93.
Palmer C. E. and Smith O. E. (1969) Cytokinins and tuber initiation in potato Solanum tuberosum L. Nature (London), 221: 279-280.
203
Palmer C. E. and Smith O. E. (1970) Effect of kinetin on tuber formation on isolated stolons of Solanum tuberosum L. cultured in vitro. Plant cell physioL 11: 303-314.
Peterson R. L. (1975) The initiation and development of root buds. In: The Development and Function of Roots. (Torrey J. G. and Clarkson D. T., eds), Academic Press, NY. pp. 125-161.
Pierik R. L. M. (1990) Cultivo in vitro de las plantas superiores. Mundi-Prensa, Madrid, pp.49-84.
Plaisted P. H. (1957) Growth of pots to tuber. Plant PhysioL 32: 445-453. Pont-Lezica R. F. (1970) Evolution des substances de type gibberellines chez la pomme de
terre pendant la tuberisation, en relation avec la longueur du jour et la temperature. Potato Res. 13: 323-331.
Pratt H. K. and Goelsch J. D. (1969) Physiological roles of ethylene in plants. Ann. Rev. Plant PhysioL 20: 541-584.
Pressey R. (1969) Potato sucrose synthase: Purification, properties, and changes in activity associated with maturation. Plant PhysioL 44: 759-764.
Pua E. C. and Chong C. (1984) Requirement for sorbitol (D-glucitol) as carbon source for in vitro propagation of Malus robustaNo. 5. Can. J. Bot. 62: 1545-1549.
Quak F. (1979) Meristem culture and virus-free plants. In: Applied and Fundamental Aspects of Plant Cell, Tissue, and Organ culture. (J. Reinert and Y. P. S. Bajaj, eds.), Springer-Verlag, Berlin and New York, pp. 598-615.
Railton 1. D. and Wareing P. F. (1973) Effects of daylength on endogenous gibberellins in leaves of Solanum andigena. PhysioL Plant. 28: 88-94.
Ranalli P., Bizarri M., Borghi L. and Mari M. (1994) Genotypic influence on in vitro induction, dormancy length, advancing age and agronomical performance of potato microtubers (Solanum tuberosum L.). Ann. AppL BioI. 125: 161-172.
Ranalli P., Bassi F., Ruaro G., Del Re P., Dicandilo M. and Mandolino G. (1994) Microtuber abd minituber production and field performance compared with normal tubers. Potato Res. 37: 383-391.
Raquin C. (1983) Utilization of different sugars as carbon sources for in vitro cultures of Petunia. Z. PflanzenphysioL 111: 453-457.
Reisfeld R. A., Lewis U. J. and William D. E. (1962) Disk electrophoresis of basic protein and peptides on polyacrylamide gels. Nature 195: 281-283.
Ricardo C. P. P. and ap Rees T. (1970) Invertase activity during the development of carrot roots. Phytochem. 9: 239-247.
Roca W. M., Espinosa, N. 0., Roca, M. R. and Bryan, J. E. (1978) A tissue culture method for the rapid propagation of potatoes. Am. Potato J. 55: 691-701.
Roca W. M., Bryan J. E. and Roca M. R. (1979) Tissue culture for the international transfer of potato genetic resources. Am. Potato J. 56: 1-10.
204
Romberger J. A. and Tabor C. (1971) The picea abies shoot apical meristem in culture. I. Agar and autoc1aving effects. Am. J. Bot. 58: 131-140.
Rossel G., Bertoldi F. D. de and Tizio R. (1987) In vitro mass tuberization as a contribution to potato micropropagation. Potato Res. 30: 111-116.
Sarkar D. and Naik P. S. (1998) Effect of inorganic nitrogen nutrition on cytokinininduced potato microtuber production in vitro. Potato Res. 41: 211-217.
Sattelknecht G. F. and Farnsworth S. (1979) The effect of nitrogen on the coumarininduced tuberization of potato axillary shoots cultured in vitro. Am. Potato J. 56: 523-530.
Sattelmacher B. and Marschner H. (1978) Relation between nitrogen nutrition, cytokinin activity and tuberization in Solanum tuberosum. Physiol. Plant. 44: 65-68.
Sawyer R. L. (1979) "Annual Report" International Potato Center (CIP), Lima, Peru. Schilde-Rentschler L., Espinoza D. N., Estrada R. and Lizarraga R. (1982) In vitro storage
and distribution of potato germplasm. 5th International Plant Tissue Culture Congress, (Fujiwara, ed), Japan.
Schilde R. L., Espinoza D. N. and Estrada R. (1984) Induction of tubers in vitro and their utilization for storage and distribution of potato germplasm. In: Abstract of conference paper of the 9th
• Triennial conference of the European Association for Potato Research Interlaken, Schweize, 1-6 July 1984, Switzland.
SchloupfR. M., Barringer S. A. and Splittstoesser W. E. (1995) A review of hyperhydricity (Vitrification) in tissue culture. Quarterly Plant Growth Regulatory Society of America 23(3): 149-158.
Scholes J. D., Lee P. J., Horton P. and Lewis D. H. (1994) Invertase: Understanding changes in the photosynthetic and carbohydrate metabolism of barley leaves infected with powdery mildew. New Phytol. 126: 213-222.
Scott P. and Lyne R. L. (1994) The effect of different carbohydrate sources upon the initiation of embryogenesis from barley microspores. Plant Cell Tiss. Org. Cult. 36: 129-133.
Scott P., Lyne R. L. and ap Rees T. (1995) Metabolism of maltose and sucrose by microspores isolated from barley (Hordeum Vulgare). Planta 197: 435-44l.
ShahN. M. (1945) The chemisry of coumarin. Chern. Rev. 36: 1-62. Shahin E. A. and Shepard J. F. (1980) Cassava mesophyll protoplasts: isolation,
proliferation, and shoot formation. Plant Sci. Lett. 17: 459-465. Shepard 1. F. and Totten R. E. (1977) Mesophyll cell protoplast of potato: Isolation,
proliferation, and plant regeneration. Plant Physioi. 60: 313-316. Singh M. and Verma S. C. (1979) Post-harvst technology and utilization of potato. In:
Post-harvst technology and utilization of potato. Proc. Int. Symp.Simla, New Delhi, pp. 1-27.
Singha S. (1982) Influence of agar concentration on in vitro shoot proliferation of Malus sp. Almey and Pyrus communis Sackel. 1. Am. Soc. Hort. Sci. 107: 657-660.
Skoog F. and Miller C. O. (1957) Chemical regulation of growth and organ formation in plant tissues cultured in vitro. Symp. Soc. Exp. BioI. 11: 118-13l.
Sluis P. C. and Rivera C. (1984) Microtuberculos. Agricultura de las Americas Marzo, pp. 32-33.
Smith O. E. and Palmer C. E. (1970) Cytokinin-induced tuber formation on stolons of

Solanum tuberosum. Physiol. Plant. 23: 599-606. Smith o. E. and Rapport L. (1969) Gibberellins, inhibitors, and tuber formation in the
potato (Solanum tuberosum L.). Am. Potato J. 46: 185-191. Solomko E. A. (1965) Useful artificial mutations in potatoes. Genetics. 1: 233-239. (in
Russian).
205
Sonnewald u., Bauer M., von Schaewen A., Stitt M. and Willmitzer L. (1991) Transgenic tobacco plants expressing yeast-derived invertase in either the cytosol, vacuol or apoplast: a powerful tool for studying sucrose metabolism and sink/source interactions. Plant J. 1: 95-106.
Sonnewald U., Hajirezaei M. -R., Kossmann J., Heyer A., Trethwey R. N. and Willmitzer L. (1997) Increased potato tuber size resulting from apoplastic expression of a yeast invertase. Nature Biotech. 15: 794-797.
Sopory S. K. (1979) Effect of sucrose, hormones, and metabolic inhibitors on the development of pollen embryoids in anther cultures of dihaploid. Can. J. Bot. 57: 2691-2694.
Sovari S. and Schieder O. (1987) Influence of sucrose and melibiose on barley anther cultures in starch media. Plant breeding 99: 164-171.
Stallknecht G. F. (1972) Coumarin-induced tuber formation on excised shoots of Solanum tuberosum L. in vitro. Plant Physiol. 50: 412-413.
Stallknecht G. F. and Farnsworth S. (1979) The effect of nitrogen on the coumarininduced tuberization of potato axillary shoots cultured in vitro. Am. Potato J. 56: 523-530.
Stallknecht G. F. and Farnsworth S. (1982a) General characteritics of coumarin induced tuberization of axillary shoots of Solanum tuberosum cultured in vitro. Am. Potato J. 59: 17-32.
Stallknecht G. F. and Farnsworth S. (1982b) Effect of the inhibitors of protein and nucleic acid synthesis on the coumarin induced tuberization and growth of excised axillary shoots of potato sprouts Solanum tuberosum cultivar russet burbank: cultured in vitro. Am. Potato J. 59: 69-76.
Strickland S. G., Nichol 1. W., McCall C. M. and Stuart D. A. (1987) Effect of carbohydrate source on alfalfa somatic embryogenesis. Plant Sci. 48: 113-121.
Strum A. and Chispeels M. 1. (1990) cDNA cloning of carrot extracellular ~-fructosidase and its expression in response to wounding and bacterial infection. Plant Cell 2: 1107-1119.
Strum A., Sebkova V., Lorenz L., Hardegger M., Lienhard S. and Unger C. (1995) Development- and organ-specific expression of genes for sucrose synthase and three isozymes of acid ~-fructosidase in carrot. Planta 195: 601-610.
Swain S. M. and Olszewski N. E. (1996) Genetic analysis of gibberellin signal transduction. Plant Physiol. 112: 11-17.
Tang x., Ruffner H. -P., Scholes J. D. and Rolfe S. A. (1996) Purification and characterization of soluble invertases from leaves of Arabidopsis thaliana. Planta 198: 17-23.
Thieme R. and Pett B. (1982) Production of tubers in vitro and their use in the establishment of a potato store. Arch. Zuechtungsforsch. 12: 257-262.
Tholakalabavi A., Zwiazek J. J. and Thorpe T. A. (1994) Effect of mannitol and glucose-

induced osmotic stress on growth, water relations, and solute composition of cell suspension culture of poplar (Populus deltoides var. occidentalis) in relation to anthocyanin accumulation. In Vitro Cell Dev. BioI. 30: 164-170.
206
Thomas M., Maretzki A, Komor E. and Sasaki W. S. (1981) Nutrient uptake and accumulation by sugarcane cell culture in relation to the growth cycle. Plant Cell Tiss. Org. Cult. 1: 3-14.
Thomson M. R. and Thorpe T. A (1987) Metabolic and non-metabolic roles of carbohydrates. In: Cell and Tissue Culture in Forestry. (Bonga J. M. and Durzan D. J. eds.), Vol. 1, Martinus NijhoffPublisher, Dortrecht, pp. 89-112.
Thorpe T. A. and Meier D. D. (1973) Sucrose methabolism during tobacco callus growth. Phytochem. 12: 493-497.
Tizio R. (1971) The action and probable role of certain gibberellins A-I, A-3, A-4, A-7, A-9, A-13, on stolon growth and tuberization of potato -D. Potato Res. 14: 193-204.
Tizio R. E. and Maneschi E. (1973) Different mechanisms for tuber initiation and dormancy in the potato (Solanum tuberosum L.) Phyton. 31: (2) 51-62.
Tizio R. and Goleniowski M. (1985) New evidence with gibberellin nature of the 'root factor' which delays tuberization of potato sprout sections cultured in vitro. Physiologie Vegetale, CR Acd. Science Paris, Serie III, 13: 499-502.
Torrey J. G. and Clarkson D. T. (1975) The Development and Function of Roots. Academic Press, NY.
Tremblay L. and Tremblay F. M. (1995) Maturation of black spruce somatic embryos: sucrose and resulting osmotic pressure of the medium. Plant Cell Tiss. Org. Cult. 42: 39-46.
Trip P., Krotov G. and Nelson C. D. (1964) Metabolism of mannitol in higher plants. Am. 1. Bot. 51: 828-835.
Upadhya M. D., Dayal T. R., Dev B., Chandra V. P., Shadra R. T and Chandra R. (1974) Chemical mutagenesis for day-neutral mutations in potato. In: Polyploidity and induced mutations in plant breeding. Proc. Meet F AOIIAEA, Bari (1972) Vienna, pp. 379-383.
Upham S. (1982) Commercial plant propagation techniques. Am. Potato J. 59: 489-490. Van den Berg J. H., Vreugdenhil D., Ludford P., Klocek 1. and Hendriks T. (1991)
Changes in starch, sugar and abscisic acid contents associated with second growth in tubers of potato (Solanum tuberosum L.) one-leaf cuttings. 1. Plant Physiol. 139: 86-89.
van der Zaag D. E. (1984) Reliability and significance of a simple method of estimating the potential yield of the potato crop. Potato Res. 27: 51-73.
van der Zaag D. E. and Burton W. G. (1978) Potential yield of the crop and its limitations. EAPR. Surv. Pap. 7: 7-22.
Vasil 1. K. and Vasil V. (1986) Regeneration in cereal and other grass species, In: Cell Culture and Somatic Cell Genetics of Plants, Vol. 3: Plant Regeneration and Genetic Variability. Academic Press, Orlando, FL, pp. 121-150.
Vecchio V., Andrenelli L., Pagano M. T. and Benedettelli S. (1994) Influence of photoperiod and media culture on potato microtuber production and dormancy (Abstract). Potato Res. 37: 440.
von Schaewen A., Stitt M., Schmidt R., Sonnewald U. and Willmitzer L. (1990)

207
Expression of a yeast-derived invertase in the cell wall of tobacco and Arabidopsis plants leads to accumulation of carbohydrate and inhibition of photosynthsis and strongly influences growth and phenotype of transgenic tobacco plants. EMBO J. 9: 3033-3044.
Vreugdenhil D. and Struik P. C. (1989) An integrated view of the hormonal regulation of tuber formation in potato (Solanum tuberosum). Physiol. Plant. 75: 525-531.
Vreugdenhil D. and Helder H. (1992) Hormonal and metabolic control of tuber formation. In: Progress in plant growth regulation. (Karssen C. M., Van Loon L. C. and Vreugdenhil D. eds.), Kluwer, Dortrecht, pp. 393-400,
Wang P. J. (1977) Regeneration of virus-free potato from tissue culture. In: Plant Tissue Culture and Its Biotechnological Application. (W. Barz, E. Reinhard, and M. H. Zenk, eds.), pp. 386-391.
Wang P. J. (1978) Gene preservation and foundation stock seed production of potato in vitro. Proc. IAPIC, 4th
, pp. 105, Abstract. Wang P. J., and Hu C. Y. (1982) In vitro mass tuberization and virus-free seed potato
production in Taiwan. Am. Potato J. 59: 33-39. Wang P. J. and Hu C. Y. (1985) Potato tissue culture and its applications in agriculture. In
"Potato Physiology" (Li, P. H. ed.), pp. 503-577. Academic Press, New York. Wareing P. F. and Jennings A. M. V. (1980) The hormonal control oftuberization in
potato. In: Plant Growth Substances. (Skoog F. ed), Springer-Verlag, Berlin, pp. 293-300.
Wattimena G. A. (1983) Micropropagation as an alternative technology for potato production in Indonesia. Ph.D. Thesis, University of Wisconsin- Madison Microfilms International, Ann Arbour, Michigan. pp. 202.
Wattimena G., McCown B. and Weis G. (1983) Comparative field performance of potatoes from microculture. Am. Potato 1. 60: 27-33.
Weber H., Borijuk L., Heim U., Buchner P. and Wobus U.(1995) Seed coat-associated invertases of fava bean control both unloading and storage functions: cloning of cDNAs and cell-type-specific expression. Plant Cell 7: 1835-1846.
Wenzel G. (1980) The potential and limits of classical genetics in plant breeding. In: Plant Cell Cultures: Results and Perpectives. (Scala F., Parisi B., Cella Rand Cifferri I. eds) Elsevier, North Holland Biomed Press, Amsterdam New York, pp. 33-47.
Wenzel G., Bapat V. A. and Uhrig H.(1983) New strategy to tackle breeding problems of potato. In: Plant Cell Culture in Crop Improvement. (Sen S. K. and Giles K. L. eds.), Plenum Press, NY, pp. 337-349.
Wetherell D. F. and Dougall D. K. (1976) Sources of nitrogen supporting growth and embryogenesis in cultured wild carrot tissue. Physiol. Plant. 37: 97-103.
White P. R (1943) In: Handbook of Plant Tissue Culture. Jaques Cattell Press, Lancaster, Pennsy lvania.
Wiersema S. G., Carbello R, Tovar P. and Dodds J. H. (1987) Rapid multiplication by planting into beds microtubers and in vitro plants. Potato Res. 30: 117-120.
Williams R R (1992) Towards a model of mineral nutrition in vitro. In: Transplant Production Systems. (Kurata K. and Kozai T. eds), Kluwer Academic, pp. 213-229.
Williams R R (1993) Mineral nutrition in vitro-A michanistic approach. Austral. 1. Bot. 41: 237-251.
208
Williams R R (1995) In: The chemical micro-environment. Aitken-Christie 1., Kozai T. and Smith M. A. L. (eds), Kluwer Academic, Netherlands, pp 405-439.
Wright N. S. (1983) Uniformity among virus-free clones often potato cultivars. Am. Potato J. 40: 381-388.
Wright D. P., Baldwin B. C., Shepard M. C. and Scholes J. D. (1995) Source-sink relationships in wheat leaves infected with powdery mildew. 1. Alterations in carbohydrate metabolism. Physiol. Mol. Plant Pathoi. 47: 237-253.
Wright K. M. and Oparka K. J. (1990) Hexose accumulation and tugor sensitive starch synthesis in disc derived from source vesus sink potato tubers. J. Exp. Bot. 41: 2355-2360.
Wu L. L., Song 1., Karuppiah N. and Kaufman P. B. (1993) Kinetic induction of oat shoot pulvinus invertase mRNA by gravistimulation and partial cDNA cloning by the polumerase chain reaction. Plant Mol. BioI. 21: 1175-1179.
Xu X, van Lammeren A. A. M., Vermeer E. and Vreugdenhil D. (1998) The role of gibberellin, abscisic acid, and sucrose in the regulation of potato tuber formation in vitro. Plant Physiol. 117: 575-584.
Zamski E. and Wyse R E. (1985) Stereospecificity of glucose carrier in sugar beet suspension cells. Plant Physiol. 78: 291-295.
Zimmerman R H., Griesbach R 1., Hammerschlag F. A. and Lawson R H. (1986) In: Tissue culture as a Plant Production System for Horticulture Crops. Martinus Nijhoff, Boston.
Ziv M. (1991) Vitrication: morphological and physiological disorders of in vitro plants. In: Micropropagation. (Debergh P. C. and Zimmerman R H., eds), Kluwer Academic Publishers, pp. 45-69.
Zrenner R, Schuler K. and Sonnewald U. (1996) Soluble acid invertase determines the hexose-to-sucrose ratio in cold-stored potato tubers. Planta 198: 246-252.

VIII. APENDICES
1. Composition of Murashige & Skoog's Basal Medium
Major salts of MS
NH4N03
KN03
CaCl2'2H2O
MgS04'7H2O
KH2P04
Minor salts of MS
KI
H3B03
MnS04'H2O
ZnS04
N~Mo04'2H20
CuS04 '5H2O
CoCl2'6H2O
Iron Solutions of MS
N~'EDTA
FeS04'7H20
Organics of MS
Myo-inositol
Nicotinic acid
Pyridoxine-HCI
Thiamine-HCI
Glycine
mg/l
1650
1900
440
370
170
0.83
6.2
22.3
8.6
0.25
0.025
0.025
37.3
27.8
100
0.5
0.5
0.5
2.0
209

2. Estimation of Glucose: HBH method (Lever 1973)
In this assay an aroylhydrazine reacts with the reducing sugar to form an aroyloszone
which forms a coloured chelate with Ca++.
210
This assay is moderately light sensitive so avoid bright light and store the reaction tubes in
the dark.
Reagents
HBH reagent: SO mM 4-Hydroxybenzoyl hydrazine dissolved in 2S mM sodium citrate
containing 10 mM CaCI2•
Compound 50ml 100ml 150ml 200ml 250ml
A Tri-sodium citrate 0.367Sg 0.73Sg l.I02Sg 1.470g 1.837Sg
B Calcium chloride 0.073Sg 0.I47g 0.220Sg 0.294g 0.367Sg
C Sodium hydroxide 0.600g I.200g I.800g 2.400g 3.00g
D Para-hydroxy 0.380Sg 0.76Ig 1.14ISg I.S22g I.902Sg
benzoic acid
Distilled water ISml 30ml 4Sml 60ml 7Sml
1. Mesure out two volums of distilled water according to the final volume desired.
2. dissolve compounds A and B together.
3. dissolve compounds C and D.
4. combine the two solutions in a suitable volume with distilled water.
S. store at 4°C in the dark.
Glucose standard: 1.0 mM (1.8 mg/ml) glucose in 0.3% benzoic acid.
Procedure
a. Preparation of calibration curve. Set up a concentration series of tubes containing
different amounts of glucose e.g.
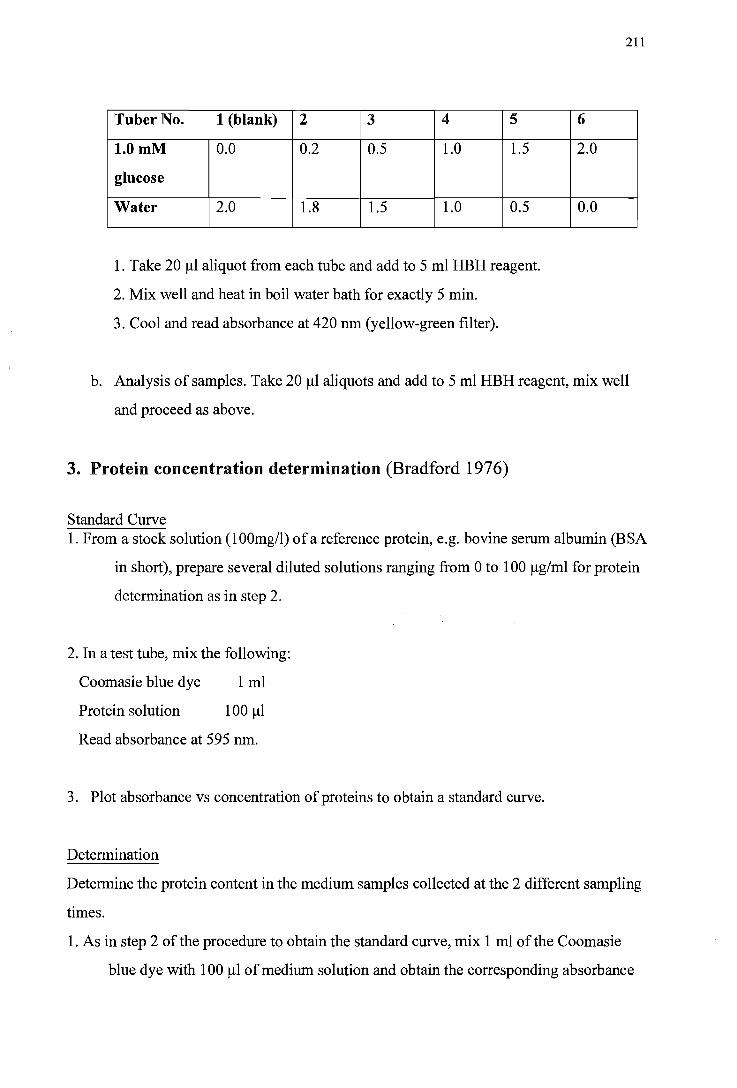
211
Tuber No. 1 (blank) 2 3 4 5 6
1.0mM 0.0 0.2 0.5 1.0 1.5 2.0
glucose
Water 2.0 1.8 1.5 1.0 0.5 0.0
1. Take 20 ~l aliquot from each tube and add to 5 ml HBH reagent.
2. Mix well and heat in boil water bath for exactly 5 min.
3. Cool and read absorbance at 420 nm (yellow-green filter).
b. Analysis of samples. Take 20 ~l aliquots and add to 5 ml HBH reagent, mix well
and proceed as above.
3. Protein concentration determination (Bradford 1976)
Standard Curve 1. From a stock solution (l OOmg/l) of a reference protein, e.g. bovine serum albumin (BSA
in short), prepare several diluted solutions ranging from 0 to 1 00 ~g/ml for protein
determination as in step 2.
2. In a test tube, mix the following:
Coomasie blue dye 1 ml
Protein solution 100 III
Read absorbance at 595 nm.
3. Plot absorbance vs concentration of proteins to obtain a standard curve.
Determination
Determine the protein content in the medium samples collected at the 2 different sampling
times.
1. As in step 2 of the procedure to obtain the standard curve, mix 1 ml of the Coomasie
blue dye with 1 00 ~l of medium solution and obtain the corresponding absorbance

at 595 nm.
2. Use the standard curve to estimate the protein concentration in the medium solution
prepared.
4. Recipes for SDS-P AGE
Separating gel (to make 30ml) 10% 12.S% lS%
Distilled water 8.0ml 5.5ml 3.0ml 1M Tris-HCI, pH 8.8 11.25ml 11.25ml 11.25ml 30% acrylamide:bis solution 10.0ml 12.5ml 15.0ml 10% SDS (w/v) 300111 300111 300111 10% ammonium persulfate (0.1 g + 10ml water) 300 111 300111 300111 TEMED 15 111 15 111 15 111
Stacking gel
Distilled water 7.5ml 1 M Tris-HCI, pH 6.8 1.25ml 30% acrylamide:bis l.Oml 10% SDS 100111 10% ammonium persulfate 40111
TEMED 15~tl
Electrophoresis buffer 1 liter 2 liter
Tris base 4.54g 9.08g Glycine 21.6g 43.20g SDS l.5g 3.00g Distilled H20 - bring volume to 1 liter 2 liter
Stain (Coomassie brilliant blue) 100ml SOOml
Absolute methanol 50ml 250ml Acetic acid (glacial) 10ml 50ml Coomassie brilliant blue O.lg 0.5g Distilled water 40ml 200ml
Destain (S% methanol, 10% acetic acid) 1 liter 2 liter
Methanol 50ml 100ml Acetic acid (glacial) 100ml 200ml
212
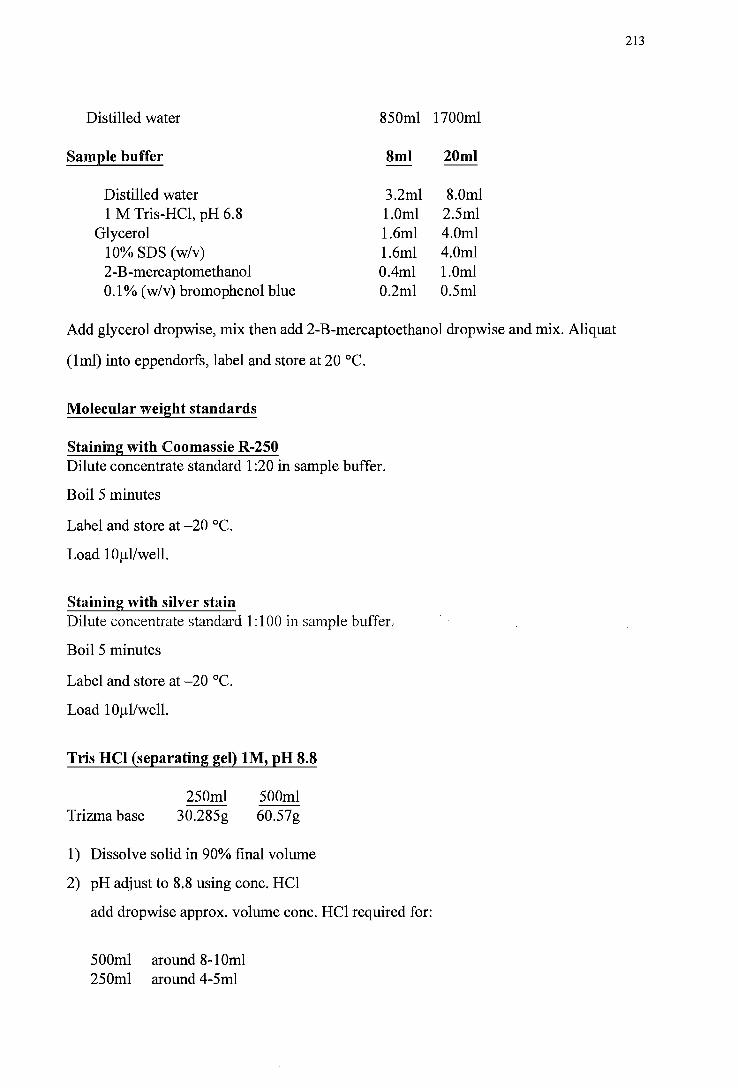
Distilled water 850ml 1700ml
Sample buffer 8ml 20ml
Distilled water 3.2ml 8.0ml 1 M Tris-HCl, pH 6.8 1.0ml 2.5ml
Glycerol 1.6ml 4.0ml 10% SDS (w/v) 1.6ml 4.0ml 2-B-mercaptomethanol o AmI 1.0ml 0.1 % (w/v) bromophenol blue O.2ml 0.5ml
Add glycerol dropwise, mix then add 2-B-mercaptoethanol dropwise and mix. Aliquat
(lml) into eppendorfs, label and store at 20°C.
Molecular weight standards
Staining with Coomassie R-2S0 Dilute concentrate standard 1 :20 in sample buffer.
Boil 5 minutes
Label and store at -20°C.
Load 10 Ill/well.
Staining with silver stain Dilute concentrate standard 1: 1 00 in sample buffer..
Boil 5 minutes
Label and store at -20°C.
Load lOllI/well.
Tris HCI (separating gel) 1M, pH 8.8
250ml --
Trizma base 30.285g 500ml 60.57g
1) Dissolve solid in 90% final volume
2) pH adjust to 8.8 using conc. HCI
add dropwise approx. volume conc. HCI required for:
500ml around 8-1 Oml 250ml around 4-5ml
213
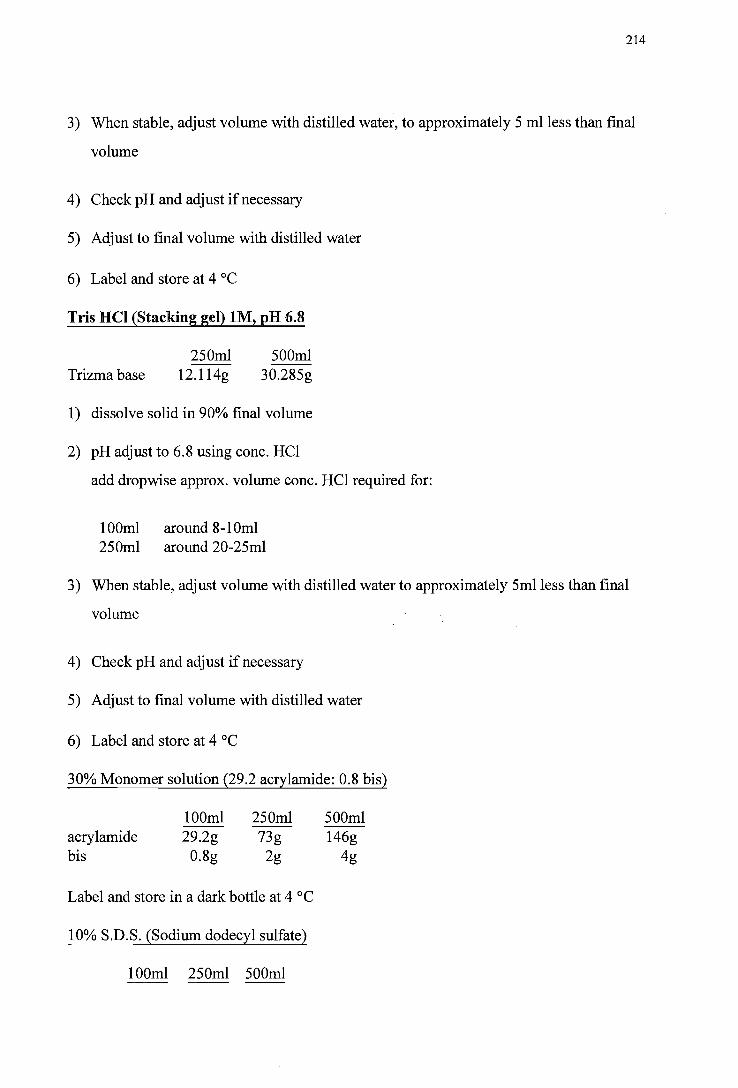
214
3) When stable, adjust volume with distilled water, to approximately 5 mlless than final
volume
4) Check pH and adjust if necessary
5) Adjust to final volume with distilled water
6) Label and store at 4 °C
Tris Hel (Stacking gel) 1M, pH 6.8
250ml --
Trizma base 12.l14g 500ml
30.285g
1) dissolve solid in 90% final volume
2) pH adjust to 6.8 using conc. HCI
add dropwise approx. volume conc. HCI required for:
100ml around 8-10ml 250ml around 20-25ml
3) When stable, adjust volume with distilled water to approximately 5ml1ess than final
volume
4) Check pH and adjust if necessary
5) Adjust to final volume with distilled water
6) Label and store at 4 °C
30% Monomer solution (29.2 acrylamide: 0.8 bis)
acrylamide bis
100ml 29.2g
0.8g
250ml 73g 2g
Label and store in a dark bottle at 4 °C
10% S.D.S. (Sodium dodecyl sulfate)
100ml 250ml 500ml
500ml --146g
4g

215
SDS 109 25g 50g
Label and store at room temperture
5. Silver Stain Procedure
1. Soak gel in 50% methanol, 10% glacial acetic acid (200mI) for 30 min. (Can also be left
in this solution overnight).
2. Wash the twice for 10 min. with distilled (deionized) water.
3. Wash in 120 ml of 10% glutaraldehyde (biological grade) for 30 min. (10%
glutaraldehyde: 45ml of25% glutaraldehyde added to 60 ml of distilled water).
4. Rinse with 500 ml distilled water for 2hr. with at least 4 times distilled water changes.
5. Agitate for 1 hr. with 500 ml distilled water, repeating 3 times, for a total of 4 hr. and
drain well. (Can also be washed overnight in 1000 ml distilled water).
6. Make the following immediately before use and add in order (in the fume hood):
0.36% (w/v) NaOH (4.5 ml of 1 M150 ml) 15.3 ml
add dropwise cone. NH40H (must be fresh saturated solution)
and slowly, with stirring AgN03 (aq.) 0.2 g/ml
ethyl alcohol (100%)
1.03 ml
3.0ml
55 ml
7. Add to the drained gel, soak with agitation for 5 min. (not more than 10 min.), no longer
and dispose ofthis solution down the sink in the fume hood.
8. Wash with distilled water for 5 min., repeating 3 times, for total of20 min. pour offthe
water.
9. Add the following solution
Ethanol 10.0 ml
1 % citric acid
38% formaldehyde
distilled water to 1 liter
5.0ml
1.0 ml
10. Remove gel when bands are dark enough, usually 8 to 10 min.
11. Place gel in 5% acetic acid to fix and photograph immediately.

6. Native Isoelectric Focusing Gel
To run a native isoelectric focusing gel, the following protocol must be made:
A. Pouring the Gel (pH 4-6)
Native Isoelectric Focusing Gel
216
5% T (the total monomer concentration, %T =(g acrylamide+ g bis-acrylamide)/total
volumex100), 3.3% C (the crossing linking monomer concentration, %C=(g bis
acrylamide/(g acrylamide+ g bis-acrylamide)x100). For two 8 x 7 m x 0.75 mm minigels,
need to prepare 12 ml.
1) 9.7 ml H20
2) 2 ml Solution A
3) 48 III ampholyte solution pH 3.5-10
4) 240 III ampholyte solution pH 4-6
5) 50 III 10% ammonium persulfate
6) 20 III TEMED
B. Sample Preparation and Application
Native Gel Sample Buffer (2x), 5 ml
1) 2ml glycerol
2) 200 III ampholytes (same propotions as for gel)
3) 1.8 ml H20
1. Mix protein sample with an equal volume of 2x Sample Buffer. Spin 5 min. at 10,000 x
g (in eppendorf centrifuge) before applying sample.
2. Load sample into well.
C. Focusing Conditions - to be carried out at room temperature.
7. Desalting
Gel preparation
1. Gradually add dry desalting gel (Bio-Gel P-6DG, Bio-Rad Laboratories, U.S.A.) to

217
phospate buffer (PH 6.0) in a beaker. Each gram of dry desalting gel will form
approximately 7 ml of packed bed. Use twice as much buffer as the expected packed bed
column.
2. Allow gel to hydrate 30 min. at room temperature. Let the gel settle during hydrating.
3. Resuspend the gel in excess buffer. When 90-95% of the gel has settled, remove fine
particles by decanting the excess buffer. Adjust to a volume of twice the expected packed
bed volume.
4. Degass by aspirating at reduced pressure.
Pouring the column
1. Fix funnel to top of column, close column outlet, and add enough buffer to fill 20% of
column.
2. Smoothly pour uniform slurry into column.
3. When 2-5 cm of bed has formed, allow column to flow until fully packed.
4. Remove excess gel and equibrate column by passing two bed volume of buffer through
the colunm at operating flow rates.
Desalting procedure
1. Drain buffer to the level of gel bed and stop flow. Carefully layer sample onto the bed
surface and drain into the bed. Follow this with buffer to wash the sample into the bed.
Attach reservoir and begin run.
2. The separation can be monitored by UV -Visible Photometry and the desired fractions
collected. Once a column has been characterized, monitoring is no longer necessary since
elution volumes will be consistent. The void volume should be 30-35% ofthe column
volume.
3. Wash column with starting buffer until low molecular weight material is completely
eluted. Two bed volumes should be sufficient.