ykr international resources ltd. magnetic field …
TRANSCRIPT

AMEROK GEOSCKNCES LTD.
YKR INTERNATIONAL RESOURCES LTD. MAGNETIC FIELD AND VLF-EM SURVEYS
ON THE REVENUE CREEK PROPERTY, DAWSON RANGE, YUKON TERRITORY
Andrew Davis
Location: 62' 20' N 137" 15' W NTS: 11 5 116 Mining District: Whitehorse, YT Date: September 28, 1998

AMEROK GEOSCIENCES LTD.
SUMMARY
Total field magnetic and VLF-EM surveys were conducted on the Revenue Creek property for YKR International Resources Ltd. to locate structures or rock units hosting gold mineralization.
The magnetic survey found a close association of geochemical gold values and magnetic trends on the property. The Discovery, Guder, Klaus, and Gow Zones are all associated with magnetic lows and the Discovery and Guder zones are located in ground where substantial magnetic lows were recorded. More barren sites, sampling less than 100 ppb, typically coincide with magnetic highs on the property.
An extensive, E-W trending, weak conductor was delineated by the VLF-EM survey. Its location also coincides with the Discovery and Guder zones. The conductor may represent an fault or shear zone.

AMEROK GEOSCIENCES LTO .
TABLE OF CONTENTS
1.0 INTRODUCTION . . . . . . . . . . . . . . . . . . . . . . . . . . . . . . . . . . . . . . . . . . . . . . . . 1
2.0 LOCATION AND ACCESS . . . . . . . . . . . . . . . . . . . . . . . . . . . . . . . . . . . . . . . . 1
3.0 PROPERTY . . . . . . . . . . . . . . . . . . . . . . . . . . . . . . . . . . . . . . . . . . . . . . . . . . . . 1
4.0 GRID . . . . . . . . . . . . . . . . . . . . . . . . . . . . . . . . . . . . . . . . . . . . . . . . . . . . . . . . . 2
5.0 PROPERTY GEOLOGY . . . . . . . . . . . . . . . . . . . . . . . . . . . . . . . . . . . . . . . . . . 2
6.0 PERSONNEL AND EQUIPMENT . . . . . . . . . . . . . . . . . . . . . . . . . . . . . . . . . . . 4
7.0 SURVEY SPECIFICATIONS . . . . . . . . . . . . . . . . . . . . . . . . . . . . . . . . . . . . . . . 4
. . . . . . . . . . . . . . . . . . . . . . . . . . . . . . . . . . . . . . . . . . . . . . . . . . . . . . . . . 8.0 DATA 5
9.0 INTERPRETATION PROCEDURES . . . . . . . . . . . . . . . . . . . . . . . . . . . . . . . . . 5 9.1 Magnetic Field . . . . . . . . . . . . . . . . . . . . . . . . . . . . . . . . . . . . . . . . . . . . 5 9.2 VLF-EM . . . . . . . . . . . . . . . . . . . . . . . . . . . . . . . . . . . . . . . . . . . . . . . . . . 5
10.0 MAGNLF-EM SURVEY RESULTS . . . . . . . . . . . . . . . . . . . . . . . . . . . . . . . . . 7
11.0 DISCUSSION . . . . . . . . . . . . . . . . . . . . . . . . . . . . . . . . . . . . . . . . . . . . . . . . . . . 8
12.0 CONCLUSIONS . . . . . . . . . . . . . . . . . . . . . . . . . . . . . . . . . . . . . . . . . . . . . . . . . 9
13.0 RECOMMENDATIONS . . . . . . . . . . . . . . . . . . . . . . . . . . . . . . . . . . . . . . . . . . . 9
REFERENCES CITED . . . . . . . . . . . . . . . . . . . . . . . . . . . . . . . . . . . . . . . . . . . . . . . . 10
APPENDIX A . CERTIFICATE . . . . . . . . . . . . . . . . . . . . . . . . . . . . . . . . . . . . . . . . . . 11
APPENDIX B . STATEMENT OF COSTS . . . . . . . . . . . . . . . . . . . . . . . . . . . . . . . . . 12
APPENDIX C . PLOTS . . . . . . . . . . . . . . . . . . . . . . . . . . . . . . . . . . . . . . . . . . . . . . . 13

AMEROK GEOSCIENCES LTD.
LIST OF FIGURES
Figure a. Property Location . . . . . . . . . . . . . . . . . . . . . . . . . . . . . . . Following page 1
Figure b. Grid locations . . . . . . . . . . . . . . . . . . . . . . . . . . . . . . . . . . . Following page 2
Figure c. VLF Response of a Thin Vertical Conductor . . . . . . . . . . . . . . . . . . . . . page 6
Figure 1. Total Magnetic Field Contour Map . . . . . . . . . . . . . . . . . . . . . . . Appendix C
Figure 2. Fraser Filtered VLF In-Phase (Hawaii) . . . . . . . . . . . . . . . . . . . . Appendix C
Figure 3. Fraser Filtered VLF In-Phase (Maine) . . . . . . . . . . . . . . . . . . . . . . Appendix C
Figure 4. Stacked VLF-EM (Hawaii) . . . . . . . . . . . . . . . . . . . . . . . . . . . . . . Appendix C
Figure 5. Stacked VLF-EM (Maine) . . . . . . . . . . . . . . . . . . . . . . . . . . . . . . . Appendix C

AMEROK GEOSCIENCES LTD.
1.0 INTRODUCTION
This report describes the magnetometer and very low frequency electromagnetic (VLF- EM) surveys conducted on the Revenue Creek property in the Dawson Range. The surveys were conducted to further investigate geochemical soil anomalies.
2.0 LOCATION AND ACCESS
The Revenue Creek property is centred at approximately 62' 20' N 137' 15' W (Figure A) approximately 80 km northwest of the Village of Carmacks. Good year round access is provided to the property by the Freegold Road.
3.0 PROPERTY
The Revenue property consist of 66 contiguous mineral claims, as listed in Table 1 below.
Table 1. Claim Data
Cfaim Name
Revenue Copper 1 - 8
Addition 1 - 2
Addition 3 - 4
Homestake 1 - 2
Addition 5
lnca 1 - 4
lnca 7 - 8
Revenue No.9
Revenue 11
Revenue No. 13 -1 6
Revenue 21 - 22
Grant No. Expiry Date
Revenue rnagNLF survey repori - page 1

I'
YKH INTERNATIONAL RESOURCES LTD. REVENUE PROPERTY
0 Loo MINING DISTRICT kilornelres I i
PROPERTY LOCATION NTS 115 / 6 /SCALE I 6 000 oool D R A W N BY CP I
AMEROK GEOSCIENCES LTD DATE 14 AUG Q ~ ~ F I G U R E rh I
AMEROK GEOSCIENCES LTD.
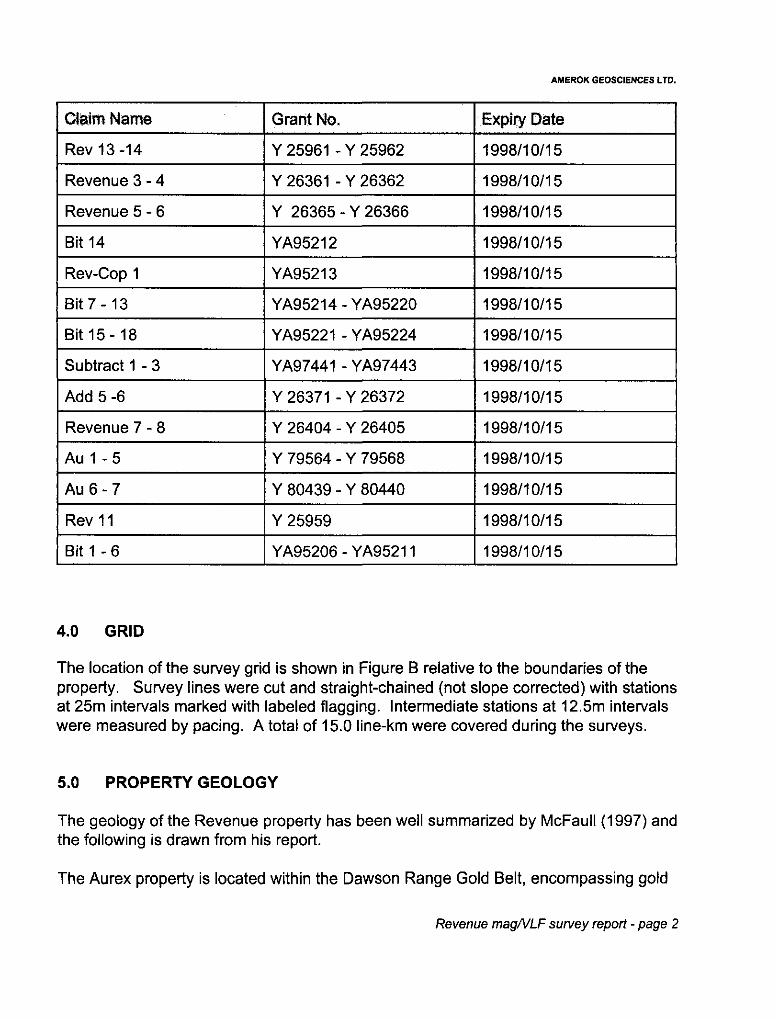
I Claim Name I Grant No. I Expiry Date I I Rev 13 -14 I Y 25961 - Y 25962 1 1998110115 I I Revenue 3 - 4 I Y 26361 - Y 26362 1 1 998110115 I I Revenue 5 - 6 I Y 26365 - Y 26366 1 1998110115 I I Bit 14 I YA95212 1 1998/10115 I I Rev-Cop 1 I YA95213 1 1998110115 1
I Subtract 1 - 3 I YA97441 - YA97443 1 1998110115 I Add 5 -6
Revenue 7 - 8
A u I - 5
A u 6 - 7
Rev 11
4.0 GRID
Bit 1 - 6
The location of the survey grid is shown in Figure B relative to the boundaries of the property. Survey lines were cut and straight-chained (not slope corrected) with stations at 25m intervals marked with labeled flagging. Intermediate stations at 12.5m intervals were measured by pacing. A total of 15.0 line-km were covered during the surveys.
Y 26371 - Y 26372
Y 26404 - Y 26405
Y 79564 - Y 79568
Y 80439 - Y 80440
Y 25959
5.0 PROPERTY GEOLOGY
- --
199811 011 5
1998110115
199811 011 5
199811 011 5
1998110115
YA95206 - YA95211
The geology of the Revenue property has been well summarized by McFaull(1997) and the following is drawn from his report.
199811 011 5
The Aurex property is located within the Dawson Range Gold Belt, encompassing gold
Revenue magNLF survey report -page 2


AMEROK GEOSCIENCES LTD.
bearing and copper-gold bearing porphyry systems near the Big Creek Fault. Eight known gold andlor copper-gold porphyry properties are located near the fault, including Mt. FreegoldIAntoniuk, Revenue, Nucleus, KlazaINitro, Cash, Tad, Cockfield and Casino. Numerous other smaller, primarily epithermal gold showings are found in this belt.
Large areas of the Dawson Range are underlain by Jurassic (?) and Triassic granodiorite and monzonite which is important at porphyry copper complexes such as Mt. Nansen, Mt. Freegold, and Revenue. Hornblende gneiss and quartz-chlorite schist on the Revenue property has been intruded by a quartz monzonite pluton. This pluton has been further intruded by a feldspar porphyry and a granite porphyry dyke swarm.
The Revenue Creek property contains occurrences of chalcopyrite, molybdenite, scheelite and gold. Important mineralized zones of the property are the Discovery Zone, the Gow Zone, the Klaus Zone and the Guder Zone. Massive chalcopyrite striking parallel to Revenue Creek has been found in the Discovery Zone. Adjacent to this zone is a brecciated feldspar zone which shows values in copper and gold, and fine grained chalcopyrite and pyrite mineralization with some higher grade veins throughout. The Klaus, Guder and Gow Zones are found to the west of the Discovery Zone. The Klaus Zone is a high grade gold vein showing at the head of the placer workings. The Guder Zone is an extension of the Discovery Zone within the feldspar porphyry breccia with similar copper and gold values. The Gow Zone is a strong copper-gold anomaly to the west of the Guder Zone.
Associations with gold vary throughout the property. Gold occurs with tungsten in some samples running east of the Discovery Zone within the feldspar porphyry breccia pipe. Gold occurs in high grade quartz veins and vein faults in the Klaus Zone. Typically gold occurs in low grades throughout the property as disseminations and as quartz stockworks in the feldspar porphyry breccia pipe.
Supergene copper mineralization is also found as a discontinuous blanket on the property. This zone ranges up to 50m thick and contains chalcocite, with minor covellite, azurite and malachite, replacing hypogene pyrite and chalcopyrite.
Different targets have been explored on the property at various times. High-grade copper-gold lenses were targets in the original Discovery Zone. A large copper- molybdenum porphyry, low grade large tonnage heap leach epithermal gold and high grade gold quartz veins are among the others.
Revenue magNLF survey report - page 3
AMEROK GEOSCIENCES LTD.
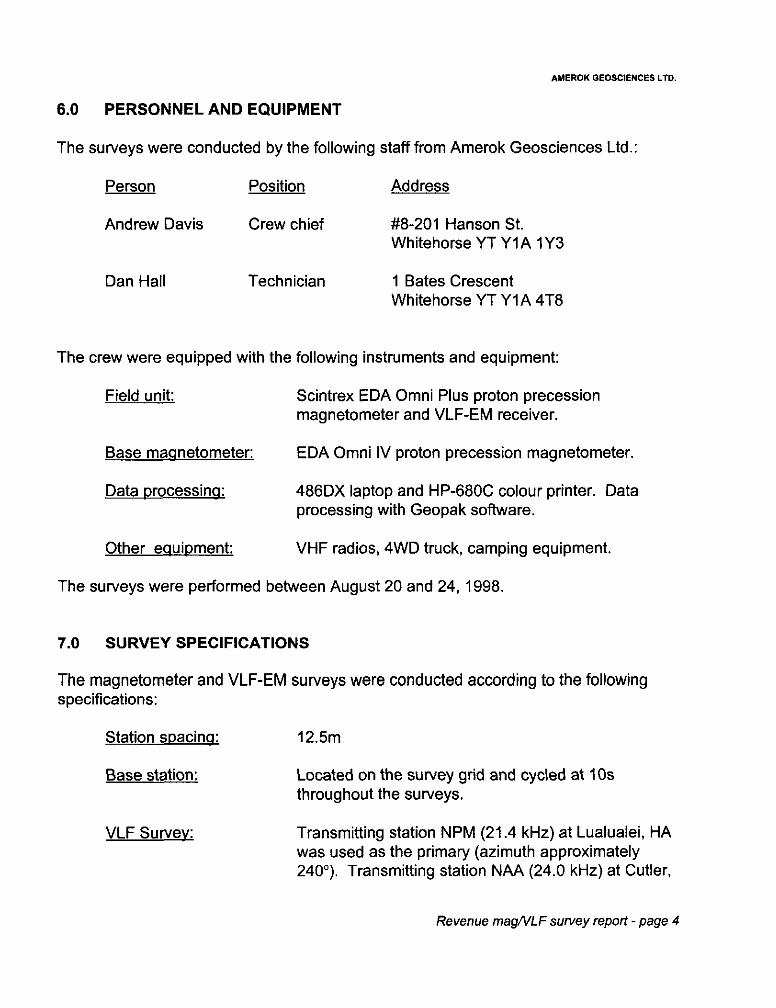
6.0 PERSONNEL AND EQUIPMENT
The surveys were conducted by the following staff from Amerok Geosciences Ltd.:
Person Position Address
Andrew Davis Crew chief #8-201 Hanson St. Whitehorse YT YIA 1Y3
Dan Hall Technician 1 Bates Crescent Whitehorse YT YIA 4T8
The crew were equipped with the following instruments and equipment:
Field unit: Scintrex EDA Omni Plus proton precession magnetometer and VLF-EM receiver.
Base maanetometer: EDA Omni IV proton precession magnetometer.
Data ~rocessina: 486DX laptop and HP-680C colour printer. Data processing with Geopak software.
Other eaui~ment: VHF radios, 4WD truck, camping equipment.
The surveys were performed between August 20 and 24, 1998.
7.0 SURVEY SPECIFICATIONS
The magnetometer and VLF-EM surveys were conducted according to the following specifications:
Station s~acina: 12.5m
Base station: Located on the survey grid and cycled at 10s throughout the surveys.
VLF Survev: Transmitting station NPM (21.4 kHz) at Lualualei, HA was used as the primary (azimuth approximately 240"). Transmitting station NAA (24.0 kHz) at Cutler,
Revenue rnagNLF survey repoll -page 4

AMEROK GEOSCIENCES LTD.
ME (azimuth approximately 95") was used as an alternate.
8.0 DATA
The data acquired in the Magnetic and VLF-EM surveys of the property are presented in Appendix C of this report. A contour map of Total Magnetic Field and contour maps of Fraser Filtered VLF-EM data for both primary and secondary frequencies are provided. Stacked profiles presenting raw VLF-EM results are also included.
Copies of the ASCII formatted Geopak XYZ files are appended to this report on 3.5" disk. The data in the XYZ files in the final corrected data which has been plotted. The header at the top of each file describes the data format and contains grid information. A few suspect data points and data points have been replaced with a default values and the software has contoured around them.
9.0 INTERPRETATION PROCEDURES
9.1 Magnetic Field
The International Geomagnetic Reference Field for the survey area prescribes a total field strength of 57,580 nT, declination of 28.9" east, and inclination of 77.3". A steeply dipping E-W magnetized body in this field will produce a total field anomaly consisting of a peak centred over the top of the target and a low amplitude trough immediately north of the body.
9.2 VLF-EM
VLF methods utilize high power military transmission stations as sources of electromagnetic (EM) waves. EM waves consist of a propagating waves with electric and magnetic fields directed perpendicular to each other and also to the direction of propagation. The earth's atmosphere acts as a waveguide for the EM waves. As waves travel, a portion of their energy is transmitted into the earth, generating secondary EM fields within conductive bodies. Secondary fields are proportional in strength and of the same frequency as source fields, however phase relations differs.
The VLF receiver measures horizontal components of the electric field and magnetic fields due to the source field and vertical component of the secondary magnetic field induced in the conductor. The vertical magnetic field component of the secondary field due to a geologic source is expressed as a percentage of the source field. The
Revenue magNLF survey report -page 5

AMEROK GEOSCIENCES LTD.
secondary vertical magnetic field differs in phase from the primary source field and is reduced into in-phase and out-of-phase components (or quadrature). These data are recorded by the VLF receiver.
The secondary field induced in a thin vertical conductor is shown in Figure 3. An asymmetrical response is observed. Directly over the thin conductor the secondary field has no vertical component and this point is termed the crossover point. On either side of the conductor are observed magnetic fields of opposing sense.
c' COMARY FIELD
Flgure G VLF response due to a vertical conductor. (Modified from Field Geophysics, Milsom, 1989)
The Fraser filter takes advantage of this asymmetrical response in locating vertical and steeply dipping conductors. The Fraser filter incorporates the following algorithm for four consecutive data points a l , a2, a3, and a4:
Fraser filter data point f l = [(a1 + a2)/2 - (a3 + a4)/2]
Negative values are not plotted. This filter converts the asymmetric crossover response in H to a simple peak centred over the conductor. The surface location of the conductor
Revenue rnagNLF survey repod - page 6

AMEROK GEOSCIENCES LTD.
is then highlighted. VLF methods are best suited to mapping near vertical conductors , fractures and contacts.
Transmitting stations are located in Lualualei, HA and Cutler, ME. Signal strength from the Lualualei is moderate while that of Cutler is low when receiving in the Yukon. This can result in a high signal-to-noise ratio in the data sets. Fraser filtered data of less than 5% is not substantial. Sources of noise include conductive surface features (roads, streams, etc.) that are sometimes presented in VLF-EM data sets.
The Lualualei signal was used as the primary source frequency, as it is stronger in amplitude than Cutler, the secondary frequency. On the last day of the survey, the Cutler, ME transmitting station was not transmitting, and this accounts for the absence of secondary frequency data for lines west of Line 1000W.
10.0 MAGNLF-EM SURVEY RESULTS
The results of the surveys have been compared with geochemical results provided by McFau11 (1 997).
Several broad features were mapped by the magnetometer survey on the property. The contour map of total magnetic field strength shows a broad central magnetic low from Line 200W, 200s to Line 300E, 100s. coincident with the Guder, Discovery and Klaus Zones. This area has been described as being underlain by a brecciated zone containing anomalously high copper and gold values (McFaull 1997).
A general magnetic high occurs at 580E, 300N to 1000E. 300S, in the vicinity of Bowlidden Creek and on the east facing slope east of the Discovery Zone. Soil sampling in this area has not detected any strong gold geochemical anomalies. Available data indicates that soil sampling here has not been done to the extent that it has elsewhere on the property, which may be in part the reason for the lack of any substantial soil geochemical response on the compilation map.
The strongest magnetic high anomaly is a northwest trending high running from Line 400W, 100s to Line 600W, 150N. Again, no strong gold soil anomalies were detected within this anomaly, except at a few localized sites where sites showed less than 500 ppb gold. The magnetic high seems to be offset at 100S, and a similar anomaly is shown extending from Line 700W,100S to Line 600W, 300s. This offset may correspond to an inferred fault (McFaull 1997). Magnetic data suggests left lateral displacement along the fault trace. The location of the fault marks the approximate boundary of the Gow and Guder Zones.
Revenue magNLF survey reporf -page 7

AMEROK GEOSCIENCES LTD.
Strong soil geochemistry gold anomalies occur at the west margins of the northwest trending magnetic high, between Line 800W and Line 900W and south of Baseline ON. Gold values of greater than 500 ppb have been located at these sites.
A broad magnetic low is centred at 1200W. 300s. Soil geochemistry analysis has found consistent gold values between 100 and 500 ppb near this location. Magnetic field strength increases gradually to the north where gold geochemical response is subdued.
The VLF-EM survey has located one weak, E-W trending conductor, marked as conductor axis A on Fraser filtered in-phase data contour maps for both primary (NLM) and secondary (NAA) frequencies. The conductor extends from 200W. 50s to 700E, 25N. The axis of the conductor appears to be coincident with the Discovery and Guder Zones and its location approximately corresponds to the brecciated feldspar porphyry containing copper and gold mineralization.
11.0 DISCUSSION
Gold mineralization in the Discovery, Guder, Klaus and Gow zones seems to be associated with magnetic field lows. Soil geochemical responses of less than 100 ppb typically coincide with magnetic highs on the property.
The E-W trending conductor delineated in the VLF-EM survey coincides with the Discovery and Guder zones. A weak response has been noted; Fraser filtered data is on the order of 10%. The source is likely a fault or shear zone, but may represent a zone of mineralization.
Revenue rnagNLF survey report -page 8

AMEROK GEOSCIENCES LTD.
12.0 CONCLUSIONS
The results of the magnetometer and VLF-EM surveys conducted on the Revenue property suggest the following conclusions:
a. A comparison of geochemical data and magnetic field data shows a close association of gold mineralization with magnetic field lows on the property. The Discovery. Guder, Gow and Klaus zones all appear to be coincident with magnetic lows. The strongest magnetic low anomaly coincides with the Guder and Discovery Zones.
b. The VLF-EM survey has located one coherent, E-W trending conductor on the property. Its axis corresponds to the Discovery and Guder zones. Due to its weak strength, it likely represent a fault or shear zone.
13.0 RECOMMENDATIONS
The following recommendations are made based on the conclusions of this work:
a. Magnetic field lows should be further defined by additional in-fill lines on 50m centres.
b. Prospecting and geochemical surveying should be conducted at sites of magnetic lows located by this survey.
Respectfully submitted, AMEROK GEOSCIENCES LTD.
Andrew Davis Geophysicist
Revenue magNLF survey report -page 9

AMEROK GEOSCIENCES LTD.
References Cited
McFaull, Jim. (1997) Compilation Report: Geology of the Revenue Property. INAC: Unpublished Assessment Report.
Milsom, John (1989) Field Geo~hvsics. Chichester, England: John Wiley & Sons.
Telford, W.M.. L.P. Geldart and R.E. Sheriff (1990) ADDlied Geo~hvsics (2nd Edition) New York: Cambridge University Press.
Revenue rnagNLF survey report -page 10

AMEROK GEOSCIENCES LTQ.
APPENDIX A. CERTIFICATE
I, Andrew Richard Davis, with residence address in Whitehorse, Yukon Territory do hereby certify that:
1. I have completed my fourth year of studies in Geophysics.
2. 1 have been actively involved in mineral exploration the Northern Cordillera since June 1998.
3. 1 conducted the Magnetometer and VLF-EM surveys and interpreted the results with the assistance of Mike Power, P. Geoph.
4. 1 have no interest, direct or indirect, nor do I hope to receive any interest, direct or indirect, in YKR International Resources Ltd. or any of its properties.
Dated this 30th day of September, 1998 in Whitehorse, Yukon.
Respectfully submitted,
Andrew Davis
Revenue magNLF survey report - page 11

AMEROK GEOSCIENCES LTD.
APPENDIX B. STATEMENT OF COSTS
Mobilization 1 demobilization $1050.00
MagNLF Survey and Gridding $3940.00
Report $1 550.00
GST
Total Expenditures $6998.00
I certify that these expenses are correct to the best of my knowledge.
Andrew Davis Geophysicist
Revenue magNLF survey reporf -page 12

A.J. (Jim) McFaull B.Sc., F.G.A.C Exploration Geologist
a5 - 100 h u e s Baulevaid Whilehorse. Yukon Territory. Canada Y 1 A 3 W i Phone 403-667-7'XE
APPENDIX B. TOTAL STATEMENT OF COSTS
Amerok Geosciences Ltd. Total ~xpenditures ............... $6998.00 Aurex Exploration Total Expenditures ..................... $ 800.00
FINAL EXPENDITURES FOR REVENUE CREEK PROPERTY.. .......... $7798.00
I certify that these expenses are correct to the best of my knowledge.
Jim McFalll B . S c . , F.G.A.C. Exploration Geologist

A.J. (Jim) McFaull BSc., F.G.A.C Exploration Geologist
85 100 Lewes Boulevard Whilehorse. Yukon Territory. Canada Y l A 3 W 1 Phone 403.667~7935
INVOICE
To; YKR International Resources Ltd. 206-D Jarvis Street Whitehorse, Yukon Territory Y1A 3W1
For; Geological supervision of the Magnetometer/VLF-EM survey on the REVENUE CREEK property by Amerok Geosciences Ltd. on August 4 and September 8, 1998.
Cost; 2 days @ $400/day= ................................. $800.00
I certify that these expenses are correct to the best of my knowledge.
Jim McFdu 1 B.Sc., F.G.A.C. Explorati n Geologist
cc. Attach to APPENDIX B. STATEMENT OF COSTS YKR INTERNATIONAL RESOURCES LTD. MAGNETIC FIELD AND VLF-EM SURVEYS ON THE REVENUE CREEK PROPERTY, DAWSON RANGE, YUKON TERRITORY
by Andrew Davis Amerok Geosciences Ltd. September 28,1998

AMEROK GEOSCIENCES LTD.
APPENDIX C. PLOTS
Revenue magNLF survey report -page 13


