yiwei jia,$*f theodore j. dimagno,l chi-kin chan,' … jia jphyschem97.pdf · marianne...
TRANSCRIPT
13180 J. Phys. Chem. 1993,97, 13 180-1 3 19 1
Primary Charge Separation in Mutant Reaction Centers of Rlrodobacter capsulatust
Yiwei Jia,$*f Theodore J. DiMagno,l Chi-Kin Chan,' Zhiyu Wang,$i# Mei h , b $ Deborah K. Hansoqll Marianne Schiffer,' James R. Norris,$*# Graham R. Fleming,'-$*# and Maxim S. Popovb# Department of Chemistry and The James Franck Institute, The University of Chicago, Chicago, Illinois 60637; Department of Chemistry, California Institute of Technology, California 91 125; LCPINIDDK, National Institutes of Health, Bethesda, Maryland 20892; and Chemistry Division and Biological and Medical Research Division, Argonne National Laboratory, Argonne, Illinois 60439
Received: July 15, 1993; In Final Form: October 15, 1993'
Excited-state decays of the special pair of Rhodobacter capsulatus and 10 mutants as a function of temperature are presented. The mutations are a t the symmetry-related sites L181 and M208. All the decays are nonexponential, although the degree of nonexponentially depends strongly on the mutant and the temperature. We correlated the changes in decay time with mutation-induced changes in the redox potential of the ground state of the special pair. The qualitative form of the decays led us to explore a model based on a small Gaussian distribution of free energy gaps for the electron-transfer process. The model is used to estimate the reorganization energy arising from low-frequency protein and intramolecular modes coupled to the electron transfer, Our fitting procedure gives values of 1250 and 500 cm-I a t 292 and 22 K, respectively. A consideration of possible errors leads us to conclude that the room temperature value could be no larger than twice the fitted value (i.e., 1500 cm-l). The implications of our results for the mechanism of primary charge separation are discussed.
I. Introduction The primary charge separation process in the reaction center
(RC) of photosynthetic bacteria has been extensively studied by many experimental techniques including transient absorption spectroscopy,l-ll spontaneous emission spectroscopy,12-14 electric field effects,1s19 hole burning,2@2s and Raman spectroscopy.2628 Experiments have been carried out over a wide temperature range.
A topic that has engendered considerable debate is whether the primary charge separation process from the excited state of thespecial pair (P*) to theactive-branchpheophytin (HA) involves a two-step sequential*.9 mechanism in which the "accessory" bacteriochlorophyll molecule (BA) acts as an intermediate, a one- step superexchangez9+30 mechanism in which the accessory bacteriochlorophyll is a "virtual" intermediate, or a combination of both mechanism^.^.^^ Several molecular dynamics simulations have been carried out,324 the results of Warshel and co- w o r k e r ~ ~ ~ - ~ ~ support the two-step model, whereas the recent simulation of Chandler and co-workers" supports the superex- change mechanism. The possibility of the involvement and the relative amplitudes of both mechanisms have also been theoret- ically studied.31#4**47 Low-frequency oscillating features in the femtosecond spectroscopy of the reaction center have been observed and may indicate that a more elaborate electron-transfer theory is required.48-50
The use of the genetically modified reaction c e n t e r ~ 6 ~ l ~ l has been widely adopted and has contributed a great deal to the understanding of the bacterial reaction center. In this paper we use this approach to investigate the role of amino acids at two particular locations L18 1 and M208 in Rhodobacter capsulatus. These two symmetry-related sites are located roughly equidistant from thespecial pair (closest aromaticcontacts inRb. sphaeroides are 4.3 A (PA) and 4.4 A (PB) for L181 and 4.2 A (PA) and 3.5 A (PB) for M208) on the inactive (B) and active (A) electron-
f We dedicate this paper to the memory of Gerhard Closs. His penetrating intellect and vast knowledge would have certainly improved our paper had we been able to discuss it with him.
t Department of Chemistry, The University of Chicago. I The James Franck Institute, The University of Chicago. I California Institute of Technology. # Chemistry Division, Argonne National Laboratory. 1 Biological and Medical Research Division, Argonne National Laboratory. *Abstract published in Advance ACS Absrrucrs, November 15, 1993.
0022-3654/93/2091-13 180$04.00/0
transfer branches, respectively. M208 is also close to the active branch bacteriochlorophyll (4.2 A) and the active branch pheophytin (3.3 A). We have shown that changes from the wild- type residues phenylalanine (L18 1) and tyrosine (M208) alter the redox potential of the special Our previous results onthedoublemutantPheL181 -Tyr,TyrM208-Phesuggests that changes in either site have similar influences on the electron- transfer rate, leading to the hypothesis that mutation of these sites influences electron transfer via the P/P+ redox potential rather than BIB- or H/H-. In this paper we will explore this assumption quantitatively.
Interpretation of the kinetic data is complicated by the finding that the decay of the excited state of the special pair of Rb. sphaeroides R26, Rb. capsulatus, and a series of L181/M208 mutants of Rb. capsulatus cannot be described by a single e ~ p o n e n t i a l . ~ ~ - ~ ~ , ~ 8 To date the decays have generally been well fit as the sum of two exponentials in the 0-50 ps time range. Such a finding appears to rule out a simple homogeneous one-step or irreversible two-step mechanism. Several possible origins of the nonexponential decay have been proposed: (1) The kinetic scheme (for instance, one involving the coexistence of the superexchange and the sequential mechanisms with a reversible first step in the sequential processl2.31) may produce intrinsically biexponential decay. (2) Vibrational relaxation and/or dephasing may be slow on the time scale of the charge separation.49~64 In addition, the electronic coupling between the various reaction center compo- nents may change significantly between the P, P*, and P+ states leading to complex changes in the spectrum. For example, femtosecond evolution in the transient spectrum of Rb. sphaeroi- des R26 has been reported.50 (3) The existenceof inhomogeneity (conformational substrates) in the protein may yield a distribution of the parameters which govern the electron-transfer rate.12.56.6=7 The possibility of the existence of a distribution of reaction centers was proposed to account for wavelength-dependent charge separation rates observed in pumpprobe studies.68 However, no wavelength-dependent kinetics have been observed in spontaneous emission.l2 (4) In addition to static inhomogeneity, internal motions of the protein or the chromophores may modulate the electronic coupling on the time scale of the electron transfer,@.69JO leading to nonexponential kinetics.
0 1993 American Chemical Society

Mutant Reaction Centers in Rb. cupsulurus The Journal of Physical Chemistry, Vol. 97, No. 50, 1993 13181
In a recent preliminary reporP we correlated the charge separation rates with the redox potentials of mutants of Rb. cupsulutus wild type at the positions L181 or M208. Only the short component obtained from fitted P* decays was used to construct a plot of In(k) versus AG. At room temperature a Marcus parabola with an apparent reorganization energy of - 100 cm-* was obtained.62 In this paper, we present new P* decay data at room and low temperatures. We have also reexamined previous stimulated emission data in the context of the models discussed below. In an attempt to give a consistent description of the recent experimental data of the nonexponential decay of P* and its correlations with the redox potentials in a series of mutants of Rb. cupsulatus (in the symmetry-related M208 and L181 positions), and motivated by some qualitative trends in our data, we have quantitatively explored the effect of inhomogeneity on the decay of P* and on the shape of the Marcus parabola. We have considered two possibilities: a sequential mechanism in which the major inhomogeneity factor is the free energy distribution between the states P*BH and P+B-H and a superexchange mechanism in which the inhomogeneity in principle influences both the P*BH and P+BH- free energy difference and the electronic matrix element. In the latter case inhomogeneity will only make a significant contribution to the exponential (Franck- Condon) part ofthe rateexpression if one or more high-frequency modes are reasonably strongly coupled to the electron transfer. In most of our analysis we focus on the first mechanism, but our most important conclusion-that the reorganization energy is very small-appears independent of the choice of mechanism (assuming a high-frequency mode in the superexchange case). We have not quantitatively explored at this stage a scenario in which both the sequential and superexchange mechanisms coexist. In addition, the possible effects of the slow dephasing and vibrational relaxation of a reversible kinetic scheme or of structural fluctuations or inhomogeneity modulating the electronic coupling have not been considered.
11. Experimental and Data Analysis Procedures
Mutant reactioncentersof Rb. cupsulatus involvingsites M208 and L181 were isolated and purified as described p r e v i ~ u s l y . ~ ~ ~ ~ ~ The genetic methods used to generate these mutants, the absorption spectra,’3 and redox properties of the mutants will be published elsewhere. Although the absorption spectra of some mutants show shifts in the Q, band region, the energy difference between the P-P* and B-B* bands remains very similar in the series of mutants.72 Those EPR spectra that have been measured (Phe L18l - Tyr; Phe L181 - Tyr, Tyr M208 - Phe; Tyr M208 - Phe; Tyr M208 - His; Tyr M208 - Thr) vary little from the wild type. A series of mutants at these two sites appear to be a suitable model system for the study of electron transfer at a fixed distance.
Time-resolved stimulated emission measurements were per- formed on a subpicosecond spectrometer, which consists of a colliding-pulse mode-locked dye laser (70-fs-fwhm pulse), a four- stage dye amplifier, continuum generation, and amplification operating at 20 Hz. The system has been described in detail earlier.52 In this work the amplifier pump source was upgraded from a multimode 2-rod GCR-4-Nd:YAG laser to a three-rod DCR-5 Nd:YAG laser which was injection-seeded by a diode- laser-pumped, monolithic, unidirectional single-mode Nd:YAG ring laser. The amplifier pump laser thus operates with a single mode and is very stable ( k l % pulse to pulse energy). The polarization of pump and probe pulses was set at the magic angle (0 = 54.79 for the measurements of P* stimulated emission decay. The instrument response function was determined to be 300 fs (fwhm) by monitoring the bleaching of the dye IR143. The excitation wavelength is centered at 860 nm with a 10-nm bandwidth; thepulseenergyis 5 pJ. Theabsorbanceofthesample at 860 nm was 0.6-0.8 in a 2-mm optical path length at room
temperature. QA was in its normal (oxidized) ~ t a t e .7~ About 15% of the sample in the focal volume was excited. At room temperature, the sample was stirred by a platinum wire driven by an electric toothbrush. The probe wavelength is selected to be close to an isosbestic point and to give a strong signal, At low temperatures, the sample was moved around by both the vibration of the Cryostat sample holder and by peridoic manual translation. The temperature is controlled by a Cryostat (Displex-DE-202s). The decay of P* was measured for a double histidine mutant (Phe L181 - His, Tyr M208 - His) of Rb. cupsulatus at 291 and 27 K. Reduction potential measurements suggest that the double histidine mutant has the smallest reduction potential of any that we have so far studied. The decay curves and the multiexponential fits for four mutants (Phe L181 - Glu; Phe L181 - Lys; Phe L181 - Thr, Tyr M208 - Thr) at low temperature are also reported.
For multiexponential decay analysis, we used the Minuit nonlinear fitting programa75 The base line in the signals was treated as a very long lifetime component (in the nanosecond range). With our current signal-to-noise ratio, the nonexponential decays of Rb. cupsulatus mutants are adequately described by two-exponential decays functions with amplitudes a1 and a2 and lifetimes 71 and 7 2 . The average lifetime ( 7 ) ~ was calculated from
where subscript E denotes the biexponential fitting result. In the following analysis we will assume that the yield of electron
transfer is close to unity in all the mutants. We have examined the ground-state bleaching (e.g., at 860 nm) and recovery in most of the systems studied. Even for the system with the longest lifetime (Thr-Thr) at room temperature, the amplitudeof ground- state recovery on the excited-state lifetime time scale is 115%. Only a small error is therefore occasioned by equating the excited- state decay entirely with electron transfer.
111. Results
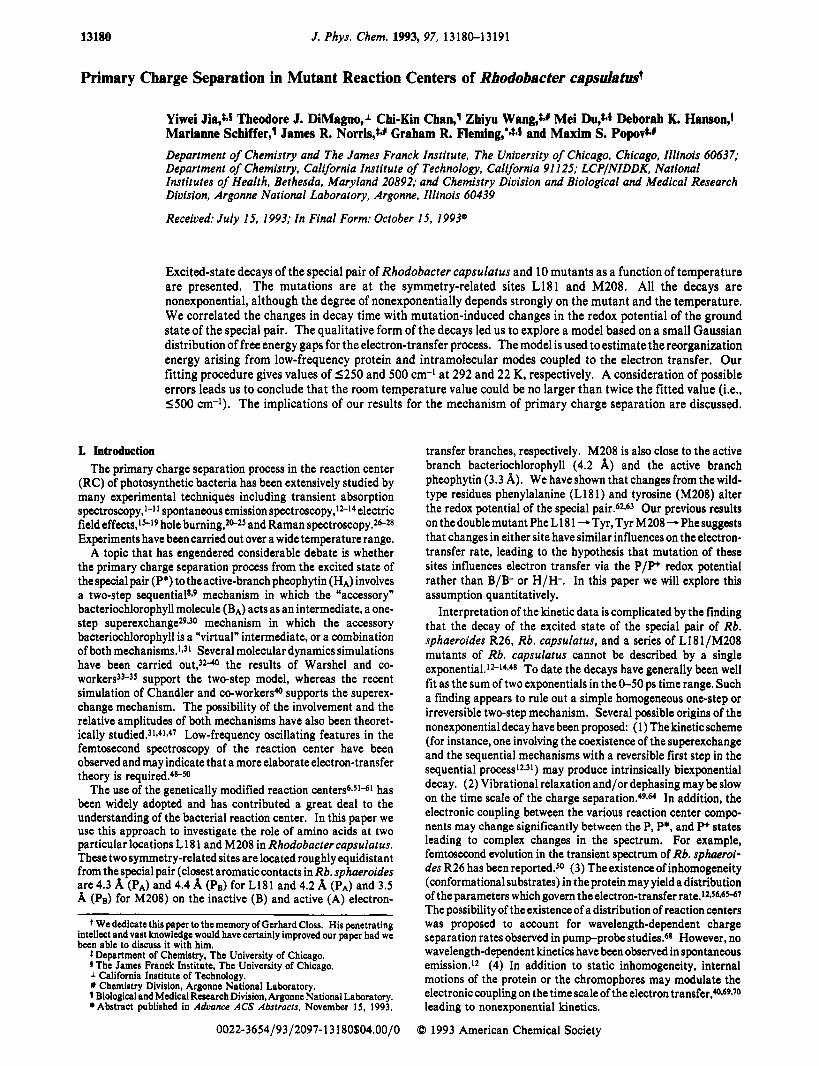
Figures 1 and 2 show respectively high- and low-temperature stimulated emission decay curves for P* for a set of Rb. cupsulatus L18 1 /M208 mutants. Fits tosingle- or double-exponentialdecays are also shown in the two figures. The decay curves are shown in the order of the redox potential of P as measured in the dark. The His-His mutant has the smallest redox potential while the Thr-Thr mutant has the largest redox potential. In order to compare these decay curves on the same time scale, some of the decay curves have been truncated. The double- or single- exponential fitting parameters are listed in Table I. Although there is some variation in the long lifetime components and their amplitudes obtained from pumpprobe experiments and those obtained from the spontaneous emission experiments, the short lifetime components and the trends of variation are the same for both experimental methods. Figure 3 shows data for the Thr- Thr mutant at 285 and 22 K on an expanded scale.
Room Temperature. There is one important systematic trend in the room-temperature (285-296 K) P* decay curves (Figure 1 .) From the Rb. cupsulutus wild type (Phe-Tyr) to the Thr- Thr mutant, P* decay curves show increasing amplitude of long component. However, a short component is present in all cases. This trend with increasing reduction potential is clear in the double-exponential fits: The decay curves become more non- exponential; i.e., the amplitude of the long component increases dramatically. The Thr-Thr mutant has the largest reduction potential and has 48% of a long component in the P* decay. The lifetime of the short components increases less strongly ranging from 2.8 to -8 ps (Table I). From Rb. cupsulatus wild type to the His-His mutant (in order of decreasing reduction potential), the lifetimes of the short components increase with the exception of two mutants, Tyr-Pheand Tyr-Tyr. The possibility of a double-

13182 The Journal of Physical Chemistry, Vol. 97, No. 50, 1993 !KT gK; 0 10 0 10 0 10 Bh;
B 0 10 0 10 0 10 Ik;
B 0 10 0 10 0 20
A
Jia et al,
B b* 0 20
F i p e 1. Stimulated emission decay data and their double-
4E, 0 20
or single-exponential fits for wild type and mutants of Rb. cupsulutus at room temperature
picoseconds.
exponential fit to the His-His mutant cannot be ruled out with the current signal-to-noise ratio. In this direction of reduction potential change, the long lifetime component increases to a smaller extent. Low Temperature. In the P* decay curves at low temperatures
(17-27 K, Figure 2), the nonexponentiality is enhanced. In particular, the His-His mutant shows a clear nonexponential decay which fits well to a biexponential form. The Thr-Thr mutant (Figure 3) has 75% of a long lifetime component (1 3 1 ps) while still maintaining a short component. (The fit to Thr-Thr in Table I uses data collected over 500 ps.) Fits to shorter time range data reveal the presence of a 3.6-ps component in the initial portion of the decay. The amplitude of this component is sufficiently small that it has little influence on the value of ( r ) ~ .
IV. Electron Transfer in Inhomogeneously Broadened Systems
In this section we present some qualitative and quantitative characteristics of electron transfer in inhomogeneously broadened systems and discuss the methods we have used to fit the data.
A number of aspects of electron-transfer kinetics in an inhomogeneous system have been discussed by Small and co- workers65 and Wang et a1.M In general, the inhomogeneous kinetics cause a nonexponential decay behavior in P*, although Small and co-workers concluded that such nonexponentiality would not be observable in Rb. sphaeroides R26 because of a large homogeneous width.65 We will discuss this point later.
To explore the possibility that the nonexponentiality arises from sample inhomogeneity, we constructed the following models based on a Gaussian distribution of the relevant parameter(s). To begin with an anslysis of our data, we consider first a sequential mechanism in which inhomogeneity influences the first step. The electron-transfer rate is calculated using standard nonadiabatic electron-transfer theory in either classical or quantum mechanical forms:
where XPB is the solvent reorganization energy associated with electron transfer from P* to bacteriochlorophyll, YPB is the electronic coupling matrix element, AG is the free energy gap for the ET process, k~ is the Boltzmann constant, Y is the intramo- lecular mode frequency, and S is the dimensionless electron- vibration coupling strength which assumed to have a value of

Mutant Reaction Centers in Rb. capsulatus The Journal of Physical Chemistry, Vol. 97, No. 50,
B lii--" 0 10 0 10 Ilh' 0 10
IC gK jlil" *K *I$.-" b; lK; lb;
4 0 10 0 10 0 10
0 10 0 10 0 50
B 0 so 0 so 0 a-
1 Flgure 2. Stimulated emission decay data and their double- or single-exponential fits for wild type and mutants of Rb. capsulatus at low
in picoseconds.
1 ,O.76 T* is the quantum correction for low temperatures,
1993 13183 .
temperature
where um is the average frequency of the medium modes77 and is chosen to be 3020 or 80 cm-la7* At high temperatures (hum << ~ B T ) , T and T* converge to the same value. (We use the terms medium modes and medium reorganization energy to include both protein modes and intramolecular modes of low (cf. ~ B T ) frequency). For the superexchange mechanism eq 3 is also used, where AG and X now refer to the P*BH-P+BH- states and the VPH is given by VPBVBH/SE, where bE is the vertical energy gap between P*BH and P+B-H.
Returning to the sequential model, we assume that the distributed parameter is the free energy gap and the distributions of both the reorganization energy and the free energy of the P+B- state can be neglected. We assume genetic mutation or M208 or L181 modifies only the free energy difference between P*B and P+B-. To generate a parabola according to eq 2, the distribution width is assumed not to change from mutant to mutant, and the relative mean free energy value of the mutants are determined by the redox potential measurements.62 We assume there are no significant changes in structure between mutants and wild types.79 This implies the electron coupling
constant changes little from mutant to mutant. If the free energy distribution can be represented by a Gaussian distribution, the decay of P* is given by
exp[ - - '''1 dAG (4) 2 2
where N ( t ) is the excited-state population at time t; u and p are respectively the standard deviation and the center value of the free energy distribution. The relation between the full width at half-maximum (fwhm) of the distribution and the standard deviation is
a = f w h m / 2 m The rate expressions given above are likely to be inadequate
a t low temperatures where the actual phonon spectrum becomes important,65J0 and we consider our approach as a crude first attempt to interpret the low-temperature data.
The decay of P* of mutant RCs can in principle be fitted directly according to the above models to obtain the reorganization energy. We have only carried out this fitting for the sequential model. The additional parameters in the superexchange model

13184 The Journal of Physical Chemistry, Vol. 97, No. 50, 1993
TABLE I: Temperature Dependence of P* Decay Time Constants’
Jia et al.
mutants R potentialsb L181-M208 excitation (nm) emission (nm) temp (K) al (%) TI (ps) a2 (%) TZ (ps) ( r ) e (ps) (mev) His-His 860 905 29 1 ._.. -~..
Phe-His
Tyr-T yr
Thr-Tyr Glu-Tyr
Tyr-Phe
Phe-Tyr
Ly s-T yr
Phc-Phe
Phe-Thr
Thr-Thr
860 860 860 860 860 860 860 85oE 860 860 860 860 860 860 860 860 85oE 860 860 860 860 860 85oE 860 860 860 860 860 85oC 860 860 860 85oE 860 860 860 860 860 860
905 920 920 920 920 920 910 940 910 910 910 910 920 920 920 920 940 920 930 920 930 915 940 925 925 910 910 905 940 910 920 920 940 920 920 930 930 910 920
27 295 200 140 77 17
296 290 140 17
294 290 140 77 22
296 290 200
77 17 17
295 290 140
17 285
22 296 290
17 17
296 290 285 200 77 17
285 22
100
100 100 100 100 100 100
100 100 100 100 100 100 100
54.4
84.4
54.4 59.5 73.5 56.1 41.3 52.0
72.3 100
100 100 100 85.0 79.6 53.3 37.9 42.0 17.9 38.0 34.3 17.3
100 100 52.0 22.5
4.41 1.14 3.90 2.95 2.74 2.7 1 2.58 2.12 2.30 1.62 1.30 3.21 2.85 2.27 1.80 1.70 3.34 3.50 2.94 2.03 1.29 1.60 2.78 2.70 1.93 1.37 3.99 2.00 9.22 5.40 2.30 2.70 5.00
5.12 2.59
10.0
25.5 26.2
41.3 8.10
45.6
15.6
45.7 40.5 26.5 43.9 58.7 45.0
27.7
15.0 20.4 46.7 62.1 58.0 82.1 62.0 65.7 82.7
48.0 77.5
10.3
10.5
15.8 24.2 13.8 9.40 5.47 7.22
11.1
12.5
40.0 13.8 34.0 34.7 70.0 34.7 27.3
124
56.3 131
5.32
3.58
9-01
5.83 5.26 3.74 4.20
5.03
11.9
3.75 32.6 21.6
21.2 29.4 47.2 24.6 23.0
9.47
31.3 111
447
466
477
476 485
497
502
509
513
518
521
a For all the pumpprobe experiments, we cannot rule out a nonexponential decay kinetics at our current precision. We estimate, from the standard deviations of the fitted parameters, that the error in ( r ) ~ is &10-15%. Representative error bars for ln((s)&’ and redox potential for the Thr-Thr mutant are indicated in Figure 6a. Repeated determinations of redox potentials give a 1 5 mV error for all mutants except Thr-Tyr where the error is larger. Reference 62 gives more details on the determination of the redox potentials. Data are collected using upconversion method (see ref 12).
2000
Y 4
a
** .: ow, I , I , 1 I , 1 I I -20 0 20 40 60 00 100
Tine (ps) Figure 3. P* decay curves of Thr-Thr mutant of Rb. capsulatus: solid line, fitted curve for data at 22 K (the data are truncated for purposes of display); dashed line, fitted curve for data at 285 K. Fits to shorter time range data at 22 K reveal a 3.6-ps component in the initial portion of the decay.
would make the fitting poorly defined. The fitting program is based on the Minuit package and modified to fit an arbitrary function which is convoluted with an instrument function. While there are three intrinsic parameters for a double-exponential fit,
four parameters have to be used to fit a Marcus-type rate distribution function. In addition to the limitations imposed by the signal-to-noise ratio, correlations between the parameters in the model function are also important. For example, the width of the distribution is strongly correlated with the mean value of AG. The direct fitting procedure was used on the wild type and two mutants, Thr-Thr and His-His. In the case of the double histidine mutant, it was necessary to correct the room-temperature P* decay data for the excited-state absorption contribution.
For a given distribution function g(AG), the average rate of electron transfer (k) can be unambiguously defined as
(k) = Jmg(AG) -OD k(AG) dAG
However, with experimental data of limited precision and dynamic range, the extraction of a parameter proportion to (k) is not straightforward. The current level of precision allows fitting to double-exponential functionsl*J4.48.62 or stretched exponential decays.56 Most earlier stimulated emission measurements re- vealed only a single decay constant. The question naturally arises as to the relationship between the parameters extracted from these, presumably approximate fits to the “true” decay of P* and the actual system parameters. For example, if only the faster portion of the decay is accessible and is fitted by a single exponential, how does the fitted lifetime depend on the free energy change and the reorganization energy? If a double-exponential

Mutant Reaction Centers in Rb. capsulatus The Journal of Physical Chemistry, Vol. 97, No. 50, 1993 13185
0
fit is used, what is the appropriate quantity to plot for a study of free energy dependence? What is the influence of the insensitivity of the experimental data to the tail of the decay function which may contain very slowly decaying components? The fits to most of experimental data on reaction centers extend only over 20-50 ps. To assess the error that this occasions and to provide partial answers to the questions listed above, we fit a series of simulated decay curves with a range of mean free energy values ( f i ) over this same time range. The simulations used eq 3. When the width of the distribution is fairly small, fits out to 50 ps with double-exponential functions are indistinguishable from the true decay curve. In this case, the average lifetime obtained via eq 1 from fits to the decay curves can be used to obtain the true reorganization energy with reasonable accuracy. For example, for u = 128 cm-l (fwhm = 300 cm-l) and X = 200 cm-1 at 298 K, the analysis of In( ( T ) @ versus AG yields an apparent X of 168 cm-l (Figure 1). By contrast, if only the short component is used to construct the Marcus parabola, an apparent reorganization energy of 285 cm-l is obtained. If no appreciable error is made in extending the integration in eq 6 below to infinity, an analytical expression can be obtained for the average lifetime ( T ) or its inverse (k) (which is distinct from (k) defined in eq 5 ) . In particular, if the average lifetime is defined by
\> 1 '. LL7-7 - - - - . . . . . . . . . . . . . . . . . . . . . . . .
( 7 ) = JomN(t) dt
and the distribution width is smaller than the thermal energy fluctuation (a < ( 2 X k ~ p ) l / ~ ) , the inhomogeneous kinetics can be characterized by an average lifetime from eq 6:66
exp[- ('+ ] (7) 4Xk,TS - 2a2
In above formula, the steepness of the parabola for an inhomogeneous system will be determined by an "apparent" reorganization energy, A' = X - a2/ 2 k ~ P when the ( T ) is used to obtain the "rate". In the example give above, the corrected reorganization energy (equating ( 7 ) and ( T ) E ) is 207 cm-I as compared to the input value of 200 cm-1. Analogous results are obtained when X = 500 cm-1 is used as the input reorganization energy. Thus, reasonable estimates of the true reorganization energy can be extracted when the distribution width is small.
If the distribution width is large ( u 1 ( 2 X k ~ p ) ~ / * ) , only the longtime behavior can be solved analytically and has the form of an error function.81 We will not consider this parameter range further here.
Returning to the simulations in Figure 4, the natural log of the inverse of the lifetimes of the short component and of the average lifetime is plotted against the mean free energy change (p). For comparison, the electron-transfer rate from the Marcus expression (eq 2) without any distribution is also shown in the plot. The average lifetime curve and the short component curve are close to each other at the top of the Marcus parabola. Thus, the P* decays at the top of the parabola should be nearly single exponential. In other words, the simulated decays for mutants with p values corresponding to the wings of the parabola should have a larger percentage of slow component than those located at the top of the parabola (Figure 4). At room temperature, the average lifetime and homogeneous curves have very similar curvature, confirming the result from fitting that the apparent reorganization energy obtained from average lifetime is close to the true reorganization energy. We can use this approach to estimate the reorganization energy at room temperature. The most important conclusion from Figure 4 is that within this model the true reorganization energy (200 cm-I) is smaller than the apparent reorganization energy (285 cm-l) extracted from the
-1 1
-1 .4
Y E -
- 1 . e
I I I -600 -400 -200 0 200
P (em-1) Figure 4. Numerical simulation of the electron-transfer rate with inhomogeneous broadening (eq 4). The abscissa is the mean free energy difference, p. The rate is calculated according to eq 3 with a high- frequency mode of 1500 cm-' and a low-frequency mode of 80 cm-l. The input parameters are V = 22 cm-I, X = 200 cm-I, and T = 298 K. The dots represent the rate associated with the short component with u = 128 cm-l, the stars represent the electron-transfer rate without a distribution, and the crosses represent the rate calculated from the inverse of the average lifetime (( 7)E-I) with u = 128 cm-l. Solid lines are fitted curves using eq 2 with apparent reorganization energies of 285, 203, and 168 cm-I, respectively. The corrected reorganization energy from the ln((T)E)-I plot is 207 cm-L according to eq 7.

13186 The Journal of Physical Chemistry, Vol. 97, No. 50, 1993
3 -
4 -
Jia et al.
value for both homogeneous and inhomogeneous caes. (A width of 300 cm-l wasassumed.) In other words, nonexponentialdecay kinetics can result even when the distribution width is small and the energy gap large, as long as a “matched” high-frequency mode is included. Consideration of the full expression including the dependence of the electronic coupling on the distribution requires consideration of the correlation between the P*B and P*H distributions.** Because of this complexity, we have not pursued the “full expression” model for quantitative analysis of the data.
V. Analysis of the Decay Curves
Room Temperature. The qualitative behavior of the charge separation rate in the mutants presented in section I11 is very similar to the simple Marcus-type inhomogeneous models we discussed above. Thus encouraged, we correlated the room- temperature average electron-transfer rate (kaw = 1 / ( 7 ) ~ ) with the free energy differences of the mutants (Figure 6a). In order to construct the plot, free energy differences are taken from the redox potentials in Table I. However, the values are relative to the hydrogen electrode, and the value of AG = 0 is determined in the fitting procedure via the assumption that the peak of the parabola corresponds to AG + X = 0. Once X is independently determined from the curvature of the parabola, the AG values of all the mutants can be calculated from the reference zero point. The considerations in the previous section on the actual value of X extracted from such a procedure lead to an uncertainty in the position of AG = 0 of about &lo0 cm-l. A more detailed description of this procedure is given in ref 62. Since the long lifetime components are important, we characterize a given mutant using either the spontaneous emission data or the stimulated emission data depending upon which has the better signal-to- noise ratio. Using only the stimulated emission data gives very similar results. The apparent reorganization energy estimated from the average rate is 110 cm-I. To calculate the true reorganization energy according eq 4 requires the knowledge of the Gaussian distributions width for the process of P*B - P+B- (P*BH - P+BH-). Taking the inhomogeneous width of the P-P* transition as an estimate, u = 120 the estimated actual reorganization energy is about 145 cm-I. The estimated reorganization energy is fairly sensitive to amplitude and decay time of the long component. Because of limitations in signal- to-noise ratio and in the determination of the base line, the long component is less well determined than the short component. To check whether the estimated reorganization energy is reasonable, we also constructed a plot of the electron-transfer rate associated with the short component versus the free energy difference of the mutants (Figure 6b). The estimated upper limit of the reorga- nization energy, which does not require a knowledge of the inhomogeneous width, is 170 cm-I. The two estimates agree with experimental error. Thus, in the context of this inhomogeneous two-step Marcus model, the reorganization energy ( X P B ) associated with the charge separation in the reaction center Rb. capsulatus wild type and its mutants is less than 200 cm-I.
The other interesting feature is that the Rb. capsulatus wild type in Figures 1 and 2 is located close to the peak of the parabola. Fleming, Martin, and Breton have shown that the electron-transfer process in the RC’s of Rb. sphaeroides and Rps. uirdis is activationless over a wide temperature range.5 If we consider a pure sequential model, we are led to an inconsistency. The maximum in the In k versus AG curve requires that 6 E p ~ (=AG + A) must be zero at this point. However, this implies that the superexchange mechanism will be resonantly enhanced near the peak of the parabola and is likely to make a significant contribution. Thus, our data imply either a pure superexchange mechanism or the coexistence of both sequential and superex- change processes. We are unable to quantify these comments but note that Wang et al.45 have estimated the relative amplitude
AvernEc Lifetime, 2923
‘ a
-- . 4 0 0 -300 .I@@ 1.. 3W
AQ, em1
Short Component, 292K
‘ Ib
4 0 0 .I00 . I H IO. I..
AQ, Cm.1
Figure 6. (a) Natural log of experimental electron-transfer rate (( s )~- l ) versus the free energy difference at room temperature. It is assumed that the differences in redox potential in Table I correspond to the mean energy differences. From left to right, data represent mutants (L181-M208): His-His, Phe-His, Tyr-Tyr, Thr-Tyr, Glu-Tyr, Tyr- Phe, Phe-Tyr, Lys-Tyr, Phe-Phe, Phe-Thr, and Thr-Thr. The solid line is a fit according to eq 2. Representative error bars for both coordinates are given for the Thr-Thr point. The apparent reorganization energy obtained is 110 cm-1, and the estimated truereorganization energyis 145 cm-’. (b) Natural log of experimental electron-transfer rate (inverse of the lifetime of the short component) versus the free energy difference at room temperature. It is assumed that the differences in redox potential in Table I correspond to the mean energy differences. From left to right, data represent mutants (L18 1-M208): His-His, Phe-His, Tyr-Tyr, Thr- Tyr, Glu-Tyr, Tyr-Phe, Phe-Tyr, Lys-Tyr, Phe-Phe, Phe-Thr, and Thr- Thr. The solid line is a fit according to eq 2. The apparent reorganization energy obtained is 170 cm-I.
resulting from the superexchange mechange mechanism to be less than 50% for the top of the parabola.
We have to reconsider the significance of the experimental reorganization energy in the case that both superexchange and the sequential mechanism are involved. The resonance enhance- ment of the superexchange mechanism should contribute sig- nificantly to the electron-transfer process only in the wild type and in mutants which are close to the top of the parabola. The mutants on the wings of the parabola (away from the 6E = 0 point) will have much less contribution from the superexchange mechanism. The net effect is that the experimentally obtained parabola may be steeper than the parabola resulting from the pure sequential mechanism over the whole AG range. This will lead to an underestimate of the reorganization energy if the superexchange process is ignored.
In either the pure superexchange or mixed case a single mechanism (superexchange or sequential, respectively) should

Mutant Reaction Centers in Rb. capsulatus The Journal of Physical Chemistry, Vol. 97, No. 50, 1993 13187
m. capruirtue mr Riel) -1hr (weOS1 mutmt
n ....... ........... ... ..... **....-...*... - 0 .... : ..... .*...-. ....... ... ...
1.5
13300
12300
-20 0 20 40 60 80 SO0 lima (pr)
Rb. caprulrtur Hir LiW -His (woo0 mutant p 1.5 . .-::.*. ..... .,:.. :.*+ ... e.!. ...... *:...*** . = 0 1 . -. .... *.' . *+ ....... ...... --.*..,- .. . ' * !2
7700
7300
m 7300
4 r(
a <
7100
0000
6700 , ~ '
- 10 0 10 Po lima b.1
Figure 7. Fitting results for stimulated emission decay curves using eq 3 coupled with cq 4. (a) Thr-Thr mutant and the fitted curve. V = 24.3 cm-1, h = 199 cm-1, f i = 354 cm-1, u(fwhm) = 355 cm-1, u = 1500 cm-1, S = 1 .O, um = 30 cm-I, and T = 285 K. (b) His-His mutant and the fitted curve. Y = 26.6 cm-l, h = 201 cm-l, fi = -501 cm-l, u(fwhm) = 302 cm-l, u = 1500 cm-I, S = 1.0, u, = 30 cm-l, and T = 292 K.
apply in the wings of the parabola. Therefore, we directly fit the decay curves of mutants which are located at extremes of the inverted (His-His mutant) and normal (Thr-Thr mutant) regions, to obtain the reorganization energy using eqs 3 and 4 (Figure 7a,b). Fits of the wild type of Rb. capsulatus (spontaneous emission data) are also included for comparison. The results are listed in Table 11. The fitting results are not unique given an arbitrary inhomogeneous distribution width. However, the reorganization energy Ape is less than 250 cm-1 if the distribution has a fwhm smaller than 500 cm-1. The fitting quality is as good as a double-exponential fit. Since the reorganization energy and free energy difference are small, high-frequency intramolecular (11OOO cm-I) modes between a donor and an acceptor make no contribution to the electron-transfer process. The fittng results including a 1500-cm-1 intramolecular mode are identical to results obtained from a simple Marcus type distribution function. The contributions of a low-frequency intramolecular mode (hv e k e P ) is identical to the phonon mode so that it is absorbed into the A k e P term in eq 3.*' The width of the Gaussian distribution obtained from the direct fits (assuming fwhm I 500 cm-1) is consistent with the P-P* width obtained from hole burning.65 The electronic coupling constants of the His-His and Thr-Thr mutants arevery similar. Direct fits to the wild type give a smaller
reorganization energy, again perhaps hinting at the presence of both superexchange and sequential mechanisms hear the peak of the parabola. However, it should be pointed out that our results are also consistent with a pure superexchange mechanism, implying that the state P+B-H lies at significantly higher energy than P*BH,N provided that APH is small. As noted earlier, the additional parameters in such a picture have discouraged us from a quantitative analysis. Low Temperature. In Figure 8, we show the low-temperature
ChargeseparationratesofRb. capsulatwwild typeanditsmutants as a function of free energy difference. Since the parabola in Figure 8a is not symmetric, an approach using eq 7 (assuming a Marcus type electron-transfer mechanism) is not valid at low temperatures. The asymmetry is even evident in the plot of short component versus free energy in Figure 8b). The lifetimes of the short components in the inverted region do not change very much, and as a result the whole curve is so distorted that it cannot be fitted with a Marcus parabola. A similar effect has been found in the back-electron-transfer process (Q*-P+ -+ QAP) in Rps. ~phaero ides .~~ The asymmetry suggests that intermolecular modes play an important role in the electron transfer in the inverted region. To obtain the reorganization energy from the low- temperature average lifetime parabola by using eq 3, eq 6 was integrated:
exp[ - (" - "*I dAG (8) 2u2
Assuming S = 1.0, v = 120 cm-I, and u = 120 cm-I, the low- temperature average lifetime parabola in Figure 8a yields a "true" reorganization energy of 534 cm-l when an average protein frequency of 30 cm-I 65 is used. If S is chosen to be a fitting parameter, we obtain a reorganization energy of 428 cm-1 and S = 1.6. The choice of 120 cm-1 is motivated by the work of Small and co-workers;65 however, with our current signal-to- noise ratio, the frequency of the intramolecular mode cannot be identified accurately. The turning point in Figure 8a lies close to the wild type reduction potential. This is an important indication that the activation energy for wild type is close to zero. The reorganization energy is significantly larger than that obtained at room temperature and may indicate that the superexchange mechanism plays a larger role at low temperatures. Individual fitting results for mutants at the ends of the parabola are consistent with the increase in estimated reorganization energy over the room temperature value (Table 11).
VI. Discussion
Largely on the basis of the qualitative characteristics of the decay curves as a function of free energy and temperature, we have presented an analysis of our data via a simple inhomogeneous model for the free energy differences between donor and acceptor states. Before discussing the shortcomings of this model and some alternative approaches, we comment on the implications from our analysis. First, we note that, in discussing models for distributions of energies, it is important to realize that AG, A and 6E are interrelated (AG + A = 6E). Thus, a distribution in one of the above quantities requires at least one other quantity to be distributed. If we assume only two of the three quantities have a significant distribution, the three possible models are shown in Figure 9 in terms of the relative position between P* and the charge-transferred state, P+BL-HL. The model we adopted distributes both AG and 6E and has negligible distribution in A. This seems reasonable since there is no obvious link between energy levels and the reorganization energy.
At room temperature simple Marcus theory fits our data very well, and the fits to free energy dependence are insensitive to the

13188 The Journal of Physical Chemistry, Vol. 97, No. 50, 1993
TABLE Ik R d t s of Direct Fittinn of the P* h v Curve
Jia et al.
~~~~~
mean mutants electronic reorg free energy standard intramolecular
L181-M208 temp (K) coupling (cm-l) energy (cm-l) gap (cm-1) deviation (cm-1) Sa mode (cm-l) His-His 292 26.6 20 1 -50 1 129 1 .o 1500
21 25.9 414 -911 103 1 .o 120 Phc-Tyr 292 16.8 35 -50 125 1 .o 1500 Thr-Thr 285 24.3 199 3 54 151 1 .o 1500
22 25.2 510 -98.5 65.1 1 .o 120 a The symbol is defined in q 3.
Average Llfetime, 22 K
' a
5 4 I .IO@ 400 4 0 0 .IO. t
AQ, ClIl-1
Short Component, 22 K
4 4 4
4
4
rr4 I 4 0 0 .600 .(eo .loo 0
AQ, Om-*
Figure 8. Natural log of experimental electron-transfer rate versus the free energy difference at low temperature. It is assumed that the differences in redox potential in Table I correspond to the mean energy differences. From left to right, data represent mutants (L181-M208, probe wavelength): His-His, 905 nm; Phc-His, 920 nm; Tyr-Tyr, 910 nm; Glu-Tyr, 920 nm; Tyr-Phe, 930 nm; Tyr-Phe, 920 nm; Phc-Tyr, 925 nm; Lys-Tyr, 910 nm; Phc-Phe, 920 nm; Phc-Phe, 910 nm; Phc- Thr, 930 nm; and Thr-Thr, 920 nm. (a) Data from average lifetime, ( T ) E , and the solid line is a fit according to eq 3. The fitted true reorganization energy is -500 cm-l. (b) Data from short component. (Note that because the fitting procedure gives a different X at low temperature from the 298 K value, the position of AG = 0 is shifted on the plot.)
a
medium mode (cm-1)
30 30 30 30 30
b
4- 0- 0 2 4 a 0 2 b a
MfIWnIiOnlOSI COQ(dlNh MtwnUoniorr Coordlnite Figure 9. Schematic diagram of the relation of SE = AG + X and three different cases for possible distributions: (a) relation of activation energy (SE), free energy (AG), reorganization energy, and the dimensionless coordinate; (b) distribution in AG and L?LE, (c) distribution in AG and X; (d) d istribution in AE and A.
type systemsS and the remarkable rigidity of the RC proteinss suggest that AC will be only very weakly temperature dependent at most.
A possibility that must be raised is that, by focusing solely on P, the ground-state redox measurements underestimate the total free energy difference between the mutants because for example we have ignored changes in the BA/BA- and HA/HA- redox potentials. This will have theeffect of maing the Marcus parabola steeper and lead to an underestimate of the medium reorganization energy. One way to address this is to compare the influence of mutations a t site L181 (which is only close to P) with those a t M208 which is close to P, BA, and HA. To do this we correlate the redox potential changes and the lifetime changes to expressions of the form63
inclusion or absence of a high-frequency mode. In this case we
Le., it appears implicitly in the T* term. At low temperature Jortner's expression fits the data well and leads to a significant increase in the apparent reorganization energy. This latter point rests on the possibly erroneous assumptionof identical free energy differences a t low and high temperature. The very weak temperature dependence of electron transfer observed in wild
inlcude (vide supra) the 120-cm-* mode with the medium modes; El/2 = ErL181 + a(E)ErM208 + and
l / ~ ~ b s = 1 / 7 ~ 1 8 1 + a(7) /7~208 + 1 / ~ x where the E, and T are reduction potentials and lifetimes, respectively, and the subscript X denotes the contribution from the rest of the protein. The parameter a(E) is unity from a least-

Mutant Reaction Centers in Rb. capsulatus The Journal of Physical Chemistry, Vol. 97, No. 50, 1993 13189
squares fit to our data on 10 mutants, whereas U ( T ) = 1.5 suggesting that the M208 residue influences the lifetime to a larger extent than the P redox potential reflects. A set of L181 only mutants may provide a less ambiguous data base. This is not yet available, and in any case the variations possible in both lifetime and redox potential will be comparatively small. Since we do not known what the extra influence of M208 is, we cannot quantify the possible error, but it seems unlikely that X could increase by more than a factor of 2 from this effect given that data from mutations at both sites can be plotted on the same parabola with the current experimental errors. (This estimate comes from model calculations in which the mutations are assumed to influence BIB- by the same amount as they change P/P+.)
The small reorganization energy we have obtained appears to be in contradiction with the results of three molecular dynamics simulations of the RC. Creighton et al. obtain XPB = 1399 cml and Xp" = 1749 ~ m - l , ~ * Schulten et al. obtained XPH = 1490 cm-1,38 and Marchi et al. obtain XPB = 1154 cm-1 and XPH = 1264 cm-l.40 The reorganization energy for the HA-QA - H ~ Q ~ - s t e p is estimated to be about 3000 cm-I by Gunner et al.84 The discrepancy between our value and the simulations may be more apparent than real. As noted earlier, we define the reorganization energy to arise only from low-frequency modes since the shape of the Marcus parabola is insensitive to modes with frequencies much larger than ~ B T . If higher-frequency modes are contrib- uting to the reorganization energies reported in the simulations, a direct comparison of "reorganization energies" is not warranted. However, for even a medium reorganization energy of 200 cm-l to be realistic, one would have to conclude that the protein structure is highly optimized to stabilize the charge-separated state. Miller has suggested that the reorganization of the RC protein may be very small on the time scale relevant for the primary charge separation eventsa6 The NMR study of Rb. sphaeroides R26 by de Groot and co-workersE5 provides evidence that the environment of the special pair is extremely rigid. They suggest that significant displacements of the protein as a result of electron transfer are unlikely and that the major low-frequency modes coupled to the electron transfer are intramolecular in origin.85
We now turn to the connection between our analysis and studies of the P-P* transition using hole burning and Raman spec- troscopies. Small and co-workers have described the low- temperature hole burning data for Rb. sphaeroides in terms of a broad distribution of phonons with a mean value of 30 cm-I (with a displacement S = 2.2) and a progression in a mode of 1 15 cm-1 (S = 1.5).a0 They obtain an inhomogeneous width (fwhm) of 170 cm-1 at 4.2 K for the P-P* transition. No information is currently available for this width at room temperature. Resonance Raman data of Shreve et aLZ8 find only a few modes (36,94, 127,202,730, and 898 cm-1) that are strongly coupled to the P-P* transition. No high-frequency (1400-1700 cm-l) modes have significant displacements. If we consider that the modes strongly coupled to the P-P* transition are those strongly influenced by the charge-transfer character of P*,z8 then it is reasonable to use these modes in modeling the electron transfer, though, of course, high-frequency modes may couple strongly to the B - B- or H - H- transitions. For simplicity, we considered only possible contributions from a 30-cm-I mode, a 120-cm-l mode, and a high-frequency (1500 cm-I) mode. We note that the frequency modulation technique of Shreve et alaZ8 will remove contributions from low-frequency, broad phonon bands from their spectrum. However, the optical reorganization energy from low- frequency (<150 cm-') intramolecular modes is 300 cm-1,28 in line with the comments of de Groot and co-workersss discussed above. Slow protein relaxation has also been suggested recently by Woodbury et al.87 in the context of a "dynamic heterogeneity" model of the initial charge separation step.
On the basis of the analysis of the hole burning data, Small et al.65 have derived an expression to describe electron transfer
in inhomogeneous systems with Gaussian distributed energy gaps. The key point in their analysis is that the strong electron-phonon coupling leads to a large homogeneous width which significantly reduces the influence of inhomogeneity in generating nonexpo- nential kinetics. Rather, they propose that the nonexponential kinetics arise either from gross heterogeneity or from a distribution in electronic coupling parameters. In a recent study of the wavelength dependence of zero phonon hole, Lyle et alSw conclude, however, that a distribution of electronic coupling constants is unlikely to be the source of the nonexponential decay in Rb. sphaeroides R26. It is also worth noting that no evidence for nonexponentiality has been found in hole burning studies. Returning to the work of Small et a1.16s,80 the analysis presented focuses on Rb. sphaeroides R26 and Rps. viridis. In these cases the nonexponentiality is indeed small. It is expected to be small because they both lie close to or at the peak of the parabolic free energy dependence. The influence of a distribution of energy gaps becomes larger in the wings of the parabola, especially in the normal region. However, even for the Thr-Thr mutant with the parameters used by Small et ~ 1 . 1 6 ~ nonexponentiality is unlikely to be detectable. Two complications may, however, reduce the apparent contradiction between the analysis given here and that of Small et al. First, we find that the medium reorganization energy we obtain is significantly larger at low temperature than at room temperature. Thus, fitting the temperature-dependent data of Fleming et al.5 with a single reorganization energy (SO in the notation of ref 65) may be misleading. Second, the protein may contain a distribution of phonon frequencies so that individual molecules have a smaller homogeneous width than that estimated from hole burning. Additionally, the inhomogeneous width itself may be a strong function of temperature. In bacteriorhodopsin and rhodopsin, Loppnow et aLS8 report that the inhomogeneous widths decrease from 1100 and 1800 cm-l (fwhm) respectively at room temperature to470 and 7OOcm-I at 1.5 K. Measurements of the inhomogeneous width of the P-P* transition as a function of temperature would be very helpful. Finally, Lathrop and Friesner have suggested that the mechanism of the disappearance of the zero phonon hole in hole-burning studies includes coupling of the P* state to a dark charge-transfer state, rather than simple strong coupling to protein phonon.89 The consequence of this model for inhomogeneous electron transfer has not been explored.
The existence of a maximum rate, as the free energy is varied, suggests that the primary charge separation cannot be described as a pure sequential process involving a B- intermediate. If this were the case, a resonance enhancement of the superexchange mechanism would likely occur, and unless V ~ H is very small, the superexchange mechanism must be expected to contribute. Hu and Mukamel have developed a formalism to treat both processes self-con~istently.4l~~~ We are in the process of extending this description to include a realistic distribution of the bath (protein) density of states and the effects of inhomogeneity.
MI. Concluding Remarks
The excited-state decays of Rb. capsulatus and 10 mutant RC are all nonexponential. This nonexponentiality requires the use of a model to analyze the data. Although the nonexponential decays could arise from many factors, the qualitative form of the decay curves as a function of redox and temperature changes has led us to pursue a model based on a small distribution of free energy gaps. This approach enables a (model-dependent) estimate of the reorganization energy due to low-frequency medium and intramolecular modes. At room temperature we estimate a "medium" reorganization energy of 5250 cm-1. However, exactly how small the reorganization energy is depends on the error caused by our assumption that mutations influence only the PIP. redox potential. Our best estimate is that this approximation should not lead us to underestimate A by more than a factor of 2. At low temperatures, the medium reorganization energy appears to

13190 The Journal of Physical Chemistry, Vo1. 97, No. 50, 1993 Jia et al.
increase to about 500 cm-1, but our analysis must be considered very approximate in this case.
Our model does not allow us to distinguish between the sequential and superexchange models for the primary electron transfer. This is because our analysis is insensitive to the presence of high-frequency modes which do not influence the shape of the parabola. However, the finding, using essentially any measure of the electron-transfer “rate”, of a parabolic dependence on free energy implies that the superexchange mechanism will contribute at least for systems close to the top of the parabola, such as the wild type. This conclusion follows from the notion that; in a pure sequential model with the first step rate limiting, the peak of the parabola corresponds to the state P+B-H intersecting with the minimum of P*BH. This is the condition for a resonance enhancement of the superexchange mechanism.
A more detailed analysis of the temperature and free energy may allow a distinction between the two mechanisms (or their combination). However, such an analysis must await more definitive argument of the origin of the nonexponentiality and models which deal with low-frequency spectra of the protein and chromophores in a realistic way.
Acknowledgment. We especially thank Prof. G. Small for providing us with unpublished work and stimulating discussions. We also thank Prof. J. Jortner and Prof. S. Mukamel for their important suggestions and discussions. We appreciate preprints and discussions provided by Profs. D. Chandler and R. Friesner and the conversation related to electron-transfer mechanisms. This work was supported by a grant from the National Science Foundation (G.R.F.), the Department of Energy, Office of Basic Energy Sciences (J.R.N.), and Office of Health and Environ- mental Research (D.K.H. and M.S.) under Contract W-31-109- Eng-38. M.S. is also supported by U S . Public Health Service Grant GM36598. This work is a publication of the Center for Photochemistry and Photobiology at the University of Chicago.
References and Notes (1) Chan,C.-K.;DiMagno,T. J.;Chen,L.X.-Q.;Norris, J. R.; Fleming,
0. R. hoc. Narl. Acad. Sci. U.S.A. 1991,88, 11202. (2) Martin, J.-L.; Breton, J.; Hoff, A. J.; Migus, A.; Antonetti, A. Proc.
Narl. Acad. Sci. U.S.A. 1986,83, 957. (3) Breton, J.; Martin, J.-L.; Migus, A.; Antonetti, A.; Orszag, A. Proc.
Nod. Acad. Sci. U.S.A. 1986,83, 5121. (4) Breton, J.;Martin, J.-L.; Fleming,G. R.;Lambry, J.-C. Biochemistry
1988,27, 8276. (5) Fleming, G. R.; Martin, J.-L.; Breton, J. Nature (London) 1988,333,
190. (6) Woodbury, N. W.; Becker, M.; Middendorf, D.; Parson, W. W.
Biochemistry 1985, 24, 7516. (7) Kirmaier, C.; Holten, D. Biochemistry 1991, 30, 609. (8) Holzapfel, W.; Finkele, U.; Kaiser, W.; Oesterhelt, D.; Scheer, H.;
Stilz, H. U.; Zinth, W. Chem. Phys. Leu. 1989, 160, 1. (9) Holzapfel, W.; Finkele, U.; Kaiser, W.; Oesterhelt, D.; Scheer, H.;
Stilz, H. U.; Zinth, W. Proc. Narl. Acad. Sci. U.S.A. 1990, 87, 5168. (10) Lautenvasser, C.; Finkele, U.; Scheer, H.; Zinth, W. Chem. Phys.
Lerr. 1991, 183, 471. (11) Dressler, K.; Umlauf, E.; Schmidt, S.; Hamm, P.; Zinth, W.;
Buchanan, S.; Michel, H. Chem. Phys. L e r r . 1991,183,270. (12) Du, M.; Rosenthal, S. J.; Xie, X.; DiMagno, T. J.; Schmidt, M.;
Hanson, D. K.; Schiffer, M.; Norris, J. R.; Fleming, G. R. Proc. Narl. Acad. Sci. U S A . 1992, 89, 8511.
(13) Muller, M. G.; Griebenow, K.; Holzwarth, A. R. Chem. Phys. Lerr. 1992, 199, 465.
(14) Hamm, P.; Gray, K. A.; Oesterhelt, D.; Feick, R.; Scheer, H.; Zinth, W. Biochim. Biophys. Acta 1993, 1142, 99.
(1 5) Lockhart, D. J.; Kirmaier, C.; Holten, D.; Boxer, S . G. J. Phys. Chem. 1990,94,6987.
(16) Hammes, S. L.; Mazzola, L.; Boxer, S. G.; Gaul, D. F.; Schenck, C. C. Proc. Narl. Acad. Sci. U S A . 1990, 87, 5682.
(17) Franzen, S.; Lao, K.; Boxer, S . G. Chem. Phys. Lerr. 1992,197,380. (18) DiMagno, T. J.; Chan, C. K.; Hanson, D.; Schiffer, M.; Fleming, G.
R.; Nonis, J. R. In Charge and Field Effecrs in Biosystems-III; Allen, M. J., Cleary, S. F., Sowers, A. E.; Shillady, D. D., Eds.; Birkhauser: Boston, 1992; p 333.
(19) DiMagno, T. J.; Bylina, E. J.; Angerhofer, A.; Youvan, D. C.; Norris, J. R. Biochemistry 1990, 29, 899.
(20) Reddy, N. R. S.; Lyle, P. A.; Small, G. J. Phorosynrh. Res. 1992, 31, 167.
(21) Boxer, S. G.; Lockhart, D.J.; Middendorf, T. R. Chem. Phys. Lcrr. 1986, 123, 476.
(22) Boxer, S. G.; Middendorf, T. R.; Lockhart, D. J. FEES Left. 1986, 200,237.
(23) Middendorf, T. R.; Mauola, L. T.; Gaul, D. F.; Schenck, C. C.; Boxer, S . J . Phys. Chem. 1991,95, 10142.
(24) Meech, S. R.; Hoff, A. J.; Wiersma, D. A. Chem. Phys. Len. 1985, 121, 287.
(25) Meech, S. R.; Hoff, A. J.; Wiersma, D. A. Proc. Natl. Acad. Sci. U.S.A. 1986,83, 9464.
(26) Palaniappan, V.; Aldema, M. A.; Frank, H. A.; Bocian, D. F. Biochemistry 1992,31, 11050.
(27) Donoha, R.; Dyer, R. B.; Swanson, B. I.; Violette, C. A.; Frank, H. A.; Bocian, D. F. J. Am. Chem. Soc. 1990, 112,6716.
(28) Shreve, A. P.; Cherepy, N. J.; Franzen, S.; Franzen, S.; Boxer,S. G.; Mathies, R. A. Proc. Narl. Acad. Sci. U S A . 1991,88, 11207.
(29) Kirmaier, C.; Holten, D. Isr, J. Chem. 1988, 28, 79. (30) Kirmaier, C.; Holten, D. Biochemisrry 1991,30, 609. (31) Bixon, M.; Jortner, J.; Michel-Beyerle, M. E. Biochim. Biophys. Acra
1991,1056, 301. (32) Crcighton, S.; Hwang, J.-K.; Warshel, A,; Parson, W. W.; Norris,
J. Biochemistry 1988, 27,774. (33) Warshel, A,; Chu, Z.-T.; Parson, W. W. Science 1989, 246, 112. (34) Parson, W. W.;Nagarajan,V.;Gaul,D.;Schenck,C.C.;Chu,Z.-T.;
Warshel, A. In Reaction Cenrers of Phorosynrheric Bacteria; Michel-Bcyerle, M. E., Eds.; Springer: Berlin, 1991; p 239.
(35) Parson, W. W.; Chu, Z.-T.; Warshel, A. Biochem. Biophys. Acra 1990, 1017, 251.
(36) Treutlein, H.; Schulten, K.; Deisenhofer, J.; Michcl, H.; Brunger, A.; Karplus, M. In The Phorosynrheric Bacterial Reaction Center: Srrucrure andDynamics; Breton, J., Vermeglio, A,, Eds.; Plenum: London, 1988; p 139.
(37) Treutlein, H.; Schulten, K.; Nierdermeier, J.; Dcisenhofer, J.; Michcl, H.; DeVault, D. In The Phorosynrheric BacrerialReacrion Center: Srrucrure andDynamics; Breton, J., Vermeglio, A., Eds.; Plenum: London, 1988; p 369.
(38) Treutlein, H.; Schulten, K.; Brunger, A.; Karplus, M.; Deisenhofer, J.; Michel, H. Proc. Narl. Acad. Sci. U S A . 1992, 89, 75.
(39) Schulten, K.; Teach, M. Chem. Phys. 1991, 158, 421. (40) Marchi, M.; Gehlen, J. N.; Chandler, D.; Newton, M. J. Am. Chem.
SOC. 1993, 115,4178. (41) Hu, Y.; Mukamel, S. Chem. Phys. L e r r . 1989, 160, 410. (42) Hu, Y.; Mukamel, S. J. Chem. Phys. Leu. 1989,91,6973. (43) Sugawara, M.; Fujinura, Y.; Yeh, C. Y.; Lin, S. H. J. Phorochem.
(44) Tang, J.; Wang, Z.; Noms, J. R. J. Chem. Phys. 1993,99,979. (45) Wang, Z.; et al. Unpublished results. (46) Joseph, J. S.; Bruno, W.; Bialek, W. J. Phys. Chem. 1991,95,6242. (47) Josphef, J. S.; Bialek, W. J . Phys. Chem. 1993,97, 3245. (48) Vos, M. H.; Lambry, J.-C.; Robles, S. J.; Youvan, D. C.; Breton, J.;
Martin, J.-L. Proc. Narl. Acad. Sci. U.S.A. 1991, 88, 8885; 1992,89, 613. (49) Martin, J.-L.;Vos, M. H. Annu. Reo. Biophys. Biomol.Strucr. 1992,
21, 199. (50) Vos, M. H.; Rappaport, F.; Lambry, J.-C.; Breton, J.; Martin, J.-L.
Nature 1993, 363, 320. (51) Coleman, W. J.; Youvan, D. C. Annu. Reo. Biophys. Biophys. Chem.
1990,19, 333. (52) Chan, C. K.; Chen, L. X. Q.; DiMagno, T. J.; Hanson, D. K.; Nance,
S. L.; Schiffer, J. R.; Norris, J. R.; Fleming, G. R. Chem. Phys. Leu. 1991, 176. 366.
Phorobiol. A 1990, 54, 321.
(53) Finkele, U.; Lautenvasser, C.; Zinth, W.; Gray, K.; Oesterhelt, D.
(54) Kirmaier,C.;Gaul,D.;DeBey,R.;Holten,D.;Schenck,C. C.Science Biochemistry 1990,29, 8517.
1991, 251, 922. (55) Bylina, E. J.; Kirmaier, C.; McDowell, L.; Holten. D.: Youvan. D.
C. Nature 1988, 336, 182. (56) Nagarajan, V.; Parson, W. W.; Gaul, D.; Schenck, C. Proc. Natl.
Acad. Sci. U.S.A. 1990, 87, 7888. (57) Robles, S. J.; Breton, J.; Youvan, D. C. Science 1990, 248, 1402. (58) Stocker, J. W.; Taguchi, A. K. W.; Murchison, H. A,; Woodbury,
N. W.; Boxer, S. G. Biochemistry 1992, 31, 10356. (59) Williams, J. C.; Alden, R. G.; Murchison, H. A,; Peloquin, J. M.;
Woodbury, N. W.; Allen, J. P. Biochemistry 1992, 31, 11029. (60) Taguchi, A. K. W.; Stocker, J. W.; Alden, R. G.; Causgrove, T. P.;
Peloquin, J. M.; Boxer, S. G.; Woodbury, N. W. Biochemistry 1992, 31, 10345.
(61) Murchison, H. A.; Alden, R. G.; Peloquin, J. M.; Taguchi, A. K. W.; Woodbury, N. W.; Williams, J. C. Biochemistry, in press.
(62) DiMagno, T. J.; Rosenthal, S. J.; Xie, X.; Du, M.; Chan, C.-K.; Hanson, D. K.; Schiffer, M.;Norris, J. R.; Fleming, G. R. In The Phorosynrhetic Bacterial Reaction Center II: Srrucrure, Spectroscopy, andDynamics; Breton, J . , Vermeglio, A., Eds.; Plenum: London, 1992; NATO AS1 Series p 341.
(63) Wang, Z.; DiMagno, T. J.; Chan, C.-K.; Popov, M.;Tang, J.; Hanson, D.; Schiffer, M.; Fleming, G.; Norris, J. R. In Photochemical and Phoro- electrochemical Conversion andStorageof Solar Energy; Zhao, W., Cao, Y., Eds.; Eds.; International Academic Press Publishers: Beijing, 1993; p 1.
(64) Skourtis, S. S.; Dasilva, A,, Jr.; Bialek, W.; Onuchic, J. N. J. Phys. Chem. 1992, 96, 8034.
(65) Small, G. J.; Hayes, J. M.; Silbey, R. J. J . Phys. Chem. 1992, 96, 7499.
(66) Wang, 2.; Pearlstein, R. M.; Jai, Y.; Fleming, G. R.; Norris, J. R. Chem. Phys. 1993, 176,421.

Mutant Reaction Centers in Rb. capsulatus The Journal of Physical Chemistry, Vol. 97, No. 50, 1993 13191
(67) Bixon, M.; Jortner, J.; Michel-Beyerle, M. E. In The Photosynthetic Bacteria Reaction Center Ii Structure, Spectroscopy, andDynamics; Breton, J., VermCglio, A., Eds.; Plenum: New York, 1992; p 291.
(68) Holten, D.; Kirmaier, C. Proc. Narl. Acad. Sci. U S A . 1990, 87, 3552.
(69) Chandler, D. Private communication. (70) Tang, J. J. Chem. Phys. 1993, 98,*6263. (71) Wraight, C. A. Biochem. Eiophys. Acta 1979,548, 309. (72) DiMagno, T. J. Ph.D. Thesis, The University of Chicago, 1991. (73) DiMagno, T. J.; Noms, J. R.; Nance, S. L.; Pasooe, F. H.; Schiffer,
M.; Hanson, D. K. Manuscript in preparation. (74) In thespontaneous emission studica reported inTable I QA Was reduced.
We do not find any influence of the oxidation state (or presence or abscnce79) of QA on the initial electron-transfer kinetics.
(75) The MINUIT nonlinear least-squares minimization subroutine package is available from the C.E.R.N. program library, Division DD, C.E.R.N., CH-1211, Geneve 23, Switzerland.
(76) Bixon, M.; Jortner, J. J. Phys. Chem. 1991, 95, 1941. (77) Marcus, R. A.; Sutin, N. Biochim. Eiophys. Acta 1985, 811, 265. (78) Bixon, M.; Jortner, J. Chem. Phys. Lett. 1989, 159, 17.
(79) Mattioli, T. A.; Gray, K. A,; Lutz, M.; Oesterhelt, D.; Robert, B.
(80) Lyle, P. A,; Kolaczkowski, S. V.; Small, G. J. J. Phys. Chcm. 1993,
(81) Pearlstein, R. M. Private communication. (82) Sevian, H. M.; Skinner, J. L. Theor. Chlm. Acta 1992, 82, 29. (83) Jortner, J. J. Chem. Phys. 1976,64,4860. (84) Gunner, M. R.; Robertson, D. E.; Dutton, P. L. J. Phys. Chem. 1986,
(85) Fischer, M. R.; de Groot, H. J. M.; Raap, J.; Winkel, C.; Hoff, A. J.; Lugtenburg, J. Biochemistry 1992, 31, 11038.
(86) Miller, J. R. In Antennas and Reaction Centers ofPhorosynrhetic Bacteria; Michel-Beyerle, M. E., Ed.; Springer: Berlin, 1985; p 234.
(87) Woodbury, N. W.; Alden, R. G.; Lin, X.; Lin, S.; Peloquin, J. M.; Taguchi, A. K. W.; Williams, J. C.; Allen, J. P. Biochemistry, in press.
(88) Loppnow, G. R.; Mathies, R. A,; Middendorf, T. R.; Gottfried, D. S.; Boxer, S . G. J. Phys. Chem. 1992, 96, 737.
(89) Lathrop, E. J. P.; Friesner, R. A. In The Photosynthetic Bacteria Reaction Center Ir; Structure, Spectroscopy, and Dynamics; Breton, J., Vermkglio, A.; Eds.; Plenum: New York, 1992, p 183.
Biochemistry 1991,30, 1715.
97, 6924.
90,3783-3795.