ying wang wen'an zhou ping zhang qoe management in
TRANSCRIPT

123
S P R I N G E R B R I E F S I N E L E C T R I C A L A N D CO M P U T E R E N G I N E E R I N G
Ying WangWen'an ZhouPing Zhang
QoE Management in Wireless Networks

SpringerBriefs in Electrical and ComputerEngineering

More information about this series at http://www.springer.com/series/10059

Ying Wang • Wen’an ZhouPing Zhang
QoE Managementin Wireless Networks
123

Ying WangBeijing University of Postsand Telecommunications
BeijingChina
Wen’an ZhouBeijing University of Postsand Telecommunications
BeijingChina
Ping ZhangInstitute of Network TechnologyBeijing University of Postsand Telecommunications
BeijingChina
ISSN 2191-8112 ISSN 2191-8120 (electronic)SpringerBriefs in Electrical and Computer EngineeringISBN 978-3-319-42452-1 ISBN 978-3-319-42454-5 (eBook)DOI 10.1007/978-3-319-42454-5
Library of Congress Control Number: 2016946020
© The Author(s) 2017This work is subject to copyright. All rights are reserved by the Publisher, whether the whole or partof the material is concerned, specifically the rights of translation, reprinting, reuse of illustrations,recitation, broadcasting, reproduction on microfilms or in any other physical way, and transmissionor information storage and retrieval, electronic adaptation, computer software, or by similar or dissimilarmethodology now known or hereafter developed.The use of general descriptive names, registered names, trademarks, service marks, etc. in thispublication does not imply, even in the absence of a specific statement, that such names are exempt fromthe relevant protective laws and regulations and therefore free for general use.The publisher, the authors and the editors are safe to assume that the advice and information in thisbook are believed to be true and accurate at the date of publication. Neither the publisher nor theauthors or the editors give a warranty, express or implied, with respect to the material contained herein orfor any errors or omissions that may have been made.
Printed on acid-free paper
This Springer imprint is published by Springer NatureThe registered company is Springer International Publishing AG Switzerland

Preface
With the rapid development of technology, there has been a proliferation of newservices and applications. The diversity choices of users bring fierce competition aswell as huge pressure to service providers. In the meantime, the level of fulfilmentof customer demands and user expectations has been the most important indicationto distinguish between different providers. Based on this background, the concept ofquality of experience (QoE) receives much attention. Moreover, taking advantageof users and services’ diversities to smartly design the resource allocation strategy isstill one of the most important issues for future wireless networks.
In the past years, we have witnessed rapid progress in the advance of QoE andQoE modeling. However, there still exist some problems. For instance, most lit-eratures on the QoE modelling only focus on the influence of technical parametersand ignore that QoE is multi-dimensional, while the researches emphasizing onvarious influencing factors do not explain how to model the QoE. Furthermore, howto carry out the QoE management and how to design QoE oriented radio resourcemanagement process are still open and challenging tasks. Therefore, this bookcarries out the study on data-driven QoE management scheme in wireless networksfor mobile services.
In Chap. 1, we first give a brief introduction to QoE in wireless communicationindustry and the necessity to consider user QoE in current mobile service provi-sioning and transmission. Moreover, personalized QoE management, taking usersubjective factors into account, is an emergent topic for refined and better resourceutilization. In Chap. 2, QoE definitions are introduced according to differentorganizations or researchers besides which the state-of-the-art QoE is summarized,including QoE influencing factors, QoE assessment methods, QoE models, QoEmanagement and control applications, and QoE challenges in 5G. To realize per-sonalized QoE management, a data-driven QoE management architecture is pro-posed in Chap. 3. In Chap. 4, QoE-based resource allocation scheme is studiedtargeting at QoE maximization. Both conventional non-personalized QoE resourceallocation scheme and personalized QoE scheme are presented and a comparison isconducted on simulation results for the two schemes. In Chap. 5, we illustrate how
v

the data-driven QoE assessment is conducted and some experimental details aregiven. Finally, the concluding remarks are presented in Chap. 6.
The authors would like to thank Peilong Li, Jiajun Liu, Sachula Meng, QipingPi, Haiqing Tao, Huan Yu, Yaning Fan, Mengyu Gao, Wenji Zhang, Lijun Song,Yanjun Hou of Beijng University of Posts and Telecommunications, for theircontributions in the presented research works.
Beijing, China Ying Wang2016 Wen’an Zhou
Ping Zhang
vi Preface

Acknowledgement
This work is supported by National Nature Science Foundation of China (61372113,61421061).
vii

Contents
1 Introduction . . . . . . . . . . . . . . . . . . . . . . . . . . . . . . . . . . . . . . . . . . . . . . 11.1 Mobile Technology Evolution . . . . . . . . . . . . . . . . . . . . . . . . . . . . 11.2 Motivation for Personalized QoE Management. . . . . . . . . . . . . . . . 2References. . . . . . . . . . . . . . . . . . . . . . . . . . . . . . . . . . . . . . . . . . . . . . . . 4
2 Background and Literature Survey . . . . . . . . . . . . . . . . . . . . . . . . . . . 72.1 QoE Definition . . . . . . . . . . . . . . . . . . . . . . . . . . . . . . . . . . . . . . . . 72.2 Influencing Factors . . . . . . . . . . . . . . . . . . . . . . . . . . . . . . . . . . . . . 82.3 Assessment Method . . . . . . . . . . . . . . . . . . . . . . . . . . . . . . . . . . . . 10
2.3.1 Subjective Assessment . . . . . . . . . . . . . . . . . . . . . . . . . . . . 112.3.2 Objective Assessment . . . . . . . . . . . . . . . . . . . . . . . . . . . . . 112.3.3 Hybrid Assessment . . . . . . . . . . . . . . . . . . . . . . . . . . . . . . . 12
2.4 QoE Models . . . . . . . . . . . . . . . . . . . . . . . . . . . . . . . . . . . . . . . . . . 122.4.1 Mathematic Model . . . . . . . . . . . . . . . . . . . . . . . . . . . . . . . 122.4.2 Machine Learning Model . . . . . . . . . . . . . . . . . . . . . . . . . . 13
2.5 QoE Management and Control . . . . . . . . . . . . . . . . . . . . . . . . . . . . 142.6 Challenges of QoE in 5G . . . . . . . . . . . . . . . . . . . . . . . . . . . . . . . . 15
2.6.1 Challenges from Various Communication Scenarios . . . . . . 162.6.2 Challenges Due to Emerging Applications . . . . . . . . . . . . . 162.6.3 Challenges Related to Big Data . . . . . . . . . . . . . . . . . . . . . 17
2.7 Summary . . . . . . . . . . . . . . . . . . . . . . . . . . . . . . . . . . . . . . . . . . . . 18References. . . . . . . . . . . . . . . . . . . . . . . . . . . . . . . . . . . . . . . . . . . . . . . . 18
3 Architecture of Data-Driven Personalized QoE Management . . . . . . 213.1 Introduction . . . . . . . . . . . . . . . . . . . . . . . . . . . . . . . . . . . . . . . . . . 213.2 Framework of Data-Driven Personalized QoE Management . . . . . . 22
3.2.1 Basic Requirements. . . . . . . . . . . . . . . . . . . . . . . . . . . . . . . 223.2.2 Training Module . . . . . . . . . . . . . . . . . . . . . . . . . . . . . . . . . 223.2.3 Control Module. . . . . . . . . . . . . . . . . . . . . . . . . . . . . . . . . . 25
3.3 Personalized Character Extraction: User-Service Preference . . . . . . 263.3.1 Bayesian Graphic Model (BGM). . . . . . . . . . . . . . . . . . . . . 263.3.2 Context Aware Matrix Factorization Model . . . . . . . . . . . . 28
ix

3.4 Personalized QoE Model and Example User Case . . . . . . . . . . . . . 303.5 Summary . . . . . . . . . . . . . . . . . . . . . . . . . . . . . . . . . . . . . . . . . . . . 32References. . . . . . . . . . . . . . . . . . . . . . . . . . . . . . . . . . . . . . . . . . . . . . . . 32
4 QoE-Oriented Resource Allocation in Wireless Networks . . . . . . . . . 334.1 Background . . . . . . . . . . . . . . . . . . . . . . . . . . . . . . . . . . . . . . . . . . 33
4.1.1 QoS-Based Radio Resource Management Strategies . . . . . . 344.1.2 QoE-Based Radio Resource Management Strategies . . . . . . 344.1.3 Energy Efficiency-Based Radio Resource Management
Strategies. . . . . . . . . . . . . . . . . . . . . . . . . . . . . . . . . . . . . . . 354.2 Traditional QoE-Based Resource Allocation Mechanism . . . . . . . . 36
4.2.1 QoE Metric Model . . . . . . . . . . . . . . . . . . . . . . . . . . . . . . . 364.2.2 System Model . . . . . . . . . . . . . . . . . . . . . . . . . . . . . . . . . . . 384.2.3 Problem Formulation. . . . . . . . . . . . . . . . . . . . . . . . . . . . . . 394.2.4 Resource Allocation Strategy . . . . . . . . . . . . . . . . . . . . . . . 394.2.5 Simulation and Analysis . . . . . . . . . . . . . . . . . . . . . . . . . . . 39
4.3 Personalized QoE-Based Resource Allocation Mechanism . . . . . . . 414.4 Summary . . . . . . . . . . . . . . . . . . . . . . . . . . . . . . . . . . . . . . . . . . . . 43References. . . . . . . . . . . . . . . . . . . . . . . . . . . . . . . . . . . . . . . . . . . . . . . . 43
5 Implementation and Demonstration of QoE MeasurementPlatform . . . . . . . . . . . . . . . . . . . . . . . . . . . . . . . . . . . . . . . . . . . . . . . . . 455.1 Introduction . . . . . . . . . . . . . . . . . . . . . . . . . . . . . . . . . . . . . . . . . . 455.2 Related Work . . . . . . . . . . . . . . . . . . . . . . . . . . . . . . . . . . . . . . . . . 45
5.2.1 Measurement Under Commercial NetworkEnvironment . . . . . . . . . . . . . . . . . . . . . . . . . . . . . . . . . . . . 45
5.2.2 Measurement Under Laboratory Network Environment. . . . 465.2.3 Measurement Under Simulation Network Environment. . . . 47
5.3 Design of Subjective Measurement. . . . . . . . . . . . . . . . . . . . . . . . . 485.3.1 QoE Related Factors . . . . . . . . . . . . . . . . . . . . . . . . . . . . . . 49
5.4 Platform Infrastructure on Streaming MediaApplication Scenario. . . . . . . . . . . . . . . . . . . . . . . . . . . . . . . . . . . . 505.4.1 Supporting System Architecture . . . . . . . . . . . . . . . . . . . . . 505.4.2 Functional Modules. . . . . . . . . . . . . . . . . . . . . . . . . . . . . . . 51
5.5 Measurement Procedure . . . . . . . . . . . . . . . . . . . . . . . . . . . . . . . . . 525.5.1 Crowdsourcing . . . . . . . . . . . . . . . . . . . . . . . . . . . . . . . . . . 525.5.2 Measurement Description . . . . . . . . . . . . . . . . . . . . . . . . . . 535.5.3 Measurement Result . . . . . . . . . . . . . . . . . . . . . . . . . . . . . . 53
5.6 Summary . . . . . . . . . . . . . . . . . . . . . . . . . . . . . . . . . . . . . . . . . . . . 56References. . . . . . . . . . . . . . . . . . . . . . . . . . . . . . . . . . . . . . . . . . . . . . . . 56
6 Conclusion . . . . . . . . . . . . . . . . . . . . . . . . . . . . . . . . . . . . . . . . . . . . . . . 596.1 Conclusion Remarks . . . . . . . . . . . . . . . . . . . . . . . . . . . . . . . . . . . . 596.2 Future Work . . . . . . . . . . . . . . . . . . . . . . . . . . . . . . . . . . . . . . . . . . 60
x Contents

Acronyms
ARP Assignment Reservation PriorityCDMA Code Division Multiple AccessCLO Cross Layer OptimizationCMIPC China Mobile Intellectual Property CenterC-RAN Cloud-based Radio Access NetworkD2D Device-to-DeviceETSI European Telecommunications Standards InstituteFEC Forward Error CorrectionGBR Guaranteed Bit RateGSM Global System for Mobile CommunicationsHLS Http Live StreamingITU International Telecommunication UnionLTE Long Term EvolutionLTE-A LTE-AdvancedMIMO Multiple-Input Multiple-OutputMOS Mean Opinion ScoreMPQM Moving Picture Quality MetricMR Measurement ReportMT Maximum ThroughputOFDMA Orthogonal Frequency Division Multiple AccessPEP Packet Error ProbabilityPF Proportional FairPSNR Peak Signal to Noise RatioPSQA Pseudo Subjective Quality AssessmentQMF Quality Management FrameworkQoCE Quality of Customer ExperienceQoE Quality of ExperienceQoGE Quality of Group ExperienceQoS Quality of ServiceQoUE Quality of User Experience
xi

RMSE Root Mean Squared ErrorRNN Random Neural NetworkSMS Short Messaging ServiceSVM Support Vector MachineTD-SCDMA Time Division Synchronous CDMATS Transport StreamTMF Tele Management ForumVNI Visual Network IndexVQI Voice Quality IndexVQM Video Quality MetricWAP Wireless Application ProtocolWCDMA Wideband Code Division Multiple AccessWFL Weber Fechner Law
xii Acronyms

Chapter 1Introduction
Abstract In recent years, with the advancement of wireless communicationnetworks, there is an increasing demand especially on mobile Internet services.Users’ Quality of Experience (QoE) becomes one of the main issues for futurewireless networks when designing personal and customized services to maintain andattract more users. Furthermore, the research on wireless resource management ismoving forward from enhancing objective system performance to improving users’subjective experience. A better QoE-oriented resource allocation policy is preferredandmany new challenges are brought out accordingly, including how to quantify andmeasure QoE, how to design a set of unified wireless resource management strate-gies and how to make use of a huge amount of available data to derive an optimalQoEmodel, etc. Therefore, personalized QoEmanagement, efficient estimation, andoptimal resource allocation need to be studied and implemented in future wirelessnetworks.
1.1 Mobile Technology Evolution
With the mobile terminal greatly changing our lives over the past decades, the mobilenetworks and services are playing an increasingly important role and become indis-pensable for many people. In addition to traditional voice communication service,many new data services are emerging and become popular in the mobile terminal.As the Cisco Visual Network Index (VNI) reported, the number of global mobileusers is expected to reach 5.2 billion in 2019 [1].
One reason for this phenomenon is the significant advance in the mobile networktechnology era. In the last fifty years, the tremendous development of mobile net-work technologies has beenwitnessed together with the evolution ofmobile services.The Second Generation technologies (2G), e.g., Global System for Mobile commu-nications (GSM) and Code Division Multiple Access (CDMA), have extended thevoice-only service to data access service such as Short Messaging Service (SMS)and Wireless Application Protocol (WAP) services. Afterwards, the Third Genera-tion (3G) technologies, e.g., Wideband CDMA (WCDMA) and Time Division Syn-chronous CDMA (TD-SCDMA), have improved the data access greatly and led
© The Author(s) 2017Y. Wang et al., QoE Management in Wireless Networks, SpringerBriefsin Electrical and Computer Engineering, DOI 10.1007/978-3-319-42454-5_1
1

2 1 Introduction
to the variety of mobile multimedia services. The Orthogonal Frequency DivisionMultiple Access (OFDMA) technology enables the Long Term Evolution (LTE) andLTE Advanced (LTE-A), i.e., the Forth Generation (4G), to provide an even bet-ter Quality of Service (QoS) to users with improved data rate. The standardizationprocess for the 4G technologies (LTE, LTE-Advanced) was finished in 2011, andLTE-A networks for business use have been deployed around the world today [2]. Inaddition, many projects are driven by different countries and organizations aroundthe world for the Fifth Generation (5G) mobile technologies [3, 4]. And in 2015, therelevant testing was launched by both Huawei [5] and Ericsson [6].
1.2 Motivation for Personalized QoE Management
During the development of 5G, it is a consensus that QoE is one of the major issues,considering the user acceptability. In general, QoE is based on the quality of interac-tions between users and applications, while QoS depends on the quality of interac-tions between applications and networks. The technologies based on QoE can satisfythe requirements of end users in a better manner than QoS. In the era of 2G, the mainservice of communication systems is voice service. Thus, the QoS parameters suchas Peak Signal to Noise Ratio (PSNR), delay, and coding rate, etc. are well suitedto evaluate the quality of communication systems. In 3G and 4G, however, withthe popularity of smart phones, there has been a large number of different typesof wireless data services, supported in particular by mobile Internet applications.According to the report released by International Telecommunication Union (ITU),by the end of 2014,mobile Internet traffic accounted for 12%of the total Internet traf-fic [7]. In China Mobile Intellectual Property Center (CMIPC), top ten applicationsof mobile Internet are summarized including mobile social, mobile advertise, mobilegame,mobile TV,mobile electronic reading,mobile location services,mobile search,mobile content sharing, mobile payment and mobile e-commerce [8]. In addition, alarge amount of novelmobile Internet applications are emerging and growing greatly.More complicated parameters are thereafter designed to represent video quality, suchas Video Structural Similarity (VSSIM), Video Quality Metric (VQM), and MovingPicture Quality Metric (MPQM).
However, those parameters are still not good enough for the new services, espe-cially when it comes to service context and human subjective factors. In 5G, a greatertransmission capacity requirements led to higher carrier frequency, greater bandwidthand larger peak transmission rate. Moreover, the diversities of users within variouslocations, occupations and economic classes are expected to be concerned in additionto the support of the personalized service. Themobile users tend to paymore attentionto their experiences, which leads operators and vendors to provide the products withbetter user experiences.How to improve the users’QoEof course becomes a key issuewhen designing customized services. The recent convergence of the mobile Internethas accelerated the demand by changing research direction from original enhanc-ing the system in objective performance to improving user subjective experience.Consequently, in the era of 5G, the more user-oriented parameters are expected to be

1.2 Motivation for Personalized QoE Management 3
identified. QoE, as a direct measurement of human perception on the communicationservice qualities, is promising and beneficial for future communication systems.
The state-of-the-art research work on QoE focuses on how to map between net-work parameters and allocate resources according to some QoE prediction criteria.Two factors are highly relevant with QoE expectations, including service types anduser characteristics. In the meantime, various approaches have been presented andevaluated including fuzzy comprehensive evaluation method, TOPSIS method [9],gray relational analysis [10], neural networks [11], Bayesian networks [12] and con-tact points [13], etc. In Tele Management Forum (TMF), an end to end CustomerExperience (CE) model based on Kilkki model [14] is proposed, and QoE is subdi-vided into three types including Quality of Customer Experience (QoCE), Quality ofUser Experience (QoUE) and Quality of Group Experience (QoGE). ITU-T StudyGroup 12 (2009–2012) proposed Quality Management Framework (QMF) in theirQ4/13 [15]. In 3rd Generation Partnership Project (3GPP), the research works onuser experience are currently focusing on QoEmetric definitions, QoE reporting for-mats and measurement protocols of QoE negotiation. In addition, since the industrialutility of QoS is pretty mature, it could be a solution to mapping QoE expectationgiven various service types to QoS parameters such as data rate, delay and packetloss rate, etc. [16] had formulated such mapping as a log linear model. The aboveresearch works are also followed by industrial companies and the correspondinginfrastructures are established.
In 2010, the Huawei company launched Voice Quality Index (VQI)—Nationalroad test program which can monitor the quality of voice, find and locate networkquality issues. Given the current network verification, VQI provides abilities to visu-ally identify the network status and the voice quality. Huawei also established acomprehensive network optimization platform named Nastar. Nastar primarily uti-lizes the measurement report (MR) and call history (CHR) statistics for networkanalysis and targeting optimization. In the ZTE company, three core user experiencemanagement propositions are abstracted including detecting, locating and profes-sional rapid troubleshooting. Although many researches and industrial works arelaunched on QoE, there are still many issues should to be further explored.
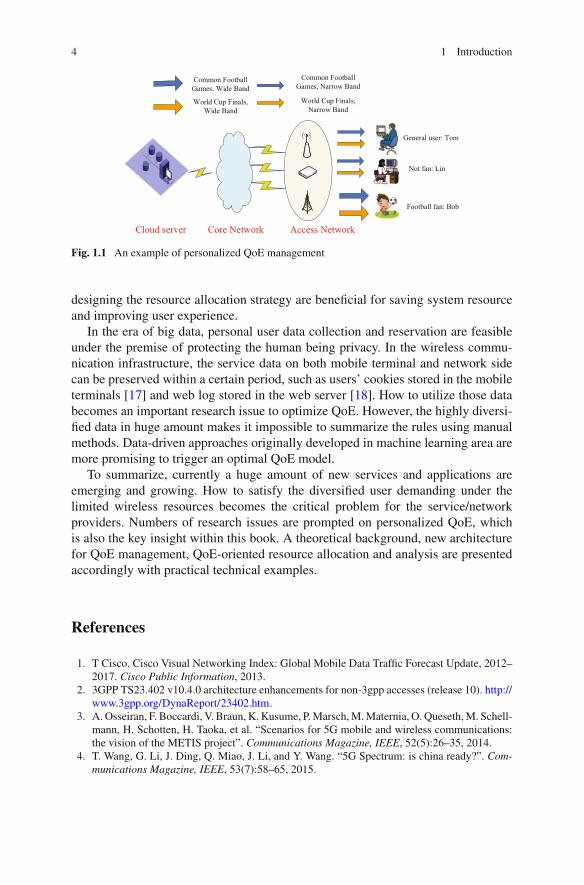
The above works mainly focus on the way to define QoE-oriented parameters.Given those QoE parameters, how to carry out the QoE management is still anopen and challenging task. Since the mobile service providers actually do not haveunlimited network resources, the high service quality is generally unaffordable byover-provisioning resources. An even allocation strategy is also not suitable due tothe diversities of various users and different services, leading to a desperate need ofa careful design of the management granularity for each pair of user and service. Inorder to clarify this issue, we use a soccer video game example illustrated in Fig. 1.1which has two types of users. One is soccer fan, the other is not. The expectationfor service quality of fan is obviously much higher than that of non-soccer fan.Under the limitation of the network resources, a good strategy is to allocate morenetwork resources to fan to obtain a better compromise between user satisfaction andlimited resources. Furthermore, an efficient or even real-time solution is essential forestimation and resource allocation. From the above example, both users and servicesare quite diversified. Therefore, taking advantage of those diversities and smartly
4 1 Introduction
Fig. 1.1 An example of personalized QoE management
designing the resource allocation strategy are beneficial for saving system resourceand improving user experience.
In the era of big data, personal user data collection and reservation are feasibleunder the premise of protecting the human being privacy. In the wireless commu-nication infrastructure, the service data on both mobile terminal and network sidecan be preserved within a certain period, such as users’ cookies stored in the mobileterminals [17] and web log stored in the web server [18]. How to utilize those databecomes an important research issue to optimize QoE. However, the highly diversi-fied data in huge amount makes it impossible to summarize the rules using manualmethods. Data-driven approaches originally developed in machine learning area aremore promising to trigger an optimal QoE model.
To summarize, currently a huge amount of new services and applications areemerging and growing. How to satisfy the diversified user demanding under thelimited wireless resources becomes the critical problem for the service/networkproviders. Numbers of research issues are prompted on personalized QoE, whichis also the key insight within this book. A theoretical background, new architecturefor QoE management, QoE-oriented resource allocation and analysis are presentedaccordingly with practical technical examples.
References
1. T Cisco. Cisco Visual Networking Index: Global Mobile Data Traffic Forecast Update, 2012–2017. Cisco Public Information, 2013.
2. 3GPP TS23.402 v10.4.0 architecture enhancements for non-3gpp accesses (release 10). http://www.3gpp.org/DynaReport/23402.htm.
3. A. Osseiran, F. Boccardi, V. Braun, K. Kusume, P.Marsch,M.Maternia, O. Queseth,M. Schell-mann, H. Schotten, H. Taoka, et al. “Scenarios for 5G mobile and wireless communications:the vision of the METIS project”. Communications Magazine, IEEE, 52(5):26–35, 2014.
4. T. Wang, G. Li, J. Ding, Q. Miao, J. Li, and Y. Wang. “5G Spectrum: is china ready?”. Com-munications Magazine, IEEE, 53(7):58–65, 2015.

References 5
5. Test for 5G in huawei. http://www.huawei.com/ilink/en/abouthuawei/newsroom/pressrelease/HW_329169.
6. Wikipedia. https://en.wikipedia.org/wiki/5G.7. ITUR Rec. Bt. 500-11, methodology for the subjective assessment of the quality of television
pictures. International Telecommunication Union.8. China mobile intellectual property center. http://www.cmipc.org.9. C. Quadros, E. Cerqueira, A. Santos, and M. Gerla. “A Multi-flow-Driven Mechanism to
Support Live Video Streaming on VANETs”. In Computer Networks and Distributed Systems(SBRC), 2014 Brazilian Symposium on, pages 468–476. IEEE, 2014.
10. O. Markaki, D. Charilas, and D. Nikitopoulos. “Enhancing Quality of Experience in Next Gen-eration Networks Through Network Selection Mechanisms”. In Personal, Indoor and MobileRadio Communications, 2007. PIMRC 2007. IEEE 18th International Symposium on, pages1–5. IEEE, 2007.
11. I. Paudel, J. Pokhrel, B.Wehbi,A.Cavalli, andB. Jouaber. “Estimation of videoQoE fromMACparameters in wireless network: A Random Neural Network approach”. In Communicationsand Information Technologies (ISCIT), 2014 14th International Symposium on, pages 51–55.IEEE, 2014.
12. K.Mitra, A. Zaslavsky, andC.Ahlund. “Context-awareQoEmodelling,measurement, and pre-diction in mobile computing systems”.Mobile Computing, IEEE Transactions on, 14(5):920–936, 2015.
13. B. Gardlo, M. Ries, M. Rupp, and R. Jarina. “A QoE evaluation methodology for HD videostreaming using social networking”. InMultimedia (ISM), 2011 IEEE International Symposiumon, pages 222–227. IEEE, 2011.
14. TM Forum. Gb962 customer experience management solution suite r15.5.0. Tele ManagementForum.
15. Itu-t sg 12 - performance, qos and qoe. http://www.itu.int/en/ITU-T/about/groups/Pages/sg12.16. P. Reichl, S. Egger, R. Schatz, and A. D’Alconzo. “The logarithmic nature of QoE and the
role of the Weber-Fechner law in QoE assessment”. In Proceedings of IEEE InternationalConference on Communications (ICC), pages 1–5. IEEE, 2010.
17. L.I. Millett, B. Friedman, and E. Felten. “Cookies and web browser design: toward realizinginformed consent online”. In Proceedings of the SIGCHI conference on Human factors incomputing systems, pages 46–52. ACM, 2001.
18. M.C. Burton and J.B. Walther. “The value of web log data in use-based design and testing”.Journal of Computer-Mediated Communication, 6(3):0–0, 2001.

Chapter 2Background and Literature Survey
Abstract In this chapter, an overview of QoE is given and the current state-of-the-art background for QoE is described. Specifically, the definitions of QoE fromdifferent aspects and QoE influencing factors are first presented. Then, QoE assess-ment methods and QoE models are introduced in the following section. In addition,QoE management and control issues are also investigated. Last but not least thechallenges of QoE in 5G wireless networks are discussed.
2.1 QoE Definition
As far as we know, there is no common sense about how to define QoE. Given thedescription of Wikipedia, QoE is considered as a subjective measure of customer’sexperiences with a service [1]. That means different types of QoE are involved invarious services. For example, when a user shops online, QoE is associated withthe process of purchasing and the service. When a user has a meal or haircut, whatinvolves QoE is the process of user being in service.
In this book, we discuss QoE in the scenes of wireless communications. Forexample, users call others using a mobile phone or browse the web using a tabletcomputer or watch online video via a notebook. In the process of being in service,users get certain service experiences. In such a scenario, a number of internationalorganizations proposed the following definitions:
According to ITU, QoE is described as the overall acceptability of an applica-tion or service, as perceived subjectively by the end user [2], while the EuropeanTelecommunications Standards Institute (ETSI) defines QoE as a measure of userperformance based on both objective and subjective psychological measures of usingan ICT service or product [3]. Recently, based on the results of the research projectCOST Action IC1003, EU Qualinet Community proposes the definitions of QoE asthe degree of delight or annoyance of the user of an application or service. In thecontext of communication services, QoE depends on the service, content, device,application, and context of use [4].
In addition, different researchers also give different definitions of QoE accordingto their own understanding. In [5], Kilkki broadens the concept of QoE to the basic
© The Author(s) 2017Y. Wang et al., QoE Management in Wireless Networks, SpringerBriefsin Electrical and Computer Engineering, DOI 10.1007/978-3-319-42454-5_2
7
8 2 Background and Literature Survey
character or nature of direct personal participation or observation. Khalil believesITU definition of QoE is hard to involve objective human factors. Therefore, he putsforward his own definition: a blueprint of all human subjective and objective qualityneeds and experiences arising from the interaction of a person with technology andbusiness entities in a particular context [6]. Pyykko presents the definition of QoEin the manner of a mobile video scenario: the binary measure to locate the thresholdof minimum acceptable quality that fulfills user quality expectations and needs for acertain application or system [7].
Although there is no universal answer forwhatQoE is, we can draw the conclusionthat: QoE is a kind of user satisfaction description during the process of interactionsbetween users and services. That is, users get some subjective feelings which isassessed by QoE.
2.2 Influencing Factors
QoE is a multidisciplinary research topic based on social psychology, cognitive sci-ence, economics, engineering science, etc. Researchers always limited QoE only insome situations which they were concerned about, making it difficult to understandQoE factors from a global perspective. It is indicated that the video codec parame-ters along with user expectations should be considered when evaluating the videoservices and that the context factors such as actual environmental context and socialcultural context also play a critical role [8, 9]. T. Hoßfeld et al. of [10] discoverthat current page loading time as well as history page loading time has impact onuser QoE for web browsing services, which can be summarized as memory effectthat current experience is highly related with history experience. A conclusion isdrawn in [11] that user’s mental mood, context, characteristics of mobile devices,network access capacity will all influence user QoE to different extents. For a betterand more comprehensive understanding of QoE influencing factors, K. Kilkki andK.U.R. Laghari consider QoE from the perspective of communication ecosystem [6].Communication ecosystem is defined as the systematic interaction of living (human)and non-living (technology, and business) in a particular context [5], which is first putforward by K. Kilkki and then refined by K.U.R. Laghari. In this ecosystem, QoEinfluencing factors can be divided into four domains: human domain, technologydomain, business domain and context domain. A summary of QoE factors studied inexisted literatures is given in Table2.1.
However, it is still a challenge to manage these QoE influencing factors. First, itis difficult to quantize some of these factors which mainly include subjective factorssuch as interests, expectations, etc. It is also hard to analyze and quantize the relation-ship of QoEwith respect to these factors. Second, some of these factors such as somecontextual factors (quiet or noisy) are intricate to be obtained in the real applicationscenarios. Thirdly, it is difficult to accurately model the relationship between thesefactors and QoE, and we should research more on how those factors influence QoEsynthetically. Hence, further study is needed to analyze QoE influencing factors.

2.2 Influencing Factors 9
Table 2.1 Summary of QoE factors
Application scenario Factors considered Details
[12] Not given Technical performance Application, service,network, deviceperformances
Usability Application, network,device usability
Subjective assessment Application, network,device assessment
User expectation Decided by applicationtypes, user personality andhistory experiences
Context Physical, social, technical,cultural context
[13] Video, VoIP, multi-playergame
Application dimension Content type, video codecresolution, frame rate
Resource dimension Network resourceparameters (delay, jitter,packet loss rate), hardwareresource parameters(memory, screen resolution)
Context dimension Light, position, time, socialenvironments
User dimension Individual property,preference, expectation,requirement and mentalmood
[4] Multi-media services Human dimension Human property, social andeconomical background,physical and psychologicalstatus
System dimension Content parameters(content type), mediaparameters (encoding,sampling rate, frame rate),network parameters(bandwidth, delay, jitter),device parameters(memory, screen resolution)
Context dimension Physical context (position,time), economical context(cost, brand image), taskcontext (single or multitask)
(continued)

10 2 Background and Literature Survey
Table 2.1 (continued)
Application scenario Factors considered Details
[6] Communication systems Technical domain Service factors (servicecontent), network factors(delay, jitter, throughput),device factors (devicefeature, function)
Business domain Consumer business modelfactors (advertisement,brand effect),inter-company businessmodel (commercialstrategy), intra-companybusiness model factors(service level agreement)
Human domain Population property (age,gender), role factor(consumer, user)
Context domain Real context (time,position, climate), virtualcontext, social context(social relationships)
[14] Mobile video Human domain Population attribute,requirements, mood,expectations, motivations
System domain Device factor (memory,battery life, screen size),network factor (networkbandwidth, channelcondition), video providerfactor (encoding algorithm,business model)
Context domain Physical context (position,time), social context (aloneor in groups), task context(single or multi task)
2.3 Assessment Method
In general, QoE evaluation methods can be divided into three categories, that is,subjective assessment, objective assessment and hybrid assessment. The detaileddescriptions are as follows.

2.3 Assessment Method 11
2.3.1 Subjective Assessment
Subjective evaluation method is conducted based on psychological/visual experi-ments, which is themost reliable but also themost complicated and expensivemethodof evaluating user’ QoE. It has been researched for many years, giving researchersdeeper understandings of QoE subjective dimension. Most of the output of the sub-jective evaluation experiment is the opinion score when the user is being served orhas been served, and these scores are ultimately averaged into Mean Opinion Score(MOS) [15]. Meanwhile, ITU also sets some corresponding standards of conduct-ing the experiment. The QoE evaluation for video services is the most complicatedand some standards are set to conduct the experiment of evaluating subjective videoquality. For example [16], the different experiment settings include Single Stimu-lus (SS), Double Stimulus Impairment Scale (DSIS), Double Stimulus ContinuousQuality Scale (DSCQS), Single Stimulus Continuous Quality Evaluation (SSCQE),Simultaneous Double Stimulus for Continuous Evaluation (SDSCE), and StimulusComparison Adjectival Categorical Judgment (SCACJ). These settings are similarand the changes mainly reflect in metrics, video reference, video length, number ofusers, number of observers, etc.
The results of subjective evaluation method are the most accurate, owing to adirect gain of data from the users. Nonetheless, the human cost of this method is toohigh and cannot be used to automation and real-time situation.
2.3.2 Objective Assessment
Objective evaluationmethod is defined as using separately themeasurement of objec-tive quality to evaluate the subjective quality [17]. In other words, objective evalua-tion method provides a mapping model from the objective quality to the subjectivequality. A variety of objective quality evaluation and prediction models have beenstudied. Each model has its applicable scenarios and corresponding constraints.
There are many objective evaluation methods to assess QoE which can be gen-erally classified into three kinds: full reference, no reference and partial reference[18].We take the video business for example to illustrate the difference of these threecategories. The full reference method is to compare reference video and test videoframe by frame while no reference method is to analyze test video only withoutreference video. Partial reference method is the compromise of the first two whichextracts some characteristics from the reference video and then analyzes the testvideo according to these characteristics.
The advantage of an objective evaluation method lies in its convenience andtractability. Researchers only need concern about QoS parameters which can bemeasured and related mathematical problems. It also has its disadvantage of inaccu-racy, i.e., the QoE obtained is only an approximation rather than a precise value foreach user.

12 2 Background and Literature Survey
2.3.3 Hybrid Assessment
Except the above two grading methods, there is another method of mixing bothand evaluating users’ QoE more accurately which is Pseudo Subjective EvaluationMethod (PSQA) [19]. This method is a kind of method which is based on statisticallearning and uses the Random Neural Network (RNN). In its evaluation, it usuallyneeds to go through four stages:
• Generating influencing factors. At this stage, a lot of service samples after para-meter optimization will be generated in the database.
• Measuring the subjective quality. At this stage, testers of the experiment will gradeservice samples of step 1.
• Training the neural networkmodel. This is the core of this approach. Data collectedby the former two steps will constitute the training data set and is used to train therandom neural network. The random neural network can be substituted by othermachine learning tools, such as the Bayesian network, the Support VectorMachine(SVM).
• Using the neural network model for evaluation. After the third step, a trained RNNwill be obtained. So in the evaluation, it is only needed to put the target servicedata into RNN. Then it can calculate the corresponding QoE of the user.
PSQA is a kind of widely used QoE evaluation methods, applied in [20–26].
2.4 QoE Models
2.4.1 Mathematic Model
Mathematical models are one of the traditional ways which map the influencingfactors to the users’ QoE. The data of related factors and users’ QoE are obtainedin a laboratory environment in general. Researchers conduct statistical analysis toformulate the specific relationship between QoE and the parameters. Some modelswhich belong to this type are depicted below.
The E-model recommended by ITU-T SG12 is a classic linear model which isused to predict the overall quality in a voice conversation at the network planningstage.AlthoughE-model is amature one, it is restricted in voice service over telecom-munication networks.
Peter Reichl argues that QoE has a logarithmic nature based on theWeber-FechnerLaw (WFL) [27]. The basic idea of WFL is that the human sensory system can betraced back to the percipience of so-called “just noticeable differences” and the differ-ential perception is directly proportional to the relative change of physical stimulus.By taking network QoS as stimulus and QoE as the perception, we will obtain a log-arithmic relationship mapping from QoS to QoE. Although the logarithmic model isvery convincing which lies in that it is based on the psychological theory, there are

2.4 QoE Models 13
limitations that the input QoS should be viewed as a physical stimulus. However, thefact is that many factors could not be regarded as physical stimulus. Furthermore,this model only processes limited numbers of factors, which indicates that it cannotbe extended.
Another mathematical QoE model is based on the “IQX hypothesis” in [28],which argues that a change of QoE depends on both the identical QoS changes andthe actual level of the QoE. After the integration of the formulation of QoE and QoS,a negative exponential function of QoE w.r.t QoS impairment factors such as packetloss can be acquired. It is found that QoE relates to the QoS impairment factors suchas packet loss or network delay in the model of IQX hypothesis, while QoE is relatedto the perceivable QoS resource like bandwidth or bit rate in the logarithmic model.
2.4.2 Machine Learning Model
In recent years, researchers find out that it is hard to formulate the relationshipbetween influencing factors and users’ QoE explicitly by a mathematic model inmost cases, not to mention the unobtainable system parameters. Machine learningmethods are widely applied to solve the problem of the connotative relationshipbetween QoE model and the influencing factors.
The Recurrent Neural Network (RNN) model is a classical one of machine learn-ing models which is applied in the Pseudo Subjective Quality Assessment (PSQA)assessment. RNN is made up of a group of neurons which can communicate witheach other by signals. In the RNN network, the state of every neuron is a nonnega-tive integer named potential and it can be changed by the signals coming from otherneurons. At the end of the training, every neuron shall have a computed potential.Accordingly, the QoE assessment will be obtained by synthesizing the potentials ofthe RNN.
In [29], T. Hoßfeld et al. uses Support Vector Machine (SVM) method to assessQoE.A hyperplane can be calculated according to training set data and validatedwithtest data set, then the trained SVM model will be applied to evaluate user currentQoE with input factors including current page loading time and user history ratings.
Besides, Decision Tree (DT), anothermachine learningmodel, can also be appliedto build QoE model. DT is a widely used classification model and the relationshipbetween QoE and researching influencing factors can be learned by decision treebuilding and pruning as in [30]. In [30], a training data set with input (continuousparameters including time, spatial, bit rate, frame rate information) and output (binaryvalues indicating whether current quality is acceptable or unacceptable for users) isutilized to train the tree model after some pre-processing measures. QoE modelestablished in this way can then be used to predict user’s attitude towards the serviceand [30] illustrates that QoE prediction by DT is more precise than that by SVM.
To sum up various QoE models, a comparison for QoE modeling approach isgiven in Table2.2.

14 2 Background and Literature Survey
Table 2.2 Comparison for QoE modeling approach
Method Type of service Factors Metric Precision Complexity
Logarithmicfunction [31]
Filedownloading
Bandwidth,file size
MOS RMSE =0.063
Low
Exponentialfunction [32]
VoIP Packet Loss MOS R = 0.998 Low
Rearrangement MOS R = 0.993
Web browing Waiting time MOS R = 0.966
Bandwidth MOS R = 0.951
SVM (SupportVectorMachine) [30]
Video(Cellphone,Tablet PC, PC)
Time, space,bit rate, framerate
Acceptability(Binary)
Precision88.592.85%89.382.77%91.452.66%
Medium
Decision tree[30]
Video(Cellphone,tablet PC, PC)
Time, space,bit rate, framerate
Acceptability(Binary)
Precision93.551.76%90.292.61%95.462.09%
Medium
Randomneutralnetwork [24]
Video Packet loss,packet losstime
MOS Unaccounted High
2.5 QoE Management and Control
Based on the QoE models and real-time QoE monitoring, intelligent QoE man-agement can be further conducted by network operators based on actual networkconditions. Appropriate measures are taken according to the network problem andoptimizationmethods. On one aspect, quality improvement of a current flow, or max-imization of system average QoE can be achieved by reasonable network controls,e.g. admission control, priority decision, congestion control and packet scheduling.Acommon usedway to optimizeQoE is to perform cross layer optimization (CLO). Forexample, in [28], a cross-layer model is established for multimedia traffic in mobilecommunication systems. QoE is obtained by mapping from the network layer para-meter symbol rate. The maximized QoE can be achieved by adjusting the symbolrate for each user with a greedy algorithm. A wise resource allocation strategy withQoE awareness can be realized to efficiently save network resources without userexperience degradation.
Similar optimization scheme for wireless video transmission is provided in [21]for stream transmission. First a video stream is divided into two sub-streams usingmultiple description coding scheme and then two paths with the highest availablebandwidth are selected by the server to send these two streams to the client. UserQoE is assessed by PSQA based on packet loss rate when two sub-streams arrive atthe client. The server will make a decision to redirect the two sub-streams over new

2.5 QoE Management and Control 15
paths with higher available bandwidth if the assessed QoE cannot meet the users’requirement.
Selecting a proper access point is another way to improve QoE. In [33], Kandarajpresents a user-based and network assisted scheme for network selection in wirelessIEEE 802.11 technology. In the scheme, a PSQA tool is implemented to evaluateusers QoE for each access points (AP). When a new user comes, he or she will geta score based on the evaluated QoE and status from each AP. So a better quality ofconnection can be chosen, resulting in a higher QoE for the user.
In some literatures, researchers considerQoEoptimization froma systemarchitec-ture level. Latre et al. in [34] proposed a QoE-based network management architec-ture in multimedia services with a three-plane approach (a monitor plane to monitornetwork parameters, a knowledge plane to determine the optimal QoE decisions andan action plane to conduct decided actions). Optimization actions include applyingForward Error Correction (FEC) to reduce the packet loss caused by errors on a linkand switching to different video bit rate to avoid congestion or to obtain a bettervideo quality.
Additionally, QoE-driven network access selection control, handover decisioncontrol and rate adaptation control are also studied in many literatures as[33, 35, 36].
2.6 Challenges of QoE in 5G
In the era of 5G, a fiber-like access data rate and a “zero” latency user experienceis expected to be provided. Delivering a consistent experience is required across avariety of scenarios including the cases of ultra-high traffic volume density, ultra-highconnection density, and ultra-high mobility. 5Gwill also be able to provide ability onintelligent optimization based on services and users awareness, and improve energyand cost efficiency by over a hundred of times. These expectations above all inspireus to achieve the vision of 5G—“Information a finger away, everything in touch.”
To realize these expectations, several new technologies, e.g., heterogeneous net-works, millimeter-wave (mm-wave), device-to-device (D2D)/machine-to-machine(M2M), cloud-based radio access network (C-RAN), and smart devices are addressedin the 5G network to cater to the notable trends of 5G, such as explosive growth ofdata traffic, massive increase in the number of interconnected devices, continuousemergence of new services and application scenarios, etc., which will inevitablyimpact user QoE, positively or negatively. New challenges are raised for QoE man-agement in 5G and better QoE performance is capable to be achieved if these issuesare well handled.

16 2 Background and Literature Survey
2.6.1 Challenges from Various Communication Scenarios
In 5G, the scenarios of communications are greatly broadened, typically, e.g., whenpeople are working or at entertainment, stationary or moving, at home or in sta-diums, subways, highways. For the various scenarios above all, a consistent QoEis desired to achieve for end users. However, QoE management is significant butchallenging in the high complicated scenario including ultra-high traffic volumedensity, ultra-high connection density, and/or ultra-high mobility, etc. For example,it is important to maintain a satisfactory level of service continuity in high speedscenario. Similarly, improving QoE is also important in the ultra-dense small cellsscenarios. Those requirements are demanding more appropriate mobility manage-ment strategies. Therefore, how to control QoE to satisfy the various requirementsin the various scenarios needs to be comprehensively investigated accordingly. AQoE-based dynamic resource allocation for mobile cloud computing environmentto satisfy the requirements of end users is proposed in [37]. In [38], a QoE-basedresource allocation problem is pointed out in a D2D scenario, where user QoE isevaluated from the both perspectives of stall events and video qualities. While keyQoE influencing factors and user expectations may vary for distinct scenarios, QoEbecomes a comprehensive metric and an important topic about how to provide per-sonalized user experience through a more refined resource management.
2.6.2 Challenges Due to Emerging Applications
The cellular technology has changed the way we communicate and our social life[39]. Over the past era of 2G, phone call and SMS are the main functions of themobile terminals. Today 3G/4G become mainstream and the smart terminals areso popular that makes the applications more diverse, such as mobile game, mobilemusic, mobile video, etc. In the future of 5G, more stunning new technologies andapplications will be integrated and enter into human life such as virtual reality, 3Dvideos etc., which accordingly leads to two challenges for QoE research.
One challenge is the demand to develop appropriate and reasonable QoE modelsfor the emerging applications. Due to the rapid increase of intelligent terminal oncapacity and performance, there are a large number of new applications emerging[40]. For example, unlike traditional terminals, the new smart wearable terminalshave various forms, such as smart watches, smart glasses, sports wristbands, smartjewelry, etc. Meanwhile, mobile services, which are based on the intelligent ter-minals, are no longer limited to telephone, text messaging and video services, butinvolved in medical monitoring, interactive games, information exchange and otheremerging businesses. However, the state-of-the-art research works on QoE focuson VoIP, video, and HTTP services. Further study is needed for the new developedapplications in order to build up a proper QoE model.

2.6 Challenges of QoE in 5G 17
Imagine a medical monitoring service running on a wearable equipment, whichmonitors blood pressure, displays status on pulse and even identifies whether the userhas an irregular heartbeat. In this case, the QoE model should utilize the individualuser’s information to make accurate decisions to achieve a high level of QoE. Forexample, for a user with hypertension according to the historical records, whensymptoms appear, the system is required to ensure realtime transmission and a certainlevel of reliability to activate the emergency alarm and other corresponding medical-related services. It is essential to combine the various factors to guarantee QoE.
The smart mobile terminals for human life provide a great convenience, so thatpeople are increasingly dependent on their smartphones. Consequently, the peopleare increasingly sensitive to the life of the battery. If a service consumes too muchpower, the users will have very bad feelings, which leads to a lower QoE degree. Asa result, the energy efficiency is also an important QoE factor in 5G.
2.6.3 Challenges Related to Big Data
In the 5G era, due to the network data traffic explosion and applications diver-sification, a huge amount of data is expected to be transfered during the mobilecommunications [41], which leads to some new challenges in the QoE managementfield.
One challenge concerning big data is the subjective QoE influencing factors. Themain research issue on this topic includes two aspects. The first is the subjective QoEfactors including a user specific preference, users’ mood, attention, expectation etc.The factors above all are qualitative and highly related with social psychology andcognitive science fields. In order to use these factors in practical applications, someproblems should be concerned including: (1) how to quantize these factors? (2) howto normalize these factors after quantization? and (3) how to capture and monitorthese factors in a practical real-time application scenario. In addition, it is difficultfor a certain application/service to decide which factors are essential and which arenot. How to smartly model QoE given a service/application is quite important issuefor further investigations.
Another challenge is about QoE evaluation from the perspective of big data. Mostexisting research on subjective QoE evaluation is conducted based on users’ directfeedback of the service. It is suitable for a relative small scale of evaluation. Whenmore data is needed which makes the results more reliable, it is too expensive andeven unaffordable by using the above evaluation ways. With the development ofbig data technologies, many user specific information is preserved and can be usedto infer the user’s subjective feelings, which is the basis of QoE. As an exampleof online video services, the viewing time, the total number of clicks on a certainvideo, the number of daily accesses etc. could be measured and analyzed for user’sQoE. For Web services, the online reviews is the knowledge resources in whichthe relevant features could be extracted reflecting user experience feedback on theweb services. Many similar research works had been carried out in the manner of

18 2 Background and Literature Survey
the data-driven way in other areas such as natural language processing (NLP) andunstructured data processing, Thus, it is meaningful to use data-driven approachesin the topic of mobile QoE in the future.
It is also challenging to handle the security and privacy related to intelligent ter-minals, which comes along with the trend that intelligent terminals play a key rolein 5G, especially in the big data era. For those who use intelligent terminals, inten-tionally or unintentionally, their personal information such as contacts, downloadhistories, application usage records, the system logs, etc., are saved in either clientend or cloud end. It is of course beneficial to make use of those data to facilitateQoE. But those data are possibly used for the wrong purpose, even illegal use. Howto balance the protection requirement of user’s privacy and the QoE managementusage on the personalized data is one of the major challenges.
2.7 Summary
In this chapter, an overview for the state-of-the-art QoE is given, including QoEinfluencing factors, QoE assessment methods, QoE models, QoE management andcontrol applications, and QoE challenges on 5G. QoE definitions are summarized atfirst. The QoE influencing factors are then discussed in a systematic way, followed bythe sequential part which QoE assessment methods are introduced and QoE modelsare summarized. QoE management and control issues are also discussed in thischapter. Furthermore, the challenges of QoE in 5G wireless networks are discussedfinally.
References
1. Quality of experience. http://www.wikepedia.org.2. ITU Telecommunication Standardization Sector and OF ITU. “Definition of quality of experi-
ence (QoE), liaison statement”. ITU-T Recommendation P.10/G.100, Amd 1, 2007.3. European Telecommunication Standards Institute TC HF (Human Factors). “Quality of Expe-
rience (QoE) requirements for real-time communication services”. Technical report, EuropeanTelecommunication Standards Institute, 2010.
4. P. Le Callet, S. Moller, and A. Perkis. “Qualinet white paper on definitions of quality ofexperience (QoE)”, 2013.
5. K. Kilkki. “Quality of Experience in Communications Ecosystem”. J. UCS, 14(5):615–624,2008.
6. K. U. R. Laghari and K. Connelly. “Toward total quality of experience: A QoE model in acommunication ecosystem”. Communications Magazine, IEEE, 50(4):58–65, 2012.
7. S. Jumisko-Pyykkö, V.K. Malamal Vadakital, and M.M. Hannuksela. “Acceptance threshold:A bidimensional research method for user-oriented quality evaluation studies”. InternationalJournal of Digital Multimedia Broadcasting, 2008.
8. H. Rifai, S. Mohammed, and A. Mellouk. “A brief synthesis of QoS-QoE methodologies”.In Programming and Systems (ISPS), 2011 10th International Symposium on, pages 32–38.IEEE, 2011.

References 19
9. S. Möller, A. Raake, M. Wältermann, and N. Côte. “Towards a universal scale for perceptualvalue”. In Quality of Multimedia Experience (QoMEX), 2010 Second International Workshopon, pages 142–146. IEEE, 2010.
10. T. Hoßfeld, S. Biedermann, R. Schatz, A. Platzer, S. Egger, and M. Fiedler. “The memoryeffect and its implications on Web QoE modeling”. In Proceedings of the 23rd InternationalTeletraffic Congress, pages 103–110. International Teletraffic Congress, 2011.
11. S. Ickin, K. Wac, M. Fiedler, L. Janowski, et al. “Factors influencing quality of experience ofcommonly used mobile applications”. Communications Magazine, IEEE, 50(4):48–56, 2012.
12. S. Barakovic, J. Barakovic, and H. Bajric. “Qoe dimensions and QoE measurement of NGNservices”. In in Proc. Telecommunications Forum, 2010.
13. L. Skorin-Kapov and M. Varela. “A multi-dimensional view of QoE: the ARCU model”. In inProc. International Convention MIPRO, pages 662–666. IEEE, 2012.
14. W. Song, D. Tjondronegoro, and M. Docherty. “Understanding user experience of mobilevideo: framework, measurement, and optimization”. INTECH Open Access Publisher, 2012.
15. ITUT Rec. “P. 800.1, mean opinion score (mos) terminology”. International Telecommunica-tion Union, Geneva, 2006.
16. I. Rec. “Bt. 500-11, methodology for the subjective assessment of the quality of televisionpictures”. International Telecommunication Union, 2002.
17. W.Cherif, A.Ksentini, D.Négru, andM. Sidibé. “A_PSQA:Efficient real-time video streamingQoE tool in a future media internet context”. In Proceedings of 2011 IEEE InternationalConference on Multimedia and Expo (ICME), pages 1–6. IEEE, 2011.
18. Fernando Kuipers, Robert Kooij, Danny De Vleeschauwer, and Kjell Brunnström. “A Tech-niques for measuring quality of experience”. Springer, 2010.
19. G. Rubino. “The PSQA project”. INRIA Rennes, http://www.irisa.fr/armor/lesmembres/Rubino/myPages/psqa.html, 2010.
20. M. Ghareeb and C. Viho. “A multiple description coding approach for overlay multipath videostreaming based on QoE evaluations”. In Proceedings of International Conference on Multi-media Information Networking and Security (MINES), pages 39–43. IEEE, 2010.
21. M. Ghareeb and C. Viho. “Hybrid qoe assessment is well-suited for multiple description codingvideo streaming in overlay networks”. In Proceedings of 2010 Eighth AnnualCommunicati onNetworks and Services Research Conference (CNSR), pages 327–333. IEEE, 2010.
22. K. Piamrat, A. Ksentini, J. Bonnin, and C. Viho. “Q-DRAM: QoE-based dynamic rate adapta-tion mechanism for multicast in wireless networks”. In Proceedings of IEEE Global Telecom-munications Conference, pages 1–6. IEEE, 2009.
23. X. Sun,K. Piamrat, andC.Viho. “QoE-based dynamic resource allocation formultimedia trafficin IEEE 802.11 wireless networks”. In Proceedings of 2011 IEEE International Conferenceon Multimedia and Expo (ICME), pages 1–6. IEEE, 2011.
24. K. Piamrat, C.Viho, J. Bonnin, andA.Ksentini. “Quality of experiencemeasurements for videostreaming over wireless networks”. In Proceedings of 2009 Sixth International Conference onInformation Technology: New Generations, pages 1184–1189. IEEE, 2009.
25. K. Piamrat,K.D. Singh,A.Ksentini, C.Viho, et al. “QoE-aware scheduling for video-streamingin high speed downlink packet access”. InProceedings of 2010 IEEEWireless Communicationsand Networking Conference (WCNC), pages 1–6. IEEE, 2010.
26. P. Reichl, B. Tuffin, and R. Schatz. “Economics of logarithmic quality-of-experience in com-munication networks”. InProceedings of 2010 9th Conference on Telecommunications Internetand Media Techno Economics (CTTE), pages 1–8. IEEE, 2010.
27. P. Reichl, S. Egger, R. Schatz, and A. D’Alconzo. “The logarithmic nature of QoE and therole of the Weber–Fechner law in QoE assessment”. In Proceedings of IEEE InternationalConference on Communications (ICC), pages 1–5. IEEE, 2010.
28. S.Khan, S.Duhovnikov,E. Steinbach, andW.Kellerer. “MOS-basedmultiusermultiapplicationcross-layer optimization for mobile multimedia communication”. Advances in Multimedia,2007(1):1–11, 2007.
29. T. Hosfeld, S. Biedermann, R. Schatz, A. Platzer, S. Egger, and M. Fiedler. “The memoryeffect and its implications on Web QoE modeling”. In Proceedings of 2011 23rd InternationalTeletraffic Congress (ITC), pages 103–110, 2011.

20 2 Background and Literature Survey
30. V. Menkovski, A. Oredope, A. Liotta, and A. C. Sánchez. “Predicting quality of experience inmultimedia streaming”. In in Proc. the 7th International Conference on Advances in MobileComputing and Multimedia, pages 52–59. ACM, 2009.
31. P. Reichl, S. Egger, R. Schatz, and A. D’Alconzo. “The logarithmic nature of QoE and the roleof the Weber–Fechner Law in QoE assessment”. In Proceedings of 2010 IEEE InternationalConference on Communications (ICC), pages 1–5. IEEE, 2010.
32. M. Fiedler, T. Hossfeld, and P. Tran-Gia. “A generic quantitative relationship between qualityof experience and quality of service”. IEEE Network, 24(2):36–41, 2010.
33. Kandaraj Piamrat, Adlen Ksentini, César Viho, and Jean-Marie Bonnin. “AqoE-aware admis-sion control for multimedia applications in ieee 802.11 wireless networks”. In Vehicular Tech-nology Conference, 2008. VTC 2008-Fall. IEEE 68th, pages 1–5. IEEE, 2008.
34. S. Latré, P. Simoens, B. De Vleeschauwer, et al. “An autonomic architecture for optimizingQoE in multimedia access networks”. Computer Networks, 53(10):1587–1602, 2009.
35. N. Amram, B. Fu, G. Kunzmann, T. Melia, D. Munaretto, S. Randriamasy, B. Sayadi, J. Wid-mer, and M. Zorzi. “QoE-based transport optimization for video delivery over next generationcellular networks”. In in Proc. IEEE Symposium on Computers and Communications (ISCC),pages 19–24. IEEE, 2011.
36. S. Thakolsri, W. Kellerer, and E. Steinbach. “QoE-based cross-layer optimization of wirelessvideo with unperceivable temporal video quality fluctuation”. In in Proc. IEEE InternationalConference on Communications (ICC), pages 1–6. IEEE, 2011.
37. W.Ying,M. Sachula, C.Yongce, S. Ruijin, XinshuiW., andKai S. “Multi-leadermulti-followerstackelberg gamebaseddynamic resource allocation formobile cloud computing environment”.Wireless Personal Communication, to appear.
38. Hao Zhu, Yang Cao, Wei Wang, Boxi Liu, and Tao Jiang. “Qoe-aware resource allocation foradaptive device-to-device video streaming”. Network, IEEE, 29(6):6–12, 2015.
39. G. Fettweis and S. Alamouti. “5G: Personal mobile internet beyond what cellular did to tele-phony”. IEEE Communications Magazine, 52(2):140–145, 2014.
40. B. Bangerter, S. Talwar, R. Arefi, and K. Stewart. “Networks and devices for the 5G era”. IEEECommunications Magazine, 52(2):90–96, 2014.
41. W. Hummer, S. Schulte, P. Hoenisch, and S. Dustdar. “Context-Aware Data Prefetching inMobile Service Environments”. In Proc. IEEE Fourth International Conference on Big Dataand Cloud Computing (BdCloud), pages 214–221, 2014.

Chapter 3Architecture of Data-Driven PersonalizedQoE Management
Abstract In this chapter, we propose a systematic architecture on data-drivenpersonalized QoE management. A framework of the QoE management architectureis firstly introduced, which consists of two modules namely (1) training module and(2) control module. We also depict two models for the prediction of user preference,including Bayesian Graphic Model and Context Aware Matrix Factorization Model.Apreliminary use case is deployed to demonstrate and evaluate the proposed architec-ture. Simulation results illustrate the superior performance of proposed architecturecompared with traditional water-filling method.
3.1 Introduction
The ultimate target of QoEmanagement, following themodeling, control and assess-ment of QoE, is to attain the control over QoE by optimization and controllingstrategy. In order to maximize the quality of experience and the degree of end-usersatisfaction, along with the expected utilization efficiency on limited resources ofcommunication system, control strategy is expected to provide optimized serviceswhile controlling QoE dynamically and continuously. From the operators’ perspec-tive, the purpose of QoE management is both maintaining users satisfaction effec-tively and allocating available wireless network resources efficiently. It is always achallenging problem to optimize and manage QoE due to the non-negligible influ-ence on QoE of many factors, including restricted network environment (limitednetwork bandwidth, network variance, etc.), increasing data flow of mobile network,randomness of device location and service situation, and diversity of users profiles,requirement, and expectation. As a consequence, a comprehensive design from dif-ferent perspectives is vital in the topic of QoE management.
Traditional QoE management and control only focused on the influence ofresource such as network and QoS, but neglected the difference among the indi-vidual users. For example, for a man who is not Kobe’ fans, a high-precisionvideo and wide bandwidth allocated on Bryant motion video may not lead to highdegree of satisfactory feelings because the user may simply not want to watch thisvideo. The classic strategy of QoE management can not figure out this problem.
© The Author(s) 2017Y. Wang et al., QoE Management in Wireless Networks, SpringerBriefsin Electrical and Computer Engineering, DOI 10.1007/978-3-319-42454-5_3
21

22 3 Architecture of Data-Driven Personalized QoE Management
With the development of mobile Internet, a huge amount of new smart devicesand many service providers are emerging and growing rapidly. Win or lose heav-ily depends on the ways on the satisfaction of the various user demands. In particularwith the advent of Web 2.0, we have entered into an unprecedented era of big datawith explosively growing information. For example, YouTube has 2 billion videocontents which grow at a speed of 60 h per minute meanwhile [1]. The big data leadsto many new problems faced by video service providers. On the one hand, usersmay get confused or even feel bored to find the interested ones from vast amounts ofvideos, which affects user experience badly [2]. Furthermore, many new competi-tors enter the same business field to provide the similar services. It is meaningfulfor service providers to perceive the user’s feeling, and provide the personalizedservice [3]. The characteristics of the personalized service includes: (1) The serviceis user-oriented. (2) The service is unique and varied along with the change of userrequirements. (3) The service is diverse and discrepant [4].
Assessing QoE is one of key issues in the topic of QoE. The greatest difficulty toassess QoE from a user perspective is how to quantitatively use the user subjectiveinformation. In addition, a data-driven architecture for personalized QoE manage-ment is proposed in this chapter.
3.2 Framework of Data-Driven PersonalizedQoE Management
3.2.1 Basic Requirements
The prerequisites of the proposed architecture are listed in the following:
• Amonitor to capture real-time information is contained. The real-time informationincludes the type of application in use and the status of QoS.
• A data mining scheme is maintained, which is capable to predict user prefer-ence/expectation with respect to the specific applications.
• Resource management is conducted according to the captured QoS status and thepredicted preference/expectation information to maintain a reasonable degree ofQoE.
Figure3.1 illustrates the two components including the training module and thecontrol module of the proposed architecture.
3.2.2 Training Module
The training module is designed to collect the subjective data, train and tune the userpreference prediction model. The inputs of the model are obtained from a specific

3.2 Framework of Data-Driven Personalized QoE Management 23
Fig. 3.1 A data-driven architecture for personalized QoE
user and a specific service, and the output is the user’s expectation with respect tothe service.
The training module is divided into three subcomponents described as follows.
(1) Subjective Data Collector (SDC)
SDC is responsible for collecting the data. The diversity of the data is the majorconcern when designing this subcomponent since the different types and dimensionsof data should be integrated in the model training process. Due to end-user orientedcharacteristic of the data, the central part of such collector is a mobile agent designedto be physically deployed in the end-user device.
Such a mobile agent is logically divided into three entities: the QoS monitoringentity, the contextualmonitoring entity and the experiencemonitoring entity.Besides,a data repository is created in the device to preserve the temporarily collected data,which is then uploaded to the cloud by synchronizing with the data processing andstorage component. The framework of the mobile agent is presented in Fig. 3.2. Thedetails of SDC are given as follows.
• The main function of the QoS monitoring entity is to measure the technical para-meters, including (1) the device information, such as the operating system and

24 3 Architecture of Data-Driven Personalized QoE Management
Fig. 3.2 Framework ofmobile agent [5]
the screen size; (2) the network information, such as the access type, throughput,delay, and jitter; and (3) the application information, such as the application type.
• The contextual monitoring entity is responsible for collecting context informationof the application, which contains the location, the mobility, and some other avail-able data from sensors on the device or around the body. This entity is extensiblefor a variety of newly developed sensors.
• The experience monitoring entity is in charge of the interaction with users bygathering explicit feedback of questionnaires, including both closed and open-ended question formats. The Experience SamplingMethod (ESM) is chosen as thecollection method in order to minimize the possible interference and the deviation.Moreover, with the further study of implicit experience measures, the experienceprobe can be extended with new modules and parameters, such as brain activity,heart activity, and eye movement.
(2) Data Processing and Storing Component (DPSC)
The data uploaded from SDC onmobile devices is preprocessed and stored in DPSC.Once the newdata is received, the damaged data is removed by an initial data cleaningprocess. Then, a process of anonymization is done for pseudonyms and reduction oflocation accuracy. And the further encryption is further proceeded for the reason ofthe user privacy. The feature extraction is also completed in this component. And theextracted features and encrypted data are preserved in a distributed database. Othercomponents in the architecture are only permitted to access the extracted features.
The user today generally has more than one mobile device and different loginaccounts for distinct applications. To build connections among these individualresources, a concept known as OpenID is established [6], in which a unique userID is allocated to a specific user uniquely as authenticated information. The user’s

3.2 Framework of Data-Driven Personalized QoE Management 25
cell phone number is linked with other user specific information such as verifiableemail address, etc.With unique user ID, DPSCmerges data uploaded from each SDCaccording to a certain rule.
(3) Data Mining Component (DMC)
DMC is responsible for mining the user preference when they use certain services.The data-driven approach is used in this component to provide more effective pre-diction ability on user preference. Given a set of data, a user preference predictionmodel is trained by an offline mode. Most of previous QoE modeling approachesfocused on how to model the mapping from network layer parameters to QoE para-meters, but the role of the user preferences is ignored. Actually a specific user couldprefer some services compared with others, which leads to the different satisfactorydegrees for different services under the the same network layer condition.
In this section, we present several data mining models with regard to user pref-erences for DMC. A set of features is used for model training which is extracted inDPSC and reserved in a distributed database. Once the process of model training isfinished, the model file is saved in a database and used by the control module foronline user-preference prediction.
3.2.3 Control Module
The control module provides online service for monitoring and collecting both userand service information. The preferences for each user on different services arepredicted by using the model derived in DMC. The control module is composed ofthree components namely (1) the real-time data collector, (2) the preference predictorand (3) the QoE controller.
(1) Real-Time Data Collector (RTDC)
Unlike SDC, the data collection is necessary to be finished in a very short period oftime. Three types of data are gathered by RTDC including user ID, service in use andthe network status. The software entity of RTDC is placed on the user mobile device,by which the user-service data are collected and sent to the Preference PredictionComponent (PPC) and the network status information to the QoE controller.
(2) Preference Prediction Component (PPC)
The function of PPC is to provide prediction ability for user preference. The user-service data from RTDC is processed in PPC and user preference is predicted byapplying prediction model trained in DMC. It should be noticed that there could bemultiple models for handling different types of services. And the model selection isdone automatically.

26 3 Architecture of Data-Driven Personalized QoE Management
(3) QoE Management Component (QMC)
The predicted result of user preference by PPC is handed over to QMC. The statusof the objective network is also identified by QMC. Given those information as theinput, a QoE management model is derived which is summarized in Table2.2. TheQoE management is thus formulated as an optimization problem, and two types ofoptimization objective functions are selected including (1) maximizing the total QoEin the system, and (2) improving the QoE fairness for all users. Based on the resultsof optimization derivations, a QoE management scheme is designed by utilizing thestatus of the current system and the user preferences.
In summary, the whole process includes offline part and online part. Offline partis responsible to build up the user preference model by using data-driven approach.The SDC component distributed in each user’s mobile device collects upload userspecific information. And the DPSC component uses the data to train model. Thefunction of online parts is provided by control module for online service. The wholeprocess begins with monitoring of RTDC in the user device for the user action. Oncethe user begins to use a application/service, RTDC collects the realtime user/serviceinformation, which is then sent to PPC. PPC selects and uses the user preferencemodel to predict the user preference. The resulting user preference is then utilizedby QMC for QoE management on a system level.
Compared with the previous architecture, the main novelty of the proposed archi-tecture is to involve a new concept, that is data driven user preference prediction. Wepresent two kinds of modeling techniques for predictions.
3.3 Personalized Character Extraction: User-ServicePreference
In this section, two models: Bayesian Graphic Model [7] and Context Aware MatrixFactorization Model [8] are introduced. Given the above discussion, the model istrained in the offline training stage, and used for online servicewithin controlmodule.
3.3.1 Bayesian Graphic Model (BGM)
The first modeling technique is Bayesian Graphic model, which is shown in Fig. 3.3,where subscripts i and j stand for user and service, respectively. This model containsthree kinds of layers, which are, respectively, observable layer, hidden layer andprediction layer from the bottom to the top in turn. In the top layer, ri j representsuser xi ’s real rating towards video y j , ri j represents user xi ’s predicted rating towardsvideo y j . In the bottom layer, pi and q j represent user and video observed featurevectors, whose dimension is p × 1 and q × 1, respectively. In the middle layer, uiand v j represent user and video hidden (latent) feature vectors. The dimension of ui

3.3 Personalized Character Extraction: User-Service Preference 27
Fig. 3.3 User-service preference model [7]
and v j are r × 1. These three layers construct a Bayesian Graphic, in which ri j israndom variable which depends on the two random variables ui and v j . And ui and v jalso depend on pi and q j , respectively. Thus this Bayesian Graphic model describesa probabilistic mapping from the observed features to the user’s rating results. AGaussian assumption is used in this model defined as follows.
ri j ∼ N(uTi v j , σ
2),
ui ∼ MV N (Gpi , �u) ,
v j ∼ MV N(Dqj , �v
),
where N(μ, σ 2
)indicates the Gaussian distribution with expectationμ and variance
σ 2; MV N (U, �) indicates the multi-dimension Gaussian with expectation beingUand covariance matrix being �; G and D indicate the coefficient matrixes withdimension being r × p and r × q, respectively. Based on the above definitions, theprobability relationship in BGM is as follows.
28 3 Architecture of Data-Driven Personalized QoE Management
P(ri j |pi , q j ,Θ
) =∫∫
P(ri j , ui , v j |pi , q j ,Θ
)duidv j , (3.1)
where Θ = (σ,G, �u, D, �v) represents all the coefficients in the model. The jointprobability distribution in the above equation represents the generation model withthe complete data set {ri j , ui , v j }. According to conditional independence assumptionof the hidden features, the joint probability distribution is
P(ri j , ui , v j |pi , q j ,Θ
)
= P(ri j |ui , v j , pi , q j , σ
) · P (ui |pi ,G, �u) · P (v j |q j , D, �v
). (3.2)
In the training step, the Monto Carlo Expectation-Maximization (EM) algorithm isadopted in this case to train the model.
Denote the training set as {RT , PT , QT }. After the above training process, coeffi-cients Θ and the posterior distribution of latent variables P(U |RT , PT , QT ,Θ) andP(V |RT , PT , QT ,Θ) are achieved. The prediction target is ri j , based on the BGM,the distribution of ri j is
P(ri j |RT , PT , QT ,Θ
)
=∫∫
P(ri j ,U, V |RT , PT , QT ,Θ)dUdV
=∫∫
P(ri j |U, V,Θ
)P
(U |RT , PT , QT ,Θ
)
P(V |RT , PT , QT ,Θ
)dUdV, (3.3)
with this distribution, the ri j can be predicted.Integrations w.r.t U and V lead to a very high computation complexity. So, some
approximate methods are preferred. The expectation of hidden variable U and Vcan be estimated by using their posterior distribution. Then the probability densityfunction of ri j is approximated by
P(ri j |RT , PT , QT ,Θ
) ≈ N (ri j |ui v j , σ
). (3.4)
So the approximation of ri j is ui v j .Once the BGM is used online, xi or y j represents the new user or a new video,
respectively. We use observed features pi and q j to estimate ui , v j and Θ . And thecold start problem can be solved.
3.3.2 Context Aware Matrix Factorization Model
Before the discussion on context aware matrix factorization model, we present ainformation gain based factor pre-selection process. Given a set of factors, it is mean-

3.3 Personalized Character Extraction: User-Service Preference 29
ingful to proceed a factor pre-selection step to filter out some less influential factors,which makes the modeling work more easier. The different applications/serviceshave their own requirements. There are actually no common set of factors suitablefor all applications/services. In this section, we use a information gain to select con-textual factors. Given a contextual factor variable denoted by D = {dk, 1 ≤ k ≤ K }and R = {ri , 1 ≤ i ≤ I }, and the information gain is formulated as follows.
Gain(R, D) = H(R) − H(R|D)
= H(R) −∑
k
p(D = dk)H(R|D = dk) (3.5)
where Gain(R, D) indicates the information gain between the rating R and thecontextual factor D; H(R) indicates the information entropy of the rating R; H(R|D)
indicates the conditional entropy of the rating R given the contextual factor D;H(R|D = dk) indicates the conditional entropy of the rating R when the contextualfactor D = dk .
H(R) depicts the uncertainty of rating R, meantime H(R|D) depicts the uncer-tainty of rating R given the contextual factor D. Naturally, Gain(R, D) representsthe decreased uncertainty of rating R given the contextual factor D. The higherGain(R, D) means the stronger influence on predicting rating R determined by thecontextual factor D. Consequently, the contextual factors with lower informationgain are regarded as less influential factors, which will be removed from the set offactors.
The matrix factorization (MF) is formulated as:
ri j = pTi q j (3.6)
where ri j indicates the predicting rating of user i to item j ; pi denotes features ofuser i ; q j indicates features of item j .
And the context aware matrix factorization model extends MF model to integratethe context information. The context aware MF model is used for user preferenceprediction under different contexts, which is shown in Fig. 3.4. Subscripts i and jare used to represent user and service, respectively.
Here, we simply divide the contextual factors into three types: the user context, theitem context and the interaction context. The detailed contextual factors are shownin the following by using movie recommendation as example:
• User Context: represents user attributes (Age, Gender, Occupation, Faith, Country,etc.). Generally, they are acquired by users’ registration information.
• Item Context: represents movie attributes (Budget, Director, Genres, Actors, Lan-guage, etc.). Generally, they are acquired by publishers.
• Interaction Context: represents the condition of users or environment when watch-ing movies (Time, Mood, Location, Day type, Social, etc.). Generally, they areacquired by user behavior analysis and server records.

30 3 Architecture of Data-Driven Personalized QoE Management
ru i
bu be bi
qipu
Fig. 3.4 The structure of context aware matrix factorization model [8]
Using the definitions defined in the last section, we further define ri j as
ri j = μ + bi + b j + be =μ + bi (ci ) + b j (c j ) + [pi (ci , ce)]
T q j (c j )(3.7)
as the predicted preference of user i to application/service j . And the relevancebetween predicted rating and each context is simplified as the sum of four parts:global average, user bias, item bias, and user-item interaction bias. μ is the averagescore of all known ratings. bi and bj indicate the observed deviations of user i and itemj, respectively. pi and q j are two K-dimensional vectors that represent the featuresof user i and item j, pi ∈ R
K×1, q j ∈ RK×1.
Given the definition of the predicting rating ri j , subsequently the training methodis shown. The method conducts a loss function related to the parameters in ri j , whichcan be minimized using stochastic gradient descent method to train the model, moredetails of this method are shown in [8]. Consequently, parameters of ri j above aresolved and then the predicting rating can be calculated using Eq.3.7 along withnew data.
3.4 Personalized QoE Model and Example User Case
In order to validate the proposed architecture [5], we carry out a preliminary usecase. In this case, the service scenario is online video. The data includes the userinformation collected from some volunteers from the university campus and the

3.4 Personalized QoE Model and Example User Case 31
video information. The information data of users includes gender, age, occupation,and preferred video type. The videos are categorized into 16 classes and the videoinformation includes the released dates. The context features we considered includewhether the user is indoor or outdoor, whether the user is walking or sitting, andwhether the user watches video using a smartphone or a tablet.
In this case, a two-step QoE modeling method is presented, which depends notonly on network layer parameters, but also on user-service preferences. In the firststep, the user-service preference is modeled and the preference value is predictedas the feature of QoE modeling. In the second step, QoE is modeled according toboth network layer parameters and user preferences. A sigmoid function is used toformulate the mapping from network layer parameters and user preferences to QoEas follows:
QoE = θ
1 + e(−αS+βri j+γ ), (3.8)
where θ , α, β and γ are a set of parameters to control the relationship between inputand output of sigmoid function.
Without loss of generality, we simply select bit rate to represent QoS. We assumethat the users are randomly distributed in the coverage areas of 5 APs and each APhas an upper bound of the total bit rate. An optimization problem is formulated todescribe themaximization of the total QoE. By solving the problem, a properly tunedbit rate could be achieved for the optimization of QoE.
Fig. 3.5 QoE comparison

32 3 Architecture of Data-Driven Personalized QoE Management
We compare the QoE distribution in the proposed architecture with that of thetraditional water-filling algorithm. In traditional water-filling algorithm, iterative bitrate allocation solution is obtained as a result of total QoEmaximizationwithout con-sideration of the user expectation/preference, which results in more bit rate allocatedto the user with lower QoE. Simulation results show improved performance of thesystem compared with the traditional resource allocation method, with an increaseof the total QoE by 20 and 96% of the users obtaining a higher QoE, as shown inFig. 3.5.
3.5 Summary
In this chapter, we propose a systematic data-driven personalized QoE managementarchitecture forQoEoptimization.A framework of theQoEmanagement architectureis first introduced, which consists of a training module and a control module. Wealso employ two models to predict user preference, including Bayesian GraphicModel and Context Aware Matrix Factorization Model. To evaluate the proposedarchitecture, we deploy a preliminary use case. Simulation results illustrate that theperformance of the proposed architecture increases by 20% in the total QoE, while96% of the users obtain a higher QoE compared with the traditional water-fillingmethod.
References
1. Encyclopedia. Youtube. http://en.wikipedia.org/wiki/youtube/.2. D. Zhengyu, S. Jitao, and Changsheng X. “Personalized video recommendation based on cross-
platform user modeling”. In Proc. of IEEE International Conference on Multimedia and Expo(ICME), America, July. 2013.
3. S. Kisoon, M. Aekyung, and C. Yongil. “A case study of context-aware personalized serviceson IMPACT platform: Adsonmap services”. In Proc. of IEEE International Conference onAdvanced Communication Technology (ICACT), Ireland, Feb. 2009.
4. Z. Hua. “Construction of a Personalized Service Oriented Learning Resource ManagementSystem Framework”. In Proc. of IEEE International Workshop on Knowledge Discovery andData Mining (WKDD), Saudi Arabia, Jan. 2008.
5. Y. Wang, P. Li, J. Lei, Z. Su, N. Cheng, X. Shen, and P. Zhang. “A Data-Driven Architecture forPersonalized QoE Management in 5GWireless Networks”. In IEEE Wireless Communications.IEEE.
6. OpenID. http://www.openid.net.7. Y. Wang, P. Li, H. Tao, R. Meng, and J. Liu. “Bayesian graphic model based user preference
prediction for future personalized service provisioning”. In 2015 IEEE/CIC International Con-ference on Communications in China (ICCC), pages 1–6. IEEE, 2015.
8. J. Liu, Y. Wang, and H. Tao. “An improved matrix factorization model under multidimensionalcontext situation”. In 2015 IEEE/CIC International Conference on Communications in China(ICCC), pages 1–6. IEEE, 2015.

Chapter 4QoE-Oriented Resource Allocationin Wireless Networks
Abstract User-subjective experience and personalized preference play a very impor-tant role in QoE. In this chapter, we intend to develop personalized QoE managementby considering the user preference. The proposed personalized QoE model integratesobjective QoS parameters and subjective user preference to evaluate user QoE andthus a more reasonable QoE assessment is achieved. Then, the personalized QoEmodel is applied to the sequential resource allocation and a more specialized andrefined management scheme can be attained. For both conventional and personal-ized resource allocation schemes, numerical simulations are conducted to presentthe effectiveness of the proposed algorithms.
4.1 Background
Radio resource allocation or scheduling algorithms are in charge of deciding whenand how to assign limited radio resources to network users, in order to maximizenetwork capacity, or to ensure QoS requirements, user fairness, etc. Traditional basicradio resource scheduling algorithms, such as Round Robin scheduling (RR) algo-rithm, Maximum Throughput (MT) algorithm and Proportional Fair (PF) algorithm[1–4] are not suitable for multimedia services any more due to the ignorance ofservice quality. Then, QoS is proposed as an indicator to describe objective ser-vice quality, including Assignment Reservation Priority (ARP), Guaranteed Bit Rate(GBR) and QoS Class Identifier (QCI) in the 3GPP standard [5], where QCI is apointer pointing to a more detailed QoS parameter table, including service priority,budget of L2 packet delay, and packet loss rate of L2 packet [2]. However, in the con-text of increasing competition among network operators and service providers, it isimportant to provide users satisfied QoE in order to keep and attract more users. QoEhas become a crucial indicator to evaluate comprehensive performance of wirelesscommunication systems. Hence, the focus of radio resource management has beenshifted from improving objective system performance to promoting user subjectiveexperience.
To illustrate the research status of radio resource management, we mainly dividethem into three types according to scheduling objectives: QoS-based, QoE-based,
© The Author(s) 2017Y. Wang et al., QoE Management in Wireless Networks, SpringerBriefsin Electrical and Computer Engineering, DOI 10.1007/978-3-319-42454-5_4
33
34 4 QoE-Oriented Resource Allocation in Wireless Networks
and energy efficiency based. More details of these resource management schemesare given as follows.
4.1.1 QoS-Based Radio Resource Management Strategies
Real-time multimedia applications (such as voice, web browsing, and file download-ing services) have become the most important services in wireless communicationsystems, motivating QoS parameters to be considered in wireless resource manage-ment strategies. For QoS performance indicators (like transmission rate, networklatency, packet loss rate, etc.), researchers have proposed a number of radio resourcescheduling strategies for different optimization objectives and applicable scenar-ios. References [6–10] proposed QoS-based resource allocation strategies in orderto fulfill user requests such as upper delay time and packet loss rate. In particular, adetailed and comprehensive analysis about QoS-based resource scheduling policieswas given in [6]. The EXP and LOG rules were proposed and claimed to have a greatprospect in the delay-sensitive OFDM system [6].
4.1.2 QoE-Based Radio Resource Management Strategies
For multi-media services with strong content relevance, QoS can not reflect usersubjective experiences accurately due to the ignorance of user factors, motivatingthe research focus to shift from QoS to QoE. In [11], based on human stimulatedperception model in the psychology field, a QoE model in the form of log func-tion was proposed, mapping certain QoS parameters (such as data rate, delay andother parameters) into the MOS (mean opinion score) value by log function. Mostexisting QoE-based radio resource management strategies follow such QoS to QoEmapping model currently, turning data rate throughput maximization problem intoMOS maximization problem. Reference [12] studied a MOS-based radio resourcemanagement strategy based on game theory in OFDMA systems. For QoE optimiza-tion, bitrate-MOS mapping models were adopted to match data rate to QoE for video,voice, and data service, respectively. In [13], a radio resource management strategyin MIMO-OFDM system for data transmission service was proposed based on QoEmapping model.
The process to investigate a QoE-based resource resource management can besummarized as follow: (1) Determine the QoE estimation method and develop thesystem model. (2) Formulate the resource allocation problem according to specificobjectives decided by network managers. (3) Design a resource allocation strategyto obtain the optimal or suboptimal solution of the formulated resource allocationproblem.
4.1 Background 35
4.1.3 Energy Efficiency-Based Radio Resource ManagementStrategies
With the rapid development of mobile communication, the global warming issuescaused by carbon dioxide emission increasing have drawn much attention for futuremobile communication systems. It is challenging to design resource managementschemes which can provide good service performance and reduce energy consump-tion simultaneously. Therefore, energy efficiency defined as the ratio of systemthroughput or other performance indexes to whole energy consumption turns into ahot topic in wireless communications.
There have been a lot of radio resource management strategies designed in physi-cal layer and MAC layer or cross layer in order to improve system energy efficiency.Reference [14] first introduced the theoretical limits of energy efficiency according toinformation theory, and analyzed energy efficient design of Multiple-Input Multiple-Output (MIMO) and relay system. Moreover, radio resource allocation strategiesbased on signal and data symbols were further discussed in that paper. In [15], fourkinds of trade-off of basic performance indexes, including deployment efficiencyversus energy efficiency, spectrum efficiency versus energy efficiency, bandwidthversus energy and latency versus energy are studied. As for radio resource schedul-ing based on energy efficiency, [16] studied an energy efficient resource allocationstrategy in uplink and downlink OFDMA system. To optimize overall energy effi-ciency in the downlink and maximize the lowest energy efficiency of users in theuplink with QoS constraints, an optimal algorithm and a suboptimal low complexityalgorithm were proposed based on the property of energy efficiency problem.
A radio resource scheduling algorithm with high energy efficiency in multi-cellOFDMA downlink system under the BS collaboration was proposed in [17]. In par-ticular, on the basis of basic energy efficiency problem, limited backhaul bandwidth,minimum user data rate requirement and other constraints were added. To solvethe problem, it first transformed the fractional form optimization problem into anequivalent subtraction optimization problem, and then a low complexity iterativealgorithm was proposed. Conclusions were drawn according to simulation resultsthat high spectral efficiency did not necessarily guarantee high energy efficiencyand that energy efficiency can be improved by increasing the backhaul bandwidthto a certain extent. A joint optimization problem of QoS and energy efficiency indownlink OFDMA network was studied in [18]. QoS parameters such as delay weretransformed into equivalent transmission rate in order to formulate the energy effi-ciency optimization problem. The upper bound of the original problem was derivedand then suboptimal solution was obtained to realize the tradeoff between energyefficiency and delay.
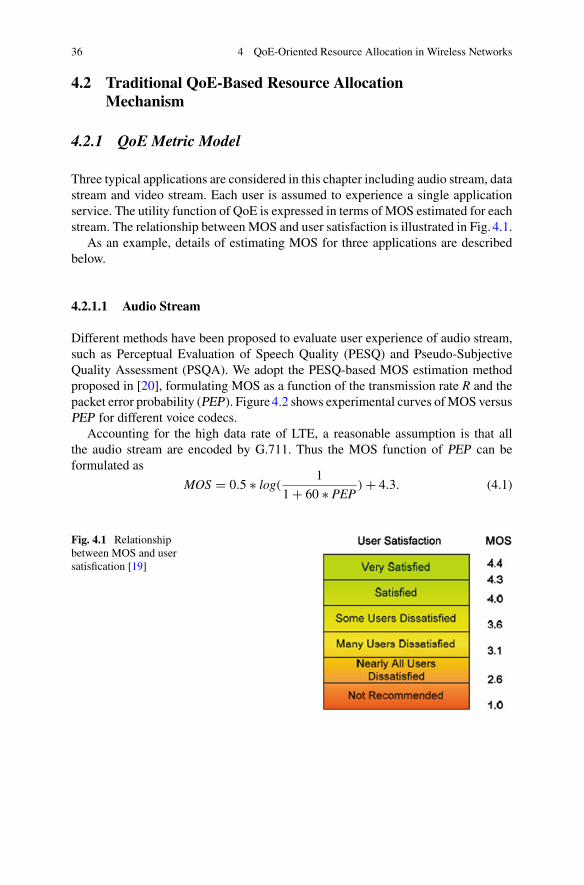
36 4 QoE-Oriented Resource Allocation in Wireless Networks
4.2 Traditional QoE-Based Resource AllocationMechanism
4.2.1 QoE Metric Model
Three typical applications are considered in this chapter including audio stream, datastream and video stream. Each user is assumed to experience a single applicationservice. The utility function of QoE is expressed in terms of MOS estimated for eachstream. The relationship between MOS and user satisfaction is illustrated in Fig. 4.1.
As an example, details of estimating MOS for three applications are describedbelow.
4.2.1.1 Audio Stream
Different methods have been proposed to evaluate user experience of audio stream,such as Perceptual Evaluation of Speech Quality (PESQ) and Pseudo-SubjectiveQuality Assessment (PSQA). We adopt the PESQ-based MOS estimation methodproposed in [20], formulating MOS as a function of the transmission rate R and thepacket error probability (PEP). Figure 4.2 shows experimental curves of MOS versusPEP for different voice codecs.
Accounting for the high data rate of LTE, a reasonable assumption is that allthe audio stream are encoded by G.711. Thus the MOS function of PEP can beformulated as
MOS = 0.5 ∗ log(1
1 + 60 ∗ PEP) + 4.3. (4.1)
Fig. 4.1 Relationshipbetween MOS and usersatisfication [19]

4.2 Traditional QoE-Based Resource Allocation Mechanism 37
Fig. 4.2 PESQ-based MOSversus packet errorprobability (PEP) fordifferent transmission rate[20]
4.2.1.2 Data Stream
Surfing webs and downloading files on the Internet both belong to data stream ser-vice. For this type of service, the waiting time until the download process is finishedis the most important influencing factor for user’s QoE. Download bandwidth, user’sthroughput here, has direct relationship with the waiting time for the data download-ing. It is concluded in [11] that MOS increases logarithmically with increasing datathroughput. In addition, user’s tolerance for waiting time is influenced by the size ofthe file. The MOS function is modeled in [11] as follows.
MOS = 0.775√s
ln(T) + 1.268, (4.2)
where, s stands for the file size with unit of MB and T is the throughput of a user.
4.2.1.3 Video Stream
Video stream service has high requirement for data rate, continuity and real-timing.MOS for video service is complicated to evaluate because users’ QoE is related to notonly transmission rate but also the content of the video. Reference [21] points out thatVideo Structural Similarity Index (VSSIM) can evaluate users QoE more reasonablythan images Mean Square Error (MSE) or Peak Signal Noise ratio (PSNR). That isbecause human eyes are more sensitive to the distortion of images structure than thatof images pixels. According to the data from Video Quality Expert Group (VQEG)[22], MOS can be obtained according to VSSIM as follows.
MOS =⎧⎨
⎩
1 VSSIM < 0.712.5 · VSSIM − 7.75 0.7 ≤ VSSIM ≤ 0.984.5 VSSIM > 0.98.
(4.3)

38 4 QoE-Oriented Resource Allocation in Wireless Networks
Fig. 4.3 MOS versus datarate for different videos [23]
Figure 4.3 shows the video utility curve for five different video sequences. It can beconcluded that videos with higher dynamic scenes are more demanding for data ratethan static videos.
4.2.2 System Model
In a multi-service single cellular downlink OFDM system with a BS communicatingwith K users sharing N subcarriers. The total bandwidth of the system W is equallydivided into N subcarriers, with the bandwidth of each subcarrier B = W/N . Inorder to avoid co-channel interference between different users in the same cell, eachsubcarrier in a sub-frame can be assigned to only one user. However, one user canbe assigned more than one subcarrier.
Denote pi,n andGi,n as the instantaneous transmit power and channel gain of user ion subcarriern, respectively.Gi,n represents the sum effect of path loss, shadow fadingand small-scale fading. Ii,n is the inter-cell interference. According to Shannon’sformula, the maximum available data rate for user i on subcarrier n is
ri,n = Blog2(1 + pi,n · Gi,n
N0B + Ii,n), (4.4)
where N0 is the white Gaussian noise power spectrum density. Hence, the total datarate of user i can be given by
Ri =N∑
n=1
ai,n · ri,n, (4.5)

4.2 Traditional QoE-Based Resource Allocation Mechanism 39
where ai,n indicates whether subcarrier n is allocated to user i. ai,n = 1 if the sub-carrier n is scheduled to user i, otherwise ai,n = 0. Moreover, each subcarrier can be
allocated to at most one userK∑
i=1ai,n = 1.
4.2.3 Problem Formulation
In order to achieve system QoE maximization, the resource allocation problem canbe formulated as follows:
maxai,n,pi,n
:K∑
i=1MOSi,
C1 :K∑
i=1Pi ≤ Ptotal,
C2 : 0 ≤ Pi ≤ Pmax,∀i ∈ {1, 2...K},C3 : ai,n ∈ {0, 1},∀i ∈ {1, 2...K},∀n ∈ {1, 2...N},C4 :
K∑
i=1ai,n = 1,∀n ∈ {1, 2...N}.
(4.6)
4.2.4 Resource Allocation Strategy
Weber–Fechner Law (WFL) [24] illustrates a logarithmic relationship between userQoE and data throughput, which implies that a marginal effect does exist for QoE andtransmission power. Meanwhile, the relationship between throughput and transmis-sion power is also formulated as a logarithmic function. Therefore, MOS will exhibita strong diminishing marginal benefit in terms of power. More specifically, thereis limited MOS increase for a user whose MOS being already high with a certainamount improvement of power. While a low MOS will have a stronger enhance-ment with the same amount of power improvement. Hence, a QoE-based resourceallocation algorithm with low complexity is presented in Fig. 4.4.
The M+ in the flowchart represents the achieved MOS gain if power allocationincreases by ΔP, which can be given by ΔM+
i = MOSmi (Pmi + ΔP) − MOSmi (Pm
i )
and M− stands for the MOS degradation if power allocation decreases by ΔP.
4.2.5 Simulation and Analysis
To validate the effectiveness of the QoE-based resource allocation strategy, a simula-tion experiment is conducted and the Round-Robin strategy is adopted as the baseline

40 4 QoE-Oriented Resource Allocation in Wireless Networks
Fig. 4.4 QoE-basedresource allocation strategy
Table 4.1 Experimentparameters
Carrier frequency 2 GHZ
Fast fading Rayleigh fading
User number 10
Subcarrier number 200
Subcarrier bandwidth 10 kHZ
Noise power spectrum density(N0)
10−13 W/HZ
strategy for comparison. Simulation parameters are listed in Table. 4.1. Figure 4.5presents the Cumulative Distribution Function (CDF) of user QoE. It can be con-cluded from Fig. 4.5 that the proposed QoE-based resource allocation strategy canacquire better user QoE than QoE-ignorant baseline strategy.

4.3 Personalized QoE-Based Resource Allocation Mechanism 41
Fig. 4.5 CumulativeDistribution Function of userQoE
0 0.5 1 1.5 2 2.5 3 3.5 4 4.5 50
0.1
0.2
0.3
0.4
0.5
0.6
0.7
0.8
0.9
1
Cum
ulat
ive
Dis
tribut
ion
Func
tion
User QoE
QoE for Non−personalized QoE−based strategy
QoE for the baseline strategy
4.3 Personalized QoE-Based ResourceAllocation Mechanism
To conduct personalized QoE-based management, a personalized QoE model isestablished first. The personalized QoE model proposed and validated in Chap. 3 isused here to instruct personalized QoE-based resource allocation. For personalizedQoE management, a comprehensive consideration of both objective and subjectivefactors is used to evaluate user QoE. User preference is used to quantize subjectivefactors and QoS is used to quantize the objective factors. The QoE model is devel-oped using the popular sigmoid function with respect to user’s preference rij andQoS denoted by S, i.e., as is shown below.
QoE = θ
1 + e(−αS+βrij+γ ), (4.7)
where α, β, γ , and θ are the parameters constraining the quantization of QoE andthey can be learned by implementing experiments and data analysis.
For sequential personalized QoE-based resource allocation purpose, the person-alized QoE model is utilized to replace the QoE formulation in optimization problem(4.6), where user preference data derives from the user preference prediction modeland bit rate is utilized to represent QoS parameters. A simulation is employed todepict the results comparison of non-personalized QoE-based strategy and person-alized QoE strategy. Final user actual QoE distribution and data throughput distrib-ution and their average values are shown in Figs. 4.8 and 4.9. And Figs. 4.6 and 4.7depict the Cumulative Distribution Function of user actual QoE and data through-put, respectively. Obviously, more refined and precise QoE management is attainedfor personalized strategy because resources can be utilized more reasonably andefficiently by considering user personality and more system benefit can be reachedaccordingly.
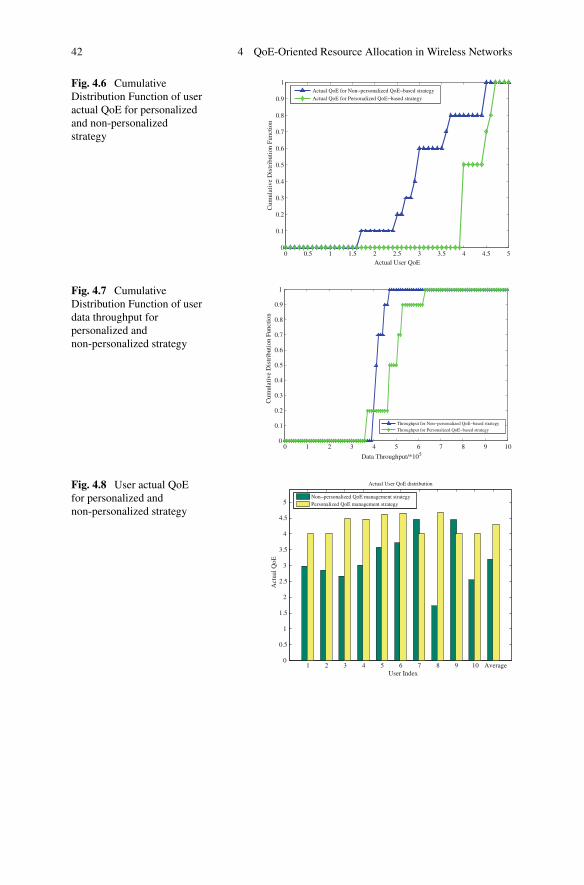
42 4 QoE-Oriented Resource Allocation in Wireless Networks
Fig. 4.6 CumulativeDistribution Function of useractual QoE for personalizedand non-personalizedstrategy
0 0.5 1 1.5 2 2.5 3 3.5 4 4.5 50
0.1
0.2
0.3
0.4
0.5
0.6
0.7
0.8
0.9
1
Cum
ulat
ive
Dis
tribut
ion
Func
tion
Actual User QoE
Actual QoE for Non−personalized QoE−based strategy
Actual QoE for Personalized QoE−based strategy
Fig. 4.7 CumulativeDistribution Function of userdata throughput forpersonalized andnon-personalized strategy
0 1 2 3 4 5 6 7 8 9 100
0.1
0.2
0.3
0.4
0.5
0.6
0.7
0.8
0.9
1
Cum
ulat
ive
Dis
tribut
ion
Func
tion
Data Throughput/*105
Throughput for Non−personalized QoE−based strategy
Throughput for Personalized QoE−based strategy
Fig. 4.8 User actual QoEfor personalized andnon-personalized strategy
1 2 3 4 5 6 7 8 9 10 Average0
0.5
1
1.5
2
2.5
3
3.5
4
4.5
5
User Index
Actua
l QoE
Actual User QoE distribution
Non−personalized QoE management strategyPersonalized QoE management strategy

4.4 Summary 43
Fig. 4.9 User datathroughput for personalizedand non-personalizedstrategy
1 2 3 4 5 6 7 8 9 10 Average0
1
2
3
4
5
6
7x 10⁵
User IndexD
ata
Thr
ough
put
User data throughput distribution
Non−personalized QoE management strategyPersonalized QoE management strategy
4.4 Summary
In this chapter, a brief introduction to radio resource allocation research status alongwith the developing direction is given first. Then, QoE-based resource allocationproblem is investigated from both non-personalized and personalized aspects. AQoE-based resource allocation algorithm is proposed to attain suboptimal solutionfor QoE maximization problem. Simulation results validate the proposed algorithmby comparing QoE-based strategy with round robin strategy. Furthermore, a compar-ison of personalized and non-personalized QoE-based strategy is given, indicatingthat a more detailed and refined management is accomplished by considering userpreference.
References
1. P. Kela, J. Puttonen, N. Kolehmainen, T. Ristaniemi, T. Henttonen, and M. Moisio. “Dynamicpacket scheduling performance in UTRA long term evolution downlink”. In Proc. IEEE 3rdInternational Symposium on Wireless Pervasive Computing, pages 308–313, 2008.
2. G. Monghal, K. I. Pedersen, PE Mogensen, et al. “QoS oriented time and frequency domainpacket schedulers for the UTRAN long term evolution”. In Proc. IEEE Vehicular TechnologyConference, pages 2532–2536, 2008.
3. Y. Lin and G. Yue. “Channel-adapted and buffer-aware packet scheduling in LTE wireless com-munication system”. InProc. IEEE 4th International Conference onWireless Communications,Networking and Mobile Computing, pages 1–4, 2008.
4. R. Kwan, C. Leung, and J. Zhang. “Proportional fair multiuser scheduling in LTE”. IEEE SignalProcessing Letters, 16(6):461–464, 2009.
5. D ETSI. “General Packet Radio Service (GPRS), service describtion; stage 2”, 1998.6. B. Sadiq, S. J. Baek, and G. De Veciana. “Delay-optimal opportunistic scheduling and approxi-
mations: The log rule”. IEEE/ACM Transactions on Networking (TON), 19(2):405–418, 2011.7. J. Park, S. Hwang, and H. Cho. “A packet scheduling scheme to support real-time traffic in
OFDMA systems”. In Proc. IEEE 65th Vehicular Technology Conference, pages 2766–2770,2007.

44 4 QoE-Oriented Resource Allocation in Wireless Networks
8. M. Assaad. “Frequency-Time Scheduling for streaming services in OFDMA systems”. InProc.IEEE 1st IFIP Wireless Days, pages 1–5, 2008.
9. Y. Qian, C. Ren, S. Tang, and M. Chen. “Multi-service QoS guaranteed based downlink cross-layer resource block allocation algorithm in LTE systems”. In Proc. International Conferenceon Wireless Communications & Signal Processing, pages 1–4, 2009.
10. H. A. M. Ramli, R. Basukala, K. Sandrasegaran, and R. Patachaianand. “Performance of wellknown packet scheduling algorithms in the downlink 3GPP LTE system”. In Proc. IEEE 9thMalaysia International Conference on Communications (MICC), pages 815–820, 2009.
11. P. Reichl, S. Egger, R. Schatz, and A. D’Alconzo. “The logarithmic nature of QoE and therole of the Weber-Fechner law in QoE assessment”. In Proc. IEEE International Conferenceon Communications (ICC), pages 1–5, 2010.
12. C. Sacchi, F. Granelli, and C. Schlegel. “A QoE-oriented strategy for OFDMA radio resourceallocation based on Min-MOS maximization”. IEEE Communications Letters, 15(5):494–496,2011.
13. M. Li, Z. Chen, and Y. Tan. “Qoe-aware resource allocation for scalable video transmissionover multiuser MIMO-OFDM systems”. In Proc. IEEE Visual Communications and ImageProcessing (VCIP), pages 1–6, 2012.
14. G. Y. Li, Z. Xu, C. Xiong, C. Yang, S. Zhang, Y. Chen, and S. Xu. “Energy-efficient wirelesscommunications: tutorial, survey, and open issues”. IEEEWireless Communications, 18(6):28–35, 2011.
15. Y. Chen, S. Zhang, S. Xu, and G. Y. Li. “Fundamental trade-offs on green wireless networks”.IEEE Communications Magazine, 49(6):30–37, 2011.
16. C. Xiong, G. Y. Li, S. Zhang, Y. Chen, and S. Xu. “Energy-efficient resource allocation inOFDMA networks”. IEEE Transactions on Communications, 60(12):3767–3778, 2012.
17. D. W. K. Ng, E. S. Lo, and R. Schober. “Energy-efficient resource allocation in multi-cellOFDMA systems with limited backhaul capacity”. IEEE Transactions on Wireless Communi-cations, 11(10):3618–3631, 2012.
18. C. Xiong, G. Y. Li, Y. Liu, and S. Xu. “QoS driven energy-efficient design for downlink OFDMAnetworks”. In Proc. IEEE Global Communications Conference (GLOBECOM), pages 4320–4325, 2012.
19. ITUT Rec. “G. 107-The E Model, a computational model for use in transmission planning”.International Telecommunication Union, 8:20–21, 2003.
20. S. Khan, S. Duhovnikov, E. Steinbach, M. Sgroi, and W. Kellerer. “Application-driven cross-layer optimization for mobile multimedia communication using a common application layerquality metric”. In Proc. the 2006 international conference on Wireless communications andmobile computing, pages 213–218. ACM, 2006.
21. M. Shehada, S. Thakolsri, Z. Despotovic, and W. Kellerer. “QoE-based cross-layer optimiza-tion for video delivery in long term evolution mobile networks”. In Proc. 14th InternationalSymposium on Wireless Personal Multimedia Communications (WPMC), pages 1–5, 2011.
22. A. M. Rohaly, J. Libert, P. Corriveau, A. Webster, et al. “Final report from the video qual-ity experts group on the validation of objective models of video quality assessment”. ITU-TStandards Contribution COM, pages 9–80, 2000.
23. S. Thakolsri, S. Cokbulan, D. Jurca, Z. Despotovic, and W. Kellerer. “QoE-driven cross-layeroptimization in wireless networks addressing system efficiency and utility fairness”. In Proc.2011 IEEE GLOBECOM Workshops (GC Wkshps), pages 12–17, 2011.
24. P. Reichl, S. Egger, R. Schatz, and A. D’Alconzo. “The logarithmic nature of QoE and therole of the Weber-Fechner law in QoE assessment”. In Proceedings of IEEE InternationalConference on Communications (ICC), pages 1–5, 2010.

Chapter 5Implementation and Demonstrationof QoE Measurement Platform
Abstract This chapter describes the state-of-the-art of QoE experiment. Then usinga streaming media application as an example, how to design subjective experimentis presented in particular to the QoE-related factors and measurement criterion def-inition. The detailed procedure and infrastructure is then presented and illustrated.Finally, a conclusion is given.
5.1 Introduction
Although many research works are involved in QoE, it is still an open problem onhow to measure QoE quality. Since the user-subjective information such as userpreference is highly related with QoE quality, how to balance the influences betweenobjective and subjective factors is a key issue.
5.2 Related Work
According to the wireless network environment which QoE measurement workdepends on, the measurement is divided into three categories, namely, commercialnetwork, laboratory network, and simulation network.
5.2.1 Measurement Under Commercial NetworkEnvironment
The data from commercial network is of course realistic data. Because data is usuallyuser-dependent. The relevant privacy regulations should be respected. In addition,the end-users obviously do not want to be disturbed when they are using the appli-cations. Some smart ways should be found to promote the end-users to responsetheir subjective feelings. Schuurman et al. discusses a concept of “living laboratory,”
© The Author(s) 2017Y. Wang et al., QoE Management in Wireless Networks, SpringerBriefsin Electrical and Computer Engineering, DOI 10.1007/978-3-319-42454-5_5
45

46 5 Implementation and Demonstration of QoE Measurement Platform
UE
BackboneBearer
Network
ExternalBearer
Network
Video Streaming
Server
GGSN SGSN RNC
NodeB
QoS
QoE
Fig. 5.1 QoE and QoS for video streaming service in 3G networks [5]
in which they create a real-life community within a commercial market [1]. Witha large amount of users involved, the measurement result becomes more accurate.De Moor et al. has proposed a distributed architecture to monitor the QoS, the contextinformation and the subjective user experience based on the functional requirementswhich is related to real-time experience measurements in real-life settings [2–4].This approach aims to evaluate all relevant QoE-dimensions in a mobile context.X. Yu et al. has introduced an end-to-end, no-reference, and real-time QoE predic-tion model for video streaming in 3G networks [5–7]. In this model, comprehensiveparameters from the network layer, the application layer, decoded videos and the userequipments are collected and integrated. This model has a good performance on thesimulation results in terms of accurate prediction mean opinion score (MOS), smallroot mean squared error (RMSE), and low time-consuming. Figure 5.1 describes QoSand QoE for video streaming service in 3G networks. However, due to the difficultiesin collecting operators’ actual network data, there is a big gap between the data thatwe have actually got and that we ideally need. How to obtain more comprehensiveand effective data that we really need is also a tough challenge.
5.2.2 Measurement Under Laboratory Network Environment
Due to the problems discussed in the last section, many researchers incline to establishthe laboratory network environment based on their requirement. With a laboratorynetwork environment, the researchers have a better control on the whole infrastructureto facilitate QoE measurement. In Ref. [8], an active feedback measurement scenariois built up in a laboratory network which contains the terminal domain and theserver domain. When the experiment is in progress, users will shake their mobilephones if they are dissatisfied with the quality of the videos. Then, the feedbackinformation will be sent back via the terminal. By this way, the feedback informationis collected and the value of the QoE parameter is calculated for each user. In Ref. [9],another measurement scenario is also constructed for short-form videos consideringthe memory effect. Plenty of subjective tests is proceeded within the laboratorynetwork environment. Figure 5.2 shows the whole architecture. It is observed thatthe primacy factor has more influence than recency factor on short-form videos.
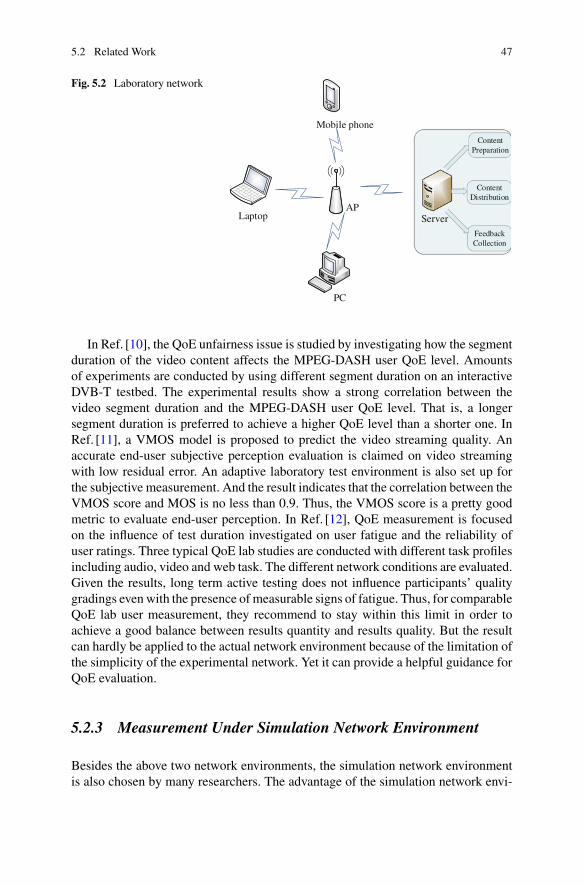
5.2 Related Work 47
Fig. 5.2 Laboratory network
Server
PC
Laptop
Mobile phone
AP
ContentPreparation
ContentDistribution
FeedbackCollection
In Ref. [10], the QoE unfairness issue is studied by investigating how the segmentduration of the video content affects the MPEG-DASH user QoE level. Amountsof experiments are conducted by using different segment duration on an interactiveDVB-T testbed. The experimental results show a strong correlation between thevideo segment duration and the MPEG-DASH user QoE level. That is, a longersegment duration is preferred to achieve a higher QoE level than a shorter one. InRef. [11], a VMOS model is proposed to predict the video streaming quality. Anaccurate end-user subjective perception evaluation is claimed on video streamingwith low residual error. An adaptive laboratory test environment is also set up forthe subjective measurement. And the result indicates that the correlation between theVMOS score and MOS is no less than 0.9. Thus, the VMOS score is a pretty goodmetric to evaluate end-user perception. In Ref. [12], QoE measurement is focusedon the influence of test duration investigated on user fatigue and the reliability ofuser ratings. Three typical QoE lab studies are conducted with different task profilesincluding audio, video and web task. The different network conditions are evaluated.Given the results, long term active testing does not influence participants’ qualitygradings even with the presence of measurable signs of fatigue. Thus, for comparableQoE lab user measurement, they recommend to stay within this limit in order toachieve a good balance between results quantity and results quality. But the resultcan hardly be applied to the actual network environment because of the limitation ofthe simplicity of the experimental network. Yet it can provide a helpful guidance forQoE evaluation.
5.2.3 Measurement Under Simulation Network Environment
Besides the above two network environments, the simulation network environmentis also chosen by many researchers. The advantage of the simulation network envi-
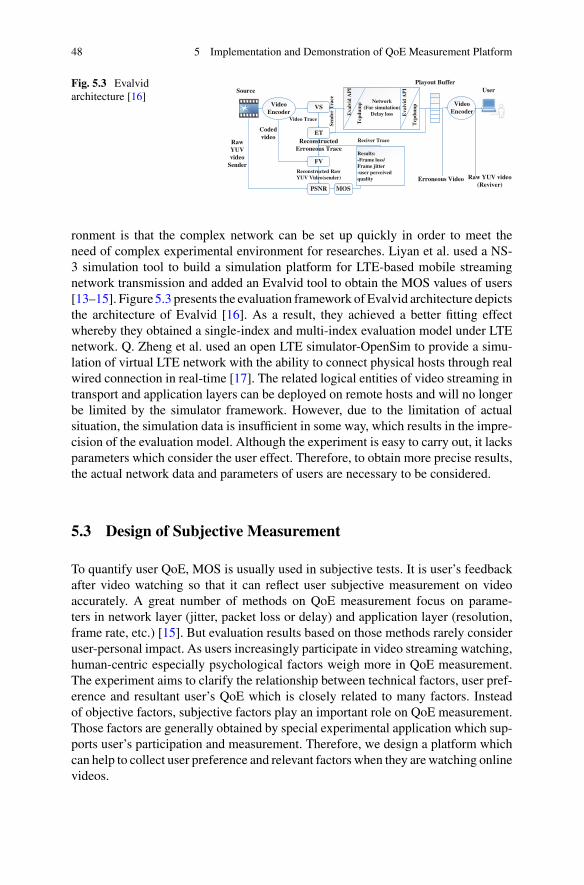
48 5 Implementation and Demonstration of QoE Measurement Platform
Fig. 5.3 Evalvidarchitecture [16]
Video Encoder
VS
ET
FV
PSNR
Coded video
Raw YUV video
Sender
Video Trace
Reconstructed Erroneous Trace
Reconstructed Raw YUV Video(sender)
Eva
lvid
AP
I
Tcpdu
mp Network
(For simulation)Delay loss E
valv
id A
PI
Tcpdu
mp Video
Encoder
Reciver Trace
Send
er T
race
Playout BufferUser
Erroneous Video Raw YUV video(Reviver)
Results:-Frame loss/Frame jitter-user perceived quality
MOS
Source
ronment is that the complex network can be set up quickly in order to meet theneed of complex experimental environment for researches. Liyan et al. used a NS-3 simulation tool to build a simulation platform for LTE-based mobile streamingnetwork transmission and added an Evalvid tool to obtain the MOS values of users[13–15]. Figure 5.3 presents the evaluation framework of Evalvid architecture depictsthe architecture of Evalvid [16]. As a result, they achieved a better fitting effectwhereby they obtained a single-index and multi-index evaluation model under LTEnetwork. Q. Zheng et al. used an open LTE simulator-OpenSim to provide a simu-lation of virtual LTE network with the ability to connect physical hosts through realwired connection in real-time [17]. The related logical entities of video streaming intransport and application layers can be deployed on remote hosts and will no longerbe limited by the simulator framework. However, due to the limitation of actualsituation, the simulation data is insufficient in some way, which results in the impre-cision of the evaluation model. Although the experiment is easy to carry out, it lacksparameters which consider the user effect. Therefore, to obtain more precise results,the actual network data and parameters of users are necessary to be considered.
5.3 Design of Subjective Measurement
To quantify user QoE, MOS is usually used in subjective tests. It is user’s feedbackafter video watching so that it can reflect user subjective measurement on videoaccurately. A great number of methods on QoE measurement focus on parame-ters in network layer (jitter, packet loss or delay) and application layer (resolution,frame rate, etc.) [15]. But evaluation results based on those methods rarely consideruser-personal impact. As users increasingly participate in video streaming watching,human-centric especially psychological factors weigh more in QoE measurement.The experiment aims to clarify the relationship between technical factors, user pref-erence and resultant user’s QoE which is closely related to many factors. Insteadof objective factors, subjective factors play an important role on QoE measurement.Those factors are generally obtained by special experimental application which sup-ports user’s participation and measurement. Therefore, we design a platform whichcan help to collect user preference and relevant factors when they are watching onlinevideos.
5.3 Design of Subjective Measurement 49
5.3.1 QoE Related Factors
With the development of smart phones and mobile communication, mobile terminalsare increasingly chosen as the platform for user to watch videos. Therefore, theexperiment focuses on short-formed video QoE measurement on user’s own mobilephones.
(A) Content Classification
The experiment system stands on the view of content service providers and providesdistinct videos with diverse content types. Considering the time limitation of shortvideos, the content type is classified into six categories which are cartoon, movie,news, sport, MV, and entertainment.
(B) Influencing Factors
User’s evaluation of video is determined with many factors which can be classifiedwith objective factors and subjective factors. Objective factors depend on the condi-tion of network and video sources. Traditionally, those factors can be obtained fromtechnical approaches and evaluated as QoS metrics. As to subjective factors, they arecrucial determinants for the evaluation of personal evaluation since they can reflectuser perception directly. From objective aspect, the video is visually different fromdefinition which is influenced by resolution and bitrate, as shown in Fig. 5.4. In thisexperiment, we control the resolution of video to 480 p and adjust different bitrate toachieve three levels of video quality. Because the experimental network is limited tolocal network, the network influence is not considered in this part. Compared withobjective factors, subjective factors are more complex. With collection and analysisof those factors, the user-personal perception can be reflected. The subjective factorscan be extended to user’s psychological conditions such as preference and user’sprofile information such as user gender. Also, other environmental factors can makean influence on evaluation result. But in this experiment, we keep them as constantas possible. User perception can be estimated by preference factors directly. In thisexperiment, the preference factors are quantified with three levels. Table 5.1 showsthe preference criteria for video content.
Also, user-personal characteristics may be the influencing factor. We collect user’sgender information and their terminal information for further analysis about person-alized difference.
Table 5.1 Preference levelcriteria
Preference level Description
1 Dislike
2 Do not like nor dislike
3 Like

50 5 Implementation and Demonstration of QoE Measurement Platform
Fig. 5.4 Influencing factorsPersonalized
QoE
Objective Factors Subjective Factors
Technical
Application layer parameters:
Resolution, frame rate,color, video codec type,
audio codec type,layering strategy
Network layer parameters:
Jitter, delay, burstiness,latency and packet loss
Human Factors
Environmental Factors
Psychological Factors:
User preference, user behavior, grade
habits...
User Profile:
User personality,user gender, social
status...
Current emotional state, the test
environment, current psychological states
Table 5.2 MOS criteria Score Description
5 Imperceptible
4 Perceptible but not annoying
3 Slightly annoying
2 Annoying
1 Very annoying
(C) Measurement Criterion
According to ITU-T Recommendation P.910, MOS is chosen as the score criterionfor QoE measurement. The score can reflect users’ overall experience for the targetvideo. Also, compared with other user’s survey, it is more intuitional and clear to becollected. As a result, the experiment uses MOS as measurement criterion, as shownin Table 5.2.
5.4 Platform Infrastructure on Streaming MediaApplication Scenario
5.4.1 Supporting System Architecture
The architecture adopts B/S (Browser/Server) structure. Users watch videos on thebrowser of mobile terminals and submit feedbacks to the server. As shown in Fig. 5.5,

5.4 Platform Infrastructure on Streaming Media Application Scenario 51
Fig. 5.5 The overviewsystem architecture
web server Database
Ubuntu Linux OS
Server Language
PHP Nginx Mysql
Data analyzingVideo
TranscodingData Collecting
User identification
Video ComponentResult Feedback
Service Platform
userinfo source video files
Others · ··
Data Access Layer(DAL)
Application Logic Layer(ALL)
User Interface Layer(UI)
HTTP HLS
data store
the whole server operates on Ubuntu Linux system which provides a supportingplatform for the experiment system. The experimental system is supported by LNMP(Linux—Nginx—MySQL—PHP) which is a free and efficient web service system.Compared with LAMP (Linux—Apache—MySQL—PHP), LNMP differs from theweb server. Nginx is a lightweight and high-performance web server and a reverseproxy server. Compared with other kinds of web servers, it has the advantages of lessinternal memory occupation and good performance on concurrence. As a result, it ishigh-performance on static and index file processing, which improves the efficiencyfor M3U8 file indexing to implement HTTP Live Streaming (HLS) protocol. Also,it is easy to configure, which releases the pressure for the system establishing.
Both video distribution and result feedback functions are built up on top of thesupport system architecture.
5.4.2 Functional Modules
From the functional aspect, the streaming media system can be divided into threeparts, i.e., encoder, server, and terminal. The encoder is responsible for the contentpreparation function. The server is to provide platform to distribute prepared videos.With request and download, the terminal can play the video for users. As shown inFig. 5.6.
(A) Content Preparation
FFmpeg, which is a frequently used multimedia open source tool, serves for thecontent preparation to complete encoder function. Original videos are encoded based

52 5 Implementation and Demonstration of QoE Measurement Platform
Fig. 5.6 Functional modules
Content preparation Video DistributionFeedback Collection
.tsencoder
segment
Nginx Server
index file
3 levels
.ts file MySQL
Video Watching Users’ participation
HTTP Users’ feedback
User interface
on MPEG-2 system layer standard and output with transport streaming format. Also,FFmpeg helps to segment those transport streaming into a series of sequential andequal-length small TS files which will be sent to video distribution module then.
(B) Video Distribution
For a conversation, the browser will download an extended M3U (m3u8) playlistwhich acts as an index to find streaming media segments. Video distribution module,which is supported by Nginx server, is to distribute the segmented TS files and relatedindex files to client player. It is responsible to respond to users’ requests and allocateprepared media streaming with HLS protocol.
(C) Terminal playing
With user’s request, browsers obtain and download the index file which specifies theavailable TS files, the decryption key and the location of the other replacement flowon the server. When the media file buffer is enough large to support playing, theclient will assemble them into a sequential TS streaming and send to the player.
(D) Feedback Collection
The video player embeds in the webpage which can be browsed on mobile termi-nals. Users watch videos on browser and submit their subjective data from webpages. Then, the form will be submitted to server to complete data collecting. In thisexperiment, users’ preference, measurement scores, gender, video contents will becollected and stored in database.
5.5 Measurement Procedure
5.5.1 Crowdsourcing
Although lab based test tends to provide more accurate results, crowdsourcing seemsto be an alternative way with time and cost limitation. Crowdsourcing is to invite

5.5 Measurement Procedure 53
anonymous volunteers from the Internet to participate in subjective test. It widensthe range of testers and makes the measurement as simple as possible. The testersin local area network are asked to watch online videos and then give a quality andpreference measurement for each one.
5.5.2 Measurement Description
During the experiment, the QoE evaluation results are collected with correspondingusers’ subjective information. The relationship between the values of QoE parametersand application metadata is analyzed and modeled accordingly. That is the collecteddata should include the preference score, the quality measurement and the videoswith different bitrates. The video, whose resolution is 480 P, encoded with FFmpeginto H264/AAC at three different bitrates: 128, 512, and 1024 kbps. Those preparedvideos are embedded in HTML webpages so that users can watch videos throughtheir browser on mobile terminals. Table 5.3 shows the information about videosused in this experiment.
User Operations
Users use their mobile terminals to connect and login to the campus network.Then, a given website is opened and a list of video is shown on the webpage (shownin Fig. 5.7). The users can access any video randomly and then give a brief evaluationfor each.
5.5.3 Measurement Result
Users’ feedbacks of a total of 18 videos assessment are stored in database. Based onthose crowdsourcing data, brief analysis has been conducted. As shown in Fig. 5.8,it is observed the score gaps among the videos with different qualities. A tradeoffbetween video quality and user video preference is also observed. That is, the usersare willing to tolerate poorer video quality when they are watching their favoritevideos.
Table 5.3 Video used in test Item Value
Content Cartoon, MV, News, Sports,Movie, Entertainment
Amount of videos in eachcontent
3
Resolution 480 p
Bitrate 128, 512, 1024 kbps
Length of each video 1 min
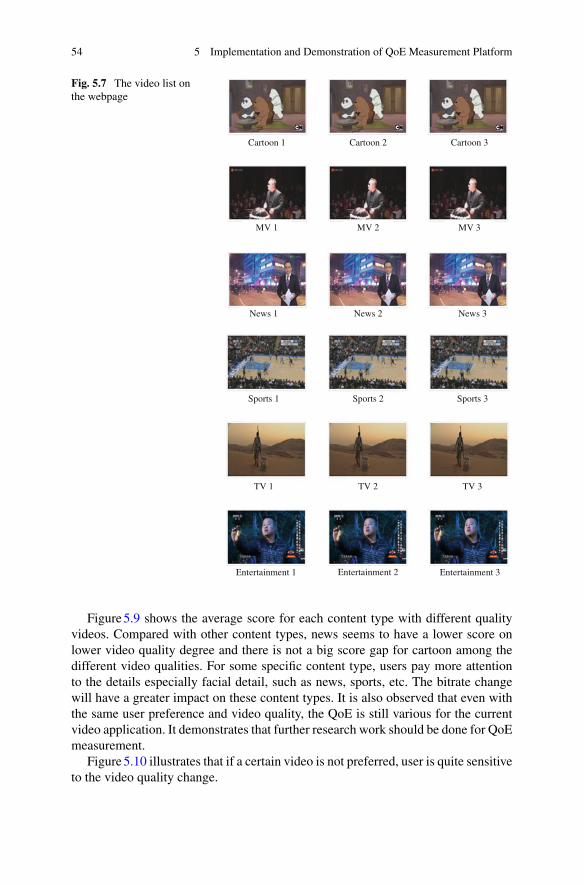
54 5 Implementation and Demonstration of QoE Measurement Platform
Fig. 5.7 The video list onthe webpage
Cartoon 1 Cartoon 3Cartoon 2
MV 1 MV 3MV 2
News 3News 2News 1
Sports 3Sports 2Sports 1
TV 3TV 2TV 1
Entertainment 1 Entertainment 2 Entertainment 3
Figure 5.9 shows the average score for each content type with different qualityvideos. Compared with other content types, news seems to have a lower score onlower video quality degree and there is not a big score gap for cartoon among thedifferent video qualities. For some specific content type, users pay more attentionto the details especially facial detail, such as news, sports, etc. The bitrate changewill have a greater impact on these content types. It is also observed that even withthe same user preference and video quality, the QoE is still various for the currentvideo application. It demonstrates that further research work should be done for QoEmeasurement.
Figure 5.10 illustrates that if a certain video is not preferred, user is quite sensitiveto the video quality change.

5.5 Measurement Procedure 55
Fig. 5.8 Average score ofvideos with differentpreference
Fig. 5.9 Average score ofvideos with different bitrates
Fig. 5.10 Average score forvideos with different qualityand preference

56 5 Implementation and Demonstration of QoE Measurement Platform
Fig. 5.11 Average scorewith different gender
The users’ gender information is also collected. As shown in Fig. 5.11, comparingfemale with male score, female gives a higher score for the video, which means thatfemale is more insensitive to the video quality than male.
Based on those observations, the necessity of QoE measurement is validated. Itcan be summarized that the technical factors are crucial for the QoE measurement.In addition, user perception is also an important metric.
5.6 Summary
In this chapter, the QoE measurement platform for implementation and demonstra-tion is presented and described. The measurement factors and criterion are givenrespectively. In order to clearly articulate the whole infrastructure, we use a stream-ing media application as an example. A detailed design of the subjective experimentis also given especially including the QoE-related factors and measurement crite-rion definition. A detailed supporting architecture is described and an experimentprocedure is given. Procedure and infrastructure is then presented and illustrated.Some observations are also given on the influences of different factors such as userpreferences, video qualities, video content type, and user gender information etc.Finally, a conclusion is given.
References
1. D. Schuurman, K. De Moor, L. De Marez, and T. Evens. “A Living Lab research approach formobile TV”. Telematics and Informatics, 28(4):271–282, Nov. 2011.
2. K. De Moor, I. Ketyko, W. Joseph, T. Deryckere, L. De Marez, L. Martens, and G. Verleye.“Proposed framework for evaluating quality of experience in a mobile, testbed-oriented living

References 57
lab setting”. Mobile Networks and Applications, 15(3):378–391, Jan. 2010.3. Miguel P. De L., M. Eriksson, S. Balasubramaniam, and W. Donnelly. “Creating a distributed
mobile networking testbed environment-through the living labs approach”. In 2nd InternationalConference on Testbeds and Research Infrastructures for the Development of Networks andCommunities, 2006. TRIDENTCOM 2006, pages 5–pp. IEEE, Mar. 2006.
4. V. Niitamo, S. Kulkki, M. Eriksson, and K. A. Hribernik. “State-of-the-art and good practicein the field of living labs”. In Proceedings of the 12th International Conference on ConcurrentEnterprising: Innovative Products and Services through Collaborative Networks. Italy: Milan,pages 26–28, 2006.
5. X. Yu, H. Chen, W. Zhao, and L. Xie. “No-reference QoE Prediction Model for Video StreamingService in 3G Networks”. In 2012 8th International Conference on Wireless Communications,Networking and Mobile Computing (WiCOM), pages 1–4. IEEE, Sep. 2012.
6. T. Kawano, K. Yamagishi, K. Watanabe, and J. Okamoto. “No reference video-quality-assessment model for video streaming services”. In 2010 18th International Conference onPacket Video Workshop (PV), pages 158–164. IEEE, Dec. 2010.
7. T. De Pessemier, K. De Moor, A. Juan, W. Joseph, L. De Marez, and L. Martens. “QuantifyingQoE of mobile video consumption in a real-life setting drawing on objective and subjectiveparameters”. In 2011 IEEE International Symposium on Broadband Multimedia Systems andBroadcasting (BMSB), pages 1–6. IEEE, Jun. 2011.
8. Y. Huang, W. Zhou, and Y. Du. “Research on the user behavior-based QoE evaluation methodfor HTTP mobile streaming”. In 2014 Ninth International Conference on Broadband andWireless Computing, Communication and Applications (BWCCA), pages 47–51. IEEE, Nov.2014.
9. S. Yu, W. Zhou, R. Tao, and Y. Hou. “Modeling for Short-Form HTTP Adaptive Streaming Con-sidering Memory Effect”. In 2015 10th International Conference on Broadband and WirelessComputing, Communication and Applications (BWCCA), pages 82–87. IEEE, Nov. 2015.
10. A. Sideris, E. Markakis, N. Zotos, E. Pallis, and C. Skianis. “MPEG-DASH users’ QoE: Thesegment duration effect”. In 2015 Seventh International Workshop on Quality of MultimediaExperience (QoMEX), pages 1–6. IEEE, May. 2015.
11. Y. Shen, Y. Liu, N. Qiao, L. Sang, and D. Yang. “QoE-based evaluation model on videostreaming service quality”. In Globecom Workshops (GC Wkshps), 2012 IEEE, pages 1314–1318. IEEE, Dec. 2012.
12. R. Schatz, S. Egger, and K. Masuch. “The impact of test duration on user fatigue and reliabilityof subjective quality ratings”. Journal of the Audio Engineering Society, 60(1/2):63–73, Mar.2012.
13. L. You, W. Zhou, Z. Chen, and W. Wu. “A novel method to calculate QoE-oriented dynamicweights of indicators for telecommunication service”. In TENCON 2013-2013 IEEE Region10 Conference (31194), pages 1–4. IEEE, Oct. 2013.
14. M. Fiedler, T. Hossfeld, and P. Tran-Gia. “A generic quantitative relationship between qualityof experience and quality of service”. Network, IEEE, 24(2):36–41, Mar.-Apr. 2010.
15. H. Kim, D. H. Lee, J. Lee, K. Lee, W. Lyu, and S. Choi. “The QoE evaluation method through theQoS-QoE correlation model”. In Fourth International Conference on Networked Computingand Advanced Information Management, 2008. NCM’08, volume 2, pages 719–725. IEEE,Sep. 2008.
16. J. Klaue, B. Rathke, and A. Wolisz. “Evalvid–A framework for video transmission and qualityevaluation”. InModelling techniques and tools, Computer performance evaluation, pages 255–272. Springer, Sep. 2003.
17. Q. Zheng, H. Du, J. Li, W. Zhang, and Q. Li. “Open-LTE: An open LTE simulator for mobilevideo streaming”. In 2014 IEEE International Conference onMultimedia and ExpoWorkshops(ICMEW), pages 1–2. IEEE, Jul. 2014.
Chapter 6Conclusion
Abstract In this chapter, we summarize the main innovations and contributions ofthis book before future work is discussed.
6.1 Conclusion Remarks
On the basis of traditional radio resource management, we aim to develop a data-driven personalized radio resource management technology in this book, focusingon enhancing users’ QoE. The user objective/subjective information is taken intoaccount to guide wireless resource management accordingly. The main innovationsand contributions include:
(1) A user’s QoE description framework is established with comprehensive infor-mation of multi-dimensional context. A specific user tends to have a unique feelingon a particular application or service. This book provides a way to be able to utilizeuser personalized information when modeling QoE. Such personalized QoE modelis expected to be more powerful.
(2)Anarchitecture ofData-drivenPersonalizedQoEManagement is alsoproposedin this book, which consists of two modules: namely training module and controlmodule. The trainingmodule is responsible for training and tuning the user preferenceprediction model. The control module collects the data about the users and providesthe user preference instantly by using the model given by the training module. Anefficient radio resource management process is done given the predicted results.
(3) This book tends to explore how to use data-driven methods for user preferenceprediction model. Two models are used in this book including Bayesian GraphicModel and Context Aware Matrix Factorization Model, which is borrowed frommachine learning community. The experimental result demonstrates that the data-driven model is more robust and more promising in the era of big data.
(4) Resource allocation strategies based on QoE optimization are further stud-ied in this book, where QoE-based resource allocation problem is investigated fromboth non-personalized and personalized aspects. A QoE-based resource allocationalgorithm is proposed to attain suboptimal solution for QoE maximization prob-lem, providing guidance to conduct QoE-aware radio resource management. Sim-
© The Author(s) 2017Y. Wang et al., QoE Management in Wireless Networks, SpringerBriefsin Electrical and Computer Engineering, DOI 10.1007/978-3-319-42454-5_6
59

60 6 Conclusion
ulation results validate that a more refined resource allocation can be achieved bypersonalized QoE management.
(5) An experiment is conducted to collect QoE evaluationwith corresponding usersubjective information in the designed particular application scenario. With analysison users’ feedbacks, it can be summarized that these influencing factors are crucialdeterminants for the evaluation of QoE, and the effect of user preference on theperception is validated.
6.2 Future Work
Personalized QoEmanagement in mobile Internet is a promising research topic now,which is also greatly significant for radio resource management. This book providesguidance on how to utilize available user data in personalized QoE management. Ofcourse further research work should be concerned in the future studies including:
(1) More tests and experiments are necessary to validate the proposed data-drivenmodel. More QoE influencing factors including age, gender, job, mood etc. shouldbe involved. And better QoE assessment methods are preferred.
(2) In this book, the target application scenario is emphasized on the streammediaservice. Other types of services are under investigation, which possibly cause the newmodel structure, new influence factors and/or new assessment infrastructures.
(3) The objective function for QoE-oriented radio resource management ischangeable with respect to the variant of applications, communication qualities userrequirements, etc. A more resilient objective function is preferred and a set of moreefficient and effective optimization methods has to be studied.