yesterday’s fdi dependency remains today’s reality
TRANSCRIPT
March 2018MÁTÉ VERES
Yesterday’s FDI Dependency Remains Today’s RealityThe evolution of Hungary’s external trade, and the relevanceof Germany since 1990
ANALYSIS
Budapest
In 1990 Hungary decided to employ the then prevailing model of economic transition from a state run economy to one based on market principles. It entailed mass privati-zations of previously state run companies and the opening up of its borders in front of international capital without much mitigation with regards to its destination and long term objectives.
Due to lack of domestic long term strategy and policies directed at creating technolo-gical and other forms of spill-overs for the Hungarian producers, the country’s eco-nomy soon became dualistic in nature: a relatively strong, productive and competitive foreign owned and a capital-poor non-competitive domestically-owned.
The former set up factories for assembly and service centres for their international operations, while the latter merely acted as suppliers for them. In the absence of in-ternationally competitive products the Hungarian economy soon became dependent of foreign investment, whereby the large majority of exports – and thereby internatio-nal trade – was carried out between local affi liates of multinationals and their headquarters in the form of intra-fi rm trade. This model persists to date.
German investments have from the outset dominated the manufacturing sector wit-hin the Hungarian economy and as a result the country has become its most import-ant trading partner, as well as source of capital investment within the country.

2
Budapest MÁTÉ VERES | YESTERdaY’S FdI dEpEndEncY REMaInS TodaY’S REalITY
Key findings . . . . . . . . . . . . . . . . . . . . . . . . . . . . . . . . . . . . . . . . . . . . . . . . . . . . . . . . 1
Introduction . . . . . . . . . . . . . . . . . . . . . . . . . . . . . . . . . . . . . . . . . . . . . . . . . . . . . . . . 41. Hungary and trade: The first two decades . . . . . . . . . . . . . . . . . . . . . . . . . . . . . . 3
1.1 Hungarian Trade 1990 – 2010: The German Tie . . . . . . . . . . . . . . . . . . . . . . . . . . 6
2. Trade under the Second and Third Orbán governments . . . . . . . . . . . . . . . . . . . 92.1 Hungary and Trade: Since 2010 . . . . . . . . . . . . . . . . . . . . . . . . . . . . . . . . . . . . . . . . 92.2 Trade relations between Hungary and Germany under the second and third Orbán governments (2010 – 2016) . . . . . . . . . . . . . . . . . 12
3. Assessment . . . . . . . . . . . . . . . . . . . . . . . . . . . . . . . . . . . . . . . . . . . . . . . . . . . . . 18
References . . . . . . . . . . . . . . . . . . . . . . . . . . . . . . . . . . . . . . . . . . . . . . . . . . . . . . . . 21
Appendix . . . . . . . . . . . . . . . . . . . . . . . . . . . . . . . . . . . . . . . . . . . . . . . . . . . . . . . . . . 22
About the author . . . . . . . . . . . . . . . . . . . . . . . . . . . . . . . . . . . . . . . . . . . . . . . . . . . . 23
Imprint . . . . . . . . . . . . . . . . . . . . . . . . . . . . . . . . . . . . . . . . . . . . . . . . . . . . . . . . . . 23
Content

3
Budapest MÁTÉ VERES | YESTERdaY’S FdI dEpEndEncY REMaInS TodaY’S REalITY
Hungary and trade: The first two decades
Hungary’s transformation from a socialist state-run economy to one based on market principles did not go smoothly in the early 1990s. Following the fall of the Berlin Wall and the liberation of the country from Soviet rule, it immediately went into a recession with unemployment and inflation rates reaching double digits between 1991 and 1993, while GDP fell by 20% between 1989 and 1992 (KSH 1993). The reasons for this massive downturn in econom-ic activity were numerous. It was in no small part caused by the sudden disappearance of the estab-lished export markets in the rest of the Eastern bloc, especially Russia (Kornai 1994).
Since then, it has been a common saying among many Hungarian economists that “a small, open economy with no capital and know-how” has no other options but to break down its barriers to
trade and invite in as much foreign direct invest-ment (FDI) into the country as it possibly can. In no small part, this approach has led to a dominance of Western capital, especially multinational capital, within the country’s investments and economic structure in the decades that followed.
A large part of this foreign capital found its way to Hungary through privatization. According to a study by the Hungarian National Bank (MNB), between 1991 and 1997 some €4.6 billion of investment took place in the country within the framework of privatization. Half of that amount arrived in 1995 alone. The largest of these were the takeovers of gas and other energy suppliers, as well as the sale of the Hungarian Telecommunications Company (MATÁV) to the German multinational, Deutsche Telekom (MNB 2007).
Numbers with regard to the inflow of FDI into the Hungarian economy on a sectoral level are avail-
able from 1998 onwards only. According to these, the greatest part of incoming FDI went into man-ufacturing, which acquired around 40% of all for-eign investments between 1998 and 2005. Within the manufacturing sectors the automotive indus-try was the most favoured destination, reaching an investment value of €4.9 billion by 2005, while electrical machinery and equipment production also seized a sizeable part of the investments.
Furthermore, the strong dominance of West-ern capital within the Hungarian economy also stimulated structural change, heading from semi-self-sufficiency to a model dependent on FDI (Nölke & Fliegenthart 2009). This had parallel consequences on Hungary’s export structure, to a large extent mirrored, the sectoral distribution of the FDI that came to Hungary. More than 60%1 of the country’s exports came from manufacturing by 2000, yet most of this was re-exported prod-
ucts of Western multinationals which had set up their assembly platforms in Hungary.
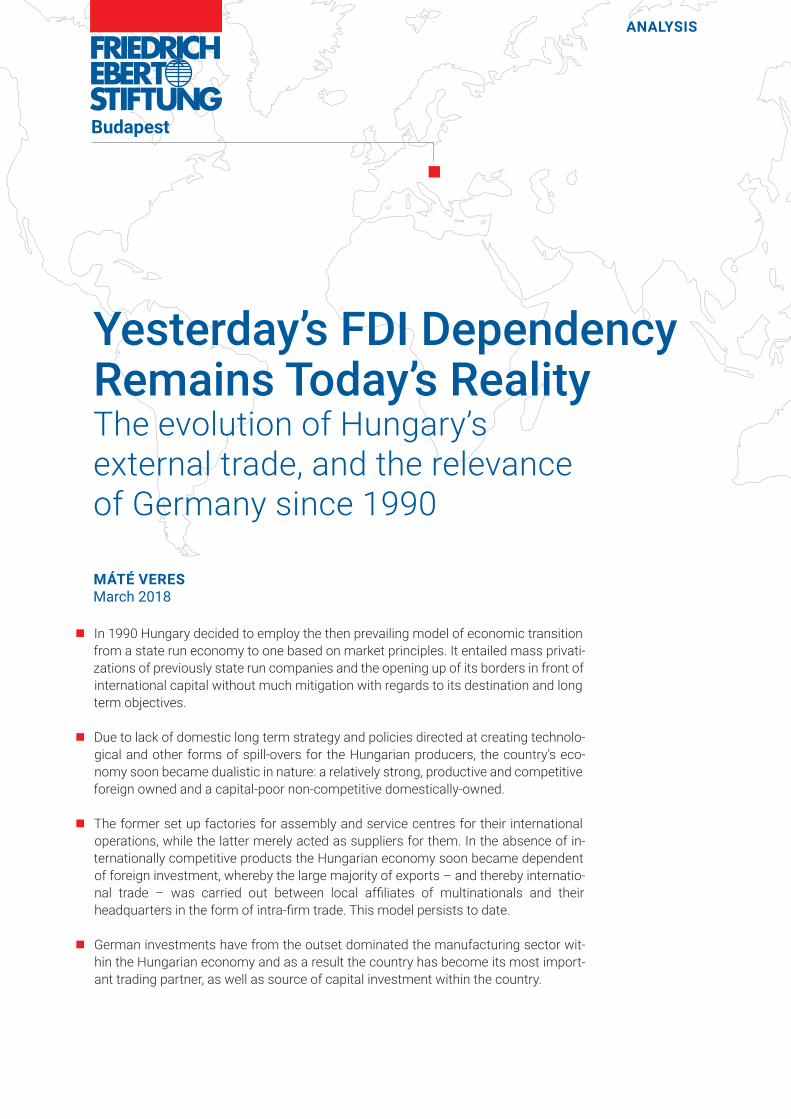
In 2000, of the exported manufactured goods with the largest shares, 12% were computers, 6.3% spark ignition engines and 5.9% cars, as well as office machine parts and vehicle parts, each rep-resenting about 2.9%.
1 Depending on how one categorizes certain metal, plastic and rubber products, the number is even higher.
Source: UN ECE Survey, no.2/2004
Table 1: Foreign direct investment to Hungary, 1990, 1992 – 2003 (million US dollar)
4
Budapest MÁTÉ VERES | YESTERdaY’S FdI dEpEndEncY REMaInS TodaY’S REalITY
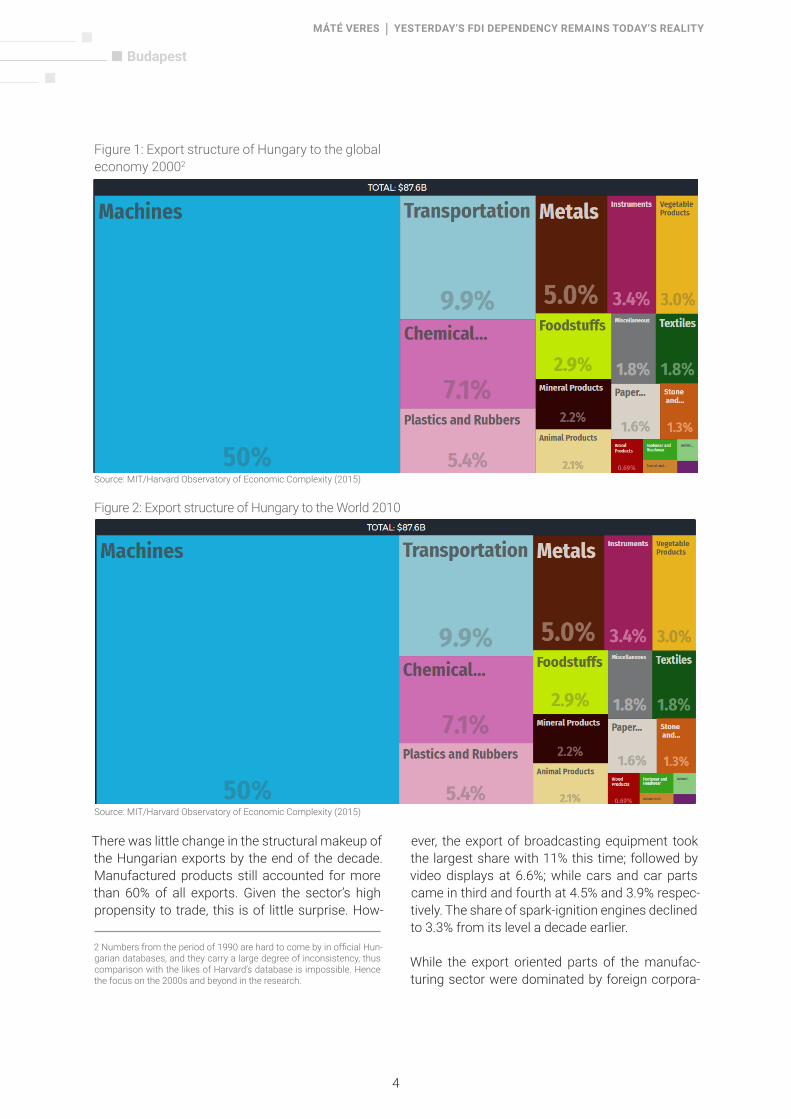
ever, the export of broadcasting equipment took the largest share with 11% this time; followed by video displays at 6.6%; while cars and car parts came in third and fourth at 4.5% and 3.9% respec-tively. The share of spark-ignition engines declined to 3.3% from its level a decade earlier.
While the export oriented parts of the manufac-turing sector were dominated by foreign corpora-
Figure2:ExportstructureofHungarytotheWorld2010
O Source:MIT/HarvardObservatoryofEconomicComplexity(2015)
Whiletheexportorientedpartsofthemanufacturingsectorweredominatedbyforeigncorpora<ons,localproducershadamuchgreaterstakeinagriculturalproduc:on.ThiswastoalargeextentduetoalandmoratoriumthatprohibitedforeignownershipofagriculturallandinHungary. Accordingtothe3
earliestavailabledata,Hungaryhasenjoyedaposi<vebalanceinitsagriculturaltradewithsimultane-ouslyincreasingimportsandexportsduringtheperiodallthroughthe2000s.Althoughstar<ngatarela-<velyhighlevelof€1.4billionin2001,thesurplussawadeclineoverthesubsequentsixyears,reachingits2001levelonlyby2007again.Nevertheless,thesector’sshareinthecountry’sexportsremainedbe-
tween7-9%intheen<reperiod.
Theprac<cewascarriedonevenarerthecountryjoinedtheEU.Infact,itmadeaspecialpactaboutitwiththe3
organiza<onthatcametoanendin2014.YettodatemostHungarianagriculturallandsaredomes<callyowned.
O5
Figure 1: Export structure of Hungary to the global economy 20002
Source: MIT/Harvard Observatory of Economic Complexity (2015)
There was little change in the structural makeup of the Hungarian exports by the end of the decade. Manufactured products still accounted for more than 60% of all exports. Given the sector’s high propensity to trade, this is of little surprise. How-
2 Numbers from the period of 1990 are hard to come by in official Hun-garian databases, and they carry a large degree of inconsistency, thus comparison with the likes of Harvard’s database is impossible. Hence the focus on the 2000s and beyond in the research.
Figure 2: Export structure of Hungary to the World 2010
Source: MIT/Harvard Observatory of Economic Complexity (2015)

5
Budapest MÁTÉ VERES | YESTERDAY’S FDI DEPENDENCY REMAINS TODAY’S REAlITY
tions, local producers had a much greater stake in agricultural production. This was to a large extent due to a land moratorium that prohibited foreign ownership of agricultural land in Hungary.3
According to the earliest available data, Hungary has enjoyed a positive balance in its agricultural trade with simultaneously increasing imports and exports during the period all through the 2000s. Although starting at a relatively high level of €1.4 billion in 2001, the surplus saw a decline over the subsequent six years, reaching its 2001 level only by 2007 again. Nevertheless, the sector’s share in the country’s exports remained between 7-9% in the entire period.
In spite of the strong interlink between the heavy infl ow of FDI and Hungary‘s exports fi gure 4 shows that the country’s balance of trade4 was negative for most of the 1990s and 2000s. In ad-
3 The practice was carried on even after the country joined the EU. In fact, it made a special pact about it with the organization that came to an end in 2014. Yet to date most Hungarian agricultural lands are domestically owned.4 The balance of trade (BOT) is the difference between a country’s im-ports and its exports for a given time period. The balance of trade is the largest component of the country›s balance of payments (BOP).
Figure3:HungarianAgriculturalTrade2001–2009,(millionEUR,currentprices)
O Source:KSH(2017d)
In spiteof thestrong interlinkbetween theheavy inflowofFDIandHungary‘sexportsfigure4showsthatthecountry’sbalanceoftrade wasnega:veformostofthe1990sand2000s.Inaddi<on,priorto4
the2008financialcrisisin2006,thegovernmenthadtointroduceausteritymeasurestobalanceitsevergrowingbudgetdeficit.Localproducerswerealsoforcedtomakecutbacksontheirexpenditures,henceinvestmentsfellsharply,whichnega<velyimpactedthevolumeofHungarianforeigntrade,leadingtoadeclineatbothends: importsandexports. Inspiteof this, thecountry’s tradebalancesoonbegantoturnposi:veand,prior to the2010takeoverof thesecondOrbángovernment, itwasatanall-<mehigh.Therewereseveralinterlinkingfactorsatplaythatshouldhelpexplainthereasonsbehindthis.Onewasthedropininterna<onalenergyprices,especiallycrudeoil.Thesecondwasthesignificantlylargerdropinthecountry’simportfiguresthanitsexports:invaluetermsHungarianexportswereinfactlowerat€70billion in2009, thanat€85.7billion in2008,however thecorresponding importfigures,€85.4billionfor2008,and€66billionfor2009allowedforasubstan<alincreaseinthetradebalance.Finally,closelyconnectedtothesecondreason,itwasin2009whenAudibegantoproduceandexportitscarsinGyőr,aHungariancityclosetotheborderofAustria.
'-
1250
2500
3750
5000
2001 2002 2003 2004 2005 2006 2007 2008 2009
ImportExport
The balance of trade (BOT) is the difference between a country's imports and its exports for a given time period. 4
The balance of trade is the largest component of the country's balanceofpayments (BOP).
O6
dition, prior to the 2008 fi nancial crisis in 2006, the government had to introduce austerity measures to balance its ever growing budget defi cit. Local producers were also forced to make cutbacks on their expenditures, hence investments fell sharply, which negatively impacted the volume of Hungari-an foreign trade, leading to a decline at both ends: imports and exports. In spite of this, the country’s trade balance soon began to turn positive and, prior to the 2010 takeover of the second Orbán government, it was at an all-time high. There were several interlinking factors at play that should help explain the reasons behind this. One was the drop in international energy prices, especially crude oil. The second was the signifi cantly larger drop in the country’s import fi gures than its exports: in value terms Hungarian exports were in fact lower at €70 billion in 2009, than at €85.7 billion in 2008, how-ever the corresponding import fi gures, €85.4 bil-lion for 2008, and €66 billion for 2009 allowed for a substantial increase in the trade balance. Finally, closely connected to the second reason, it was in 2009 when Audi began to produce and export its cars in Győr, a Hungarian city close to the border of Austria.
Figure 3: Hungarian Agricultural Trade 2001 – 2009, (million EUR, current prices)
Source: KSH (2017d)

6
Budapest MÁTÉ VERES | YESTERDAY’S FDI DEPENDENCY REMAINS TODAY’S REAlITY
Hungarian Trade 1990 – 2010:The German Tie
No analysis of Hungary’s trade relations any time since the end of the Soviet Union would be com-plete without paying special attention to Germany. As we shall see in the paragraphs and chapters to follow, Germany has played a dominant role on all fronts of the country’s economy.
Starting with FDI, when breaking down to the country level, FDI originating from Germany rep-resented by far the largest share of the FDI in-fl ow from the outset. The earliest country-level breakdown is only provided from 1998 by the Hungarian Statistical Offi ce (KSH). According to that, German companies were responsible for a staggering 41% of all FDI that came into Hungary. The second most signifi cant country of origin, the Netherlands, only took up 14% of the same pie.
As evidenced by Figure 6, the size of German in-vestments in the incoming FDI grew every year from 1990 onwards. During the fi rst decade (1991
– 2002), Germany’s end of the year stock of FDI to Hungary increased more than 30 fold, while during the decade that followed (2002 – 2012) it almost doubled once again, reaching €16.2 billion by 2012.
Figure4:BalanceofTradeforHungary1990–2009(millionEUR)
O Source:MNB(2017)
1.1. HungarianTrade1990–2010:TheGermanTie
NoanalysisofHungary’straderela<onsany<mesincetheendoftheSovietUnionwouldbecompletewithoutpayingspecialaHen<ontoGermany.Asweshallseeintheparagraphsandchapterstofollow,Germanyhasplayedadominantroleonallfrontsofthecountry’seconomy.
Star<ngwithFDI,whenbreakingdowntothecountrylevel,FDIorigina<ngfromGermanyrepresentedbyfarthelargestshareoftheFDI inflowfromtheoutset.Theearliestcountry-levelbreakdownisonlyprovided from 1998 by the Hungarian Sta<s<cal Office (KSH). According to that,German companieswereresponsible forastaggering41%ofallFDI thatcame intoHungary.Thesecondmostsignificantcountryoforigin,theNetherlands,onlytookup14%ofthesamepie.
Figure5:Top5countrieswithlargestshareofFDItoHungaryin1998
-3000,0
-2000,0
-1000,0
0,0
1000,0
2000,0
3000,0
4000,0
1995 1996 1997 1998 1999 2000 2001 2002 2003 2004 2005 2006 2007 2008 2009
O7
O Source:KSH(2017a)
AsevidencedbyFigure6,thesizeofGermaninvestmentsintheincomingFDIgreweveryyearfrom1990onwards.Duringthefirstdecade(1991–2002),Germany’sendoftheyearstockofFDItoHungaryin-creasedmorethan30fold,whileduringthedecadethatfollowed(2002–2012)italmostdoubledonceagain,reaching€16.2billionby2012.
Figure6:FDIfromGermanytoHungary1991–2012
Others23%
USA7%
Germany41%
Netherlands14%
France6%Austria
9%
O8
Figure 4: Balance of Trade for Hungary1990 – 2009 (million EUR)
Source: MNB (2017)
Figure 5: Top 5 countries with largestshare of FDI to Hungary in 1998
Source: KSH (2017a)
1995 1997 1999 20011996 1998 2000 2002 2003 2004 2005 2006 2007 2008 2009

7
Budapest MÁTÉ VERES | YESTERdaY’S FdI dEpEndEncY REMaInS TodaY’S REalITY
Hungarian exports soon reoriented from the East to the West. The reasons behind this were nu-merous. Markets in the territories of the former Soviet empire collapsed after 1990, and formerly established economic ties within Eastern Europe fell prey to that. This also meant that freely avail-able capital, both for imports and foreign invest-ments, was largely missing in the East, thus Hun-garian exporters had to find new markets to sell their products which capital-rich Western markets were ready to absorb. In the meantime, there was an ever increasing inflow of foreign investments to the Hungarian market from the West. However, the ones directed into the manufacturing sector – that received the largest share – were utilized for the construction of production sites, where pre-made parts of machines and vehicles were as-sembled and then exported back to their countries of origin. It is by no means a surprise then that Germany, with the largest share of investments, was also the largest absorber of exports originat-ing from Hungary. In sum, while due to somewhat different motivations that are listed here, export producers within the Hungarian market – whether they be domestic or foreign – targeted the West with their products first and foremost.
The most exported manufactured good mirrored the trade model outlined above. Of the manufac-tured goods spark-ignition engines (14%) and car (10%) exports were alone responsible for one third of the items exported within the sector’s share. Other notable mentions are office ma-chine parts (5.9%), computers (4.8%), and vehicle parts (3.9%).
OSource:DeutscheBundesbank(2017)
HungarianexportssoonreorientedfromtheEasttotheWest.Thereasonsbehindthiswerenumerous.Markets in the territories of the former Soviet empire collapsed arer 1990, and formerly establishedeconomic<eswithinEasternEuropefellpreytothat.Thisalsomeantthatfreelyavailablecapital,bothfor importsand foreign investments,was largelymissing in theEast, thusHungarianexportershad tofindnewmarketstoselltheirproductswhichcapital-richWesternmarketswerereadytoabsorb.Inthemean<me,therewasaneverincreasinginflowofforeigninvestmentstotheHungarianmarketfromtheWest.However,theonesdirectedintothemanufacturingsector–thatreceivedthelargestshare–wereu<lizedfortheconstruc<onofproduc<onsites,wherepre-madepartsofmachinesandvehicleswereassembledand thenexportedback to their countriesoforigin. It isbynomeansa surprise then thatGermany,withthelargestshareofinvestments,wasalsothelargestabsorberofexportsorigina<ngfromHungary. In sum,while due to somewhat differentmo<va<ons that are listed here, export producerswithin the Hungarianmarket – whether they be domes<c or foreign – targeted theWest with theirproductsfirstandforemost.
Themostexportedmanufacturedgoodmirroredthetrademodeloutlinedabove.Ofthemanufacturedgoods spark-igni<onengines (14%)andcar (10%)exportswerealone responsible forone thirdof theitemsexportedwithinthesector’sshare.Othernotablemen<onsareofficemachineparts(5.9%),com-puters(4.8%),andvehicleparts(3.9%).
Figure7:ExportstructureofHungarytoGermany2000
0
4500
9000
13500
18000
1991 1993 1995 1997 1999 2001 2003 2005 2007 2009 2011
O9
Figure 6: FDI from Germany to Hungary 1991 – 2012
Source: Deutsche Bundesbank (2017)

8
Budapest MÁTÉ VERES | YESTERdaY’S FdI dEpEndEncY REMaInS TodaY’S REalITY
OSource:MIT/HarvardObservatoryofEconomicComplexity(2015)
Duringthetenyearsbetween2000and2010andprimarilyundertheleadershipoftwoliberal/socialistcoali<ongovernmentsoftheerathatfollowed,nosignificantchangeshadtakenplaceinthecountry’sexportstructureasevidencedbyFigure8.In2010,s<llmorethanhalfofallexportscamefrommanu-facturing(67%)withmostofitproducedbysubsidiariesofforeignmul<na<onals. Vehicleproduc<onrelatedgoodscon<nued todominateHungarianexports toGermanyat theendofthedecadeaswell.Vehiclepartsalonecovered7.3%,followedbyspark-igni<onenginesat6.8%,com-bus<onenginesat6.6%andcarsat6.2%(withastronglinkbetweenthetwo).
Figure8:ExportstructureofHungarytoGermany2010
O Source:MIT/HarvardObservatoryofEconomicComplexity(2015)
O10During the ten years between 2000 and 2010 and primarily under the leadership of two liberal/social-ist coalition governments of the era that followed, no significant changes had taken place in the coun-try’s export structure as evidenced by Figure 8. In 2010, still more than half of all exports came from manufacturing (67%) with most of it produced by subsidiaries of foreign multinationals.
Vehicle production related goods continued to dominate Hungarian exports to Germany at the end of the decade as well. Vehicle parts alone covered 7.3%, followed by spark-ignition engines at 6.8%, combustion engines at 6.6% and cars at 6.2% (with a strong link between the two).
OSource:MIT/HarvardObservatoryofEconomicComplexity(2015)
Duringthetenyearsbetween2000and2010andprimarilyundertheleadershipoftwoliberal/socialistcoali<ongovernmentsoftheerathatfollowed,nosignificantchangeshadtakenplaceinthecountry’sexportstructureasevidencedbyFigure8.In2010,s<llmorethanhalfofallexportscamefrommanu-facturing(67%)withmostofitproducedbysubsidiariesofforeignmul<na<onals. Vehicleproduc<onrelatedgoodscon<nued todominateHungarianexports toGermanyat theendofthedecadeaswell.Vehiclepartsalonecovered7.3%,followedbyspark-igni<onenginesat6.8%,com-bus<onenginesat6.6%andcarsat6.2%(withastronglinkbetweenthetwo).
Figure8:ExportstructureofHungarytoGermany2010
O Source:MIT/HarvardObservatoryofEconomicComplexity(2015)
O10
Figure 7: Export structure of Hungary to Germany 2000
Source: MIT/Harvard Observatory of Economic Complexity (2015)
Source: MIT/Harvard Observatory of Economic Complexity (2015)
Figure 8: Export structure of Hungary to Germany 2010

9
Budapest MÁTÉ VERES | YESTERdaY’S FdI dEpEndEncY REMaInS TodaY’S REalITY
Trade under the Second and Third Orbán governments
Hungary and Trade: Since 2010
When the second Orbán government took over in 2010, the Hungarian economy just came out from its worst crisis since beginning of the 1990s. Hit hard by the international financial crisis, the economy went into recession in 2009 with real GDP contracting by more than 6% compared to the previous year. As it was shown in the previous section trade had also contracted both in volume and value terms, however at least in combination, due to some favourable cir-cumstances (energy prices and Audi’s exports), the country was able to achieve positive trade balance after two decades of continued deficits.
Seemingly, FDI inflow was constant under the new government, although at a relatively low level in a historic perspective on average when compared against the average of the five years before the takeover of the new government in 2010. Howev-er, net FDI converged closer to zero. This fact was highlighted by GKI’s calculations. According to them, the country’s capital stock only increased due to government requirements from the bank-ing industry to recapitalize their subsidiaries in the country from 2009 onwards. To this end, the hold-ing banks transferred large sums of money to their domestic banks, yet they were kept in the vault and not lent out. Should we subtract these from the positive balance of inward FDI, the difference be-tween incoming and outgoing FDI would be closer to zero (GKI 2015: 26). However, an increase is like-ly to take place in the near future due to the opening of Apollo Tyres’ Factory and the additional €1 billion that Mercedes will invest in Hungary.
In spite of the availability of more recent data on the levels of FDI to Hungary, it is important to use the 2014 figures due to an important analysis the Hun-garian National Bank carried out for that year (MNB
2016). The bank compared the country of origin and the “ultimate controlling parents”5 (UCP) for the same inward FDI to Hungary. In the former’s case we con-sider only the last country where the investment (or other forms of capital injection) came from, however when the UCP is applied to the same data the real owner (controller) of a given company is considered to be the source of the investment. Thus, for exam-ple when a subsidiary of a German owned compa-ny in the Netherlands decided to invest in Hungary, it would be considered as German investment in the data. This is a useful tool to weed out countries that are primarily used by foreign investors for tax purposes instead of commercial reasons. This is especially visible for Luxemburg that makes into the top 5 in the classical chart, yet it gets replaced by the likes of Israel and the USA in the chart based on the UCP. According to the estimates by MNB for 2014, the largest contributor was Germany, whose share was even higher by 3% points when calculated by using the UCP numbers. In value terms, this dif-ference is rather significant. This difference can be seen in Figure 9, with shares based on the classical calculations on the left, while the updated method in the right pie chart.
When FDI is measured in the classical manner, German investments for example totalled at €18.7 billion for 2014, whereas it reached €21.5 billion when its calculations were based on the UCP, with the gross total from all countries standing at €81.7 billion. What becomes evident is that while other countries may lose significance if we change the way we measure the origin of foreign investments, Germany always comes out on top, and by some distance proving its continuing dominance in the Hungarian economy in this regard as well.
5 We consider the ultimate controlling parent to be the firm at the top of the ownership chain, i.e. one that is not controlled by any other entity. It is important to highlight this distinction because as a 2008 OECD report claims the “direct investor could be a parent of a non-resident enterprise and, at the same time, it could be a direct investment enterprise or a fellow enterprise of another non-resident enterprise. This implies that a direct investment enterprise may itself be a direct investor, and vice versa”. (OECD, 2008:23)
2008 2009 2010 2011 2012 2013 2014 20153,087 1,289 1,232 1,557 3,942 1,926 4,989 2,058
Source: MNB (2017)
Table 2: Foreign Direct Investment to Hungary 2010 – 2016 (million EUR)

10
Budapest MÁTÉ VERES | YESTERDAY’S FDI DEPENDENCY REMAINS TODAY’S REAlITY
The Hungarian economy’s continued reliance on FDI is made perfectly visible if we consider the data provided by the Eurostat, known as Foreign Affi liates Statistics (FATS). In short, FATS helps us determine the extent to which foreign-con-trolled enterprises penetrate a given economy within the EU beyond the levels FDI can. Figure 10 clearly shows that in the case of Hungary, foreign owned companies play a major role in the domes-tic economy. In spite of covering only 3.6% of the more than 500 000 businesses in the country, they were responsible for 52.8% of all turnover, 57.4% of production value, 52.7% of value added, 40.2% of gross operating surplus, and 26.4% of employ-ment.
In addition, it should be highlighted that in the en-tirety of the EU, around a quarter (23-24%) of the value added was produced by foreign owned com-panies between 2010 and 2013. In Hungary, this ratio was between 49-52%, the second highest value in the EU after Ireland.
According to a study conducted by the National Statistical Offi ce of Hungary (KSH, 2016b), the size of the value added reached €2.7 million in 2014. Measured in current prices, the subsidiaries of foreign companies’ combined growth (11%) in this regard exceeded that of the domestic busi-nesses by 0.9%. Foreign owned subsidiaries were responsible for more than two thirds of the value added in three main sectors: manufacturing (pro-cessing), trade and information, and telecommu-
Figure9:Top5countrieswithlargestshareofgrossFDItoHungaryvslargestshareofFDIbasedonUCPtoHungary2014
O O
Source:MNB(2014)
TheHungarian economy’s con<nued reliance on FDI ismade perfectly visible ifwe consider the dataprovidedbytheEurostat,knownasForeignAffiliatesSta:s:cs(FATS).Inshort,FATShelpsusdeterminetheextenttowhichforeign-controlledenterprisespenetrateagiveneconomywithintheEUbeyondthelevelsFDIcan.Figure10clearlyshowsthatinthecaseofHungary,foreignownedcompaniesplayama-jorroleinthedomes:ceconomy.Inspiteofcoveringonly3.6%ofthemorethan500000businessesinthecountry,theywereresponsiblefor52.8%ofallturnover,57.4%ofproduc<onvalue,52.7%ofvalueadded,40.2%ofgrossopera<ngsurplus,and26.4%ofemployment.
Inaddi<on,itshouldbehighlightedthatintheen<retyoftheEU,aroundaquarter(23-24%)ofthevalueaddedwasproducedbyforeignownedcompaniesbetween2010and2013. InHungary, thisra<owasbetween49-52%,thesecondhighestvalueintheEUarerIreland.
Figure10:Shareofforeigncontrolledsubsidiariesindomes:cbusinessperformanceinHungary2014
Source:Eurostat(FATS2017)
36%
23%
12%
15%
4%10%
Austria UnitedKingdomNetherlands LuxemburgGermany Other
33%
12%19%
26%
5%6%
Austria France Germany USAIsrael Other
O13
Source: Eurostat (FATS 2017)
Figure 9: Top 5 countries with largest share of gross FDI to Hungary vs largest share of FDI based on UCP to Hungary 2014
Source: MNB (2014)
Figure 10: Share of foreign controlled subsidiaries in domestic business performance in Hungary 2014

11
Budapest MÁTÉ VERES | YESTERdaY’S FdI dEpEndEncY REMaInS TodaY’S REalITY
nications technology. From this study’s perspec-tive manufacturing is the most relevant since it possesses the highest propensity to trade. For-eign owned subsidiaries created more than 70% of the value added in the sector in 2014. In this re-gard, similarities from the perspective of trade be-tween previous years/decades and the time under the second and third Orbán governments become even more prominent, given the structure of the products that Hungary exports to the world. When we consider the two largest product categories, the overlap is almost complete: in 2000 (mid-way through the first Orbán government) and in 2010 more than 60% Hungary’s all export to the world came from manufacturing, while in 2015 the sec-tors share stood at 58%.6 The overlap between the products of foreign multinationals and types exported goods suggests that there is a large de-gree of commonality between the two.
This paper has already established why there is lit-tle to be surprised about the dominance of manu-facturing in trade. However, its main components for the Hungarian export shares shifted once again by the end of 2015. The vehicle producing sector not only remained prominent, but this time car ex-ports took up the largest share of all exports with
6 Once again excluding the likes of plastics and rubber production, transportation and even chemical products. Even though many of the sector’s produce should belong to manufacturing.
12%, they were followed by vehicle parts at 5.2%, and spark-ignition engines with 3.3%. Although the chemical industry was not calculated in this paper within the manufacturing sector, pharma-ceuticals that took the fourth place with 3.2% are certainly part of it and relatively newcomers of an increasingly significant export sector, with the en-tire industry having been responsible for almost 8% of all exports in 2015.
Closely connected to those above is the relation-ship of the EU structural funds and their impact on the country’s trade. The GKI study goes on to explain that the absence of capital in the first five years of the second and third Orbán government was entirely substituted from the money that the country received from the EU’s structural funds.
According to estimates by KPMG-GKI the first round of EU funds that the country received be-tween 2007 and 2015 also had an important role to play in the country’s real trade. Without them in 2015 import and export would have been small-er by 8.2% and 7.8% respectively. The Hungarian trade balance would have been approximately €320 billion higher without the funds, due to im-port intensive investments that domestic busi-nesses made from the money that came from the EU (KPMG & GKI 2016).
AccordingtoastudyconductedbytheNa<onalSta<s<calOfficeofHungary(KSH,2016b),thesizeofthevalueaddedreached€2.7millionin2014.Measuredincurrentprices,thesubsidiariesofforeigncom-panies’combinedgrowth(11%)inthisregardexceededthatofthedomes<cbusinessesby0.9%.Foreignownedsubsidiarieswereresponsibleformorethantwothirdsofthevalueaddedinthreemainsectors:manufacturing (processing), trade and informa<on, and telecommunica<ons technology. From thisstudy’sperspec<vemanufacturingisthemostrelevantsinceitpossessesthehighestpropensitytotrade.Foreignownedsubsidiariescreatedmorethan70%ofthevalueaddedinthesectorin2014.Inthisre-gard,similari<esfromtheperspec<veoftradebetweenpreviousyears/decadesandthe<meunderthesecondandthirdOrbángovernmentsbecomeevenmoreprominent,giventhestructureoftheproductsthatHungaryexportstotheworld.Whenweconsiderthetwolargestproductcategories,theoverlapisalmost complete: in2000 (mid-way through thefirstOrbángovernment)and in2010more than60%Hungary’s all export to theworld came frommanufacturing,while in2015 the sectors share stoodat58%. Theoverlapbetween theproductsof foreignmul<na<onalsand typesexportedgoodssuggests6
thatthereisalargedegreeofcommonalitybetweenthetwo.
ThispaperhasalreadyestablishedwhythereisliHletobesurprisedaboutthedominanceofmanufac-turingintrade.However,itsmaincomponentsfortheHungarianexportsharesshiredonceagainbytheendof2015.Thevehicleproducingsectornotonlyremainedprominent,butthis<mecarexportstookupthelargestshareofallexportswith12%,theywerefollowedbyvehiclepartsat5.2%,andspark-igni-<onengineswith3.3%.Althoughthechemicalindustrywasnotcalculatedinthispaperwithintheman-ufacturingsector,pharmaceu<calsthattookthefourthplacewith3.2%arecertainlypartofitandrela-<velynewcomersof an increasingly significantexport sector,with theen<re industryhavingbeen re-sponsibleforalmost8%ofallexportsin2015.
Figure11:ExportstructureofHungarytotheworld2015
O Source:MIT/HarvardObservatoryofEconomicComplexity(2015)
Onceagainexcludingthelikesofplas<csandrubberproduc<on,transporta<onandevenchemicalproducts.Even6
thoughmanyofthesector’sproduceshouldbelongtomanufacturing.
O14
Source: MIT/Harvard Observatory of Economic Complexity (2015)
Figure 11: Export structure of Hungary to the world 2015

12
Budapest MÁTÉ VERES | YESTERDAY’S FDI DEPENDENCY REMAINS TODAY’S REAlITY
Hungary’s trade balance not only remained pos-itive all through the years after 2010 but also in-creased year by year. The country’s surplus against the EU-15 was at €5.9 billion, whereas against the V3 countries at €4.1 billion.
Measured from the start of the infl ow of the EU funds the country’s export rose from €68.9 billion in 2006 to €91.3 billion in 2015. This a 4.2% rise on a yearly average.
Imports in 2006 were at €68.9 billion, yet by 2015 they rose by 40.6% to €82.6 billion. This corre-sponds to a 3.1% rise on a yearly average.
Agricultural trade continued to produce an ev-er-greater trade surplus until 2012, however it has been diminishing somewhat since. Imports and exports in the sector rose simultaneously, contributing to the trade surplus signifi cantly. On average, the sector has contributed 8.7% to the Hungarian exports since 2010, and 5.9% to its imports. The main export partners in 2015 in order were: Germany (14.8%), Romania (12.3%), and Austria (9.1%). While Hungary imported the greatest parts of its agricultural produce from: Germany (20%), Poland (10.9%), and Slovakia (9.9%) (KSH 2016a).
Trade relations between Hungary and Germany under the second and third Orbán governments (2010 – 2016)
As it was highlighted in the previous chapter, Ger-many became the most important trade partner of Hungary early on after the change of regimes in 1990. The country’s prominence in the Hungarian economy has diminished somewhat since then but remains to be the primary external market for Hungary for both imported and exported prod-ucts. Highlighted in the two pie charts of Figure 14, Hungary has certainly increased its economic activity with its immediate neighbours at the ex-pense of some of the Western nations, yet Ger-
Closelyconnectedtothoseaboveistherela<onshipoftheEUstructuralfundsandtheirimpactonthecountry’strade.TheGKIstudygoesontoexplainthattheabsenceofcapitalinthefirstfiveyearsofthesecondandthirdOrbángovernmentwasen<relysubs<tutedfromthemoneythatthecountryreceivedfromtheEU’sstructuralfunds. According toes:mates by KPMG-GKI the first round ofEU funds that the country received between2007and2015alsohadanimportantroletoplayinthecountry’srealtrade.Withoutthemin2015im-portandexportwouldhavebeensmallerby8.2%and7.8%respec<vely.TheHungariantradebalancewouldhavebeenapproximately€320billionhigherwithoutthe funds,dueto import intensive invest-mentsthatdomes<cbusinessesmadefromthemoneythatcamefromtheEU(KPMG&GKI2016). Hungary’stradebalancenotonlyremainedposi<veallthroughtheyearsarer2010butalsoincreasedyearbyyear.Thecountry’ssurplusagainsttheEU-15wasat€5.9billion,whereasagainsttheV3coun-triesat€4.1billion. Measured fromthestartof the inflowof theEU funds thecountry’sexport rose from€68.9billion in2006to€91.3billionin2015.Thisa4.2%riseonayearlyaverage. Importsin2006wereat€68.9billion,yetby2015theyroseby40.6%to€82.6billion.Thiscorrespondstoa3.1%riseonayearlyaverage.
Figure12:BalanceofTradeforHungary2010–2015(millionEUR)
O Source:MNB(2017)
0,0
2500,0
5000,0
7500,0
10000,0
2010 2011 2012 2013 2014 2015
O15
Agricultural tradecon<nuedtoproduceanever-greater tradesurplusun<l2012,however ithasbeendiminishingsomewhatsince.Importsandexportsinthesectorrosesimultaneously,contribu<ngtothetradesurplussignificantly.Onaverage,thesectorhascontributed8.7%totheHungarianexportssince2010,and5.9%toitsimports.Themainexportpartnersin2015inorderwere:Germany(14.8%),Roma-nia (12.3%),andAustria (9.1%).WhileHungary imported thegreatestpartsof itsagriculturalproducefrom:Germany(20%),Poland(10.9%),andSlovakia(9.9%)(KSH2016a).
Figure13:HungarianAgriculturalTrade2001–2009(millionEUR,currentprices)
O Source:KSH(2017d)
2.2. TraderelationsbetweenHungaryandGermanyunderthesecondandthirdOrbángovernments(2010–2016)
As itwas highlighted in the previous chapter, Germany became themost important trade partner ofHungaryearlyonarerthechangeofregimesin1990.Thecountry’s prominenceintheHungarianecon-omyhasdiminishedsomewhatsincethenbutremainstobetheprimaryexternalmarketforHungaryforbothimportedandexportedproducts.HighlightedinthetwopiechartsofFigure14,Hungaryhascer-tainly increased its economic ac<vity with its immediate neighbours at the expense of some of theWesternna<ons,yetGermanycon<nues toabsorbmore thanaquarterof thecountry’s exports (thenextfour largestexportmarketsofthecountrycanonlyboastwithsuchlargesharewhencombined),andequallyaquarterofHungary’s imports werefromGermanyin2015.TranslatedintoEuros,thevalueofHungarianexport toGermanywas€24.6billion,while its imports reached€21.4billion.This repre-sentedanoverallposi<vetradebalancefromtheperspec<veofHungarywithasurplusof€3.2billion.
'-
1750
3500
5250
7000
2010 2011 2012 2013 2014 2015 2016
ImportExport
O16
Figure 12: Balance of Trade for Hungary2010 – 2015 (million EUR)
Source: MNB (2017)
Figure 13: Hungarian Agricultural Trade 2001 – 2009 (million EUR, current prices)
Source: KSH (2017d)

13
Budapest MÁTÉ VERES | YESTERdaY’S FdI dEpEndEncY REMaInS TodaY’S REalITY
many continues to absorb more than a quarter of the country’s exports (the next four largest export markets of the country can only boast with such large share when combined), and equally a quar-ter of Hungary’s imports were from Germany in 2015. Translated into Euros, the value of Hungar-ian export to Germany was €24.6 billion, while its imports reached €21.4 billion. This represented an overall positive trade balance from the perspec-tive of Hungary with a surplus of €3.2 billion.
Figure 14: Top 5 export partners of Hungary (above) and Top 5 import partners of Hungary (below) 20157
Source: KSH (2017b)
7 While there is lack of data available the fact that 53% of total exports to Slovakia and 58% to Poland included machines (primarily engines and engine parts) and transportation goods (cars and vehicle parts) in 2015 (MIT Observatory of Economic Complexity 2015), in the absen-ce of domestically owned car manufacturing conglomerates in either countries it is understood that a large share of Hungary’s export to its neighbours to the North (Slovakia and Poland) are ultimately directed to German subsidiaries as well. German owned companies have been active importers of the products of Hungarian suppliers due to their si-milar needs.
Figure14:Top5exportpartnersofHungary(lei)andTop5importpartnersofHungary(right)2015 7
O
O Source:KSH(2017b)
Italy5%Austria
5%Slovakia5%
Romania5%
Germany27%
Others53%
China5%Slovakia
5%Poland6%
Aus:ra7%
Germany26%
Other51%
Whilethereislackofdataavailablethefactthat53%oftotalexportstoSlovakiaand58%toPolandincludedma7 -chines(primarilyenginesandengineparts)andtransporta<ongoods(carsandvehicleparts)in2015(MITObserva-tory of Economic Complexity 2015), in the absence of domes<cally owned carmanufacturing conglomerates ineithercountriesitisunderstoodthatalargeshareofHungary’sexporttoitsneighbourstotheNorth(SlovakiaandPoland)areul<matelydirected toGermansubsidiariesaswell.Germanownedcompanieshavebeenac<ve im-portersoftheproductsofHungariansuppliersduetotheirsimilarneeds.
O17
In addition, it should be noted that while, there was a general decline taking place in the overall share of goods and services exported to Germany – partly explained by the 2008 crisis – under the governments preceding the second Orbán regime between 2011 – 2016, the latest data suggests, however, that it has been slowly but progressively climbing back to its pre-crisis levels. The same is true for imports as evidenced by Figures 15 and 16. However, in volume there was a constant in-crease taking place from the early 2000s onwards. In 2001 exports to Germany totalled at €9.4 mil-lion, while they grew to €18.7 million by 2008. The crisis took its toll on this continued increase with Hungary’s exports to Germany dropping to €13.7 million in value in 2009, and only in 2013 did it climb back to its pre-crisis level with €18.6 million, however by 2015 it reached a record high of €21.4 million.

14
Budapest MÁTÉ VERES | YESTERdaY’S FdI dEpEndEncY REMaInS TodaY’S REalITY
Figure15:PercentageoftheHungarianexporttoGermany(2006–2016)
O Source:Desta<s(2017)
Figure16:PercentageoftheHungarianimportfromGermany(2006–2016)
O
Source:Desta<s(2017)
Structuralsimilari<esbetweenadecade(andmore)earlierandcurrentdataaretherenotonly in thefieldsofexportsandimportsbutothertraderelatedaspectsoftheeconomyaswell.This isespeciallycogentforGermany’sshareofgrossFDIcomingtoHungary.Justlikein1998,Germanycon:nuestobethemostimportantsourceofforeigninvestmentinHungarytodatewith24%ofallFDIcomingfromthecountry.
23,0%
24,8%
26,5%
28,3%
30,0%
2006 2007 2008 2009 2010 2011 2012 2013 2014 2015 2016
27,5%27,2%
27,5%
25,9%
25,0%24,8%25,1%
25,6%
26,6%
28,4%
29,5%
22,0%
23,5%
25,0%
26,5%
28,0%
2006 2007 2008 2009 2010 2011 2012 2013 2014 2015 2016
26,4%26,2%
25,4%25,0%
24,6%
23,8%24,0%
24,8%
25,5%
26,8%27,3%
O19
Source: Destatis (2017)
31% of the revenues, 29% of value added and also 29% of the employment was provided by business-es with German ownership – the highest in each category, not counting domestic businesses. Ger-man subsidiaries were most prominently repre-sented in automobile production, energy, telecom-munications and machinery production sectors of the Hungarian economy. Combined, these four sectors covered 77% of their revenues and two thirds of their value added (KSH 2016). It is there-fore of little surprise that on the level of tradeables,
Structural similarities between a decade (and more) earlier and current data are there not only in the fields of exports and imports but other trade related aspects of the economy as well. This is especially cogent for Germany’s share of gross FDI coming to Hungary. Just like in 1998, Germa-ny continues to be the most important source of foreign investment in Hungary to date with 24% of all FDI coming from the country.
In 2014 of the subsidiaries of foreign companies
Figure 15: Percentage of the Hungarian export to Germany (2006 – 2016)
Figure 16: Percentage of the Hungarian import from Germany (2006 – 2016)
Source: Destatis (2017)

15
Budapest MÁTÉ VERES | YESTERdaY’S FdI dEpEndEncY REMaInS TodaY’S REalITY
exports from Hungary to Germany also resembled this trend. As Figure 17 illustrates, 71% of Hungary’s exports to Germany also consisted of machines and items of transportation – which represents an almost identical overall structure to the one fifteen years earlier, when the two sectors were responsi-ble for 72% of Hungarian exports to Germany.
On a regional level, Germany’s western regions far outweighed its eastern parts. In fact, im-ports from East Germany only fell in the decade and half between 2000 and 2016 going from €1 269 to €1 188 million. In the meantime, imports from Western Germany more than doubled from €9 880 in 2010 to €23 289 million by 2016. The most important German regions from the per-spective of both imports and exports for Hungary remained the same over the 16 years under inves-tigation: Baden-Wuerttemberg, Bavaria and North Rhine-Westphalia.8,9
The Orbán government maintained a practice that by and large contributed to this structural consist-ency in the Hungarian economy’s output. Govern-ments before and especially under the second and third Orbán governments have signed con-tracts with – primarily – foreign multinationals
8 For further details see appendix, Table 3.9 Unfortunately, the Hungarian statistical office or Central Bank leads no such record about the Hungarian regions or counties and its trade partners.
In2014ofthesubsidiariesofforeigncompanies31%oftherevenues,29%ofvalueaddedandalso29%oftheemploymentwasprovidedbybusinesseswithGermanownership–thehighestineachcategory,notcoun<ngdomes<cbusinesses.Germansubsidiariesweremostprominentlyrepresentedinautomo-bileproduc<on,energy,telecommunica<onsandmachineryproduc<onsectorsoftheHungarianecon-omy.Combined,thesefoursectorscovered77%oftheirrevenuesandtwothirdsoftheirvalueadded(KSH2016).ItisthereforeofliHlesurprisethatontheleveloftradeables,exportsfromHungarytoGer-manyalsoresembledthistrend.AsFigure17illustrates,71%ofHungary’sexportstoGermanyalsocon-sistedofmachinesanditemsoftransporta<on–whichrepresentsanalmostiden<caloverallstructuretotheonefireenyearsearlier,whenthetwosectorswereresponsiblefor72%ofHungarianexportstoGermany.
Figure17:ExportstructureofHungarytoGermany2015
O Source:MIT/HarvardObservatoryofEconomicComplexity(2015)
Onaregional level,Germany’swesternregionsfaroutweighed itseasternparts. Infact, importsfromEastGermanyonlyfellinthedecadeandhalfbetween2000and2016goingfrom€1269to€1188mil-lion.Inthemean<me,importsfromWesternGermanymorethandoubledfrom€9880in2010to€23289millionby2016.ThemostimportantGermanregionsfromtheperspec<veofbothimportsandex-ports for Hungary remained the same over the 16 years under inves<ga<on: Baden-WuerHemberg,BavariaandNorthRhine-Westphalia. , 8 9
Forfurtherdetailsseeappendix,Table3.8
Unfortunately,theHungariansta<s<calofficeorCentralBankleadsnosuchrecordabouttheHungarianregions9
orcoun<esanditstradepartners.
O20
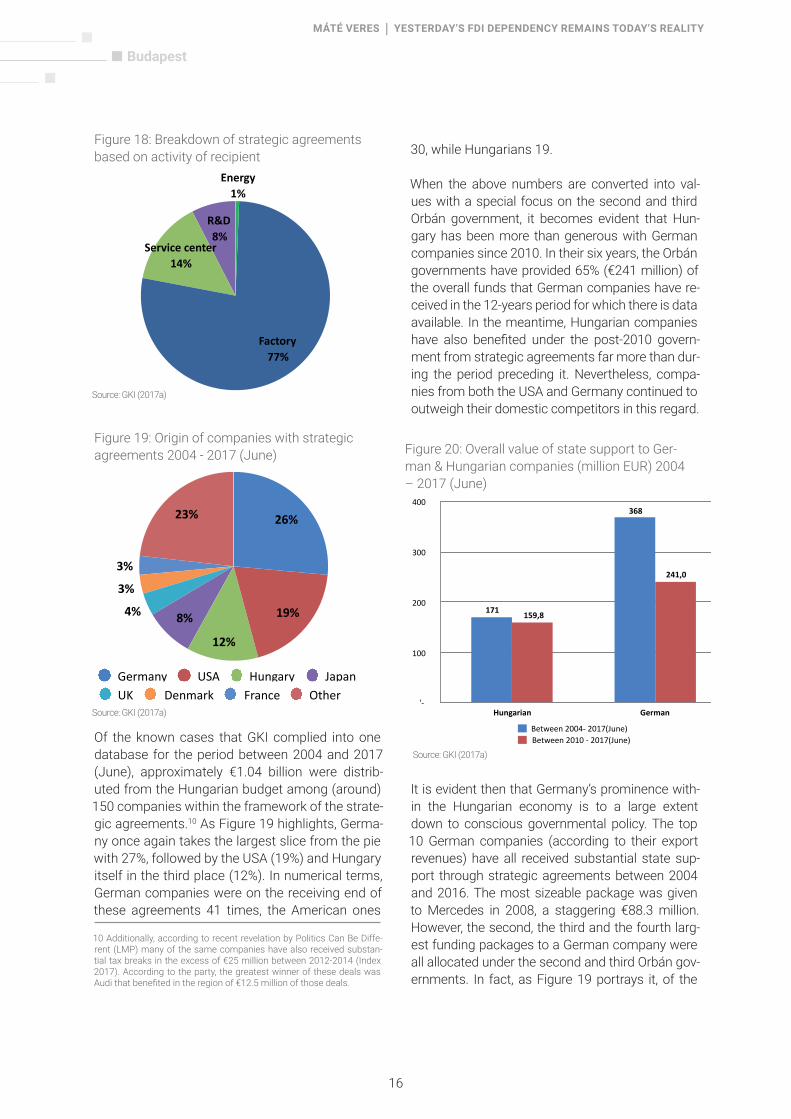
that have been labelled as “strategic agreements”. In them, the government guaranteed special treat-ment, tax breaks and funding for these corpora-tions in exchange for them setting up businesses and creating workplaces in Hungary. Strategic agreements have thus been primarily applied as a measure to attract large scale foreign investment into the country. However, their quality is highly questionable since the majority of these agree-ments’ (123) funding was provided to low value added production sites where foreign companies primarily constructed factories that have served as assembly lines for their products. On the oth-er hand, in the 23 cases where funding was pro-vided for multinationals to either install or extend their service centres did not represent a significant step forward either, considering the relatively low (medium) skillsets most of these workplaces re-quire. Only in the remaining 12 cases (+1 was in energy) were funds provided for R&D purposes with the potential of long-term development, and workplaces with globally competitive salaries. Of course, nothing is black and white, since both the factories and the service centres also employ managers that receive substantial wages as well as product developers that play important parts in the companies’ research and development work. However, it is common that above certain posi-tions nationals of the West tend to be preferred within the hierarchy over locals, irrespective of their experience or qualifications.
Figure 17: Export structure of Hungary to Germany 2015
Source: MIT/Harvard Observatory of Economic Complexity (2015)
16
Budapest MÁTÉ VERES | YESTERDAY’S FDI DEPENDENCY REMAINS TODAY’S REAlITY
TheOrbángovernmentmaintainedaprac<cethatbyandlargecontributedtothisstructuralconsistencyintheHungarianeconomy’soutput.GovernmentsbeforeandespeciallyunderthesecondandthirdOr-bángovernmentshavesignedcontractswith–primarily–foreignmul<na<onalsthathavebeenlabelledas“strategicagreements”.Inthem,thegovernmentguaranteedspecialtreatment,taxbreaksandfund-ingforthesecorpora<onsinexchangeforthemseyngupbusinessesandcrea<ngworkplacesinHun-gary.StrategicagreementshavethusbeenprimarilyappliedasameasuretoaHractlargescaleforeigninvestment into the country.However, their quality is highly ques<onable since themajority of theseagreements’(123)fundingwasprovidedtolowvalueaddedproduc<onsiteswhereforeigncompaniesprimarilyconstructedfactoriesthathaveservedasassemblylinesfortheirproducts.Ontheotherhand,in the23caseswhere fundingwasprovided formul<na<onals toeither installorextendtheir servicecentres did not represent a significant step forward either, considering the rela<vely low (medium)skillsetsmostoftheseworkplacesrequire.Onlyintheremaining12cases(+1wasinenergy)werefundsprovidedforR&Dpurposeswiththepoten<aloflong-termdevelopment,andworkplaceswithgloballycompe<<vesalaries.Ofcourse,nothingisblackandwhite,sinceboththefactoriesandtheservicecen-tresalsoemploymanagersthatreceivesubstan<alwagesaswellasproductdevelopersthatplayimpor-tantpartsinthecompanies’researchanddevelopmentwork.However,itiscommonthatabovecertainposi<onsna<onalsoftheWesttendtobepreferredwithinthehierarchyoverlocals,irrespec<veoftheirexperienceorqualifica<ons.
Figure18:Breakdownofstrategicagreementsbasedonac:vityofrecipient
O Source:GKI(2017a)
OftheknowncasesthatGKIcompliedintoonedatabasefortheperiodbetween2004and2017(June),approximately€1.04billionweredistributedfromtheHungarianbudgetamong(around)150compa-
R&D8%
Servicecenter14%
Factory77%
Energy1%
O21
Of the known cases that GKI complied into one database for the period between 2004 and 2017 (June), approximately €1.04 billion were distrib-uted from the Hungarian budget among (around) 150 companies within the framework of the strate-gic agreements.10 As Figure 19 highlights, Germa-ny once again takes the largest slice from the pie with 27%, followed by the USA (19%) and Hungary itself in the third place (12%). In numerical terms, German companies were on the receiving end of these agreements 41 times, the American ones
10 Additionally, according to recent revelation by Politics Can Be Diffe-rent (LMP) many of the same companies have also received substan-tial tax breaks in the excess of €25 million between 2012-2014 (Index 2017). According to the party, the greatest winner of these deals was Audi that benefi ted in the region of €12.5 million of those deals.
30, while Hungarians 19.
When the above numbers are converted into val-ues with a special focus on the second and third Orbán government, it becomes evident that Hun-gary has been more than generous with German companies since 2010. In their six years, the Orbán governments have provided 65% (€241 million) of the overall funds that German companies have re-ceived in the 12-years period for which there is data available. In the meantime, Hungarian companies have also benefi ted under the post-2010 govern-ment from strategic agreements far more than dur-ing the period preceding it. Nevertheless, compa-nies from both the USA and Germany continued to outweigh their domestic competitors in this regard.
It is evident then that Germany’s prominence with-in the Hungarian economy is to a large extent down to conscious governmental policy. The top 10 German companies (according to their export revenues) have all received substantial state sup-port through strategic agreements between 2004 and 2016. The most sizeable package was given to Mercedes in 2008, a staggering €88.3 million. However, the second, the third and the fourth larg-est funding packages to a German company were all allocated under the second and third Orbán gov-ernments. In fact, as Figure 19 portrays it, of the
nieswithintheframeworkofthestrategicagreements. AsFigure19highlights,Germanyonceagain10
takesthelargestslicefromthepiewith27%,followedbytheUSA(19%)andHungaryitselfinthethirdplace(12%).Innumericalterms,Germancompanieswereonthereceivingendoftheseagreements41<mes,theAmericanones30,whileHungarians19.
Figure19:Originofcompanieswithstrategicagreements2004-2017(June)
O Source:GKI(2017a)
WhentheabovenumbersareconvertedintovalueswithaspecialfocusonthesecondandthirdOrbángovernment, itbecomesevident thatHungaryhasbeenmore thangenerouswithGermancompaniessince2010.Intheirsixyears,theOrbángovernmentshaveprovided65%(€241million)oftheoverallfundsthatGermancompanieshavereceivedinthe12-yearsperiodforwhichthereisdataavailable.Inthemean<me,Hungariancompanieshavealsobenefitedunderthepost-2010governmentfromstrate-gic agreements farmore thanduring theperiodpreceding it.Nevertheless, companies fromboth theUSAandGermanycon<nuedtooutweightheirdomes<ccompe<torsinthisregard.
23%
3%
3%
4% 8%
12%
19%
26%
Germany USA Hungary Japan UK Denmark France Other
Addi<onally,accordingtorecentrevela<onbyPoli<csCanBeDifferent(LMP)manyofthesamecompanieshave10
alsoreceivedsubstan<altaxbreaksintheexcessof€25millionbetween2012-2014(Index2017).Accordingtotheparty,thegreatestwinnerofthesedealswasAudithatbenefitedintheregionof€12.5millionofthosedeals.
O22
Figure20:OverallvalueofstatesupporttoGerman&Hungariancompanies(millionEUR)2004–2017(June)
O
Source:GKI(2017a)
ItisevidentthenthatGermany’sprominencewithintheHungarianeconomyistoalargeextentdowntoconsciousgovernmentalpolicy.Thetop10Germancompanies(accordingtotheirexportrevenues)haveallreceivedsubstan<alstatesupportthroughstrategicagreementsbetween2004and2016.ThemostsizeablepackagewasgiventoMercedes in2008,astaggering€88.3million.However,thesecond,thethirdandthefourthlargestfundingpackagestoaGermancompanywereallallocatedunderthesecondand thirdOrbángovernments. In fact, asFigure19portrays it,of the ten largestdealsonly twoweremadeduringthepre-2010era.Itshouldalsobehighlightedthatallofthemwereprovidedforeithertheconstruc<onor theextensionof factories,andeightoutof the tendealsweremadewithautomobileproducers.
'-
100
200
300
400
Hungarian German
241,0
159,8
368
171
Between2004-2017(June)Between2010-2017(June)
O23
Figure 18: Breakdown of strategic agreements based on activity of recipient
Figure 19: Origin of companies with strategic agreements 2004 - 2017 (June)
Source: GKI (2017a)
Source: GKI (2017a)
Figure 20: Overall value of state support to Ger-man & Hungarian companies (million EUR) 2004 – 2017 (June)
Source: GKI (2017a)

17
Budapest MÁTÉ VERES | YESTERDAY’S FDI DEPENDENCY REMAINS TODAY’S REAlITY
ten largest deals only two were made during the pre-2010 era. It should also be highlighted that all of them were provided for either the construction or the extension of factories, and eight out of the ten deals were made with automobile producers.
The fact that German companies are not too con-cerned about Hungary as a consumer market is evidenced by the fact that there is an almost per-fect overlap between their net revenues and their export revenues. This is of course primarily true for the ones with a stake in manufacturing, as evidenced by Figure 22: The 10 German subsid-iaries with the highest revenues in Hungary are all involved in manufacturing and all make above 90% of their income from exports. Should one go further down the list, the picture would be the same. The close resemblance of the export and import structures between Hungary and Germany, together with the similarity in their net and export revenues, suggests that German subsidiaries that are involved in manufacturing production allow for Hungary’s trade balance with the country to be neutral due to very high (above 95%) intra-compa-ny trade. In addition, goods that are produced for export by Hungarian businesses – mostly agricul-tural – allow for the trade balance to be positive.
The products of German multinationals assem-bled in Hungary have primarily been destined for foreign markets ever since the 1990s, and therefore the development of domestic markets is secondary in nature for them. With headquar-ters in Germany, the occupations with the highest value-added like R&D, strategic decisions (inter-national marketing and investment decisions) or design are mostly situated there as well, while spill-overs are only allowed to the foreign mar-kets in so far as they are needed to achieve the most effi cient production possible in their subsid-iaries. This means that even if there is R&D and other higher value-added processes installed in their Hungarian subsidiaries, those are not at the technological frontier of production but only sub-par processes that are relevant for their assem-bly lines. The latter limits the chances of any FDI dependent countries catching up in technological terms to their Western counterparts. Finally, they have little incentive in lobbying for investment into the development of human capital beyond the relatively low skill requirements of the assembly sites and service centres. In the absence of ac-tivities that are determinant in the multinationals’ international competitiveness in qualitative terms, there is little need for them other than the develop-
Figure21:Top10Germancompaniesbasedonsizeofstatefundingreceivedbetween2004–2016
O Source:GKI(2017a)
The fact thatGerman companies arenot too concerned aboutHungary as a consumermarket is evi-dencedbythefactthatthereisanalmostperfectoverlapbetweentheirnetrevenuesandtheirexportrevenues.This isofcourseprimarily true for theoneswithastake inmanufacturing,asevidencedbyFigure22:The10GermansubsidiarieswiththehighestrevenuesinHungaryareallinvolvedinmanufac-turingandallmakeabove90%oftheir incomefromexports.Shouldonegofurtherdownthelist,thepicturewouldbethesame.Thecloseresemblanceoftheexportand importstructuresbetweenHun-garyandGermany,togetherwiththesimilarityintheirnetandexportrevenues,suggeststhatGermansubsidiaries thatare involved inmanufacturingproduc<onallow forHungary’s tradebalancewith thecountrytobeneutralduetoveryhigh(above95%)intra-companytrade.Inaddi<on,goodsthatarepro-ducedforexportbyHungarianbusinesses–mostlyagricultural–allowforthetradebalancetobeposi-<ve.
TheproductsofGermanmul<na<onalsassembledinHungaryhaveprimarilybeendes<nedforforeignmarketseversincethe1990s,andthereforethedevelopmentofdomes<cmarkets issecondaryinna-tureforthem.Withheadquarters inGermany,theoccupa<onswiththehighestvalue-addedlikeR&D,strategic decisions (interna<onal marke<ng and investment decisions) or design are mostly situatedthereaswell,whilespill-oversareonlyallowedtotheforeignmarkets insofarastheyareneededtoachievethemostefficientproduc<onpossibleintheirsubsidiaries.ThismeansthatevenifthereisR&Dandotherhighervalue-addedprocesses installed in theirHungarian subsidiaries, thosearenotat thetechnologicalfron<erofproduc<onbutonlysubparprocessesthatarerelevantfortheirassemblylines.ThelaHerlimitsthechancesofanyFDIdependentcountriescatchingupintechnologicaltermstotheirWesterncounterparts.Finally,theyhaveliHleincen<veinlobbyingforinvestmentintothedevelopmentofhumancapitalbeyondtherela<velylowskillrequirementsoftheassemblysitesandservicecentres.
MillionEuro
0
23
45
68
90
Year
2007 2010 2012 2015 2017
88,3
21,2
46,5
21,8
9,49
19,4
42,3
34,1
15,18
YearRobertBosch ThyssenKruppPresta Mercedes AUDI Wuppermann OPEL AUDIAUDI Mercedes
O24
Figure 21: Top 10 German companies based on size of state funding received between 2004 – 2016
Source: GKI (2017a)
Mercedes

18
Budapest MÁTÉ VERES | YESTERdaY’S FdI dEpEndEncY REMaInS TodaY’S REalITY
ment of relatively well trained vocational labourers for assembly work and white-collar workers with tasks directly related to their management. This is highlighted in Figure 22, which shows that the domestic value added to the country’s exports is one of the lowest among the OECD countries, as only the similarly FDI dependent Slovakia and the microstate of Luxemburg leg behind Hungary in this regard. In addition, lax labour regulations have served the interests of foreign investors, and the Orbán government has been more than willing to provide them with these. (Policy Solutions 2012: 25-28) Even though it has been shown already multiple times that it is only through dense unions and strong labour rights that wages and produc-tivity can converge with the West. (Pogátsa 2015; ETUI 2016)
In light of the substantial funds made available and tax breaks provided to foreign multinationals by the ensuing governments, the combination of the factors listed above raises serious questions regarding the viability of any governmental strate-gy that first and foremost wishes to rely on foreign capital for economic development in 2017 still.
Altogether German companies had 3,24611 sub-sidiaries and employed close to 190,000 people in Hungary in 2014 (the latest data available), more than any other nationality in both categories. Their combined revenue was €42.7 million, almost twice the size of the second largest total of American subsidiaries, while their value-added production was also the largest of all the foreign affiliates in the country at €7.8 million (KSH 2017c). Looking at all the data above it is safe to conclude that Ger-many’s relevance in Hungary’s economic life, both when compared to other countries’ local affiliates and to domestic producers, is not only extraordi-nary but dominant with very important structural implications.
Assessment
German capital has played an integral role in the Hungarian economy ever since the early 1990s. German companies have been the largest inves-tors and the largest exporters, while they also have the greatest share of all foreign owned sub-
11 Between 2010 – 2014 their number grew by almost 400.
Intheabsenceofac<vi<esthataredeterminantinthemul<na<onals’interna<onalcompe<<venessinqualita<veterms,thereisliHleneedforthemotherthanthedevelopmentofrela<velywelltrainedvo-ca<onal labourersforassemblyworkandwhite-collarworkerswithtasksdirectlyrelatedtotheirman-agement.This ishighlightedinFigure22,whichshowsthatthedomes<cvalueaddedtothecountry’sexportsisoneofthelowestamongtheOECDcountries,asonlythesimilarlyFDIdependentSlovakiaandthemicrostateofLuxemburglegbehindHungaryinthisregard.Inaddi<on,laxlabourregula<onshaveservedtheinterestsofforeigninvestors,andtheOrbángovernmenthasbeenmorethanwillingtopro-vide themwith these. (Policy Solu<ons2012:25-28)Even though ithasbeen shownalreadymul<ple<mesthatitisonlythroughdenseunionsandstronglabourrightsthatwagesandproduc<vitycancon-vergewiththeWest.(Pogátsa2015;ETUI2016)
Figure22:Domes:cvalueaddedingrossexportsin2014(%)
O Source:OECD(2017)
Inlightofthesubstan<alfundsmadeavailableandtaxbreaksprovidedtoforeignmul<na<onalsbytheensuinggovernments,thecombina<onofthefactorslistedaboveraisesseriousques<onsregardingtheviabilityofanygovernmentalstrategythatfirstandforemostwishestorelyonforeigncapital foreco-nomicdevelopmentin2017s<ll.
Figure23:Top10Germancompaniesbasedonexport/netrevenues(millionHUF)
'-
22,50
45,00
67,50
90,00
LuxemburgSlovakRepublicHungaryCzechRepublicBulgariaBelgiumFinlandSloveniaPolandNetherlandsEstoniaDenmarkSwedenAustriaGreeceSpainFranceGermanyUKSwitzerlandNorway
81,2574,6472,68
52,68
39,77
O25
Luxe
mbu
rg
Slov
ak R
epub
lic
Hun
gary
Czec
h Re
publ
ic
Bulg
aria
Belg
ium
Finl
and
Slov
enia
Pola
nd
Net
herla
nds
Esto
nia
Denm
ark
Swed
en
Aust
ria
Gre
ece
Spai
n
Fran
ce
Ger
man
y
UK
Switz
erla
nd
Nor
way
Figure 22: Domestic value added in gross exports in 2014 (%)
Source: OECD (2017)

19
Budapest MÁTÉ VERES | YESTERDAY’S FDI DEPENDENCY REMAINS TODAY’S REAlITY
sidiaries within the Hungarian market. At the other end of the spectrum, German multinationals have enjoyed the largest share of state support from the ensuing Hungarian governments of all the large investors since the early 2000s to date, top-ping even their Hungarian counterparts. This was especially true under the second and third Orbán governments that have provided German multina-tionals with close to twice as much state support as the socialist/liberal governments before them.
In spite of current rhetoric, there is thus no sign of any shift taking place in the country’s trade re-lations. Instead of an “Eastern opening” that the second Orbán government emphasized when opening alternative trade routes between Hunga-ry and China, Azerbaijan, Turkey and other rapidly developing nations of the East, a continuation is visible along the pre-established trade routes, with Germany at their centre. This is also true in the other direction, western FDI continues to be the dominant source of foreign investment into the country – only Israel has substantially increased its share in the last years, at least when we con-sider the investor by its UCP.
In parallel with the lack of change in Hungary’s trade relations, no major transformation has tak-en place in the economy’s productive structural
make-up either, at least certainly not on the inter-national level. Most of the exportable manufac-tured goods continue to be produced by subsidi-aries of foreign businesses, with the largest share once again assumed by German producers. More-over, since investments from abroad in the man-ufacturing sector were primarily made into con-structing assembly sites for pre-produced goods, the lion-share of Hungary’s exports is in fact in-tra-company trade, whereby goods imported in separate pieces are assembled and sent back to their country of origin.
Unfortunately, the economic model outlined above that was built around the service of multinationals has not only halted the chances of convergence for Hungary to its western counterparts in the past quarter of a century, but it even threatens with a complete meltdown today, should the foresight of experts become true and robots take most of the low/medium skilled jobs that assembly lines required over in the decade to come. Thus, Hun-gary’s current developmental path is likely to be unsustainable and detrimental for its chances of catching up. However, this should not entail a complete U-turn and the introduction of all round protectionism. Keeping the country attractive to foreign investors should remain a vital concern for policy makers, however the primary emphasis
O Source:GKI(2017b)
AltogetherGermancompanieshad3,246 subsidiariesandemployedcloseto190,000peopleinHun11 -gary in2014(thelatestdataavailable),morethananyotherna<onality inbothcategories.Theircom-bined revenuewas €42.7million, almost twice the size of the second largest total of American sub-sidiaries,whiletheirvalue-addedproduc<onwasalsothelargestofalltheforeignaffiliatesinthecoun-tryat€7.8million(KSH2017c).LookingatallthedataaboveitissafetoconcludethatGermany’srele-vanceinHungary’seconomiclife,bothwhencomparedtoothercountries’localaffiliatesandtodomes-<cproducers,isnotonlyextraordinarybutdominantwithveryimportantstructuralimplica<ons.
3. AssessmentGermancapitalhasplayedanintegralroleintheHungarianeconomyeversincetheearly1990s.Germancompanieshavebeenthelargestinvestorsandthelargestexporters,whiletheyalsohavethegreatestshareofallforeignownedsubsidiarieswithintheHungarianmarket.Attheotherendofthespectrum,Germanmul<na<onalshaveenjoyedthelargestshareofstatesupportfromtheensuingHungariangov-ernmentsofallthelargeinvestorssincetheearly2000stodate,toppingeventheirHungariancounter-parts.ThiswasespeciallytrueunderthesecondandthirdOrbángovernmentsthathaveprovidedGer-manmul<na<onalswithclosetotwiceasmuchstatesupportasthesocialist/liberalgovernmentsbeforethem.
Inspiteofcurrentrhetoric,thereisthusnosignofanyshirtakingplaceinthecountry’straderela<ons.Insteadofan“Easternopening”thatthesecondOrbángovernmentemphasizedwhenopeningalterna-<vetraderoutesbetweenHungaryandChina,Azerbaijan,Turkeyandotherrapidlydevelopingna<onsoftheEast,acon<nua<onisvisiblealongthepre-establishedtraderoutes,withGermanyattheircentre.This isalsotrueintheotherdirec<on,westernFDIcon<nuestobethedominantsourceofforeignin-
Mercedes-Benz
RobertBoschElektronikaGyártóKr.
RobertBoschEnergyandBodySystemsKr.
LuKSavaria(Schaefflergroup)
Con<nentalAutomo<veHungary
Opel
BorgWarnerTurboSystems
PorscheHungaria
RobertBoschAutomo<veSteeringKr.
ZOLLNER
'- 2000000 4000000
NetrevenueExportrevenue
Between2010–2014theirnumbergrewbyalmost400.11
O26
Source: GKI (2017b)
Figure 23: Top 10 German companies based on export/net revenues (million HUF)

20
Budapest MÁTÉ VERES | YESTERdaY’S FdI dEpEndEncY REMaInS TodaY’S REalITY
should be on its quality rather than its quantity. In other words, Hungary’s appeal to foreign inves-tors should not come from its relatively large (yet increasingly shrinking) number of medium skilled workers, low taxes and state funds provided to large investors but high-quality infrastructure, highly skilled workforce and a dependable legal (and political) environment. This could ensure that Hungary could compete for investors (wheth-er they were from the manufacturing or service sectors) that require skills that produce goods with much higher added value and consequently pay internationally competitive wages.12 Most of these jobs are beyond the capacity of today’s ro-bots since they require human genuineness and a sense of innovation that are yet to be “invented” for robots, thus it would represent a long-term invest-ment both for the people of the country and the sustainability of its economic model. Moreover, since the “West” continues to be the technologi-cal/know-how leader in almost every high-tech sector of the world, Hungary could spare itself from having to “orient” its economy to the East at least from the perspective of FDI (they would how-ever represent important export markets).
Investment in the development of human capital and infrastructure however is only one side of the coin. Should Hungary follow the above path with no additional steps, it would still remain highly dependent on FDI, leaving the country to be con-trolled by the whims of international investors. One of the reasons behind the introduction of the current FDI dependent model twenty some-thing years ago was the promise of technological/know-how spill-overs into the domestic economy, and that domestic producers could benefit from, and eventually produce at the level of, their west-ern counterparts. This promise was not fulfilled, most of Hungary’s producers of manufactured goods are at best suppliers of spare parts for western manufacturers. The Hungarian econo-my became dual in nature, a strong and compet-itive one led by foreign multinationals; and weak domestic one based on producers with focus on
12 This was evidenced by the latest publication of the Hungarian Nati-onal Employment Service that showed that the highest average wages are paid out for researchers, managers and IT professionals (also in the top 10 are the politicians) (NES 2017).
the local markets. Governmental policy thus must address this issue by investing in cutting-edge research and development to be shared with do-mestic producers, so that they can produce inter-nationally competitive goods (and services) allow-ing the build-up of a domestically owned export sector that the country could fall back on should certain investors decide to take their investments elsewhere. As a member of the European Union returns to scale should not be a problem with a market of 500 million customers at our borders (and more beyond). Traditionally, the combination of the above outlined policy directives were called an “industrial policy”, and as Mariana Mazzuca-to (2013) showed in her recent book successful economies of the West continue to employ it. So should Hungary, or risk being on the losing end of the latest global economic transformation.

Destatis (2017) Internationale Indikatoren 1990 – 2016, available: https://www-genesis.destatis.de/genesis/online/data;jsessionid=A8F795C8ABEF6001911AC29326E797B6.tomcat_GO_1_3?operation=abruftabelleAbrufen&selec-tionname=99911-0009&levelindex=1&levelid=1502884875415&index=9, accessed: 04.08.2017
Deutsche Bundesbank (2017) Entwicklung der deutschen Direktinvetitionen in Ungarn, available: https://www.ah-kungarn.hu/fileadmin/AHK_Ungarn/Dokumente/Wirtschaft/Statistik/INFO_HU-DE_Direktinvestitionen.pdf, accessed: 07.08.2017
Eursotat (FATS, 2017) Foreign Affiliates Statistics, available: http://ec.europa.eu/eurostat/web/structural-busi-ness-statistics/global-value-chains/foreign-affiliates?p_p_id=NavTreeportletprod_WAR_NavTreeportletprod_IN-STANCE_MlPTx882pcau&p_p_lifecycle=0&p_p_state=normal&p_p_mode=view&p_p_col_id=column-2&p_p_col_pos=1&p_p_col_count=3, accessed: 06.08.2017
GKI (2015) Előrejelzés 2016-ra: 2015/4, Budapest: GKI Gazdsaágkutató
GKIa (2017) GKI Economic Research Co.’s own database on Strategic Agreements, available upon agreement
GKIb(2017) Database inquired from the National Tax and Customs Administration, available upon request
Index (2017) 80 milliárdnyi adókedvezményt adott a kormány a multiknak két év alatt, Index.hu, available: http://index.hu/gazdasag/2017/08/13/80_milliardnyi_adokedvezmenyt_adott_a_kormany_a_multiknak_ket_ev_alatt/, ac-cessed: 13.08.2017
Kornai, J. (1994) Transformational Recession: The Main Causes, The Journal of Comparative Economics vol.19, no.1, p. 39-63.
KPMG & GKI (2017) A magyarországi európai uniós források felhasználásának és hatásainak elemzése a 2007 -2013-as programozási időszak vonatkozásában: Makrogazdasági elemzések összefoglalása, available: https://www.palyazat.gov.hu/magyarorszagi_europai_unios_forrasok_elemzese, accessed: 08.09.17
KSH (1993) Magyar Statisztikai Zsebkönyv 1992, Budapest 1993
KSH (2017a) A külföldi tőkebefektetések befektetők és országcsoportok szerint 1998 – 2012, available: http://www.ksh.hu/docs/hun/xstadat/xstadat_eves/i_qpk003a.html, accessed: 07.08.2017
KSH (2017b) A külkereskedelmi termékforgalom forintban, országok szerint 2001-, available: http://www.ksh.hu/docs/hun/xstadat/xstadat_eves/i_qkt009b.html, accessed: 04.08.2017
KSH (2017c) Az első tíz ország árbevétele a külföldi leányválalltok árbevétele, hozzáadott értéke, a foglalkoz-tatottak száma és aránya szerint 2008, available: https://www.ksh.hu/docs/hun/xstadat/xstadat_eves/i_qtd009b.html?down=943 , accessed: 05.08.2016
KSH (2017d) A külkereskedelmi termékforgalom euróban, árufőcsoportok szerint (2001–), available: https://www.ksh.hu/docs/hun/xstadat/xstadat_eves/i_qkt007.html , accessed: 10.09.2017
KSH (2016a) A mezőgazdaság szerepe a nemzetgazdaságban 2015, Budapest: KSH Publikációk
KSH (2016b) A Magyarországon működő külföldi irányítású leányvállalatok tevékenysége (2014. évi végleges és 2015. évi előzetes adatok alapján), Budapest: KSH Publications
Nölke, A. & Fliegenthart, A. (2009) Enlarging the Varieties of Capitalism: The Emergence of Dependent Market Economies in East Central Europe, World Politics, vol.61, no.4, pp.670 – 702
Mazzucato, M. (2013) The Entrepreneurial State: Debunking Public vs. Private Sector Myth, London: Anthem Press.
MIT/Harvard (2015) Observatory of Economic Complexity, available: http://atlas.media.mit.edu/en/visualize/tree_map/hs92/export/hun/all/show/2015/, accessed: 06.08.2017
MNB (2017) Közvetlentőke-befektetések Részesedés állomány Magyarországon Országbontásban (millió euro) available: http://www.mnb.hu/statisztika/statisztikai-adatok-informaciok/adatok-idosorok/viii-fizetesi-merleg-kozve-tlen-tokebefektetesek-kulfolddel-szembeni-allomanyok/kozvetlentoke-befektetesek/bpm6-modszertan-szerinti-ada-tok, accessed: 08.08.2017
MNB (2007) Közvetlen Tőkebefektetések Statisztika Magyarország 1995 -2005, Budapest: MNB
MNB (2016) A Külföldiek magyarországi közvetlentőke-befektetés állományának végső befektetők szerinti bontása, Budapest: MNB Publications, available: https://www.mnb.hu/letoltes/a-kozvetlentoke-befektetes-alloma-ny-vegso-befektetore-allokallasa-honlapra.pdf, accessed: 20.09.2017
NES (2017) 2016. évi bér és kereslet statisztikai adatok, available: http://nfsz.munka.hu/engine.aspx?page=afsz_stat_egyeni_berek_2016, accessed: 19.08.2017
OECD (2008) Benchmark Definition on Foreign Direct Investment, 4th edition, Paris: OECD Publications
OECD (2017) Domestic value added in gross exports, OECD Database, available: https://data.oecd.org/trade/do-mestic-value-added-in-gross-exports.htm, accessed: 20.09.2017
Policy Solutions (2012) Munkahelyteremtés Magyarországon, Budapest: Policy Solutions
Statistisches Bundesamt (2016) AuBenhandel nach Bundeslandern, available: https://www.ahkungarn.hu/filead-min/AHK_Ungarn/Dokumente/Wirtschaft/Statistik/INFO_HU-DE_Aussenhandel.pdf , accessed: 07.09.2017
UN Economic Commission for Europe (2004) Economic Survey of Europe, no.2. Geneva and New York publication of the UN Secretariat
References
Budapest MÁTÉ VERES | YESTERDAY’S FDI DEPENDENCY REMAINS TODAY’S REAlITY

22
Budapest MÁTÉ VERES | YESTERdaY’S FdI dEpEndEncY REMaInS TodaY’S REalITY
Appendix Table3:GermanregionsandtradewithHungary
OSource:Sta<s<schesBundesamt(2016)
O31
Source: Statistisches Bundesamt (2016)
Table 3: German regions and trade with Hungary

Máté Veres works for GKI Economic Research Co., Hungary as a research manager. He is also a guest lecturer at Óbuda University and Budapest Business School. He received his degrees from International Political Economy BA, MA and De-velopment Economics MA from the University of Southamp-ton, Central European University and KU Leuven, respectively.
About the author Imprint
Friedrich-Ebert-Stiftung Issued by: Budapest Office H-1056 Budapest, Fővám tér 2-3, HungaryTel.: +36-1-461-60-11 Fax: +36-1-461-60-18 E-Mail: [email protected]
www.fes-budapest.org
Responsible: Jan Niklas Engels
Commercial use of all media published by the Fried-rich-Ebert-Stiftung (FES) is not permitted without the writ-ten consent of the FES.
Friedrich-Ebert-Stiftung – its mission in HungaryThe Friedrich-Ebert-Stiftung (FES) is committed to the funda-mental values of social democracy: we stand by the princip-les of freedom, justice, solidarity, peace and cooperation. The Friedrich-Ebert-Stiftung strives to fulfill its mission in Hungary as well. As an “advocate of social democracy” we wish to con-tribute to the development of democracy, the rule of law and social justice in political and public life, as well as to an under-standing between the peoples of Hungary and Germany in a common Europe. Our partners representing political life, trade unions, the media and civil society are equally committed to these core values.
Friedrich-Ebert-Stiftung – Budapest OfficeThe Friedrich-Ebert-Stiftung‘s Budapest Office was established shortly after the collapse of the Soviet Union and the 1989 re-gime change with the purpose of assisting and promoting the process of transformation aimed at the implementation of de-mocracy and freedom in Hungary. At forums bringing together political and social actors the Friedrich-Ebert-Stiftung‘s Budapest Office wishes to act as an “organization encouraging dialogue” by:• organizing professional conferences with the participati-
on of national and international experts and decision-ma-kers
• analyzing and reporting on current issues in Hungarian and German society, as well as issues of European inte-rest
• organizing education and further training programs
The views expressed in this publication are not necessarily those of the Friedrich-Ebert-Stiftung or of the organization for which the author works.