yellow-eyed penguin - review of population information
TRANSCRIPT
4350 POP2011-08 Ellenberg & Mattern – Final Report June 2012
�
Yellow-eyed penguin - review of population information
Contract 4350 POP2011-08
Ursula Ellenberg1 & Thomas Mattern1
With contributions by Aviva Stein2
��������� ��������������
������������������
Contact:�[email protected]�
Final Report – Manuscript for Department of Conservation Science Publication
Abstract
The yellow-eyed penguin is endemic to New Zealand and is one of two penguin species with
the most fragile conservation status on the planet. It is a long-lived species and population
viability analysis shows that even a small increase in adult mortality augments extinction
probability dramatically. The yellow-eyed penguin population on the New Zealand mainland,
including Stewart Island, is small (600-800 breeding pairs). Previous population strongholds
such as on the Otago Peninsula are declining. Since the mainland population is genetically
distinct from sub-Antarctic populations (inferred immigration rate 0.003 per generation) the
current loss of yellow-eyed penguins along the Southeast coast of the New Zealand South

4350 POP2011-08 Ellenberg & Mattern – Final Report June 2012
��
Island and in the Foveaux Strait will not be compensated by immigration. Fisheries bycatch
may be substantial, particularly in the commercial set net fisheries; however, the information
currently available does not allow assessing the full extent of fisheries impact.
Here we have reviewed and collated information existing to date on yellow-eyed penguin
population parameters including range and distribution, population levels and trends, adult
survival, juvenile survival, age of first breeding and fecundity. Furthermore, we summarised
our current understanding of yellow-eyed penguin marine ecology and foraging patterns.
Important gaps in our knowledge have been identified and we provide recommendations for
future research in order to better assess the direct and indirect effects of commercial fisheries
on yellow-eyed penguins. Most importantly we need to increase independent observer
coverage on commercial set net and inshore trawl fisheries that operate within foraging areas
of yellow-eyed penguins in order to quantify numbers caught and document operational
details affecting the likelihood of capture. Since bycatch rates are extremely uncertain,
independent observer coverage needs to be high to achieve reasonable precision in bycatch
estimates. Electronic Monitoring can supplement independent observers allowing better
overall coverage while keeping the related costs manageable. Such data are essential for the
development of mitigation measures or temporal/ spatial management to reduce Yellow-eyed
penguin bycatch in the commercial fisheries.
Keywords
Megadyptes antipodes, yellow-eyed penguin, distribution, abundance, population trends,
survival, fecundity, foraging ecology, future research, bycatch, fisheries impact

4350 POP2011-08 Ellenberg & Mattern – Final Report June 2012
���
Table of Contents
Abstract ...................................................................................................................................... i Keywords................................................................................................................................... ii Table of Contents ....................................................................................................................iii
Species scientific and common names .................................................................................... 1 Rationale ................................................................................................................................... 1 Purpose of this report .............................................................................................................. 2
1. The current range and distribution of yellow-eyed penguins .................................. 2 Summary ................................................................................................................................ 2 1.1 Introduction ................................................................................................................ 3 1.2 Methods...................................................................................................................... 4 1.3 Results ........................................................................................................................ 4
1.3.1 Yellow-eyed penguins on the New Zealand Mainland ...................................... 5 1.3.2 Yellow-eyed penguins in the New Zealand sub-Antarctic................................. 7
1.4 Conclusions ................................................................................................................ 9
2. Population levels and trends of yellow-eyed penguins............................................ 10 Summary .............................................................................................................................. 10 2.1 Introduction .............................................................................................................. 112.2 Methods.................................................................................................................... 132.3 Results ...................................................................................................................... 15
2.3.1 Population levels and trends on the New Zealand mainland ........................... 15 2.3.2 Population levels and trends in the New Zealand sub-Antarctic ..................... 21
2.4 Discussion ................................................................................................................ 232.5 Conclusions .............................................................................................................. 282.6 Recommendations .................................................................................................... 29
2.6.1 Increase nest count reliability and comparability between years ..................... 30 2.6.2 Maintain and improve annual population monitoring on the mainland ........... 30 2.6.3 Improve data quality, accessibility and maintenance....................................... 31 2.6.4 Sub-Antarctic population census...................................................................... 32 2.6.5 Repeat population census on Stewart Island .................................................... 33
3. Adult survival, juvenile survival, age of first breeding and fecundity of yellow-eyed penguins .............................................................................................................. 35
Summary .............................................................................................................................. 35 3.1 Introduction .............................................................................................................. 36
3.1.1 Factors affecting survival of yellow-eyed penguins ............................................... 36 3.1.2 Age at first breeding................................................................................................ 38 3.1.3 Fecundity................................................................................................................. 39 3.1.4 Objective ................................................................................................................. 40
3.2 Methods.................................................................................................................... 403.2.1. Study site ................................................................................................................ 40 3.2.2 Existing adult survival data ..................................................................................... 41 3.2.3 Existing juvenile survival data ................................................................................ 42 3.2.4 Existing age at first breeding data ........................................................................... 42

4350 POP2011-08 Ellenberg & Mattern – Final Report June 2012
��
3.2.5 Existing fecundity data............................................................................................ 43 3.3 Results and Discussion............................................................................................. 43
3.3.1 Adult survival Estimates ......................................................................................... 43 3.3.2 Juvenile Survival ..................................................................................................... 45 3.3.3 Age at first breeding................................................................................................ 46 3.3.4 Fecundity................................................................................................................. 47
3.4 Conclusions .............................................................................................................. 48
4. Foraging ecology of yellow-eyed penguins ............................................................... 50 4.1 Introduction .............................................................................................................. 514.2 Methods.................................................................................................................... 524.3 Results ...................................................................................................................... 54
4.3.1 Foraging behaviour .......................................................................................... 54 4.3.2 Diet ................................................................................................................... 67
4.4 Discussion ................................................................................................................ 754.4.1 Foraging behaviour and diet............................................................................. 75 4.4.2 Variables affecting foraging ecology ............................................................... 76 4.4.3 Research implications ...................................................................................... 79
5. Research priorities to assess the impact of commercial fisheries on yellow-eyed penguins....................................................................................................................... 81
Summary .............................................................................................................................. 81 Background .......................................................................................................................... 83 Methods................................................................................................................................ 83 Overview of research priorities in order of importance ....................................................... 84 5.1 Quantify the direct effects of commercial fisheries ................................................. 84
5.1.1 Yellow-eyed penguin bycatch in commercial set net fisheries ........................ 84 Rationale........................................................................................................................... 84 Research approach............................................................................................................ 875.1.2 Yellow-eyed penguin bycatch in commercial trawl fisheries .......................... 90 Rationale........................................................................................................................... 90 Research approach............................................................................................................ 92
5.2 Document the indirect effects of commercial fisheries............................................ 93 5.2.1 Fisheries induced benthic habitat degradation ................................................. 93 Rationale........................................................................................................................... 93 Research approach............................................................................................................ 965.2.2 Fisheries competition ....................................................................................... 98 Rationale........................................................................................................................... 98
Acknowledgements............................................................................................................... 100References ............................................................................................................................. 101Tables……………………………………………………………………………………….112Figure captions ..................................................................................................................... 120Figures………………………………………………………………………………………125
4350 POP2011-08 Ellenberg & Mattern – Final Report June 2012
�
Yellow-eyed penguin - review of population information
Species scientific and common names
The Yellow-eyed penguin, Megadyptes antipodes (“large southern diver”), was first described
by Hombron and Jacquinot in 1841 at the Auckland Islands as Catarrhactes antipodes.
Maori common name: Hoiho (“noise-maker”)
Rationale
The endemic yellow-eyed penguin is classified as endangered (B2b(iii)c(iv), IUCN 2011)
internationally and as threatened (nationally vulnerable) following the New Zealand internal
threat classification system (Miskelly et al. 2008). This species may live to more than 25
years (own observations, John Darby unpublished data). Generally, adult mortality is low
(0.09-0.17; Richdale 1957; Efford et al. 1996; Edge et al. 1999; Ratz et al. 2004). Population
viability analysis shows that even a small increase in yellow-eyed penguin adult mortality rate
leads to a dramatic increase in extinction probability (McKinlay 1997).
We have a reasonable idea about the terrestrial factors influencing population parameters at
least on the New Zealand mainland (e.g. introduced predators, human disturbance, disease,
terrestrial habitat quality etc.) and appropriate management measures. However, we know
very little about sea-based factors affecting yellow-eyed penguin populations, such as
oceanographic conditions, food supply, fisheries interaction (e.g. via competition or habitat
alterations) and bycatch.
In 2007 an initial attempt was made to evaluate fisheries impact on a yellow-eyed penguin
population using mark-recapture data within a population dynamics model by Mark N.

4350 POP2011-08 Ellenberg & Mattern – Final Report June 2012
�
Maunder, Alistair Dunn, David M. Houston, Philip J. Seddon, and Terese H. Kendrick.
Unfortunately, the authors had to conclude that there is currently “not enough information to
determine the impact of fisheries on the YEP population” (Maunders et al. 2007).
Purpose of this report
1. Describe the range and distribution (Section 1), population level and trend (Section 2),
adult survival, juvenile survival, age of first breeding and fecundity (Section 3) of
yellow-eyed penguins.
2. Collate and summarise available information on yellow-eyed penguin marine ecology
(Section 4).
3. Provide recommendations for future research to allow a better understanding of the
impacts of commercial fishing on yellow-eyed penguins (Section 5).
1. The current range and distribution of yellow-eyed penguins
Author: Ursula Ellenberg
Summary
Yellow-eyed penguins breed in the sub-Antarctic on Campbell and Auckland Islands, on
Rakiura/ Stewart Island and adjacent islands, and along the southeast coast of the New
Zealand South Island. Yellow-eyed penguins on the New Zealand mainland are genetically
distinct from yellow-eyed penguins in the sub-Antarctic (inferred immigration rate of 0.003

4350 POP2011-08 Ellenberg & Mattern – Final Report June 2012
�
per generation). Therefore, yellow-eyed penguins breeding on the New Zealand South Island,
Stewart Island and outliers have to be managed separately from sub-Antarctic populations.
1.1 Introduction
Recent research revealed that yellow-eyed penguins were restricted to the Auckland and
Campbell Islands up until AD 1500 (Boessenkool et al. 2009a). Only after their sister species
Megadyptes waitaha disappeared (probably hunted to extinction) yellow-eyed penguin
stragglers from the sub-Antarctic gained foothold on the New Zealand mainland. The
decimation of seals and sea lions (i.e. predators of penguins) and change in human harvest
pattern allowed them to establish and expand into the population we see today (Boessenkool
2009, Boessenkool et al. 2009a). Hence, the colonisation of the New Zealand mainland by
yellow-eyed penguins happened during very favourable conditions.
It is unlikely current losses on the mainland could be compensated by the arrival of new birds
from the sub-Antarctic. Only one of the >500 birds banded on Campbell or Auckland Islands
has ever been found (dead) on Stewart Island, and none of the >10,000 birds banded on the
New Zealand South Island has ever been recorded on Campbell or Auckland Islands (Seddon
et al. in press). Studies confirmed that sub-Antarctic and mainland populations are genetically
distinct (Triggs and Darby 1989, Boessenkool 2009, Boessenkool et al. 2009a, b, 2010a, b)
i.e. interchange between populations is negligible (inferred immigration rate of 0.003 per
generation, Boessenkool et al. 2010a).
Therefore, the New Zealand mainland (including Steward Island) and sub-Antarctic
populations need to be managed and thus are presented as separate units.

4350 POP2011-08 Ellenberg & Mattern – Final Report June 2012
�
1.2 Methods – current range and distribution
I have reviewed all studies cited in our yellow-eyed penguin book chapter (Seddon et al. in
press). I have then searched the Web of Science, Scopus, and Google scholar, for both peer-
reviewed papers and grey literature using the keywords “yellow-eyed penguin” or
“Megadyptes” or “Hoiho”. Furthermore, I have gathered the relevant Conservation Services
Programme and internal DOC Reports and have been in contact with all related Department
of Conservation Area Offices. Finally, I have approached the Yellow-eyed Penguin Trust,
which maintains a library attempting to cover everything ever written on yellow-eyed
penguins including grey literature. The literature database considered for the yellow-eyed
penguin review of population information contains 237 publications.
After consultation with Igor Debski and Russell Harding, Marine Conservation Services
Programme, we decided to not give away individual breeding areas in a public document.
Instead we present the range and distribution of Yellow-eyed penguins as a line following
coastal contours where Yellow-eyed penguins are present and recorded as breeding.
Additionally, depicting breeding regions rather than individual breeding sites has the
advantage to account for natural dynamics: Some breeding areas may get abandoned for a
variety of reasons whereas others may get newly established in the future.
1.3 Results – current range and distribution
Yellow-eyed penguins breed in the sub-Antarctic on Campbell and the Auckland Islands, on
Rakiura/ Stewart Island and outliers, and along the southeast coast of the New Zealand South
Island (Figures 1.1 & 1.2).

4350 POP2011-08 Ellenberg & Mattern – Final Report June 2012
�
1.3.1 Yellow-eyed penguins on the New Zealand Mainland
South Island New Zealand
Between 400 and 600 pairs currently breed in four distinct regions along the southeast coast
of the New Zealand South Island: the Catlins, Otago Peninsula, North Otago, and Banks
Peninsula (Department of Conservation Coastal Otago Area Office, Figure 1.1). The Otago
Peninsula used to host nearly half of these pairs (see Section 2). The few Yellow-eyed
penguins on the Banks Peninsula breed with little success and recruitment appears to come
from mainland breeding areas further south (Parker 2009, 2010). In recent years, a single
breeding pair has attempted twice to breed near Kaikoura (in 2008/09 and 2009/10, Mike
Morrissey, DOC, pers. comm.).
Traditionally, yellow-eyed penguins nested in lowland podocarp/ hardwood forests prevailing
along the coasts of southern New Zealand (Darby & Seddon 1990). Since penguins nesting in
warm temperate climates tend to be overinsulated for life on land (Stonehouse 1967) nesting
within a cool forest will help maintaining thermal balance (Darby & Seddon 1990).
However, with habitat degradation and the destruction of most natural forest cover along the
South East coast of the South Island penguins are now forced to breed in a variety of human
shaped remnant scrub habitats including gorse, flax and native shrubs such as hebe, ngaio or
tree nettle, that provide to some extent shelter from thermal stress (Darby & Seddon 1990;
Clark et al. 2008). Even nests in open grassland habitat without overhead cover have been
observed (McKay 1999). Habitats such as gorse and tree nettle may additionally provide
protection from human and dog disturbance (own observations). Still, penguins appear to
breed less successfully in such replacement habitats (Darby & Seddon 1990).
Yellow-eyed penguins are the least colonial of all penguin species and nests are spaced up to
150m apart with some pairs travelling up to 700m (even 1km, John Darby pers. comm.)
4350 POP2011-08 Ellenberg & Mattern – Final Report June 2012
�
inland in search of suitable nest sites (Darby & Seddon 1990). Densities may range from 1-5
(in exceptions more, own observations) nests per hectare depending on the density of
vegetation (Darby & Seddon 1990).
Yellow-eyed penguins are specialised benthic foragers which rely on a stable and predictable
year-round food source within reach of their breeding areas (Moore & Moffat 1990; Mattern
et al. 2007). Hence, the width of the continental shelf and the level of marine productivity
may be important predictors of yellow-eyed penguin presence and success.
Stewart Island and outliers
Stewart Island/ Rakiura and adjacent islands host about 180 breeding pairs along the north-
eastern (Anglem coast) and eastern shores, with population strongholds on Codfish Island/
Whenua Hou, around the exit of Paterson Inlet (including Bench Island) and in Port Pegasus
(Massaro and Blair 2003, King 2008a, King 2009, Figure 1.2).
Stewart Island still maintains much of its original coastal forest and large scale human
induced modifications similar to the New Zealand South Island have not occurred. However,
the introduction of herbivorous mammals has altered the understorey and more open forests
on the main island could make it more difficult for yellow-eyed penguins to find suitable nest
sites (Darby 2003). Yet the current low population numbers (see section 2) can not be
explained by such habitat alterations alone. Today many potentially good nesting sites on
Stewart Island remain unoccupied.

4350 POP2011-08 Ellenberg & Mattern – Final Report June 2012
�
1.3.2 Yellow-eyed penguins in the New Zealand sub-Antarctic
It is thought, that about 60% of yellow-eyed penguins are found in the sub-Antarctic. Despite
being considered a stronghold for the species, to date very little research has been completed
on the sub-Antarctic yellow-eyed penguin populations.
Campbell Island
Between 350-540 breeding pairs were estimated for Campbell Island during the most recent
population census in 1991/92 (Moore et al. 2001). Beach counts at landing sites revealed most
birds (79% in 1988 and 83% in 1992) were present in the four main bays (in decreasing order
of abundance): Perseverance Harbour, North East Harbour, Northwest Bay, and Southeast
Harbour (Moore and Moffat 1990, Moore 1992, Amey and Moore 1995, Moore et al. 2001,
Figure 1.2).
Penguins generally preferred more sheltered harbours with 61% of the landing sites located
on shingle/small boulder beaches (Moore 1992). Nest searches at selected breeding sites
during the breeding season 1987/88 found nests “isolated and scattered amongst the coastal
scrub-shrubland association, dominated by Dracophyllum. The density of nests was
approximately 1.5 pairs/ha in penguin habitat (3.8 in Northwest Bay), or 44 birds per
accessible kilometre of coastline. Most nests were within 500m of the shore.” (Moore and
Moffat 1990).
Campbell Island lies at the southern end of the Campbell Plateau and is surrounded by a
reasonable expansion of productive continental shelf at less than 200m depth which makes it a
favourable place for a primarily benthic forager such as the yellow-eyed penguin (Smith
1987; Moore & Moffat 1990; Mattern et al. 2007).

4350 POP2011-08 Ellenberg & Mattern – Final Report June 2012
Auckland Island group
The Auckland Islands host an estimated minimum of 520-570 breeding pairs (1989 census of
the northern part of the Auckland Island group, followed by a brief reconnaissance of some
sparsely populated eastern bays, Moore 1990b, 1992.) Predator-free Enderby Island, in the
north of the Auckland Island group, appears most important with an estimated 260-290
breeding pairs (Moore 1992). This is despite the fact that it is also an important breeding site
for a yellow-eyed penguin predator, the New Zealand sea lion Phocartcos hookeri. There are
no recent estimates of the yellow-eyed penguin population size on the Auckland Island group.
However, beach counts during the breeding season 2008/09 at all known landing sites on
Enderby Island (25, Moore 1992) found them still active (Young 2009a, b). In 2009 a survey
of Port Ross and the northern Coast and adjacent Islands (excluding Enderby) as well as the
extensive but more sparsely populated eastern and southern coastline including Carnley
Harbour and Adams Island identified a total of 306 active landing sites (Beer 2010). This
indicates the Auckland Islands remain an important population stronghold for Yellow-eyed
penguins (Figure 1.2).
The outlying predator-free islands (free of the feral pigs Sus scrofa, cats Felis catus and mice
Mus musculus which are found on the main island) appear to have greater penguin densities
with 3.5 landing sites per kilometre searched coastline compared to only 1.2 landing sites per
kilometre on the main Auckland Island (Beer 2010).
Breeding habitat was predominantly “southern rata (Metrosideros umbellata) forest and scrub
vegetation such as Myrsine divaricata. Other habitat used for breeding included Olearia
lyallii forest (Ewing Island) and Poa litorosa tussockland. The landing sites varied from rocky
shores (64%) to boulder beaches (32%) and sandy beaches (4%)” (Moore 1992, about the
northern parts of the Auckland Island group). Further south the most prevalent vegetation at

4350 POP2011-08 Ellenberg & Mattern – Final Report June 2012
!
landing sites was scrubland, dominated by Dracophyllum and Hebe. Most landings were
found on rock platforms, boulder beaches, and combination of both, with very few sandy
beaches (0.7%, Beer 2010).
The marine regions particularly to the North East of the Auckland Islands are dominated by
reasonably shallow (<200m) water depths which would support the benthic foraging strategy
observed in Yellow-eyed penguins on the mainland and may explain the importance of
Enderby Island as a population stronghold. Further South, water depths drop to depths >200m
relatively close to the coast, which is indicative of suboptimal foraging conditions and, hence,
resident Yellow-eyed penguins may employ different foraging strategies in those regions.
1.4 Conclusions
We have satisfactory knowledge of the current distribution of yellow-eyed penguin breeding
areas and are beginning to learn more about fine scale habitat requirements. In contrast, our
knowledge about yellow-eyed penguin distribution at sea such as the location of important
foraging areas remains superficial. In order to better assess potential effects of commercial
fisheries we need to improve our understanding of yellow-eyed penguin marine ecology and
foraging ranges, particularly around breeding areas that have little continental shelf available
such as the Catlins and the Southern regions of the Auckland Island group. Improving the
quantity of at-sea-distribution data would greatly increase the reliability of risk assessments.

4350 POP2011-08 Ellenberg & Mattern – Final Report June 2012
�"
2. Population levels and trends of yellow-eyed penguins
Author: Ursula Ellenberg
Summary
Accurate population census data is lacking for the majority of yellow-eyed penguin breeding
areas. Despite being considered the population stronghold, information about yellow-eyed
penguins breeding on the sub-Antarctic Campbell and Auckland Islands is scarce and
outdated. Campbell Island has been surveyed twice, in 1988 and 1992, and this latest
population census has not been repeated to date. For the Auckland Island Group the
information is even sketchier and a first population census is urgently needed.
The first comprehensive population census on Stewart Island and neighbouring islands
during 1999-2001 found 178 breeding pairs, considerably less than expected from previous
population estimates. This prompted research into the threats affecting yellow-eyed penguins
on Stewart Island. High chick mortality due to starvation and disease was documented during
a five year study (2003-2008) along the Anglem Coast, Northeast Stewart Island. The
population has considerably declined since the initial survey suggesting recruitment failure.
Yellow-eyed penguins breeding of the New Zealand South Island have received more
scientific attention and some breeding areas have now been monitored continuously over
more than 30 years. The current population on the New Zealand mainland is small, 400-600
breeding pairs, and has experienced extreme fluctuations. While the number of breeding pairs
in the Catlins or North Otago appear stable or even increased (2 breeding sites) over the last
20 years the number of yellow-eyed penguins breeding pairs on the Otago Peninsula has

4350 POP2011-08 Ellenberg & Mattern – Final Report June 2012
��
declined considerably from a maximum of 385 breeding pairs in the late 1990s down to 184
breeding pairs during 2011-12.
In addition to long recognised dangers new threats are emerging such as increasing human
disturbance, novel disease outbreaks, marine pollution, changes in oceanographic conditions
and food supply. We are just beginning to realise the effects of benthic habitat degradation via
commercial fisheries activities that act on top of penguin bycatch in the commercial set net
and trawl fisheries. Sea-based threats remain little understood and need to be quantified in
order to make informed anticipatory management decisions to safeguard yellow-eyed penguin
populations.
2.1 Introduction
Population sizes of yellow-eyed penguins on the New Zealand mainland are assessed via
annual counts of active nests. This is a prevalent survey method to assess the populations of
seabirds and waterfowl (Nettleship 1976; Hutchinson 1979; Thomas 1996). Nest counts
provide a direct estimate of the breeding population at relatively low cost. However,
challenges include the difficulty of finding nests particularly in non-colonial species, the
possible disturbance of nesting birds and correct timing of nest searches (Erwin 1981; Walter
& Rusch 1997; Bart et al. 2004).
The yellow-eyed penguin is the least colonial of all penguin species. They nest at low
densities and well concealed by coastal vegetation in often reasonably steep and sometimes
difficult to access areas (Seddon & Davis 1989; Moore et al. 2001; Poole 2005; Clark 2007;
Clark et al. 2008). Hence, a number of nests are likely to be missed during each survey (e.g.
Hegg et al. 2012), and accuracy will depend on prior knowledge of the site, nest search

4350 POP2011-08 Ellenberg & Mattern – Final Report June 2012
��
experience and effort. Information on these parameters have only recently been included into
nest search protocols but are still not recorded in the Yellow-eyed Penguin Data Base and
corresponding nest summary spreadsheets. These two electronic references safeguard
productivity and abundance data of yellow-eyed penguins breeding on the New Zealand
mainland and are maintained by the Department of Conservation Coastal Otago Area Office.
The numbers presented and discussed here (section 2.3.1) provide a minimum estimate of
breeding pairs with no measure of nest count reliability and comparability between years.
Beach counts may provide an index of total population size depending on available reference
areas and timing (e.g. Moore et al. 2001; section 2.3.2). On sub-Antarctic Campbell Island,
Peter Moore (1992) used mark-recapture of previously banded birds during landing counts at
a selected site (Middle Bay, Northwest Bay, 78 breeding adults banded in 1987-1988) to
estimate the percentage of birds using the landing on any day. Assuming the percentage of
birds using a landing site was similar among all sites around Campbell Island during a
particular time (e.g. 81.4% SD 13. 5% during May – July; Moore 1992) the entire population
can be estimated, i.e. the total count of 1625 individuals in 1988 would represent a population
of “about 2000 birds” (Moore 1992) or 2277 ± 122 individuals when including further mark-
recapture data of 72 breeding birds banded at Sandy Bay in 1991-1992 (Moore et al. 2001).
From the estimated total number of individuals potential nest numbers/ breeding pairs could
be projected assuming 60% (Richdale 1957) or 70% of the birds (Efford et al. 1994) were
breeders (Moore et al. 2001).
Such estimates don’t take into account that landing pattern may vary considerably even
between days (probably weather dependent, own observations), and the proportion of
breeders may vary substantially between years (<30-90%; Effort et al. 1996).

4350 POP2011-08 Ellenberg & Mattern – Final Report June 2012
��
For logistic reasons winter beach counts are more manageable on Campbell Island, the days
are short and thus penguins, being visual hunters, concentrate their departures and arrivals
around sunrise and sunset (Moore & Moffat 1990, including graph; Moore 1992). Moore
(1992, Moore et al. 2001) found a high and consistent proportion of birds used the study
landings during winter with usually little variations between days, particularly during May
and June. Hence, beach counts appear to be a practical approach to obtain an index of
population size, especially for logistically difficult areas.
In the following I will summarise the information we have available to date and give
recommendations as to how our current knowledge about yellow-eyed penguin population
levels and trends can be improved in the future.
2.2 Methods – population levels and trends
A comprehensive literature review (compare Section 1), including grey literature, provided
me with the little yellow-eyed penguin population data available for sub-Antarctic Auckland
and Campbell Islands, and for Stewart Island and outliers.
In addition to previously published figures, I was provided with the latest summary of yellow-
eyed penguin nest numbers for North Otago, the Otago Peninsula, and the Catlins in a nest
summary spreadsheet that is maintained separately from the yellow-eyed penguin database
(by Bruce McKinley and Melanie Young, Department of Conservation Coastal Otago Area
Office). The data includes nest numbers for most breeding sites during the 1992-2011
breeding seasons with estimates for the total mainland population from 1980.
While some breeding sites have been consistently monitored with similar effort and
sometimes even by the same person over the past 20 years, other areas have been searched

4350 POP2011-08 Ellenberg & Mattern – Final Report June 2012
��
less consistently over the years and no record is available in regard to nest search experience,
search effort, weather conditions during search days or even the area covered during the
search.
For some breeding areas concern has been raised that searches with untrained volunteers and
a high volunteer to expert ratio may greatly underestimate actual nest numbers. For example,
12 nests were found at Nugget Point in the Catlins by a group of volunteers with one
experienced leader in 2001/02. A more thorough search (probably motivated by the 5 yearly
Catlins census) revealed at least 23 nests in the same area. Nest numbers in the season prior
and after the Catlins census, 9 and 13 respectively, are likely considerable underestimates of
true nest numbers. In recent years, this problem has been more carefully addressed, aiming at
a ratio of two volunteers to one experienced leader knowing the site. Data from 2007 onwards
appear to better reflect actual nest numbers at least in some areas.
Therefore, even data from breeding areas that get searched annually have to be interpreted
with caution. However, many breeding areas get visited infrequently every few years, and
interim numbers are educated guesses of how many nests would have been found if the area
was searched. Unfortunately, it is not always clear in the nest data spreadsheet which data
derived from real ground searches and which are mere guesstimates.
With help from Melanie Young and Dave Houston I cross checked data and we decided on
breeding areas (i.e. all 8 in North Otago, 10 on the Otago Peninsula, and 5 in the Catlins) that
appear to have the most reliable data for the analysis of long-term population trends
(Appendix 1). General regional population trends were analysed using linear regression (Zar
1999) for the data available (years 1992-2012). Since yellow-eyed penguin populations
undergo considerable fluctuations applying linear regression can be considered only
preliminary. The factors affecting yellow-eyed penguin population size and productivity are

4350 POP2011-08 Ellenberg & Mattern – Final Report June 2012
��
complex and little understood and further research (see recommendations) is required before
we can draw reliable conclusions.
2.3 Results
2.3.1 Population levels and trends on the New Zealand mainland
South Island New Zealand
Between 400 and 600 pairs currently breed along the southeast coast of the New Zealand
South Island in four distinct breeding regions: the Banks Peninsula, North Otago, Otago
Peninsula, and the Catlins. The population has seen extreme inter-annual fluctuations over the
last ~30 years (Figure 2.1).
The Otago Peninsula was historically the most important region hosting about half of the
South Island breeding population. However, this has changed: During the last breeding season
(2011-12) six active nests were found on Banks Peninsula, 50 nests in North Otago, 184 nests
were estimated for the Otago Peninsula, and 214 nests were found in the Catlins.
Lance Richdale focussed his population study (1936-1948) on yellow-eyed penguins breeding
on the Otago Peninsula; hence, most historic records are from here (e.g. Richdale 1941, 1951,
1957). In the late 1970s John Darby initiated extensive nest searches on the Otago Peninsula
and selected sites in North Otago and the Catlins (Darby 1985; Darby & Seddon 1990). Since
1992 Yellow-eyed population monitoring is coordinated by the Department of Conservation.

4350 POP2011-08 Ellenberg & Mattern – Final Report June 2012
��
Historic population accounts
Anecdotal evidence suggests considerably higher population numbers at the beginning of the
20th century. “John Darby (pers. comm.) believes there were once 2000-3000 pairs of yellow-
eyed penguins on the mainland, breeding in the traditional South Island coastal
podocarp/hardwood forests. With the gradual clearance of the coastal forest breeding habitat,
predation by feral cats, ferrets and dogs, disturbance by stock and people, and occasional
crashes of the food supply, there has been a population decline” (Moore & Moffat 1990).
Lance Richdale himself believed that “within quite recent years Megadyptes antipodes
occupied probably in their thousands the one time bush clad slopes of the Otago Peninsula.
The destruction of the vegetation which formed his natural habitat has been no doubt the chief
agent in the decimation of his numbers from thousands to hundreds” (Richdale 1942, cited
from Moore 2001). Lance Richdale (1942) further attributes the apparent dramatic decline of
the yellow-eyed penguin population to commercial collectors and even after passing the
Animals Protection Games Act in 1921-1922 “nests have been continually robbed by the
thoughtless; in the 1939-40 season, a whole colony was deprived of its eggs”. Additionally, “a
series of devastating massacres by youths with pearifles” took its toll, “and it was reported
that as many as forty were slaughtered in one afternoon” (Richdale 1942).
During the years of depression at the end of the II World War the penguin population could
recover to some extend: “in those years, the nations were at war, petrol was scarce, and man’s
destructive agencies were practically negligible. The forces of nature were able to work
unimpeded” (Richdale 1957). “After the low point of 25 nests in 1940-41, the population of
Richdale's study areas increased to 82 nests in 1952” (Moore 2001). Following World War II,
“human disturbance resumed and episodes of shootings of penguins and burning of breeding

4350 POP2011-08 Ellenberg & Mattern – Final Report June 2012
��
habitat by youths hunting rabbits gave Richdale cause to urge the authorities to appoint a
ranger for the peninsula, which occurred in 1948” (Moore 2001).
In 1985-86 a record of 276 active yellow-eyed penguin nest were counted on the Otago
Peninsula (New Zealand Wildlife Service 1986). Only a few years later, in December –
February 1989-90 a mysterious episode of adult mortality occurred causing the death of an
estimated 50% of the breeding population in the monitored Boulder Beach complex on the
Otago Peninsula (Effort et al. 1996). While dead birds were slightly lighter than surviving
adults, the difference was too small to suggest starvation as cause of death, and no pathogens
or toxins were isolated (Gill & Darby 1993, Effort et al. 1996, Figure 2.1). Graczyk
colleagues (1995) suggested these deaths may have been caused by an outbreak of avian
malaria; however, what factors have triggered this outbreak remains unclear. Fortunately,
such an episode of high adult mortality has not repeated to date.
The highest number ever recorded on the Otago Peninsula was 385 breeding pairs in 1996-97.
This may be in part attributed to the increased search effort after the major population crash in
1989-1990 that prompted more regular monitoring of virtually all known South Island
breeding areas (Figure 2.2). Currently more than half (~34) of the 53 known breeding areas
are assessed each year, with particular efforts to cover all known breeding areas in the Catlins
at five year intervals. Following an initial rapid increase in breeding pairs in 1991 when
previously known breeders returned the subsequent season, the following six years of low
adult mortality and good recruitment allowed full recovery (Figure 2.1, Efford et al. 1994,
1996). However, factors driving such dramatic population changes still remain little
understood.

4350 POP2011-08 Ellenberg & Mattern – Final Report June 2012
�
Regional trends 1992-2011:
Banks Peninsula
The few Yellow-eyed penguins on the Banks Peninsula (i.e. 26 adult birds and 3 active nests
found in 2008/09; 18 adult birds and 5 active nests confirmed in 2009/10) breed with little
success and recruitment appears to come from mainland breeding areas further south (Parker
2009, 2010). During last breeding season (2011/12) a record of 6 nests were found on the
Banks Peninsula with the help from enthusiastic and experienced Otago nest searchers
(Melanie Young pers. comm.). Available data is insufficient to analyse any population trends.
North Otago
All 8 known breeding areas in North Otago have received comparable nest search efforts over
the last 20+ years by the same persons most importantly: Dave Houston and Kevin Pearce,
Department of Conservation, North Otago Area Office. Annual surveys began during the
breeding season 1984/85 with peaks in 1985/86 (43 nests) and 2001/02 (51 nests; Jones et al.
2004, the nest data spreadsheet maintained by DOC states 48 nests in North Otago for the
same season). The highest number observed so far was 77 nests in 2008/09. In 1984/85, three
locations accounted for 68% of the nest numbers. By 2001/02 the same three areas
contributed only 22% to the total nest count (Jones et al. 2004). Two new breeding areas have
gained importance and now host most breeding pairs in North Otago.
Numbers of breeding pairs have significantly increased since 1992 (linear regression: F1, 18 =
43.35; p < 0.001; r2 = 0.71; Figure 2.3a). This positive trend is solely driven by two intensely
managed breeding sites (Katiki Point and Barracouta Bay) that have seen a considerable
increase in the number of breeding pairs (F1, 18 = 119.84; p < 0.001; r2 = 0.87; Figure 2.3b).
Without these two sites yellow-eyed penguin breeding pairs in North Otago probably remain

4350 POP2011-08 Ellenberg & Mattern – Final Report June 2012
�!
stable with extreme fluctuations and overall low numbers (6 breeding sites; linear regression:
F1, 18 = 0.001; p = 0.975; r2 = 0.00, Figure 2.3c).
Otago Peninsula
The number of breeding pairs on the Otago Peninsula has significantly declined since 1992
(linear regression: F1, 18 = 7.00; p = 0.016; r2 = 0.28; Figure 2.4). This is despite one of the 10
breeding areas included into the analysis saw a considerable increase in nest numbers over the
same time period (+225%; linear regression: F1, 18 = 31.10; p < 0.001; r2 = 0.63).
The strongest decline, about -60%, has been observed in Sandfly Bay (linear regression: F1, 18
= 16.10; p = 0.001; r2 = 0.47), followed by breeding areas in the Northeast (-51%; 4 breeding
sites, linear regression: F1, 18 = 12.74; p = 0.002; r2 = 0.41), and the South West of the
Peninsula (-38%; 4 breeding sites; linear regression: F1, 18 = 8.41; p = 0.010; r2 = 0.32).
Catlins
The Catlins have seen the less consistent penguin monitoring in the past. Five breeding areas
that were visited most regularly have been included into this analysis (linear regression: ns.
F1, 18 = 2.00; p = 0.174; r2 = 0.10; Figure 2.7). However, issues with nest count reliability and
accuracy (see methods section) may explain part of the fluctuations even at more regularly
visited sites. The complete Catlins survey that has been established in 1997 to take place
about every 5 years provides additional data (a complete census took place in 1997/98;
2001/02; 2007/08; 2011/12; Figure 2.5). From the data available, the nest numbers in the
Catlins appear stable since 1992; however, the increased search effort with more experienced
personnel in recent years may conceal a potential decline.
4350 POP2011-08 Ellenberg & Mattern – Final Report June 2012
�"
Stewart Island and outliers
During the first comprehensive survey in 1999/2001 a total of 178 active nests were found: 79
pairs on Stewart Island and 99 pairs on the smaller adjacent islands (Massaro and Blair 2003).
The most recent survey (2008/09) found 77 pairs on Stewart Island and 30 pairs on smaller
outliers; however, larger islands such as Bench and Codfish were not included (King 2009).
While Bench Island has not been searched in recent years (Sandy King pers. comm.), Yellow-
eyed penguins breeding on Codfish Island were down from 61 nests in 2001-02 (Massaro &
Blair 2003) to 46 in 2009 and only 39 nests were found in November 2011 (Houston &
Nelson 2012). While during the initial survey of Codfish Island 17 juveniles were observed
during one beach count and altogether 30+ juveniles (Massaro & Blair 2003, Houston &
Nelson 2012), not a single juvenile was observed in 2009 or 2011 (Houston & Nelson 2012).
“Given that 44 chicks were known to have fledged in 2010 (Leseberg 2011) the absence of
first-year birds in 2011 is indicative of poor first-year survival due to poor marine conditions,
however other causes of mortality such as fisheries bycatch may have also contributed.”
(Houston & Nelson 2012).
Yellow-eyed penguins along the Anglem Coast declined steadily over a five year study
(2003-2008) and in total by 37% since the survey in 1999-2001, when considering only
breeding sites searched during both population surveys (King 2009). The number of known
breeding areas increased from 24 (1999/2000 survey) to 29 (2008/09; King 2009). However,
since some of the previously know breeding areas had reduced nest numbers King (2009)
suspects increased search effort and experience may have obscured a potential decline. King
(2009) thus suggests for a more accurate estimate of trends to ignore the “new” locations that
were likely active but not searched during the initial survey; resulting in a slight decrease for
the remaining yellow-eyed penguin breeding areas on Stewart Island (from 73 breeding pairs
4350 POP2011-08 Ellenberg & Mattern – Final Report June 2012
��
in 1999-2000 to 65 pairs counted in 2008-09; King 2009). However, for reliable conclusions
about trends comprehensive population surveys are required at more regular intervals.
The observed decline of Yellow-eyed penguins breeding along the Anglem Coast appears to
be independent of population trends at other breeding areas on Stewart Island (King 2009).
2.3.2 Population levels and trends in the New Zealand sub-Antarctic
The sub-Antarctic Yellow-eyed penguin population has received very little attention so far
and current population levels and trends remain unknown.
Campbell Island group
During the two sub-Antarctic winter surveys of 1988 and 1992 Peter Moore and colleagues
found 172 and 140 landing sites, respectively. The Campbell Island population was estimated
around 2277 ± 122 individuals in 1988. When the census was repeated four years later in
1992 the total population (estimated from mark-recapture analysis) had declined by 41% to
1347 ± 91 birds (Moore et al. 2001). Counts at 11 selected landing sites between 1987 and
1998 showed some signs of recovery after 1994 (Moore et al. 2001).
The Yellow-eyed penguin population on the New Zealand mainland crashed during the same
time the Campbell Island population declined dramatically; reasons for this crash remain
unclear (Gill and Darby 1993, Efford et al. 1996). While the struggling population on the
mainland prompted more regular monitoring of breeding areas, sub-Antarctic Yellow-eyed
penguins received very little attention.
In November 2008 index counts were repeated at a selection of landing sites. Numbers at
Northwest Bay (on average 131 birds) were higher than the previous count in November

4350 POP2011-08 Ellenberg & Mattern – Final Report June 2012
��
1996, but have not yet reached previous peak records. At Southeast Harbour only 21.5 birds
were observed (average from two counts per landing site), the lowest record ever and
considerably lower than the previous count in 1997 (Hiscock 2008). Whether this is caused by
lower adult survival or merely a shift in use of landing sites potentially to avoid sea lion
predation remains unclear (Hiscock 2008, see also Moore et al. 2001).
The last comprehensive population census in 1992 has not been repeated to date.
Auckland Island group
In 1989 a single population census of the northern part of the Auckland Island group was
carried out (Moore 1992b). Moore himself describes this census as “brief and incomplete”
and “provisional” (Beer 2010) and concluded that further surveys are needed.
Recent efforts have been made to survey Yellow-eyed penguin landing sites along the
extensive but more sparsely populated eastern and southern shores (Beer 2010). Some spare
time allowed re-visiting the northern part of the Auckland island group and could confirm the
presence of Yellow-eyed penguins at the sites previously surveyed by Moore and colleagues
in 1989. They found a total of 100 landing sites along the North coast/Port Ross and outlying
islands a number that is comparable to what Moore found 20 years earlier (Moore 1992a,
Beer 2010). However, since there is no general understanding how landing sites are defined,
which close-by sites are considered one (i.e. likely providing access to the same breeding
area), and what defines a site as new, any comparisons remain extremely vague. Furthermore,
the presence of landing sites means only that penguins are still there but provides no
information of abundance – i.e. how many individuals are using a landing site or the number
of breeding pairs.
There are no recent estimates of population size.

4350 POP2011-08 Ellenberg & Mattern – Final Report June 2012
��
2.4 Discussion
The first objective stated in the yellow-eyed penguin recovery plan is “to obtain accurate
population census and trend data from all parts of the hoiho range using approved survey and
monitoring techniques” (McKinlay 2001). This task had been already stated in preceding
species conservation plan (Department of Conservation 1991, McKinlay 2001). Today, more
than 30 years later, this primary objective has still not been achieved. Although monitoring
effort has increased in recent years, accurate population census data is lacking for most
yellow-eyed penguin breeding areas.
Despite being considered the population stronghold information about yellow-eyed penguins
breeding on the sub-Antarctic Campbell and Auckland Islands is scarce and outdated.
Campbell Island has been surveyed twice, in 1988 and 1992, and this latest population census
has not been repeated to date. For the Auckland Island Group the information is even
sketchier and a first population census is urgently needed.
The first comprehensive population census on Stewart Island and neighbouring islands
during 1999-2001 found 178 breeding pairs. Previous estimates of 470-705 (New Zealand
Wildlife Service 1986), 350-450 (Darby & Seddon 1990), and 470-600 (McKinlay 2001 –
stating “these figures should be treated with a great deal of scepticism” since “only a partial
survey was completed in the early 1990’s”) have greatly overestimated the actual population
size. Darby (2003) realised that partial ground searches between1984-1994 suggested lower
numbers than expected and revised earlier estimates to 220-400 breeding pairs.
The population census found 79 pairs on Stewart Island and 99 pairs on islands outliers
including 61 pair on Codfish Island (Massaro & Blair 2003). Judging from the apparently
abundant and comparably little modified terrestrial habitat the actual number of nests found
was considerably lower than expected. In the absence of mustelids, important introduced

4350 POP2011-08 Ellenberg & Mattern – Final Report June 2012
��
predators of penguin eggs and chicks on the New Zealand South Island, feral cats were
suspected to be responsible for the overall low numbers of breeding pairs on mainland
Stewart Island and for the low breeding success observed (0-33% of chicks fledged)
compared to predator free island outliers (27-76%; Massaro and Blair 2003; King 2008a, b).
However, when Codfish Island the largest island outlier is removed as a special case from the
dataset, the argued differences between mainland Stewart Island and cat free outliers cease to
exist. Hence, the problem needs to be addressed in a more holistic manner.
A subsequently initiated five year study did not confirm a single case of cat predation.
Instead, starvation and disease have been found to be the main causes of chick mortality along
the Anglem Coast, Northeast Stewart Island (King 2008a, b; King 2009). Veterinary research
into the causes of chick mortality along the Anglem Coast found diseases such as the
hemoparasite Leucocytozoon and Corynebacterium amycolatum, which causes diphtheric
stomatitis in yellow-eyed penguins (King 2008a, b; McInnes et al. 2008; Hill et al. 2010). The
results were summarised as follows: “2006-07 had the highest incidence of diphtheritic
stomatitis, 2005-06 had Leucocytozoon, and 2005-07 were the worst for starvation” […] “the
cause of death of young chicks in 2007 was starvation. In other years Leucocytozoon,
diphtheritic stomatitis or trauma may have played a significant role, but it is not possible to
determine which came first, starvation or disease (McInnes et al. 2008).
Corynebacterium is a secondary pathogen i.e. the outbreak of diphtheric stomatitis requires a
triggering agent, for example a virus, however, despite all efforts such a virus could not be
isolated so far. Another plausible trigger that weakens the immune system is starvation which
has also been suspected to be at least in part responsible for major diphtheric stomatitis
outbreaks in chicks in 2002 and 2004 on the Otago Peninsula.

4350 POP2011-08 Ellenberg & Mattern – Final Report June 2012
��
Degradation of the marine foraging habitat due to oyster dredging in the Foveaux Strait
appears to affect prey availability and quality (Browne 2007; Mattern et al. 2007; Mattern
2008; Browne et al. 2011; compare section five for a more detailed discussion on the effects
of benthic habitat degradation due to oyster fisheries). Hence, while disease may cause
starvation, lower food quality and quantity found along the Anglem Coast strongly suggests
that depletion of foraging habitat makes the chicks more vulnerable to disease (Browne et al.
2011).
The subsequent census in 2008/09 suggested that other breeding areas in Stewart Island are
less affected and decline in number of breeding pairs is localised to the Anglem Coast,
Northeast Stewart Island (King 2009). However, penguins breeding on neighbouring Codfish
Island, previously a population stronghold that was considered stable and healthy, appear to
be declining as well (Houston & Nelson 2012). Given the considerable fishing effort
throughout the foraging range of Codfish Island birds and three observed deaths in
commercial set nets in this area over the last few years it is conceivable that bycatch may play
an important role in the demise of yellow-eyed penguins in this area (Rowe 2009, 2010;
Ramm 2010; Houston & Nelson 2012).
Yellow-eyed penguins breeding along the New Zealand South Island have received
considerably more scientific attention (e.g. Richdale 1941, 1951, 1957; Darby 1985; Darby &
Seddon 1988, 1990; van Heezik 1990; Gill & Darby 1993; Alterio et al. 1998; Efford & Edge
1998; Wright 1998; Edge et al. 1999; Moore 1999; Ratz & Murphy 1999; Moore 2001;
Massaro 2002, 2004, 2006, 2007; Ellenberg et al. 2007; Lalas et al. 2007; Mattern et al. 2007;
Setiawan et al. 2007; Sturrock & Tompkins 2008; Ellenberg et al. 2009; Boessenkool et al.
2009, 2010; Hegg et al. 2012).

4350 POP2011-08 Ellenberg & Mattern – Final Report June 2012
��
We now have a reasonable idea about the terrestrial drivers of reproductive success, survival
and recruitment on the New Zealand mainland such as introduced predators (e.g. Alterio et al.
1997, 1998; Moller et al. 1998, 1999; Ratz & Murphy 1999; Ratz 2000), human disturbance
(e.g. Ellenberg et al. 2007, 2009; Seddon et al. 2008), disease (e.g. Alley et al. 2004; Sturrock
& Tompkins 2008), terrestrial habitat quality (e.g. Darby & Seddon 1988; Seddon 1988;
McKay 1999; Clark 2007; Hegg et al. 2012) and appropriate management measures.
However, we know very little about sea-based factors affecting population parameters, such
as oceanographic conditions and food supply or fisheries interaction and bycatch.
The current population on the New Zealand mainland is small, 400-600 breeding pairs, and
has experienced extreme fluctuations over the last 30 years. Since only a small number of
pioneering individuals have established the mainland Yellow-eyed penguin population,
genetic variability is low (compare section 1). Hence, reduced adaptive potential may
compromise the long term viability of this population (Boessenkool et al. 2010). This is
particularly concerning in face of environmental change, and multiple other threats this
population has to face; refer to Seddon et al. (in press) for a comprehensive summary of
threats.
While some breeding areas appear stable despite considerable fluctuations, others show a
significant decline (most areas on the Otago Peninsula) or an increase (two breeding sites in
North Otago). In 1984 Janice Jones started a penguin hospital at Katiki Point in North Otago,
and in 2000 she initiated the Katiki Point Penguin Charitable Trust to obtain better funding
for the penguin hospital and habitat restoration, intense predator trapping and visitor
management programmes. Following the retirement of the founders in 2003 the intensive
habitat management and rehabilitation programmes have been continued by Rosalie
Goldsworthy.

4350 POP2011-08 Ellenberg & Mattern – Final Report June 2012
��
After changing rehabilitation techniques from hard to soft release the breeding site at Katiki
Point was established by four rehabilitated and translocated penguins in 1991/92 (Jones et al.
2004). Since then the population has gradually increased to up to 30 breeding pairs in
2008/09. Breeding success was significantly higher at these two intensely managed sites
(Katiki Point and Barracouta Bay; mean of 1.46 chicks fledged per pair) than at neighbouring
less managed breeding areas in North Otago (0.96; 1997-2002; Jones et al. 2004).
A recent evaluation of rehabilitation outcomes found that although rehabilitation of resident
breeders did not generate a significant increase in mean annual survival, it can increase the
local number of nesting attempts at sites where anthropogenic threats to the species are
adequately managed (Ratz and Lalas 2010). Chris Lalas (pers. comm.) believes that the
increase of breeding pairs at Katiki Point is driven by “a mixture of good management and
good luck”. While the two colonies at Katiki Point have significantly increased in size, the
number of breeding pairs at similarly intensely managed sites at Penguin Place on the
Northeastern shores of the Otago Peninsula has declined.
Management of terrestrial threats alone does not appear sufficiently safeguard yellow-eyed
penguin populations. In the case of Katiki Point an initially voluntary set net ban area was
established decades ago (Rosalie Goldsworthy pers. comm.) which may have improved
reproductive success, juvenile and adult survival. Analysing the factors that drive population
parameters in relation to management regimes in greater detail has been recommended (e.g.
Busch & Cullen 2009; Seddon et al. in press) and would be an important and worthwhile
exercise.
While 1 of the 10 breeding sites (selected for data consistency and reliability) on Otago
Peninsula has shown an increase in breeding pairs, the remaining 9 breeding sites
experienced considerable reduction in nest numbers. In addition to substantial fisheries

4350 POP2011-08 Ellenberg & Mattern – Final Report June 2012
�
bycatch (Darby and Dawson 2000), drivers for the observed population decline are complex
but probably include an increase in sea lion predation (particularly apparent in some of the
breeding areas in the Northeast; Lalas et al. 2007), human disturbance impact (Sandfly Bay;
McClung et al. 2004, Ellenberg et al. 2007), and a mix of factors including human
disturbance, varying intensity of predator control, and further fisheries interaction at the
South-western Peninsula breeding areas.
Overall, marine based effects likely play an important role affecting population trends. The
factors driving population changes on the Otago Peninsula and throughout the range of the
yellow-eyed penguin need to be teased apart carefully comparing well designed explanatory
models using validated nest count data and breeding parameters.
While the general appreciation of yellow-eyed penguins has considerably improved since
Richdale’s time, they still face a wide range of challenges in their battle for survival. In
addition to long recognised dangers new threats are emerging such as increasing human
disturbance, novel disease outbreaks, marine pollution, changes in oceanographic conditions
and food supply, and marine habitat degradation due to fisheries activities, which are acting
on top of the bycatch observed in the commercial set net and trawl fisheries. Sea-based threats
in particular are little understood and we need to rapidly increase our knowledge and
understanding in order to make informed anticipatory management decisions to safeguard
yellow-eyed penguin populations.
2.5 Conclusions
There is insufficient knowledge of population levels and trends for most yellow-eyed penguin
breeding areas. We know particularly little about the suspected “population stronghold” in the

4350 POP2011-08 Ellenberg & Mattern – Final Report June 2012
�!
sub-Antarctic. The Auckland Island group is still awaiting its first comprehensive population
census. For Campbell Island the last population census in 1992 is now 20 years back.
Following the Stewart Island census we had to learn that previous estimates may considerably
exceed actual (unexpectedly low) population numbers. Numbers of breeding pairs on the New
Zealand South Island are low and have seen dramatic fluctuations over the last ~30 years.
We have come a long way since Richdale’s time. Yellow-eyed penguins are now valued by
the general public as well as international visitors and commercial tourism operators.
Conservation efforts (including habitat restoration, effective predator control, and visitor
management) have greatly improved the situation for penguins at many breeding areas on the
New Zealand mainland. However, previously unrecognised threats are beginning to emerge
and we are beginning to realise that even intensive management on land alone is not enough
to safeguard yellow-eyed penguin populations.
2.6 Recommendations
Overall, I encourage the maintenance and further improvement of yellow-eyed penguin
monitoring data via standardized monitoring and data acquisition protocols (e.g. employing
electronic aids for data recording) to reduce inconsistencies and improve data quality and
robustness. Long-term population data along with the monitoring of key ecosystem
parameters will not only provide better understanding of terrestrial and marine drivers of
population change but will also allow investigation of secondary effects via complex
ecological networks and multiple stressor interactions and will ultimately provide the basis for
adaptive management strategies.
In the following I explore important issues in more detail.

4350 POP2011-08 Ellenberg & Mattern – Final Report June 2012
�"
2.6.1 Increase nest count reliability and comparability between years
To assess the reliability of yellow-eyed penguin nest counts we recently used double counts
by two independent teams on consecutive days at a range of breeding sites (Hegg et al. 2012).
In 2009, we employed teams of three searchers each with one experienced team leader and
aimed to keep nest search area and effort comparable. We estimated the detection rate of
single nest counts to be around 88% (with some variability depending on steepness of terrain).
Double counts provide the precision to detect annual variations in yellow-eyed penguin
breeding populations as small as 3.3%. Consistent nest search protocols and small teams with
an experienced leader are imperative to conduct both count methods adequately. Since
yellow-eyed penguins are sensitive to human disturbance (Ellenberg et al. 2007, 2009;
Ellenberg 2010) we recommend repeating double counts every five years to obtain precise
estimates for the purpose of long-term population monitoring (Hegg et al. 2012). In order to
evaluate the reliability of nest count data search effort, experience, area, and search conditions
need to be recorded and stored with the data.
2.6.2 Maintain and improve annual population monitoring on the
mainland
The Yellow-eyed Penguin Research Advisory Group has affirmed that the annual recording of
the reproductive performance of marked individuals at selected sites must be sustained so as
to contribute to an electronic relational database maintained by DOC, which currently
contains over 30 years of data (DOC, unpublished data). Maunders et al. (2007) who
attempted to assess potential fisheries impact had to conclude that “estimates of recruitment
are very uncertain. This could be improved by including information about the age-structure
and/or the number of individuals each year that are first time breeders. However, due to some

4350 POP2011-08 Ellenberg & Mattern – Final Report June 2012
��
individuals not being marked, this may be problematic.” It is concerning that there is currently
no funding in place to secure the future of detailed monitoring of important breeding areas,
such as the Boulder Beach complex, for which we have more than 30 years of monitoring
data. It should be a primary objective at least to keep such populations marked. A key
approach for future research will entail the interrogation of long-term population data collated
in the yellow-eyed penguin database (Seddon et al. in press).
2.6.3 Improve data quality, accessibility and maintenance
Currently, the electronic yellow-eyed penguin database comprises “banding records, nesting
records, necropsy reports and other ancillary tables and reports. The electronic database has a
companion set of paper records which contain original data and material not yet entered into
the electronic database. As well there are paper files which cover many more years and study
sites which are held separately” (McKinlay 2012). The draft memorandum of understanding,
intended to provide a basis for future ownership and management of the electronic database,
needs to be completed to allow easier access to database records for research and management
purposes. Furthermore, we need to work up an ability to improve and maintain the yellow-
eyed penguin database. The database suffers from data inaccuracy and inconsistency and
requires substantial cross-validation with paper records to perform scientifically sound
analyses. Over the last year Aviva Stein and Melanie Young have put considerable effort into
correcting database records for the Boulder Beach complex on the Otago Peninsula.
Conclusions from these improved records of one well documented yellow-eyed penguin
breeding area are presented in section 3. Unless similar effort is put into correcting the entire
database, it will not be suitable for detailed analysis or reliable conclusions on the drivers of
population changes.

4350 POP2011-08 Ellenberg & Mattern – Final Report June 2012
��
2.6.4 Sub-Antarctic population census
The yellow-eyed penguin survey on Campbell Island needs to be repeated following the
methods established by Peter Moore (Moore & Moffat 1990; Moore 1992; Moore et al. 2001).
Since beach counts appear to be the most feasible approach to obtain a population census for
remote and logistically difficult areas such as the sub-Antarctic islands, we suggest extending
this approach to the Auckland Island group. However, methods previously established on
Campbell Island will need to be adapted, refined, and enhanced.
A recent survey of yellow-eyed penguin landing sites around Auckland Island group found
the search for landing sites alone not very reliable (Beer 2010). Of 22 landing sites found via
searches for penguin sign by teams of experienced observers walking the coast the previous
day, only 15 were seen to be used by penguins during beach counts the next morning
(meaning that during the incubation period not every landing that showed clear sign of recent
penguin use will be actually be frequented every day). Additionally, these beach counts
revealed that a further 27 sites in the same area had penguins departing without leaving
sufficient sign to be picked up while walking the coast. Hence, more than half of the actual
landings may have been missed by the survey (Beer 2010).
Therefore, any survey that relies on beach counts needs to cover every site more than once
and ideally often enough to account for the sometimes considerable fluctuations in numbers
departing or landing even between days. Here modern technologies can be of considerable
help. Surveillance cameras can be employed at important landing sites for several days or
even weeks producing more representative and reliable data while keeping the logistics
manageable and observer bias low. Such cameras need to be installed by experienced
personnel after establishing important landing sites following initial beach counts in a
particular area. This will also allow validation of camera recordings.

4350 POP2011-08 Ellenberg & Mattern – Final Report June 2012
��
For a reliable population estimate a known and marked population is needed for mark-
recapture analysis and interpretation of beach count data. This should be accompanied by nest
searches to establish the proportion of breeders during a particular season. Nest searches
proved to be difficult in areas of low penguin abundance with sea lion and feral pig activity
(Beer 2010). Thus, it will be most efficient to focus on predator free outliers with plenty of
penguin activity for establishing such baseline data. Using double counts by two independent
teams will provide a more accurate estimate of actual nest numbers (Hegg et al. 2012;
compare 2.6.1). For better representation I suggest a minimum of two such control areas e.g.
on Enderby Island, which is a population stronghold and ideal for logistical reasons, and on
Adams Island covering the entire range of the Auckland Island group. Ideally, comprehensive
information on breeding parameters, foraging ecology and reproductive output would be
gathered during such an effort. Beer (2010) recommends repeating sub-Antarctic surveys of
yellow-eyed penguin numbers every 5-10 years as an index for population trends. Sub-sample
surveys at more frequent intervals will provide additional information essential for the
interpretation of full survey results.
2.6.5 Repeat population census on Stewart Island
The population census on Stewart Island needs to be repeated at regular intervals to establish
the extent of the previously observed decline along the Anglem Coast and if this decline
indeed remains localised and independent of other breeding areas around Stewart Island. For a
more reliable outcome I suggest using double counts of selected areas by independent teams
as a measure of nest count accuracy (Hegg et al. 2012; compare 2.6.1). Since the last
comprehensive population census was in 2008/09 it will need to be repeated in 2013/14 if
aiming at financially and logistically manageable 5 year intervals between surveys for the

4350 POP2011-08 Ellenberg & Mattern – Final Report June 2012
��
purpose of monitoring population trends. However, considering the significant rate of decline
along the Anglem Coast (50% between 1999 and 2007; King 2008) an on-going annual
monitoring programme would be desirable for sample areas.

4350 POP2011-08 Ellenberg & Mattern – Final Report June 2012
��
3. Adult survival, juvenile survival, age of first breeding and
fecundity of yellow-eyed penguins
Authors: Aviva Stein & Ursula Ellenberg
Summary
Adult survival and breeding parameters are fundamental when aiming to assess the risk of
extinction for a species. Threats known to affect the survival of yellow-eyed penguins include
habitat loss, predation, disease, human disturbance, and impacts from fisheries. This chapter
is a summary of existing information relating to adult survival, juvenile survival, age at first
breeding and fecundity of yellow-eyed penguins.
Existing studies report that yellow-eyed penguins have generally a relatively high adult
survival (>85%). Current juvenile survival rates are relatively low, with only 18.8% to 20.8%
surviving to adulthood (1981-2003), compared to 32% in 1936-1954.
Age of first breeding is usually 2-3 years in females and 3-4 years in males. Age-specific
reproduction followed a similar curve to most seabirds, with smaller clutch sizes, hatching
success, and fledgling success in the adolescent and senescent years. The distribution of
lifetime reproductive success (LRS) is highly negatively skewed, with only a small proportion
of the population producing many offspring and subsequent recruits.
Data on adult survival, juvenile survival, age at first breeding and fecundity is either
insufficient or lacking entirely for the majority of yellow-eyed penguin breeding areas (with
some sites on the Otago Peninsula being a notable exception).

4350 POP2011-08 Ellenberg & Mattern – Final Report June 2012
��
Population viability analysis has shown that small changes in yellow-eyed penguin adult
survival can have dramatic effects on the overall risk of extinction. Thus losses of yellow-
eyed penguins due to commercial fisheries activities need to be quantified for a sound risk
assessment.
3.1 Introduction
3.1.1 Factors affecting survival of yellow-eyed penguins
According to life-history theory, adult survival is the single most important life history
parameter for seabirds (Stearns 1992), and is fundamental to consider when assessing a
species risk of extinction. There are several identified threats affecting the survival of yellow-
eyed penguins, including habitat loss, predation, disease, human disturbance, and fisheries
bycatch (e.g. McKinlay 2001, Darby and Dawson 2000). The disappearance of mature coastal
forest is likely responsible for requiring yellow-eyed penguins to nest in sub-optimal habitat
(Richdale 1957; Roberts & Roberts 1973), exposing them to greater risk of heat stress
(Seddon & Davis 1989; Darby & Seddon 1990; Clark 2007). Predation is known to affect the
survival of yellow-eyed penguin chicks, with the possibility of up to 88% of chicks being
killed before fledging at sites lacking predator control programs (Darby & Seddon 1990).
Although adult yellow-eyed penguins are not as susceptible to predation as chicks, feral pigs
Sus scrofa may kill chicks and adults on the mainland and the Auckland Islands (Taylor
2000), and dogs are a serious threat to mainland populations (Hocken 2005). At sea, yellow-
eyed penguins are at risk for predation by sharks, barracouta Thyrsites atun, and fur seals
Arctocephalus forsteri (Hocken 2005; Schweigman & Darby 1997). Predation by female New
Zealand sea lions Phocarctos hookeri, has been recorded, however these events are rare and

4350 POP2011-08 Ellenberg & Mattern – Final Report June 2012
��
recorded events were mainly attributed to one individual (Lalas et al. 2007). Disease
outbreaks have been known to affect yellow-eyed penguins on the mainland and the sub-
Antarctic. The population crash in the 1990-91 breeding season is not well understood,
suggested reasons include toxic diatom bloom or avian malaria (Gill & Darby 1993; Sturrock
& Tompkins 2007, 2008). In recent years diseases such as leucocytozoonosis (Leucocytozoon
spp) and diphtheritic stomatitis (Corynebacterium amycolatum) have been found to infect and
reduce survival in yellow-eyed penguin chicks. Disease-related mortality can affect both
adults and chicks, with recent evidence that diseases occur also on the subantarctic islands
(Argilla et al. 2010, in Seddon et al. in press).
The yellow-eyed penguin is one of the flagships of New Zealand’s wildlife tourism industry
and concern has been raised that tourism related pressures may be becoming too high.
Exposure to frequent unregulated visitor disturbance was associated with reduced breeding
success and lower chick weights at fledging, leading to lower first year survival and
recruitment probabilities (McClung et al. 2004; Ellenberg et al. 2007). Birds that continue to
breed at frequently disturbed sites have not habituated to human proximity, on the contrary,
they showed stronger heart rate and hormonal stress responses to human disturbance
compared to penguins at neighbouring less disturbed sites (Ellenberg et al. 2007, 2009;
Ellenberg 2010). Hence, yellow-eyed penguins exposed to unregulated tourism are not only
disturbed more often, each disturbance event is more costly for the affected birds and
disturbance effects accumulate.
Yellow-eyed penguins are at risk of entanglement in fishing gear (Darby and Dawson 2000;
McKinlay 2001). Yellow-eyed penguins have been recorded as bycatch in inshore nets (Rowe
2009, 2010; Ramm 2010, 2012), however the observer coverage of inshore fishing vessels has
been extremely low (~2%), making an accurate threat level assessment with the available

4350 POP2011-08 Ellenberg & Mattern – Final Report June 2012
�
information impossible (Maunder et al. 2007; Richard et al. 2011). Although there is currently
no evidence for direct competition for food resources with commercial fisheries (Taylor 2000,
but compare Section 5), benthic habitat degradation caused by commercial fishing activities
results in fewer and lower quality prey with implications for population viability (e.g.
Cranfield et al. 2001; Jiang & Carbines 2002; Mattern et al. 2007a, b; Mattern 2008; Browne
et al. 2011).
3.1.2 Age at first breeding
Life-history theory (e.g. Caswell 1982) predicts that individuals attempt breeding as early as
possible in order to maximise reproductive output during their lifetimes. However, under the
assumption that reproduction occurs at a cost of subsequent reduced survival (Williams 1966)
evolutionary theory predicts there will be a single optimal age at first breeding which will
maximise fitness (Stearns 1992). Variation in age at first breeding can be caused by
constraints in the external environment, such as resource availability (e.g. Newton 1985;
Korpimäki 1992), or if the cost of reproduction outweighs survival benefits, in which case a
bird may skip breeding in order to increase the chance of future reproductive success (Curio
1983). Female yellow-eyed penguins have an earlier age at first breeding than males, with
female yellow-eyed penguins mainly breeding between two to three years of age, and males
beginning breeding mostly three and four years of age (Richdale 1957; Darby & Seddon
1990; Stein 2012).

4350 POP2011-08 Ellenberg & Mattern – Final Report June 2012
�!
3.1.3 Fecundity
The yellow-eyed penguin is a solitary breeder, contrasting with the majority of other penguin
species and seabirds that breed colonially (Richdale 1957; Darby & Seddon 1990). Courtship
and nest site selection commences in late August and September, and in September to
October single clutches of up to two eggs are laid approximately three to five days apart
(Richdale 1957; Seddon & Darby 1989). In some rare cases three eggs are found in one nest
bowl, although it is unknown whether the third egg is laid by an additional attending female
(Darby & Seddon 1990; Seddon et al. in press). Incubation is shared by both parents, and
chicks hatch synchronously in November (Seddon & Darby 1989; van Heezik & Davis 1989).
Parents continue to share chick feeding duties until the guard stage from November to
December, and post guard phases until fledging, which occurs in late January to March
(Darby & Seddon 1990).
Yellow-eyed penguins that begin breeding at two to three years of age are more likely to lay
single egg clutches (34% of clutches laid by two year old females were single egg clutches,
whereas single egg clutches were laid by less than 1% by three year old and older; Seddon et
al. in press). Lay date varies for individual females, and egg size usually increases with
female age (Massaro et al. 2002). Young birds also have significantly lower breeding success
(63%) than older birds (89%) during their first breeding attempt (Darby & Seddon 1990).
These younger and less experienced birds may also have shorter pair bonds, and pairs are four
times more likely to separate if the breeding attempt is unsuccessful (Setiawan et al. 2005).
There is often a link between age-specific reproduction and breeding performance. In most
instances for seabirds, reproductive success improves from the first breeding attempt, steadily
increases to a plateau, and eventually declines with senescence (Newton 1989, Partridge
1988). These age-specific increases in fecundity are likely a consequence of a lack of

4350 POP2011-08 Ellenberg & Mattern – Final Report June 2012
�"
breeding and foraging practice in less experienced breeders, as well as increased reproductive
effort in older birds to offset the decline in opportunities to reproduce. Low survival and poor
breeding success in young breeders is common among many species of birds, and could be
the product of underdeveloped foraging strategies, and inexperience with predators (Partridge
1989), while the increasing success could be due to physical maturation, increased foraging,
mate finding and breeding experience, and improvement in breeding site selection (Newton
1989).
3.1.4 Objective
There have been several studies on adult survival, juvenile survival, age at first breeding and
fecundity, beginning with Lance Richdale’s long-term study between 1936-1954 (Richdale
1957). Considerable monitoring and research effort at certain sites on the Otago Peninsula
resulted in some 30 years of population data. However, population data and observations from
yellow-eyed penguin breeding sites on the mainland (the Catlins, North Otago and Banks
Peninsula) are less consistent and we know little about offshore island populations including
Codfish Island, Stewart Island, and the Auckland and Campbell Islands. The aim of this
chapter is to summarise existing information on adult survival, juvenile survival, and
fecundity of yellow-eyed penguins.
3.2 Methods
3.2.1. Study site
The majority of existing data is from the Otago Peninsula population of yellow-eyed penguins
has been collected from the Boulder Beach Complex on the Otago Peninsula (45°500 S and

4350 POP2011-08 Ellenberg & Mattern – Final Report June 2012
��
170°300 E, Figure 1.1). Boulder Beach is approximately three kilometres in length, and is
divided into four sections: Double Bay; Midsection; Highcliff A1; and Highcliff. This
complex was regularly chosen as a study site as it supports a large population of yellow-eyed
penguins and has an inter-decadal history of being intensively monitored. It has received
irregular predator trapping effort over time. This site has longest history of chick banding, and
thus the majority of chicks fledged at this site have been banded.
3.2.2 Existing adult survival data
Existing data on adult survival was gathered and summarised from the following sources:
1.) Richdale (1957) measured age specific survival (recovery) rates for 30 male and 21 female
yellow-eyed penguins that began breeding on the Otago Peninsula between 1936 and 1953.
2.) Efford et al. (1994) calculated Jolly-Seber survival rates for 339 birds breeding at Boulder
Beach, Otago Peninsula, between 1981 and 1992. Survival rates represent the probability of a
bird remaining alive and in the local population until the following breeding season.
3.) Edge et al. (1996) studied how reproduction and parental quality may affect adult survival
of yellow-eyed penguins, and whether or not breeding experience may be used to predict
adult survival. This study analysed data from 260 birds breeding on the Otago Peninsula
between 1982-1994, and included survival data from the 1989 breeding season when there
was a mass mortality event during which 150 juvenile and adult yellow-eyed penguins on the
Otago Peninsula died over a two-month period (Efford et al. 1994).
4.) Edge et al. (1999) analysed recovery rates from 58 birds in 1992, and 62 birds in 1993,
breeding at Boulder Beach on the Otago Peninsula. A sample of these birds was subjected to a
brood manipulation experiment.

4350 POP2011-08 Ellenberg & Mattern – Final Report June 2012
��
5.) Ratz et al. (2004) compared overall survival rates between Ryans Beach and Pipikaretu on
the Otago Peninsula over six breeding seasons between 1991 and 1996.
6.) McKinlay (1997) performed a population viability analysis (PVA) to estimate the
extinction probability for yellow-eyed penguins breeding on the Otago Peninsula, the Catlins,
North Otago and the Auckland and Campbell Islands. The issues examined were: mortality
across all age classes, migration and movement, impact of El Niño Southern Oscillation
events, minimum breeding area, habitat size, usage of new habitat and predation.
3.2.3 Existing juvenile survival data
1.) Richdale (1957) calculated a juvenile mortality rate by assuming age at first breeding to be
three years for males and females, and the mortality rate was the same for two year olds and
juveniles. Richdale (1957) also studied juvenile return rates from 399 birds banded as chicks
between 1939 and 1949 on the Otago Peninsula.
2.) Efford et al. (1994) analysed recovery data from 587 birds banded at the Boulder Beach
Complex on the Otago Peninsula between 1981 and 1990.
3.) Stein (2012) analysed recovery data from 2032 birds banded between 1981 and 2003 at the
Boulder Beach complex.
3.2.4 Existing age at first breeding data
1.) Richdale (1957) documented the age at first breeding for 304 yellow-eyed penguins
between 1936 and 1947 on the Otago Peninsula.

4350 POP2011-08 Ellenberg & Mattern – Final Report June 2012
��
2.) Stein (2012) calculated age at first breeding from a sample of 209 yellow-eyed penguins
(107 females, and 102 males) banded as fledglings between 1981 and 1998 at the Boulder
Beach complex, Otago Peninsula.
3.2.5 Existing fecundity data
1.) Stein (2012) calculated updated age-specific breeding information from a sample of 199
female yellow-eyed penguins banded as fledglings between 1981 and 2005, breeding between
1983 and 2010 at the Boulder Beach Complex. This study also analysed factors affecting the
lifetime reproductive success (LRS) of a sample of 209 yellow-eyed penguins breeding at
Boulder Beach between 1984 and 1998.
3.3 Results and Discussion
3.3.1 Adult survival Estimates
There are several published estimates of adult survival of yellow-eyed penguins (Table 3.1).
Studies by Richdale (1957), Efford et al. (1994), Edge (1996), Edge et al. (1999) and Ratz et
al. (2000) estimated adult survival to be >80% on the Otago Peninsula, except for an isolated
population crash in the 1989-90 breeding season (c. 50%) reasons for this crash remain little
understood (Table 3.1).
Richdale (1957) estimated yearly survival to be 85.4% between 1936-1954, and concluded
that there is little reduction in adult survival rates once birds reach maturity. Richdale also
noted a slightly lower survival rate for females of 85.7% compared with 87.4% for males
(Richdale 1957).

4350 POP2011-08 Ellenberg & Mattern – Final Report June 2012
��
Efford et al. (1994) estimated adult survival to be 80% or higher in every year excluding
1989-90, when it fell to 50%, due to the unidentified mortality event (Gill & Darby 1993,
Efford et al. 1994). These numbers are similar to those reported by Richdale (1957), and no
significant differences were found when compared. Emigration was low and therefore a
negligible factor for survival analysis, with only 5.9% (20 of 339) of birds found breeding at
sites other than their natal colonies (Efford et al. 1994).
Edge et al. (1996) estimated survival for adult yellow-eyed penguins breeding at Boulder
Beach 1982-1994 to range between 72 ± 5% and 94 ± 1%, excluding 1989 when survival
rates were between 20 ± 6% and 59 ± 5%. Results indicated that yearly survival of
experienced breeders with chicks was 94 ± 1%, and the survival rate for inexperienced
breeders with chicks was 89 ± 2%. The survival rate for experienced breeders without chicks
was 83 ± 3%, and inexperienced breeders that failed to hatch chicks had an estimated survival
rate of 72 ± 5%. Edge (1996) found a link between reproductive success and probability of
survival to the next breeding season, and that age and breeding experience were important
predictors for adult survival in the following season.
Edge et al. (1999) found that in 1992, survival rates were 14/14 (100%) and 14/15 (93%) for
parents of manipulated and natural single-chick broods respectively. This was compared to
recovery rates of parents of two-chick nests which were 25/29 (86%), with an overall adult
recovery rate of 91.3%. In 1993 survival rates were 11/12 (92%) and 16/18 (89%) for parents
of manipulated and non-manipulated single-chick broods respectively, and 29/32 (91%) for
parents of two-chick nests, with an overall recovery rate of 90.3%. Differences between years,
brood sizes and whether or not broods were manipulated were not significant. Overall
survival from the two years was >86%.

4350 POP2011-08 Ellenberg & Mattern – Final Report June 2012
��
Ratz et al. (1994) found that the average annual survival was 90% for two study sites on the
Otago Peninsula combined over four seasons. This study also found no significant difference
between survival of males (93%) and females (90%).
Population Viability Analysis (PVA) by McKinlay (1997) showed that the entire species is
unlikely to go extinct within the next 1000 years; however sub-populations are significantly
more vulnerable. For example, the Otago Peninsula population may go extinct within a few
hundred years; increased adult mortality would accelerate this process considerably
(McKinlay 1997). PVA showed that even small fluctuations (~1%) in adult survival had
dramatic effects on the probability of extinction (McKinlay 1997). While existing extinction
risks were reported to be sufficiently close to zero, populations were found to be barely
maintaining themselves.
In long-lived species like yellow-eyed penguins, changes in mortality rates of adults have the
most dramatic effects for the population. Natural variations in adult survival are likely to be
driven by food availability (Efford et al. 1994). However, it is important to understand any
additional threats affecting adult survival, since even small changes in mortality can
significantly affect the overall risk of extinction (McKinlay 1997).
3.3.2 Juvenile Survival
Richdale (1957) found that of 399 fledged chicks 152 (38%) were re-sighted in the four
months after fledging, 129 (32%) were re-sighted as two year olds, and 108 were re-sighted as
three year olds (i.e. 27% survived from fledging until three years of age; Table 3.2).
The current low juvenile survival from fledgling to sexual maturity is likely to be accountable
for the sparse numbers of breeders recruiting to breeding populations (13.8%; Stein 2012).

4350 POP2011-08 Ellenberg & Mattern – Final Report June 2012
��
Stein (2012) found that only 18.8% of yellow-eyed penguin fledglings survived to maturity, a
similar proportion to the 20.8% (122/587) of juvenile yellow-eyed penguins re-sighted as
adults at the Boulder Beach complex between 1981 and 1990 calculated by Efford et al.
(1994).
The most common hypothesis for the high rate of mortality in young birds is their inability to
feed themselves (Orians 1969; Dunn 1972), and this is most likely the case for yellow-eyed
penguins. To capture prey the penguin must swim faster than its prey, at least over short
distances. Rory Wilson (1985) demonstrated that adult Jackass penguins Spheniscus demersus
can swim significantly faster than juveniles of the same species, and recently fledged young
swim slower still so that they are unable to capture any of the important yet fast moving prey
species, such as anchovies, herring and mackerel. Fledging weights are an important predictor
of juvenile survival in many seabird species, e.g. kittiwakes Rissa tridactyla (Coulson and
Porter 1985), sooty shearwaters Puffinus griseus (Sagar and Horning 1998), grey-headed
albatrosses Diomedea chrysostoma (Reid et al. 2000), and yellow-eyed penguins (McClung et
al. 2004). A well fed chick likely has more time to build up muscles and to learn efficient
foraging strategies. However, we currently have little information what factors drive yellow-
eyed penguin fledgling weights in the Boulder Beach complex.
Therefore, the reason why the juvenile survival is currently so much lower than during
Richdale’s times remains a matter of speculation. Factors affecting the food availability
particularly around the Otago Peninsula need to be determined.
3.3.3 Age at first breeding
Between 1936 and 1947 about half of the yellow-eyed penguin females started breeding at
two years of age (48%), compared to only 8% of males of the same sage (Richdale 1957).

4350 POP2011-08 Ellenberg & Mattern – Final Report June 2012
��
Another 48% of females began breeding at three years, and the remaining 4% began breeding
at age four. 47% of the males started breeding when 3 years old, and 33% did not breed
before their fourth year (Richdale 1957).
Stein et al. (2012) analysed complete life history data from a sample of 209 birds (107
females, and 102 males) banded as fledglings between 1981 and 1998 and found similar
trends to Richdale (1957), except for the significantly higher numbers of females beginning
breeding at age two (Table 3.3). This could be attributed to differences in monitoring effort
and detection.
Stein (2012) found that, although success for first time breeders is often relatively low, age at
first breeding was a significant predictor of lifetime reproductive success (LRS, number of
banded offspring fledged during an individual bird’s lifetime) for yellow-eyed penguins. This
corresponds with the conclusions of Newton (1989) who reports that in many long-lived
seabirds, individuals that start breeding later will produce fewer lifetime offspring as a result
of a decrease in total breeding opportunities throughout the bird’s life.
3.3.4 Fecundity
Age-specific reproduction followed a similar curve to most seabirds, with smaller clutch sizes
and success rates in the adolescent and senescent years. Yellow-eyed penguins lay smaller
clutches at ages two and three, with fecundity increasing and reaching a plateau between ages
four to 13. Breeding peaked between ages 13 and 17, and declined thereafter (Stein 2012,
Table 3.4).
Stein (2012) found that the mean lifetime number of offspring produced was 5.00 for females,
and 4.31 for males (Table 3.5). Longevity was the strongest correlate of LRS, with the

4350 POP2011-08 Ellenberg & Mattern – Final Report June 2012
�
number of offspring produced increasing significantly with increased lifespan. There was high
individual variance in LRS calculated for both males and females, with females
demonstrating a higher range of observations among individuals than males (Figure 3.2).
For yellow-eyed penguins, the maximum number of fledged offspring for both males (20
chicks, Bird ID: J2165; Table 3.5) and females (22 chicks, Bird ID: J2377) is high compared
to the mean LRS of 4.31 and 5.00, respectively. The distribution of LRS was highly
negatively skewed, being consistent with other studies that have found that most individuals
produce small numbers of young, with only a few birds of exceptionally quality producing
many offspring and thus contributing most to the next generation (Clutton-Brock 1988;
Newton 1989).
3.4 Conclusions
Since yellow-eyed penguins are a long-lived species and lifetime reproductive success
depends on lifespan, adult survival is a paramount concern for this species.
Juvenile survival (~20%) on the Otago Peninsula in the past 20 years was lower than what
was observed by Lance Richdale some 60 years ago (32%). Reasons for the increased
juvenile mortality are unclear. Starvation i.e. inexperience to find food is thought to be the
main cause of juvenile mortality. Hence, factors affecting the availability and quality of
yellow-eyed penguin prey need to be analysed. This includes benthic habitat degradation as a
result of anthropogenic factors, such as commercial bottom fisheries (e.g. bottom trawls,
oyster dredging), or increased sedimentation, as well as reduced prey abundance as a result of
high fishing pressure on spawning stocks (e.g. red cod fisheries off the Otago Peninsula). It is
difficult to assess to which extent fisheries bycatch might contribute to the increase in juvenile

4350 POP2011-08 Ellenberg & Mattern – Final Report June 2012
�!
mortality as the independent observer programme reports currently do not distinguish
between juvenile and adult birds.
The majority of existing studies have utilised the long-term data collected from yellow-eyed
penguins on the Otago Peninsula to produce sufficient evidence regarding survival rates, age
at first breeding and fecundity of yellow-eyed penguins. However, data is either insufficient
or non-existent for other sites, including the assumed population stronghold on the sub-
Antarctic Campbell and Auckland Islands. The birds breeding in the sub-Antarctic are
genetically distinct from the mainland population; as migration is negligible these populations
need to be managed separately. Until there are even baseline measures available for sub-
Antarctic populations, it will be impossible to identify any relevant trends or changes on a
population level.
Since even small fluctuations in adult survival can greatly increase the risk of extinction for
yellow-eyed penguins, it is important to analyse factors that affect adult survival. Particularly
the extent of mortality via entanglement in fishing gear is poorly understood and needs to be
quantified urgently.

4350 POP2011-08 Ellenberg & Mattern – Final Report June 2012
�"
4. Foraging ecology of yellow-eyed penguins
Author: Thomas Mattern
Summary
Yellow-eyed penguins breeding on the mainland have been found to be almost exclusive
benthic foragers taking the majority of their prey at or close to the seafloor. The species
exhibits consistent at-sea movement patterns where the birds tend to have individual foraging
sites that they revisit on consecutive foraging trips and even between years. Foraging ranges
vary between sites, however, during the breeding season the majority of breeding Yellow-
eyed penguins stay within 20km from their nest sites. During incubation and post-guard
stages these ranges can be extended to 50-60km. There is currently no information available
on the foraging ranges of penguins outside the breeding season (or juveniles), but presumably
they employ similar benthic foraging strategies. Therefore, non-breeding penguins can be
expected to forage anywhere over the continental shelf, although it seems unlikely that
penguins forage in waters deeper than 150m.
The penguins’ individual foraging sites are characterised by diverse benthic communities
such as horse mussel fields and or oyster beds with associated sponge and coral assemblages
that provide food and shelter for invertebrates and fishes. Main prey species are demersal (i.e.
seafloor dwelling) species such as blue cod and opalfish. Pelagic species like sprat, arrow
squid and ahuru are also taken, although diving behaviour suggests that these are also caught
at or near the seafloor. Benthic communities provide a spatially predictable source of food out
of reach for most other seabirds, thus, reducing competition for the penguins. This specialised
foraging strategy comes at the expense of behavioural flexibility if the penguins are exposed
to disturbances of the benthic ecosystem. Although the birds are able to extend their foraging

4350 POP2011-08 Ellenberg & Mattern – Final Report June 2012
��
ranges and effort, they still require intact benthic communities within reach. Whether the
foraging behaviour observed on the mainland also applies to the sub-Antarctic populations is
unsure, but a primarily benthic foraging strategy is feasible around both the Auckland Islands
and Campbell Island.
4.1 Introduction
Although yellow-eyed penguins have received considerable scientific attention in the past
decades, our understanding of their marine ecology is based on only a handful of studies.
Access to results is furthermore limited as a good amount of the work has never been, or is
yet to be published.
Since 1990 three papers were released that focussed on the foraging behaviour of the species
(Seddon & van Heezik 1990, Moore 1999, Mattern et al 2007a). Additional information on
the marine ecology of yellow-eyed penguins can be gleaned from Peacock et al (2000).
In the same time period, six papers dealing with the diet of yellow-eyed penguins have been
published in scientific journals (van Heezik & Seddon 1989, van Heezik 1990a,b, van Heezik
& Davis 1990, Moore & Wakelin 1997, Browne 2011).
Apart from scientific publishing, several theses and reports touching on the yellow-eyed
penguin’s marine ecology have emerged in the past three decades (van Heezik 1989, Peacock
1995, Mattern 2006a, Browne 2007). Some of these cover or expand on data published in
above listed papers. A considerable amount of foraging research has been conducted between
2003 and 2007 – primarily by Thomas Mattern, University of Otago. While most of the data
has been analysed, results have yet to be summarised and published. However, general
outcome of the studies has been disseminated through unpublished reports as well as

4350 POP2011-08 Ellenberg & Mattern – Final Report June 2012
��
presentations and posters on national and international conferences (Mattern et al. 2005a,
2007b, Mattern 2006b, 2008).
4.2 Methods
This report is based on two sources – published accounts and unpublished data. Available
publications relevant for the foraging ecology of yellow-eyed penguins were reviewed and are
summarised in the Results section (4.3). To provide an overview of foraging parameters and
diet composition, data from publications as well as unpublished material have been collated in
Tables 4.1a-c. Foraging parameters cover the three breeding stages – incubation, chick-guard
and post-guard. Data are grouped by site and breeding season. Definitions of foraging
parameters are as follows:
� Trip duration (h)
Duration of an individual foraging trip either determined from nest attendance patterns
(Seddon & van Heezik 1989), via automated VHF signal data loggers in the nesting
area (Moore 1995, 1999) or from the time interval between the first and last recorded
dive events (all other data).
� Foraging range (km)
Maximum distance a penguin reached from its nesting site during a foraging trip.
� Distance covered (km)
Minimum horizontal distance a penguin covered during a foraging trip as calculated as
the sum of distances between from successive position fixes. The distance does neither
include the deviations from the straight line course a penguin was assumed to have

4350 POP2011-08 Ellenberg & Mattern – Final Report June 2012
��
followed, nor does it incorporate the vertical component (i.e. the dives) of a penguin’s
foraging trip.
� Number of dives per trip (n)
Number of dives per trip is the sum of diving events during which the penguins
reached depths >1m. Mattern et al (2007a) only considered dive events >3m due to
sensor inaccuracies of some of additional Time-Depth Recorders (TDR) used during
this study. No information is available as to how Moore et al (1995) distinguished
surface noise from true dive events.
� Proportion of benthic dives (%)
Dives were categorised as either pelagic or benthic (i.e. to the seafloor). Dives were
defined as benthic when dive profiles had a trapezoidal shape (steady descent,
horizontal bottom phase with little undulations, steady ascent) and dive bouts featured
a constant maximum dive depth (see Fig 4.1).
� Mean dive duration (s)
The time interval between onset and end of a dive event. Onset of a dive event was the
exact time of the last zero value before depth sensor registered positive pressures.
Accordingly, the end of a dive event was the time of the first zero value recorded after
>0 bar pressures were logged.
� Max depth reached (m)
The single maximum depth recorded during a foraging trip.
All foraging parameters were calculated from individual means, i.e. if individuals performed
more than one foraging trip during the deployment period, means were calculated from the
different trips performed by that bird.

4350 POP2011-08 Ellenberg & Mattern – Final Report June 2012
��
Information about the yellow-eyed penguin’s feeding ecology (i.e. diet composition) was
summarised from six publications (van Heezik & Seddon 1989, van Heezik 1990a,b, van
Heezik & Davis 1990, Moore & Wakelin 1997, Browne et al 2011). All publications used the
same parameters to describe relative importance of prey species which are summarised in
Table 4.2. Reproduced in this report are
� Mean frequency of Occurrence (% FO)
%FO describes the number of samples containing the respective prey species as a
percentage of the total number of samples.
� Mean percentage of total calculated meal weight (% weight)
The mass contribution of an individual prey species was calculated via allometric
equations using otolith (fish) or beak (squid) dimensions. % weight describes how
much biomass the respective prey species contributed to the total meal size the
penguins brought ashore.
4.3 Results
4.3.1 Foraging behaviour
Maximum dive depths of yellow-eyed penguins – Seddon and van Heezik (1990)
A first foray into the experimental examination of the species’ diving capabilities was
conducted by Seddon and van Heezik (1990) who used capillary depth recorders to determine
maximum dive depths of yellow-eyed penguins from Boulder Beach, Otago Peninsula. The
capillary depth recorders consisted of narrow PVC tubes that were sealed on one side and
coated with water soluble powder on the inside. When a bird dived, water entered the
capillary and washed out the powder. The distance water was able to enter the tube depended

4350 POP2011-08 Ellenberg & Mattern – Final Report June 2012
��
on the ambient pressure so that the length of tube clear of powder allowed the estimation of
the maximum dive depth.
Of the 110 depth recorders that were deployed, 43 were recovered of which 24 allowed the
determination of maximum dive depths. The average maximum dive depth was 34±8m
(range: 19-56m). Dive depths were independent from sex, i.e. male and female penguins
dived to comparable depths. The same study also obtained stomach samples of six penguins
from the same location and found that their diet was dominated by demersal species (see also
4.3.2). Accordingly it was concluded that the dive depths recorded represented values from
dives to the sea floor.
Capillary dive recorders provide only a crude measurement of the maximum depth reached
during an entire foraging trip. Especially on animals that dive regularly to fixed depths – like
benthic foragers – capillary dive recorders tend to overestimate the maximum dive depth
(Burger and Wilson 1988). However, later studies of diving behaviour conducted at the same
site (Moore et al. 1995; Mattern, unpubl. data) showed that the depths determined by Seddon
and van Heezik (1990) seem to be reasonably accurate.
Foraging ranges and dive behaviour 1991-1995 – Moore et al (1995), Moore (1999)
A more sophisticated approach was used by Peter Moore and colleagues. Following the
population crash in 1990 (Section 2), a comprehensive study of at-sea behaviour was
conducted that involved radio telemetry and deployment of dive loggers.
Foraging ranges were determined by deploying radio transmitters on 14 individual penguins
from Boulder Beach, Otago Peninsula over three consecutive seasons 1990/91-1992/93; 6
birds were repeatedly tracked in all three years while an additional 8 birds were added to the
sample in 1991/92 and 1992/93. At Long Point, Catlins 23 birds were tracked during the post
guard stages of the seasons 1992/92 (19 birds) and 1992/93 (4 birds). The study covered all

4350 POP2011-08 Ellenberg & Mattern – Final Report June 2012
��
stages of breeding (i.e. incubation, chick guard, post-guard) except for the first season which
commenced in the post-guard stage (February 1991). In the Catlins, penguins were only
tracked during the post-guard stage.
Radio transmitters were glued to the penguins’ backs where the devices stayed for a two to
three week period before they were recovered. Foraging trip durations were estimated from
automated data-logging stations that recorded the presence of radio transmitter signals in the
study areas at 10 minute intervals. The penguins’ at-sea positions were calculated via signal
triangulation from two tracking stations approximately 15km apart on land; bearings were
recorded at 1 hour intervals and position accuracy varied depending on distance from the
coast between 270 and 1,500m.
A summary of foraging data recorded is given in Tables 4.1a-c. At the Otago Peninsula, trip
duration and foraging ranges were considerably longer during the incubation stage when
compared to the chick-guard stage and the post-guard stage. Failed breeders or non-breeders
stayed at sea for longer and travelled farther. It appears that the foraging trip duration during
the incubation phase gives an indication for potential breeding failure later on, with failed
breeders generally exhibiting longer trips during the incubation stage when compared to
successful conspecifics.
Moore (1999) mentions that the foraging trip durations recorded during the post-guard stage
in the Catlins were significantly shorter when compared to the Otago Peninsula. However, it
seems results were biased by certain Catlins individuals in the season 1993/94 which tended
to perform up to three short foraging trips per day (see Moore 1999, Table 4.1c). Mean trip
durations for the years 1991/92 and 1992/93 do not indicate significant differences between
the two breeding locations (Catlins v. Otago Peninsula; 1991/92: 13.5±5.4 v. 15.9±5.4,
1992/93: 13.6±6.6 v. 14.4±6.8). The foraging ranges at both sites also did not differ

4350 POP2011-08 Ellenberg & Mattern – Final Report June 2012
��
significantly. Judging from the presented data foraging ranges of yellow-eyed penguins from
Catlins and Otago Peninsula are similar.
The penguins generally stayed over the continental shelf with the majority of birds from the
Otago Peninsula foraging in water depths of 40-80m, some 5-16km to the South and South-
west of their breeding sites. In the Catlins most penguins foraged in deeper waters (80-120m).
The analysis of individual foraging patterns revealed that each penguin had well-defined
centres of activity that were retained between trips and years. Furthermore, some individuals
tended to consistently forage much closer inshore (<5km from coast) while others generally
travelled further offshore than the majority of birds (>16 km from coast). Moore (1999) was
unsure as to whether the habitual foraging patterns reflected “the favouring of particular areas
or some other factors, such as the birds taking a similar heading each day” (this question was
addressed later by Mattern et al (2007), see below). However, prey items differed depending
on whether a penguin foraged closer or further from the shore. Penguins with centres of
activity closer to the coast ate proportionally more blue cod and sprat, while penguins
foraging further offshore brought mainly opalfish and arrow squid ashore.
To supplement the telemetry study, time-depth recorders (TDR) were deployed on a total of
11 penguins from the Otago Peninsula (n=8) and the Catlins (n=3) (Moore et al 1995). The
TDRs consisted of an electronic pressure transducer that recorded ambient pressure at
predefined intervals and stored data with a corresponding timestamp to a memory chip. After
recovery of the device, the data could be downloaded to a computer for analysis. The report
does not reveal the exact technical details of the devices nor does it elaborate on the intervals
at which depth readings were recorded. Dive data was recorded for a total 74 days of foraging
representing 62 foraging trips. At both locations, a bimodal distribution of dive depths was
apparent. The penguins tended to either perform shallow dives ranging between 5 and 30 m,
or deeper dives of 40-60m off the Otago Peninsula, and 80-110 m off the Catlins coast.
4350 POP2011-08 Ellenberg & Mattern – Final Report June 2012
�
Maximum dive depths recorded were 66.2 m (Otago Peninsula) and 127.9 m (Catlins). The
deeper dives almost certainly represent benthic dives as the depths reached correspond to the
water depths of the continental shelf areas that the birds foraged over.
Climatic influence on population dynamics and foraging conditions – Peacock 1995,
Peacock et al. 2000
Lora Peacock from the Department of Zoology at the University of Otago took a more
theoretical approach to explain the strong population fluctuations observed in the early 1990s.
For her MSc thesis she modelled population variables in relation to climatic parameters such
as sea surface temperatures and rainfall to gain some understanding as to whether and how
periodical climatic events, namely El Niño Southern Oscillation, affect the penguins’
population dynamics. While not directly focussing the foraging ecology of yellow-eyed
penguins the study nevertheless draws some conclusions with regard to the species at-sea
biology.
The study found that long-term climate change is likely to have a stronger impact on long-
term population trends when compared to periodical El Niño events. While the results did not
provide enough information to isolate the mechanisms by which penguin numbers are
influenced, it suggested that changes in ocean productivity may play a pivotal role. In the
1930s and 1940s population variables (e.g. breeding success) tended to decrease in years with
cold and wet conditions. Such years coincided with severe south-westerly storms that were
thought to affect the penguins’ food availability (Richdale 1957). This pattern seemingly
reversed in the latter decades of the 20th century when poor the seasons 1986, 1989 and 1990
all followed years of warmer and drier conditions. Peacock et al. (2000) hypothesised that
presently yellow-eyed penguins might benefit from the fact that cooler seasons positively
influence larval survival of the penguins’ prey species like sprat and ahuru.

4350 POP2011-08 Ellenberg & Mattern – Final Report June 2012
�!
Consistent foraging routes and benthic foraging – Mattern et al (2007)
The new millennium saw the introduction of new devices based on the Global Positioning
System (GPS) that not only allowed penguin tracking with unprecedented accuracy (Wilson
2004), but also incorporated high-precision pressure sensors to record fine-scaled diving
behaviour with depth resolutions of 10cm (Mattern et al. 2005b). Such devices – GPS TDlogs
produced by earth&Ocean Technology in Kiel, Germany – were first deployed on yellow-
eyed penguins breeding at Bushy Beach in Oamaru, North Otago. In the breeding seasons
2003/04 a total of 4 penguins were fitted with GPS loggers that yielded data of 7 foraging
trips. An additional 3 penguins were fitted with smaller Time-Depth Recorders (TDR; MK9,
Wildlife Computers, Redmond, WA, USA) that only recorded diving behaviour at 0.5m
resolutions and provided dive data of 17 foraging trips. The following season 2004/05,
another four penguins were fitted with GPS dive loggers and resulting in data of five foraging
trips.
The logger data provided a detailed insight into the penguins foraging habits. The penguins
performed either one-day long foraging trips (mean trip duration: 11.5-12.9hrs) or shorter
evening trips (4.0±0.9 hrs; see Mattern 2007)1. Evening trips, which were only recorded in
2003/04, were characterised by short foraging ranges (6.2±0.8km) reasonably short travel
distances (15.9±1.2km) during which the birds dived 108±15 times. During full one-day trips,
penguins foraged on average 17.5±2.5km from their nest sites, covered 47.5±1.8 km and
performed 246±39 dives (Mattern 2007). In the following season 2004/05 only one-day trips
1 To allow comparison with data from other sites, data for evening and one-day trips that were kept separate in
Mattern et al (2007) have been combined in Table 4.1b.

4350 POP2011-08 Ellenberg & Mattern – Final Report June 2012
�"
were recoded. Foraging parameters recorded were comparable to those determined on one-
day trips the previous season.
As a geographic position could be associated with most of the dives recorded by the GPS
loggers, it was possible to quantify the benthic foraging behaviour that was suspected in the
previous studies. The penguins indeed dived predominantly to the seafloor (80.3-91.5% of all
dives, see Table 4.2b). Surprisingly, the penguins not only dived predominantly to the
seafloor when they were actively searching for prey at their main foraging grounds, but also
when they were travelling to those sites. Only on the return journey the proportion of benthic
dives decreased (Mattern 2007).
All penguins foraged to designated, individual foraging sites that were revisited on
subsequent trips and in subsequent seasons. This corresponded well with the findings of
Moore (1999). The relatively shallow depths off Oamaru permitted a scuba survey of one of
those foraging areas and found a horse mussel (Atrina zelandica) field in an otherwise
featureless benthic environment that was dominated by sand and silt. The horse mussel shells
protrude from the seafloor and thus provide substrate for epibenthic fauna such as sponges
and coral, which in turn sustain a diverse benthic community of invertebrates, crustaceans and
fish (Cummings 2001). It appears the penguins specifically target such horse mussel fields as
they provide a stable and predictable supply of prey. This in turn raised the question how well
the penguins are able to respond to disturbances within their foraging grounds.
Furthermore, this study revealed that the penguins use benthic features – e.g. reefs, shingle
patches and associated flora – to precisely navigate to their foraging grounds (Mattern et al.
2007). It appears that yellow-eyed penguins not only dive to the seafloor in pursuit of prey,
but also to use underwater landmarks for route finding similar to homing pigeons.

4350 POP2011-08 Ellenberg & Mattern – Final Report June 2012
��
Foraging along straight lines, Otago Peninsula – Mattern et al (2005, unpubl. data)
An outbreak of diphtheritic stomatitis in yellow-eyed penguins caused significant chick
mortality in November 2004 (Houston 2005). In an effort to determine whether this outbreak
might have been triggered by a sea-based pathogen (e.g. water pollution from Dunedin’s
sewage outfall), GPS loggers (GPS-TDlog, earth&Ocean Technology, Kiel, Germany) were
deployed on breeding yellow-eyed penguins. Between late November 2004 and early January
2005, nine birds from the Boulder Beach complex (Southern Otago Peninsula) and four birds
from Ryan’s Beach (n=3) and Pipikaretu (n=1) (Northern Otago Peninsula) were fitted with
loggers. While all deployments at Boulder Beach occurred during the chick-guard stage, the
penguins from Ryan’s Beach/Pipikaretu had already entered the post-guard stage of breeding.
In the following season, GPS loggers were deployed on four of the Boulder Beach birds. Two
of the birds were still guarding chicks, the other two had chicks old enough to be left alone at
the nest (post-guard).
During the 2004/05 season data for a total of 13 complete foraging trips were obtained at
Boulder Beach. Of the four penguins from the Northern Otago Peninsula, only three birds left
to forage during the logger deployment; yielding data for one foraging trip each. While the
four birds fitted with GPS loggers in the 2005/06 season performed a total of 11 foraging
trips, dive data was only recorded on one bird (band no: 14647, three trips); during the
remaining deployments the dive sensor failed.
In the chick-guard stage of the 2004/05 season, the birds from Boulder Beach all undertook
one-day foraging trips that lasted around 14.6 hours (see Table 4.2b), which means that trip
durations were around 2-4 hours longer than what was reported by Peter Moore (1999).
Foraging ranges were also considerably longer with 25.8±4.3 km. In the following season, the
two birds fitted with loggers during chick guard foraged much closer to their breeding site and
stayed at sea for shorter time periods. In fact, one of the two (band no: 14688) performed five

4350 POP2011-08 Ellenberg & Mattern – Final Report June 2012
��
evening trips (mean trip duration: 5.9±4.2, mean foraging range: 6.0±3.0 km). In the previous
season it had foraged for one full day only while fitted with a logger (trip duration: 12.2hrs,
foraging range 17.2km). For the other bird (band no: 14647), foraging parameters were more
comparable between both seasons. In 2004/05 it left on a single one-day trip (14.2 hrs,
22.6km), and in the following season it performed three trips, one evening trip (8.4 hrs,
7.1km) and two one-day trips (16.5±2.3hrs, 15.7±2.6km). So the apparent differences
between both seasons (Table 4.2b) are likely to be strongly biased by individual variation.
However, observed foraging patterns differed significantly between both seasons. In 2004/05
birds from the Boulder Beach complex exhibited remarkable at-sea movements. 6 of the 8
birds foraged further than 14km from their nest site. All 10 trips recorded for these birds
featured patterns that were rather unusual in that the birds foraged along straight line courses
that were parallel to the coast. While the birds’ movements away from the coast appeared
“normal”, i.e. their courses were not particularly straight, all birds at some point changed their
heading from more or less South to either Northeast or Southwest. After these course changes
the birds moved along straight lines that could not have been drawn straighter with a ruler on
a map. Most of the birds not only followed the straight lines once but followed exactly the
same line repeatedly in both directions. While on the lines, the birds did not deviate more than
50m from the straight line course which corresponds to the accuracy of the GPS unit. A total
of 5 distinct lines were identifiable from the GPS data, two of which were followed by two
and three birds, respectively. All five lines were parallel to each other; two of the lines
appeared to be segments of a single longer line. The length of the lines ranged from 0.5-
9.7km. If the birds’ traveling periods from and to their nesting sites (ca. 3-4hrs both ways) are
disregarded, the penguins spent an average 6.6 hours actively foraging in water depths of
about 80 meter. During this time, the birds spent between 52-95% of their time on the straight
line courses. 95% of their dives were bottom dives (Mattern 2005). As it was impossible to

4350 POP2011-08 Ellenberg & Mattern – Final Report June 2012
��
organize a drop camera or ROV at the time, it probably will be difficult to provide clear
evidence for the origin of the straight line courses observed in 2004/05. In the following
season, none of the four birds that had foraged along the lines in the previous year did so in
2005/06. So it can be assumed that the observed patterns were a one-off which further
underlines that permanent, natural features played no role in the unusual foraging behaviour
observed.
The penguins from the Northern Otago Peninsula foraged to the East (2 birds) and Northeast
(1 bird) of their breeding locations (mean foraging range 15.8km, mean trip duration:
18.8hrs). The ranges and trip durations are longer than what Moore (1999) observed, but these
differences might be an artefact of the small sample size of post-guard birds. It is interesting
to note, however, that one of the birds foraged within the outer ranges of Blueskin Bay to the
North of the Otago Harbour. This area is the designated location for the dumping of
significant amounts of dredge spoil during the proposed widening of the Otago harbour,
which would impact significantly on the benthic ecosystem (Willis et al 2008) and, thus, may
affect the foraging success of penguins from the Northern Peninsula.
Comparison of foraging behaviour on Stewart Island and Codfish Island and potential
impact of oyster fisheries on yellow-eyed penguins – Mattern et al (2006, 2007b, 2008,
unpubl. data)
In the face of an on-going decline of the yellow-eyed penguin population breeding along the
North-eastern coastline of Stewart Island – generally referred to as the Anglem Coast – a
comprehensive study of the penguins’ foraging behaviour was conducted during three
consecutive seasons 2004/05 to 2006/07. While work in the first season focussed solely on
Stewart Island, the two following years of the study had a comparative approach through the
inclusion of penguins from Codfish Island.

4350 POP2011-08 Ellenberg & Mattern – Final Report June 2012
��
At two sites on the Anglem Coast (Golden Beach & Rollers Beach), GPS loggers were
deployed on a total of 13 penguins between January 2005 and December 2006, covering the
post-guard stage (2004/05, 3 birds, 5 trips) and chick guard stage (2005/06, 4 birds, 9 trips;
and 2006/07, 6 birds, 12 trips). The relatively small numbers of logger deployments along the
Anglem Coast were primarily due to the limited numbers of nests that did not fail early on.
The data yield was considerably better on Codfish Island, where a total of 18 birds were fitted
with GPS dive loggers, nine birds each per season. In the 2005/06 season, six of the nine
penguins were still guarding chicks and undertook a total of 11 foraging trips. The three
remaining birds had entered the post guard stage and each performed one long overnight
foraging trip. In 2006/07 all nine birds were in chick-guard, performing a total of 14 foraging
trips. The foraging behaviour of yellow-eyed penguins from Stewart Island and Codfish
Island differed significantly in almost every way.
The Stewart Island birds generally did not travel more than 12km from their nesting site,
regardless of the breeding stage they were in. Similarly, trip duration did not differ
considerably between years at Stewart Island although penguins in post-guard stayed at sea
for longer (Table 4.1b&c). One bird from Golden Beach exhibited a very unusual foraging
behaviour as it repeatedly foraged within a 3km radius from its nest site in Murray Bay. The
bird could be observed from the beach patrolling up and down the bay some 50m from the
shore, in very shallow waters (<10m) during as well as after the logger deployment. What
kind of prey it pursued there is unclear. All other penguins foraged along more or less coast
parallel courses northwards. Similar to patterns observed in Oamaru (Mattern et al 2007),
individual birds tended to revisit certain areas on subsequent foraging trips. However, unlike
at Oamaru centres of activity of the individual birds were located in close proximity to each
other. The foraging area that the penguin utilised to search for prey was spatially very limited

4350 POP2011-08 Ellenberg & Mattern – Final Report June 2012
��
and did not change between breeding stages or years. The diving behaviour leaned strongly
towards predominantly benthic foraging (Table 4.1b&c).
On nearby Codfish Island, the penguins stayed at sea between 17-22 hours hours during
chick-guard and around 43 hours in post guard. Particularly noteworthy is the behaviour of
three birds guarding chicks in the 2006/07 season that undertook long foraging trips during
which they ranged more than 50km away from their nest site. In the 2005/06 season such
patterns were only observed in post-guard penguins. This indicates that during the 2006/07
season, the food situation was not as good as the season before.
In comparison to Stewart Island, the Codfish Island birds, ranged considerably further,
foraging trips of individual birds were distributed over wide areas Northeast to Northwest of
Codfish Island, including distant Te Waewae Bay. Accordingly sea areas utilised by penguins
from both islands differ significantly. While the Stewart Island birds remained in all years in
an area of approximately 97.3km², the home range of Codfish Island birds was larger by an
order of magnitude – 989.4km² (see Fig 4.2).
The diving behaviour also differed greatly between both sites. Linked to the longer foraging
trip times, penguins form Codfish Island performed far more dives per trip than their Stewart
Island counterparts. The dive time of penguins from Stewart Island was on average 10s longer
when compared to Codfish Island. At the same time, Stewart Island birds did only dive at
depths <50m whereas their Codfish Island conspecifics regularly dived to 60+m. All this
indicates that the Stewart Island penguins have to compensate their much smaller home range
by increasing their diving effort. The post-guard data underpin this hypothesis further.
During the post guard stage, Stewart Island penguins performed more dives per trip which is
to be expected considering the longer foraging trip times. However, since the in post-guard
penguins performed more benthic dives when compared to chick guard (see Tables 4.1b&c) it

4350 POP2011-08 Ellenberg & Mattern – Final Report June 2012
��
appears as if the penguins must increase their diving effort in order to meet the growing
demands of their chicks.
In summary, yellow-eyed penguins from both sites exhibit two different strategies – vertical
v. horizontal foraging. The Stewart Island birds increase their dive effort (more, longer dives);
Codfish Island penguins travel farther afield.
Considering the higher breeding success on Codfish Island (King 2008), the question arises
why Stewart Island penguins do not follow the example of their counterparts from the
neighbouring island. The most likely explanation is that for them Te Waewae Bay is too far to
reach, especially since the birds from the Anglem coast would have to travel against the
strong tidal current in Foveaux Strait while travelling East to West (and vice versa) around the
Northern part of Stewart Island; the Codfish Island penguins only have to cross the tidal flow
in northerly and southerly directions.
In theory birds from the Anglem Coast should be able to forage farther towards eastern
Foveaux Strait. However, this region is subject to substantial fishing activities, principally
oyster extraction. Dredging has a significant negative impact on the benthic environment. The
past decades saw a large scale removal of biogenic reefs of Foveaux Strait resulting in a
reduction of the benthic biodiversity and productivity (e,g, Cranfield et al. 1999, Jiang &
Carbines 2002, Cranfield et al. 2003). The foraging data suggests that sea areas utilised by the
oyster fisheries do not produce enough prey for yellow-eyed penguins. Only a small area off
the North-to-Northeastern coast of Stewart Island appears to offer somewhat suitable foraging
habitat. The greatly reduced foraging area available leads to increased intraspecific
competition for the limited prey resources. As a result prey available for chick provisioning is
very limited which subsequently facilitates chick starvation and mortality. This hypothesis
received substantial support from a diet study that was carried out at both sites in 2006/07
(Browne et al 2012, see below).

4350 POP2011-08 Ellenberg & Mattern – Final Report June 2012
��
4.3.2 Diet
Erosion of otoliths and squid beaks – van Heezik and Seddon (1989)
The first paper touching the subject of yellow-eyed penguin diet to be published in a scientific
journal was principally of a technical nature. It focussed on the rate of erosion of otoliths (i.e.
ear-bones of fish that can be used for species identification and size/mass estimation) and
squid beaks (used similarly to otoliths to determine species and size) in the stomachs of
yellow-eyed penguins and the analytical consequences thereof. In essence the study found
that otoliths are digested usually within 24 hours, whereas squid beaks are retained in the
stomach for much longer periods. This is an important fact to consider when dealing with
stomach samples as the analysis of hard-part remains potentially biases the results towards
squid. Additionally, the paper lists the main prey species of which otoliths and beaks were
used: red cod (Pseudyphycis bacchus), opal fish (Hemerocoetes monopterygius), sprat
(Sprattus antipodum) and arrow squid (Nototodarus sloani).
Seasonal, geographical and age-related diet variations – van Heezik (1990b)
The first comprehensive study of the yellow-eyed penguin’s diet was conducted by Yolanda
van Heezik. Between 1984 and 1986, she obtained stomach samples from a total of 512 adult
yellow-eyed penguins breeding at eight different locations ranging from Moeraki, Shag Point
and Bobbys Head in North Otago, to Boulder Beach on the Otago Peninsula and Nugget
Point, Hina Hina Cove, Penguin Bay and Falls Creek in the Catlins. Stomach samples were
obtained via the water-offloading method (Wilson 1994) during which water is pumped into a
penguin’s stomach to induce vomiting. Two flushes were sufficient to remove entire stomach
contents.

4350 POP2011-08 Ellenberg & Mattern – Final Report June 2012
�
Overall, 26 prey species were identified during the study, with fish comprising 87% of the
weight. Sprat was the most commonly taken prey species (frequency of occurrence: 67%)
although it contributed only 12% of the calculated meal weight (see Table 2). Less frequent
but contributing more mass were red cod (FO: 47%; weight: 36%) and opalfish (FO: 44%,
weight: 22%). Inshore species that are commonly taken by shags were absent in the penguin
diet which led to the conclusion that penguins forage further away from the coast.
Interestingly it was concluded that the majority of the prey species were pelagic rather than
bottom-dwelling (“demersal”) species. This stands in contrast to the findings of subsequent
foraging studies and diet studies. However, all of the species listed as pelagic also occur at or
close to the sea floor. Particularly the distribution of arrow squid is discussed (“arrow squid
are most abundant towards the surface […] where they have found to represent 47% of the
total commercial catch”). Yet the diel vertical migration in which squid migrates to the
surface at night (when commercial fishing occurs) but stay at greater depths and, thus, closer
to the seafloor during the day (when yellow-eyed penguins forage) was not considered (Roper
& Young 1975).
The study found geographic variations in prey composition. For example, penguins from
Bobbys Head caught a reasonably large amount of sprat (weight: 20%) while at Shag Point
only 10 km to the North, opalfish, red cod and silversides dominated the diet. Interestingly,
penguins form Bobbys Head brought less food ashore but had higher body weights when
compared to the birds from Shag Point. Van Heezik hypothesised that sprat had a higher
caloric value when compared the species found in the Shag Point penguin diet.
Overall, the study concluded that yellow-eyed penguins appeared to be selective rather than
opportunistic foragers that target certain species which makes them vulnerable to decreased
availability of its principal prey species. This vulnerability was further substantiated when the
effect of diet changes on growth rates, fledgling sizes and reproductive success were analysed.

4350 POP2011-08 Ellenberg & Mattern – Final Report June 2012
�!
Effects of food variability on growth and survival– van Heezik and Davis (1990)
Simultaneously to the diet study summarised above, the growth rates and fledging success of
yellow-eyed penguins was recorded by Yolanda van Heezik and Lloyd Davis. The study
focussed on two sites, Boulder Beach on the Otago Peninsula and Nugget Point in the Catlins.
In the breeding seasons 1984/85 and 1985/86 chicks were weighed and measured at weekly
intervals. An adverse change in diet occurred in the second season which resulted in reduced
weight gains, higher chick mortality and increased adult mortality during moult.
Compared to 1984/85, the 1985/86 season meal sizes were larger (1984/85 v. 1985/86: 249.2g
v. 711.8g) and there was a change in absolute quantities of certain species, some appeared less
frequent while others were more abundant. At Nugget Point sprat (mean % weight: 75g) and
red cod (137.7g) dominated the diet in 1984/85 (arrow squid: 30.7g), while it was primarily
arrow squid (420.6g) that was taken in the following season (sprat: 10.6g; red cod: 84.6g; van
Heezik 1990b, Table 1). Similarly, penguins from Boulder Beach fed primarily on opalfish
(401.8g), red cod (102.2g) and arrow squid (162.9g) in the first season. In the following
season, the amount of arrow squid brought shore almost tripled (424.6g), while the mass of
opal fish (228.2g) and red cod (32.8g) was halved. These differences in prey composition
reflected particularly in lower growth rates, lower fledging weights and higher mortality rates
at Nugget Point.
Van Heezik & Davis (1990) argued that the different growth rates observed in both seasons
are linked to the caloric value of the prey species taken. Sprat, which played an important part
in the diet of Nugget Point birds, has high oil content when compared to other prey such as
red cod and arrow squid. Since sprat was all but absent from the penguins’ diet in 1985/86 it
seems that even though arrow squid was taken in much larger quantities, it could not
compensate for the lack of prey with higher energy content. At Boulder Beach, opal fish
seemed to have played the role of “quality food” as it is firm-fleshed and likely to have a high

4350 POP2011-08 Ellenberg & Mattern – Final Report June 2012
�"
oil-content. While the amount of opalfish was reduced in the 1985/86, it still contributed
significantly to the penguins’ diet so that the impact of prey changes was less pronounced
when compared to the Catlins.
Regardless of site the fledgling survival was significantly lower during the second season.
None of the fledglings were resighted as juveniles and as such presumably died in their first
year at sea. Juveniles eat predominantly arrow squid probably because the species is easier to
catch when compared to other fish species. As such the prevalence of low quality food (i.e.
squid) in 1985/86 was believed to negatively affect the young penguins’ likelihood for
survival.
Prey composition on Codfish Island – van Heezik (1990a)
In the season 1984/85, Yolanda van Heezik sampled the diet of yellow-eyed penguins,
Fiordland penguins (Eudyptes pachyrhynchus) and little blue penguins (Eudyptula minor)
breeding sympatrically on Codfish Island. 22 yellow-eyed penguins, 21 Fiordland penguins
and 28 little penguins were stomach flushed and their prey composition analysed and
compared. The two single most important prey species for yellow-eyed penguins were blue
cod and opalfish both species that only occur at the sea floor. Other species present in the diet
were arrow squid, Ahuru and red cod, but neither of these species contributed significantly to
the calculated weight of the samples. Instead these species were the primary prey species for
Fiordland and little blue penguins. Overall there was only small overlap in diet composition
of yellow-eyed penguins and the other two species. 7 out of the 16 species eaten by yellow-
eyed penguins were not present in the diet of Fiordland or little blue penguins. The majority
of the species taken exclusively by yellow-eyed penguins were demersal species; whereas the
other two penguin species primarily took pelagic prey.
4350 POP2011-08 Ellenberg & Mattern – Final Report June 2012
��
Diet of yellow-eyed penguins from Otago Peninsula & Catlins – Moore & Wakelin
(1997)
In conjunction with the radio telemetry study that occurred between 1991 and 1993, stomach
samples were taken from a total of 86 individuals covering four breeding seasons. The study
focussed on the Boulder Beach complex on the Otago Peninsula and Long Point in the Catlins
(Fig 4.2). A total of 43 types of prey were identified, 37 of which were fish, four cephalopod
and two crustacean species. Opalfish, blue cod and arrow squid again turned out to be the
most important prey species (Table 4.2). When compared between both sites, opalfish was
equally important, while blue cod and arrow squid contributed relatively more to the
penguins’ diet at Boulder Beach when compared to Long Point. Here, the pelagic ahuru
(Auchenoceros punctatus) was the second most important prey species. However, this might
be a biased representation as the samples containing the majority of ahuru were all taken on a
single day at Long Point.
Just as observed in previous studies, prey composition differed between sites. However, more
interestingly the study found individual preferences for prey, and thus causing variability of
diet composition between individuals from a site. The paper provides the feeding preferences
of five birds as an example, where one bird preferably fed on blue cod, another took more
arrow squid, while two other birds had comparable prey species in their stomachs consisting
of opalfish, blue cod and red cod. The fifth bird was sampled five times and was responsible
for bringing 79% of the total number of krill Nyctiphanes australis ashore. These differences
underpin the findings of the tracking studies summarised above, where individuals tend to
revisit distinct locations to forage and do so not only between foraging trips but also between
years. Hence, the individual differences in prey composition probably reflect the individual
foraging patterns, e.g. individuals eating predominantly blue cod forage on rocky habitat
closer to the coast.

4350 POP2011-08 Ellenberg & Mattern – Final Report June 2012
��
The paper also challenges van Heezik’s (1990) conclusions about the relative quality of prey.
The argument that sprat provides a richer energy source than opalfish or red cod was
questioned as the size of sprat taken by the penguins has only intermediate oil and energy
levels. Likewise the assumption that blue cod and arrow squid are low quality prey was
refuted as blue cod has low oil content but nevertheless high energy values, while arrow squid
has oil content and energy levels that are comparable to most of the yellow-eyed penguin’s
fish prey. “It may be that digestibility of protein is more important than the oil content or
energy value.” Overall “the relationship between prey species and nutrition is likely to be
complex, and our assumptions are hindered by the paucity of data on chemical composition of
prey” (Moore & Wakelin 1997).
At any rate, similar to van Heezik (1990b) it was apparent that breeding success was
improved in years where opalfish, red cod and sprat were the preferred prey over arrow squid
and blue cod.
Diet quality differences between Stewart and Codfish Island – Browne et al. (2011)
The significantly different foraging patterns observed on Stewart and Codfish Islands raised
the question whether these differences would reflect in the diet composition of penguins from
both sites. In pursuit of an answer to this question, Tiffany Browne and colleagues conducted
a diet study on both islands in the season 2006/07. A total of 12 breeding penguins from
Anglem Coast, Northeast Stewart Island, were stomach flushed during the chick guard stage,
followed by stomach flushing of 15 penguins from Codfish Island (see Fig 4.2). The low
sample sizes resulted from permitting constraints (only one penguin per breeding pair was
allowed to be sampled) and the low numbers of breeding pairs along the Anglem Coast. The
stomach contents were not only quantitatively analysed but also energetic contents of the
meals were determined via bomb calorimetry.

4350 POP2011-08 Ellenberg & Mattern – Final Report June 2012
��
For stable isotope ratio analyses feather and blood samples were taken from adult penguins
and chicks. Stable isotope ratios reflect those of the penguins’ prey in a predictable manner.
The nitrogen isotope ratio of 14N/15N provides information about the trophic level of the
consumer, while the carbon 12C/13C ratio gives an indication about the food sources.
Dependent on the tissue type, stable isotope ratios reflect diet of a variety of durations. Stable
isotopes in feathers provide an indication of diet at the time of the feather synthesis, i.e. the
weeks prior to the moult, whereas isotope ratios in blood integrate diet over a period from a
few days up to four weeks.
It needs to be pointed out that in the year the stomach samples were taken, with the exception
of one chick none of the yellow-eyed penguin chicks from Stewart Island survived until
fledging. Because of that, feather samples taken in the previous season were used in the
analysis and as such reflect the diet composition in 2005/06.
Of the 12 birds sampled on Stewart Island, five birds returned with an empty stomach. Of the
remaining 7 samples, only three contained identifiable remains (i.e. entire fish or otoliths). On
Codfish Island only two of the 15 birds returned with empty stomachs, 10 birds brought
diagnostic remains ashore. The proportion of empty stomachs was considerably higher than in
previous studies. At the same time the body mass of the adult birds sampled during this study
was significantly higher than in previous studies, perhaps an indication that the adults
focussed on self-sustenance rather than offspring survival.
The principle prey species at both locations was blue cod, which occurred in all three of the
Stewart Island samples and in seven of the 10 samples from Codfish Island. Apart from one
bird that returned with Tarakihi (Nemadactylus macropterus) in its stomach, no other prey
was identified from Stewart Island stomach samples. The stable isotope analysis revealed that
in the previous year (when the feather samples for the analysis were taken) opalfish must also
4350 POP2011-08 Ellenberg & Mattern – Final Report June 2012
��
have been an important part of the Stewart Island penguins’ diet. Especially in fledglings
isotope signatures indicated a greater importance of opalfish over blue cod.
On Codfish Island, prey taken by the penguins was more diverse. In addition to blue cod,,
opalfish, jock stewart (Helicolenus percoides), sprat and arrow squid were found in the
samples. However, compared to previous studies (particularly van Heezik 1990b) prey
diversity was low. The blue cod taken by birds from both sites were rather large ranging from
13-28cm, whereas the opalfish found in penguins from Codfish Island was smaller (around
14cm). The prey size could potentially be a problem for the provisioning of chicks as it is
probably difficult for the offspring to swallow large prey items like blue cod. And indeed,
undigested blue cod remains were found frequently around nests along the Anglem Coast
(Thomas Mattern personal observation).
Lastly, the analysis of the energetic values showed that the meals brought ashore by Codfish
Island birds was significantly higher in energy (mean: 18.4kJ g-1) than on Stewart Island
(mean 14.2kJ g-1). Interestingly, the energetic content determined for blue cod (19.8kJ g-1)
and opalfish (19.59kJ g-1) were similar, so that the preference for one over the other species is
most likely determined by availability and not as much a result of quality related selectiveness
by the penguins as suggested by van Heezik (1990b). At the same time, stable isotopes
provide an indication that the adult penguins selectively provision their offspring by
preferably feeding (smaller, easier to swallow) opalfish to their young while using (larger)
blue cod for self-sustenance. It appears that the overall energetic content of the penguins’ diet
depended more on the diversity of available prey rather than the nutritional value of single
prey species. As such, the low prey diversity observed and the high proportion of birds
returning with empty stomachs is a clear indication that the foraging situation is poor for
penguins breeding along the Anglem Coast. A logical conclusion is that high starvation rates

4350 POP2011-08 Ellenberg & Mattern – Final Report June 2012
��
of Stewart Island penguin chicks are largely a result of reduced prey availability in the
spatially very limited foraging ranges of the Stewart Island penguins (see 4.3.1).
4.4 Discussion
4.4.1 Foraging behaviour and diet
From the information available it can be concluded that yellow-eyed penguins on the
mainland are almost exclusively benthic foragers. Consistent individual foraging patterns that
are characterised by re-visitation of foraging sites (Moore 1999, Mattern et al. 2007) suggest
that a specialisation on benthic prey species provides yellow-eyed penguin with a spatially
predictable, stable source of food. The individuality of foraging patterns is further emphasised
by the consistent diet composition of single yellow-eyed penguins (Moore & Wakelin 1997).
Although suggested by van Heezik (1990b) subsequent studies did not support the hypothesis
that yellow-eyed penguins selectively target energy rich prey species.
Blue cod, opalfish and arrow squid appear to be the universal staple food of yellow-eyed
penguins across their entire mainland range, although red cod used to be more important in
the early 1980s. Whether or not yellow-eyed penguins are obligate benthic feeders is unclear,
although the principally benthic diving behaviour would suggest as such. Even the penguins
from Codfish Island that showed a high proportion of non-benthic dives performed most of
these during the linear travelling trip phases. Yet, it seems unlikely that yellow-eyed penguins
which encounter a patch of pelagic prey would not pursue this opportunity. Conversely, the
presence of pelagic species in the diet of yellow-eyed penguins does not necessarily mean that
the prey was caught in the upper ranges of the water column.
Penguins from Oamaru, the Otago Peninsula and Stewart Island all show a great affinity for
benthic foraging along consistent – in some cases predictable – routes (Mattern et al. 2007).

4350 POP2011-08 Ellenberg & Mattern – Final Report June 2012
��
The results highlight reasons for this foraging strategy other than searching for benthic prey,
i.e. navigation along bottom features. The accuracy with which penguins from the Otago
Peninsula swam along straight line courses (Mattern 2008) further enforces this hypothesis.
The individual centres of activity observed during both the radio tracking (Moore 1999) and
GPS logger studies (Mattern et al. 2007) even suggest that the penguins may be able to
memorise seafloor features and locations over time and develop individual “seascape maps”
of their foraging habitat similar to homing pigeons (e.g. Meade et al. 2005). The individual
capabilities to do so would certainly represent a selection factor of great importance and as
such warrants further investigation.
Overall, the yellow-eyed penguins’ behavioural patterns point towards a species which has
developed a specialised foraging strategy that provides them a competitive advantage over
other seabird species (e.g. O’Driscoll et al 1998) but comes at the cost of reduced ability to
react to changes in their marine environment. The foraging patterns observed on Stewart
Island clearly demonstrate this restrain.
4.4.2 Variables affecting foraging ecology
At-sea movements, diving behaviour and diet composition all suggest that yellow-eyed
penguins are highly specialised foragers. Such behaviour is unique amongst penguins, which
usually inhabit highly variable marine environments. Yellow-eyed penguins breeding around
the New Zealand mainland live in a stable environment where the availability of prey is not
dictated by seasonality like in the Polar Regions or the dynamics of the pelagic environment
(e.g. Davis & Renner 2003).
The benthic prey species of yellow-eyed penguins such as opalfish and blue cod are available
throughout the year, which allows yellow-eyed penguins to be sedentary rather than migratory

4350 POP2011-08 Ellenberg & Mattern – Final Report June 2012
��
like Fiordland penguins (Mattern, in press). But it also means that the birds rely on
functioning benthic ecosystems within their range. In situations where the benthic habitat has
been degraded penguins struggle to survive on the little food they can find.
The Foveaux Strait historically featured expansive biogenic reefs that were greatly reduced in
size as a result of increasing efforts of the local oyster fishery (Cranfield et al. 1999, Cranfield
et al 2003). While traditionally oyster beds of the eastern and central region of the Foveaux
Strait were fished, the effort moved westwards in the 1970s and 1980s (Cranfield et al. 1999)
– towards Stewart Island and into areas of potential yellow-eyed penguin foraging habitat.
Today the birds only forage over the fringes of the formerly expansive Foveaux reef systems.
The areas dredged for oysters have markedly lower prey diversity than undredged regions;
fish species like blue cod show significantly reduced growth rates in areas where reefs have
been removed or disrupted as a result of oyster dredging (Jiang & Carbines 2002). Te
Waewae Bay is likely to be out of reach for the Stewart Island birds so that the penguins in
theory could only try to switch to pelagic prey to compensate for the reduced availability of
benthic species. However, none of the studies summarised here suggests that yellow-eyed
penguins are able to adjust to a pelagic foraging strategy.
It is not known how exactly penguins that forage in a pelagic environment are able detect
their prey. Olfactory capabilities have been suggested (Culik et al 2000), but it seems that
pelagic foragers generally use an “inspired guess” approach in which they forage towards
known sea regions with higher productivity (e.g. frontal systems) and travel until
encountering prey patches (e.g. Wilson 1995, Mattern 2006b) . Yellow-eyed penguins on the
other hand seem to use benthic features to travel precisely to locations that are then revisited
over days and years to obtain prey (Mattern et al. 2007). This is a perfect strategy in an
environment like the continental shelf off Oamaru, where patchily distributed horse mussel
fields offer areas of high prey abundance and underwater landmarks help the penguins to

4350 POP2011-08 Ellenberg & Mattern – Final Report June 2012
�
navigate to such fields quickly. However, what if these horse mussel fields disappear, for
example as a result of anthropogenic influences (e.g. fisheries activities, sedimentation)? How
will the penguins be able to find new patches – if there are any around? The example of
yellow-eyed penguins from Stewart Island suggests that the species will not be able to adjust
to changes that occur over short time periods but affect the benthic environment for many
years. Cranfield (2004) found that it takes at least 12 years or longer for benthic communities
in Foveaux Strait to regenerate to stage III (of V regeneration stages) after disturbance by
oyster fisheries. During such a period resident yellow-eyed penguins experience significantly
reduced reproductive success and recruitment probabilities – a situation that applies to the
Anglem coast population (King 2008).
With regard to the Southern Oscillation, the results from Peacock et al. (2000) imply that
foraging conditions for yellow-eyed penguin improve following El Niño events. Such events
are characterised by predominantly south-westerly winds, increased rainfall and reduced
temperatures in the species mainland breeding range. Accordingly in the years following La
Niña events, north-easterly winds usually result in reduced rainfall and warmer than normal
temperatures, detrimental foraging conditions result in lower than normal breeding success
(see also Perrimen et al. 2000). However, in the context of long-term population dynamics
SOI events seem to play a negligible role. The apparent reversal of the relationship of climatic
conditions and breeding success – i.e. higher success after warm conditions in the first half of
the 20th century (Richdale 1957), versus higher success after warm conditions in recent years
(Peacock 1995, Peacock et al. 2000) – suggest that on-going long-term changes might give
yellow-eyed penguins the time to adjust. In this light, the influence of acceleration of
alterations as a result of global climate change must be a focus of future research endeavours.

4350 POP2011-08 Ellenberg & Mattern – Final Report June 2012
�!
4.4.3 Research implications
Clearly the survival of yellow-eyed penguin – or any other type of seabird for that matter –
depends to a very large degree on their marine environment. In the face of climate change and
increasing anthropogenic factors ranging from fisheries impacts to pollution, changes in the
yellow-eyed penguins’ marine habitat are likely to occur at rates that will make it difficult for
the species to adjust. It is apparent that the future of the species is determined at sea.
Considering this, the marine ecology of yellow-eyed penguins requires stronger consideration
during the prioritisation of conservation measures. Nest monitoring, population censuses and
rehabilitation are important observational tools that tell us something about the current status
of the population, but provide little information as to how the situation for the species can be
improved. Terrestrial management measures such as habitat restoration and predator trapping
in important breeding areas are only effective as long as the penguins survive their foraging
trips and find enough food in the vicinity. Monitoring the yellow-eyed penguin’s foraging
ecology – i.e. diet, foraging ranges and at-sea behaviour – will provide the data needed to
analyse important factors driving population dynamics and to determine appropriate
conservation actions.
In comparison to seriously scientifically neglected New Zealand penguin species like the
Fiordland penguin or erect-crested penguin, we have at least baseline information on the
foraging behaviour of yellow-eyed species. However, compared to the wealth of data
available for penguin species breeding within the Ross Dependency, Antarctica our
understanding of the yellow-eyed penguins’ marine ecology is minute. This is primarily due
to the absence of continuous research activities. With regard to yellow-eyed penguins, most of
the research projects of the past three decades had a short term focus and were principally part
of Masters or PhD research programmes. Coherent, long-term research activities can only be
achieved by a dedicated research group that provides scientific guidelines on which future

4350 POP2011-08 Ellenberg & Mattern – Final Report June 2012
"
research projects are based. With regard to studies of penguin foraging ecology, a logistic and
scientific framework that provides materials, analysis protocols and tools would be
invaluable.

4350 POP2011-08 Ellenberg & Mattern – Final Report June 2012
�
5. Research priorities to assess the impact of commercial
fisheries on yellow-eyed penguins
Authors: Ursula Ellenberg & Thomas Mattern
Summary
The endemic, endangered yellow-eyed penguin is at risk from bycatch as well as affected by
benthic foraging habitat degradation due to commercial fisheries activities.
Particularly, bycatch in gillnets (set nets) poses a significant threat to yellow-eyed penguin
populations. Additionally, bycatch in the commercial inshore trawl fisheries (i.e. flatfish
trawl, small inshore trawl, large fresher trawl) and bottom longline fisheries pose risk to
yellow-eyed penguins.
Since yellow-eyed penguins are primarily bottom foragers that take benthic prey they can be
affected by benthic habitat degradation in their foraging areas. There is strong evidence that
commercial oyster dredging in the Foveaux Strait significantly reduces the abundance,
diversity and quality of penguin prey by modification of epifaunal reefs, ultimately leading to
a population decline of yellow-eyed penguins along the Anglem Coast, Stewart Island. The
effects of benthic habitat degradation e.g. via bottom trawls in other penguin foraging areas
still need to be quantified. Furthermore, potential indirect fisheries competition via the
reduction of spawning stocks (e.g. red cod fisheries) warrants further investigation.
To improve the quality of risk assessment, observer coverage needs to be substantially
increased on commercial set netters and inshore trawlers/bottom-longline fisheries operating
within 50 km of important yellow-eyed penguin breeding areas. Electronic monitoring can

4350 POP2011-08 Ellenberg & Mattern – Final Report June 2012
�
supplement independent observers allowing better overall coverage while keeping the related
costs manageable. Such data are essential not only to derive reliable estimates of total penguin
bycatch but also to understand operational details affecting the likelihood of capture so that
mitigation measures can be developed. Since bycatch rates are extremely uncertain, high
independent observer coverage is required to achieve reasonable precision in bycatch
estimates.
To assess the impact of benthic habitat degradation on yellow-eyed penguins better, a
comprehensive analysis of foraging ecology and at sea distribution needs to be carried out
covering at least 5 breeding seasons to account for variable oceanographic and climatic
conditions. This needs to be accompanied by the monitoring of population parameters to
quantify the link between foraging parameters such as effort, success and the breeding
outcome. Independent seafloor surveys will provide the required information on the extent of
benthic habitat degradation from oyster dredging and bottom trawls.
The yellow-eyed penguin population on the New Zealand mainland is small (600-800
breeding pairs) and fragile. Previous population strongholds such as on the Otago Peninsula
are declining. Since the mainland population is genetically distinct from sub-Antarctic
populations (inferred immigration rate 0.003 per generation) the current loss of yellow-eyed
penguins along the Southeast coast of the New Zealand South Island and in the Foveaux Strait
will not be compensated.
We need to find effective ways to reduce the pressure of commercial fisheries on yellow-eyed
penguins in the near future. Effective mitigation of the impact of commercial fisheries can
arise only from detailed management guidelines derived from rigorous research.

4350 POP2011-08 Ellenberg & Mattern – Final Report June 2012
�
Background
The endemic yellow-eyed penguin is internationally classified as endangered (B2b(iii)c(iv),
IUCN 2011) and as threatened (nationally vulnerable) following the New Zealand internal
threat classification system (Miskelly et al. 2008). This species may live to more than 25
years (own observations, John Darby unpublished data) and adult mortality is generally low
(0.09-0.17; Richdale 1957; Efford et al. 1996; Edge et al. 1999; Ratz et al. 2004). Population
Viability Analysis shows that even a small increase in adult mortality rate leads to a dramatic
increase in extinction probability of the yellow-eyed penguin (McKinlay 1997).
Methods
After thorough review of the little available published data and unpublished reports we have
assembled and circulated a discussion paper which has been considerably improved by
feedback from the Yellow-eyed Penguin Research Advisory Group (which is a subgroup of
the Yellow-eyed penguin Recovery Group) during a meeting on 24 February 2012.
We have prepared a PowerPoint presentation and led a session on the “Impact of commercial
fisheries on yellow-eyed penguins - what we know and what we need to know” with the
Seabird Research Group (SRG) at the University of Otago on 17 May 2012 and received
substantial responses.
The updated version was circulated to colleagues from the International Penguin Expert
Group of the World Conservation Union (IUCN) Species Survival Commission (SSC).
Particularly, Pablo Garcia Borboroglu, CONICET, University of Washington & Global
Penguin Society, and Peter Dann, Research Manager at the Phillip Island Nature Park &
University of Melbourne, provided valuable feedback and have greatly improved this section.

4350 POP2011-08 Ellenberg & Mattern – Final Report June 2012
�
Overview of research priorities in order of importance:
5.1 Quantify the direct effects of commercial fisheries
5.1.1 Yellow-eyed penguin bycatch in commercial set net fisheries
5.1.2 Yellow-eyed penguin bycatch in commercial trawl fisheries
5.2 Document the indirect effects of commercial fisheries
5.2.1 Fisheries induced benthic habitat degradation
5.2.2 Fisheries competition via reduction of spawning stocks
5.1 Quantify the direct effects of commercial fisheries
5.1.1 Yellow-eyed penguin bycatch in commercial set net fisheries
Rationale
Bycatch in gillnets, especially set nets, pose a significant threat to yellow-eyed penguin
populations. The “Level 1 Risk Assessment for Incidental Seabird Mortality” categorises the
risk of yellow-eyed penguin entanglement in set nets as “extreme” (Rowe 2010). Between
1979 and 1997 a total of 72 confirmed deaths of yellow-eyed penguins in gillnet
entanglements were recorded, most at or near Otago Peninsula (Darby & Dawson 2000). Of
42 carcasses available for autopsy 28 were adults. Gillnet effort peaks in summer between
November and March which coincides with the yellow-eyed penguin breeding season. Loss
of one parent usually results in reproductive failure (Darby & Dawson 2000) and the
remaining bird will generally skip at least one breeding season following the loss of its
partner (Setiawan et al. 2005).
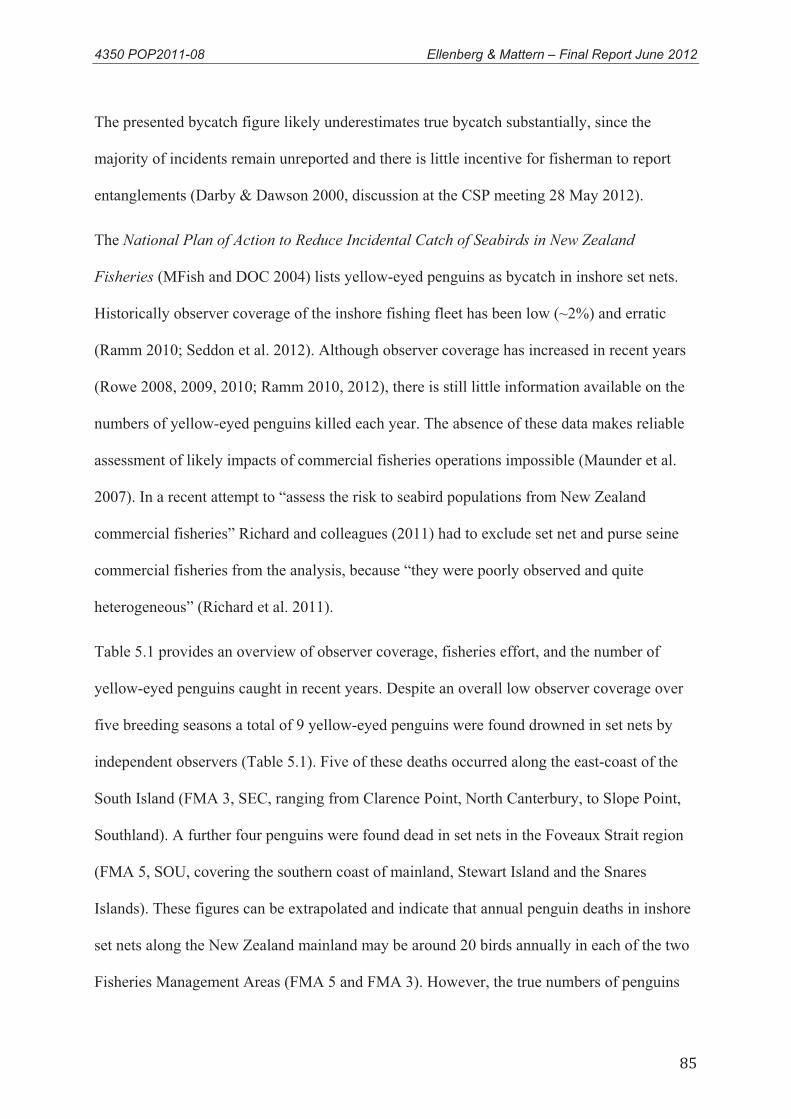
4350 POP2011-08 Ellenberg & Mattern – Final Report June 2012
�
The presented bycatch figure likely underestimates true bycatch substantially, since the
majority of incidents remain unreported and there is little incentive for fisherman to report
entanglements (Darby & Dawson 2000, discussion at the CSP meeting 28 May 2012).
The National Plan of Action to Reduce Incidental Catch of Seabirds in New Zealand
Fisheries (MFish and DOC 2004) lists yellow-eyed penguins as bycatch in inshore set nets.
Historically observer coverage of the inshore fishing fleet has been low (~2%) and erratic
(Ramm 2010; Seddon et al. 2012). Although observer coverage has increased in recent years
(Rowe 2008, 2009, 2010; Ramm 2010, 2012), there is still little information available on the
numbers of yellow-eyed penguins killed each year. The absence of these data makes reliable
assessment of likely impacts of commercial fisheries operations impossible (Maunder et al.
2007). In a recent attempt to “assess the risk to seabird populations from New Zealand
commercial fisheries” Richard and colleagues (2011) had to exclude set net and purse seine
commercial fisheries from the analysis, because “they were poorly observed and quite
heterogeneous” (Richard et al. 2011).
Table 5.1 provides an overview of observer coverage, fisheries effort, and the number of
yellow-eyed penguins caught in recent years. Despite an overall low observer coverage over
five breeding seasons a total of 9 yellow-eyed penguins were found drowned in set nets by
independent observers (Table 5.1). Five of these deaths occurred along the east-coast of the
South Island (FMA 3, SEC, ranging from Clarence Point, North Canterbury, to Slope Point,
Southland). A further four penguins were found dead in set nets in the Foveaux Strait region
(FMA 5, SOU, covering the southern coast of mainland, Stewart Island and the Snares
Islands). These figures can be extrapolated and indicate that annual penguin deaths in inshore
set nets along the New Zealand mainland may be around 20 birds annually in each of the two
Fisheries Management Areas (FMA 5 and FMA 3). However, the true numbers of penguins

4350 POP2011-08 Ellenberg & Mattern – Final Report June 2012
�
caught in set nets each year remain a matter of conjecture. Ramm (2012) points out that
observer coverage for set netting operations is “highly spatially focussed” so that the
detection rate of penguin bycatch depends largely on whether observed vessels operated in
marine areas frequented by yellow-eyed penguins (e.g. within a 50km radius of penguin
breeding sites during the breeding season and included yellow-eyed penguin foraging
hotspots, compare section 4 of the report).
Of the seabirds captured in set nets, over half were released alive as they were caught at the
surface after being attracted by offal discharge (Ramm 2010). However, all of the yellow-
eyed penguins recovered from set nets were dead (Rowe 2009, 2010, Ramm 2010, 2012),
most likely because they got caught in the net and drowned while diving. In this light,
suggested mitigation measures such as reducing attractants for birds (e.g. offal discharge;
Ramm 2010) during hauling will not affect the numbers of penguin casualties.
The few data we have on the impact of set net fisheries suggest that penguins are taken over a
wide range of habitats from shallow coastal waters to depths exceeding 140m and 20km
offshore (Darby & Dawson 2000). The recently introduced set net ban within 4 nautical miles
off shore along most of the East coast of the South Island (NZ Ministry of Fisheries 2008)
may reduce bycatch of penguins travelling to their foraging grounds (Mattern et al 2007). But
considering that the main foraging grounds of penguins along the New Zealand South Island
are about 15-20 km offshore the ban will have no effect on the impact of set nets placed
further offshore by commercial operators.
Anecdotal evidence suggests that yellow-eyed penguin bycatch is considerably higher than
what is being reported. We decided to not include unreferenced anecdotal data into this report.
Hence, we urgently need a representative independent observer programme for reliable
bycatch estimates.

4350 POP2011-08 Ellenberg & Mattern – Final Report June 2012
�
Research approach
A substantial increase in independent observer coverage is required on commercial set net
fisheries for at least 5 years to account for variable oceanographic conditions and fishing
effort in foraging areas of yellow-eyed penguins. Independent observer effort needs to focus
on high risk areas where set netters operate within 50km of important yellow-eyed penguin
breeding areas and within 25km off the Southeast coast of the New Zealand South Island (i.e.
over the continental shelf)2.
Numbers of yellow-eyed penguin breeding pairs on Northeast Stewart and Codfish Islands
and on the Otago Peninsula are declining. Hence particular effort needs to be placed on
fishing vessels that operate around these areas. For highest data return rates independent
observer effort should initially focus on setnets deployed during January – March since this is
the time when we expect the a concentration of birds in the water in proximity of their
breeding sites. Growing chicks have the highest energy demands January - February forcing
parents to spend a lot of time at sea in order to provide sufficient food. February – March
onwards recently fledged chicks will add to the numbers of yellow-eyed penguins at sea.
2 The recommended distances derive from foraging studies at selected sites that found chick-rearing Yellow-
eyed penguins may travel up to 50km away from their breeding sites to obtain food (e.g. penguins from Codfish
Island, see section 4. Marine Ecology). The foraging radius is limited by the extent of the continental shelf since
Yellow-eyed penguins are benthic foragers that generally do not forage at water depths >150m. The continental
shelf edge off the Southeast coast is situated ca. 25km offshore. Currently, we have no information about the
foraging ranges of Yellow-eyed penguins outside the breeding season. However, it is likely that the birds
continue to forage in reasonably shallow waters (<150m) and therefore penguins can be assumed to stay over the
continental shelf area.

4350 POP2011-08 Ellenberg & Mattern – Final Report June 2012
Records need to distinguish between juvenile and adult yellow-eyed penguins. Ideally
drowned individuals are sexed, and checked for band numbers or transponder ID. While
yearly reports are imperative for immediate feedback we strongly suggest a comprehensive
review of all data acquired after 5 years. This will provide a robust estimate of total numbers
caught in conjunction with operational details affecting the likelihood of capture.
At-sea distribution and foraging effort of yellow-eyed penguins need to be obtained using
GPS dive loggers in order to document foraging hotspots and thus identify areas where
penguins are at high risk from bycatch. There is particularly little information of yellow-eyed
penguin movement and at-sea distribution during the non-breeding season, when penguins do
not need to return to their breeding areas on a daily basis, hence, they can potentially cover
considerably longer distances to reach productive foraging areas. A comprehensive study
should encompass not only adults but also juveniles in both breeding and non-breeding
seasons. Since at-sea distribution and foraging ecology varies with oceanographic and
climatic conditions a comprehensive study needs to encompass a minimum of 5 consecutive
seasons.
For a better risk assessment detailed information on fishing gear, effort, timing, location, total
time and depth of gear deployment is essential. Ideally, GPS tracks of every vessel operating
in the SEC and SOU areas will be provided in addition to operational details so temporal and
spatial overlap with foraging penguins can be extrapolated.
During the CSP meeting on 28 May 2012 it has been suggested by the Seafood Industry
Council (SeaFIC) to consider “gathering information directly from fishermen” and the
example of the rock lobster fisheries was given which is being managed on self reporting. In
the subsequent discussion the consensus was that the incentive for reporting fish catch is
different to that for reporting bycatch. Since the main measure currently available for bycatch

4350 POP2011-08 Ellenberg & Mattern – Final Report June 2012
!
mitigation in set nets is fishing closure a negative incentive to reporting should be expected.
Hence, a questionnaire will unlikely yield reliable information on bycatch and thus can not
replace the urgently needed independent observer coverage on set netters operating in yellow-
eyed penguin foraging areas.
We believe it is very important to engage with the fishing communities as early as possible in
the process to make the development and implementation of mitigation measures more
effective. We need to articulate economic incentives either in the form of marketing
opportunities or by avoiding costly damage to gear or catch as well as pointing out the
inconvenience of bycatch (e.g. taking away time form landing catches, legal obligations etc.).
For these and other reasons most fishermen will be genuinely interested in bycatch reduction.
A voluntary (and anonymous?) reporting scheme asking fishermen to report yellow-eyed
penguin (and other rare seabirds/ marine mammals?) sightings at sea using a questionnaire
that includes a gridded map for easier reference will be a valuable resource. Additionally this
would offer the opportunity to engage with the fishing community in a non-threatening way.
We need to create opportunities for information exchange between fishermen, NGOs and
governmental agencies. A monetary award for smart ideas reducing setnet bycatch would
make such an involvement for fishermen more attractive. Fishermen know their gear and will
be aware when and where bycatch occurs. Hence, they are the best pool of knowledge and the
most productive inventers when it comes to develop mitigation techniques for the New
Zealand situation.
Since inshore vessels are small and often struggle to accommodate an independent observer
we strongly encourage to explore the suitability and potential of electronic monitoring
systems (EM; e.g. McElderry 2008; McElderry et al. 2011) in set net fisheries (compare also
5.1.2). A trial of EM in conjunction with an independent observer on the same vessels will

4350 POP2011-08 Ellenberg & Mattern – Final Report June 2012
!"
enable validating observations and advance necessary adjustments for a permanent
installation of EM on set netters. Only a robust set of data and co-operative effort will allow
development of effective mitigation measures or temporal/spatial management in order to
reduce yellow-eyed penguin bycatch in the commercial set net fisheries.
5.1.2 Yellow-eyed penguin bycatch in commercial trawl fisheries
Rationale
The extent to which inshore trawl fisheries interact with protected species is poorly known.
“In terms of number of tows, the effort in inshore trawl exceeds that in all of the offshore
fisheries combined. Though the trawl nets used are considerably smaller it still demonstrates
that inshore trawl is a significant fishery in New Zealand. Inshore trawl is also one of the few
remaining fisheries in New Zealand with no regulated mitigation measures. Data are not
currently available to allow the quantification of interactions with protected species, but the
substantial fishing effort and lack of mitigation creates potential for significant levels” (Ramm
2010).
“Monitoring of the inshore trawl fishery using government observers began only relatively
recently (2006/07), with a focus on monitoring seabird and dolphin interactions. Due to the
high levels of fishing effort and difficulty of placing observers on these small vessels, historic
coverage levels have generally been low and coverage has been limited to specific areas and
times of interest” (Ramm 2010). Even the increased observer coverage from 2006-2009
amounts to a total of only 0.92% of flatfish trawls, 1.74% in small inshore trawls, 5.59% in
large fresher trawls and 2.89% in small bottom longline fisheries (Richard et al. 2011). These
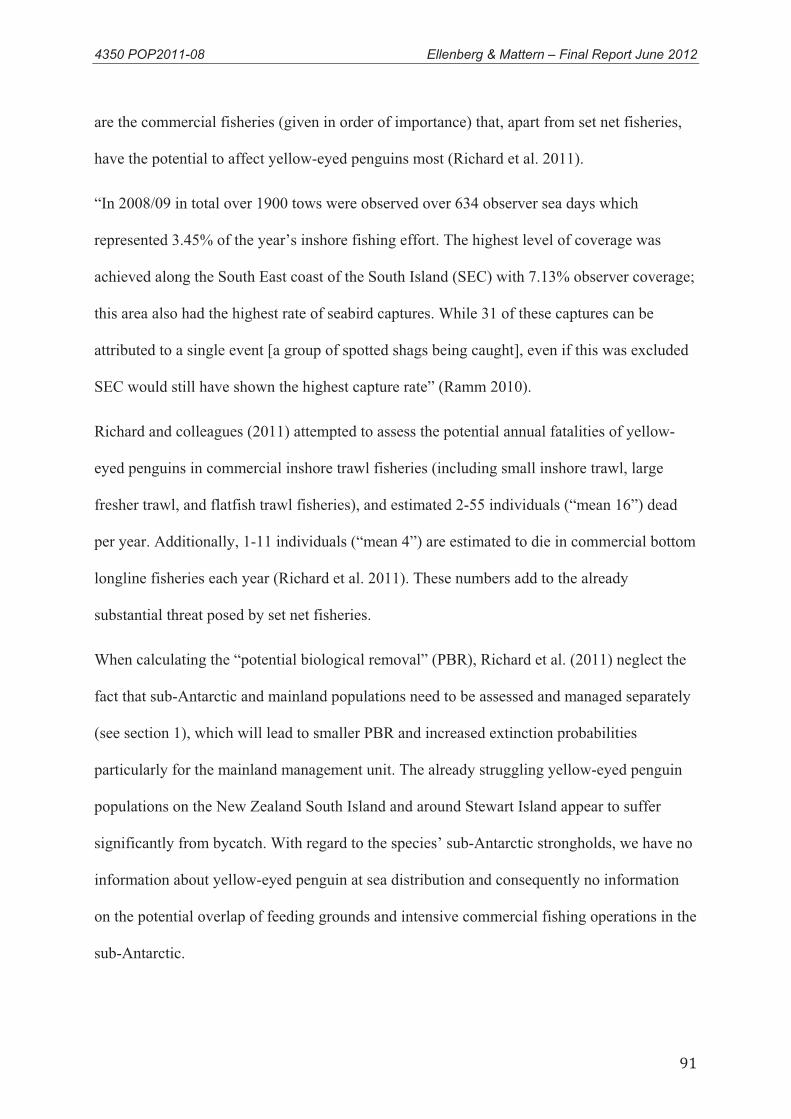
4350 POP2011-08 Ellenberg & Mattern – Final Report June 2012
!�
are the commercial fisheries (given in order of importance) that, apart from set net fisheries,
have the potential to affect yellow-eyed penguins most (Richard et al. 2011).
“In 2008/09 in total over 1900 tows were observed over 634 observer sea days which
represented 3.45% of the year’s inshore fishing effort. The highest level of coverage was
achieved along the South East coast of the South Island (SEC) with 7.13% observer coverage;
this area also had the highest rate of seabird captures. While 31 of these captures can be
attributed to a single event [a group of spotted shags being caught], even if this was excluded
SEC would still have shown the highest capture rate” (Ramm 2010).
Richard and colleagues (2011) attempted to assess the potential annual fatalities of yellow-
eyed penguins in commercial inshore trawl fisheries (including small inshore trawl, large
fresher trawl, and flatfish trawl fisheries), and estimated 2-55 individuals (“mean 16”) dead
per year. Additionally, 1-11 individuals (“mean 4”) are estimated to die in commercial bottom
longline fisheries each year (Richard et al. 2011). These numbers add to the already
substantial threat posed by set net fisheries.
When calculating the “potential biological removal” (PBR), Richard et al. (2011) neglect the
fact that sub-Antarctic and mainland populations need to be assessed and managed separately
(see section 1), which will lead to smaller PBR and increased extinction probabilities
particularly for the mainland management unit. The already struggling yellow-eyed penguin
populations on the New Zealand South Island and around Stewart Island appear to suffer
significantly from bycatch. With regard to the species’ sub-Antarctic strongholds, we have no
information about yellow-eyed penguin at sea distribution and consequently no information
on the potential overlap of feeding grounds and intensive commercial fishing operations in the
sub-Antarctic.

4350 POP2011-08 Ellenberg & Mattern – Final Report June 2012
!�
Similarly to Maunders and colleagues (2007) Richard et al. (2011) had to conclude that low
confidence levels due to deficient data made it impossible to draw reliable conclusions about
the actual impact of commercial trawl fisheries operations on yellow-eyed penguins.
Research approach
A substantial increase in independent observer coverage is required on commercial trawl
fisheries to quantify numbers caught as well as operational details affecting the likelihood of
capture. Such effort needs to focus on areas where trawlers operate within 50km of important
mainland breeding areas and within 25km off the south east coast of the New Zealand South
Island (compare section 5.1.1).
For a better risk assessment detailed information on fishing gear, effort, timing, location, total
time and depth of gear deployment is essential. Ideally, GPS tracks of every vessel operating
in the SEC and SOU areas are being provided in addition to operational details so temporal
and spatial overlap with foraging penguins can be extrapolated.
Detailed knowledge of foraging hotspots and at-sea distribution of yellow-eyed penguins both
during the breeding and non-breeding season will greatly improve bycatch risk assessment
(compare section 5.1.1).
A recent pilot study on inshore trawl vessels operating off the New Zealand North Island
showed electronic monitoring (EM) can supplement independent observers allowing better
overall coverage while keeping related costs manageable (McElderry 2008; McElderry et al.
2011). We strongly encourage exploring this promising monitoring method further and
engage with fisheries to assure their cooperation and support. The quality and effectiveness of
any monitoring effort will depend on good working relationships with the fishing industry. A

4350 POP2011-08 Ellenberg & Mattern – Final Report June 2012
!�
robust set of data will allow assessment of the numbers of yellow-eyed penguins (and other
protected species) being caught in commercial trawl fisheries. Such data are essential for the
development of effective mitigation methods.
5.2 Document the indirect effects of commercial fisheries
5.2.1 Fisheries induced benthic habitat degradation
Rationale
Yellow-eyed penguins have declined considerably along the Anglem Coast, Northeast
Stewart Island (King 2008, 2009). High chick mortality observed in 2003-2008 suggests that
recruitment is insufficient to sustain the population (Mattern 2008; King 2009). Chick deaths
were mainly attributed to starvation and disease (McInnes et al. 2008; King 2009). A study of
foraging ecology and penguin diet during chick-rearing found strong evidence for a localised
sea-based problem with low prey diversity, availability and quality affecting the colonies
along the Anglem Coast (Mattern et al. 2007b; Mattern 2008; Browne et al. 2011).
As a primarily benthic forager, the yellow-eyed penguin depends on an intact benthic
ecosystem (Mattern et al. 2007a; Mattern 2008). The Foveaux Strait historically featured
expansive biogenic reefs where oyster banks provided the substrate for extensive benthic
communities featuring sponges, corals and bryozoans which in turn provided habitat for a
variety of invertebrates and fish species.
During the extraction of oysters, these epifaunal assemblages are removed as bycatch (e.g.
Cranfield et al. 1999, Cranfield 2003). As oyster fishing efforts increased from the 1960s
onwards the biogenic reefs were greatly reduced in size (Cranfield et al. 1999, Cranfield et al

4350 POP2011-08 Ellenberg & Mattern – Final Report June 2012
!�
2003). Over the past four decades the number of vessels grew and fishers developed more
efficient dredging methods, resulting substantially increased disturbance and removal of
biogenic reefs. Traditionally oyster beds of the eastern and central region of the Foveaux
Strait were targeted. However, after these areas were fished to commercial extinction, the
effort moved westwards closer to Stewart Island and yellow-eyed penguin breeding areas
(Cranfield et al. 1999). By 1990 there were few unfished epifaunal reefs left which were
confined to the southern and north-western parts of Foveaux Strait (see Figure 6d in Cranfield
1999). Yet fisheries continued to target the oyster beds adjacent to Yellow-eyed penguin
breeding areas (Figure 2; Cranfield et al. 2001; compare also section 4).
The removal of biogenic reefs results in less diverse fish populations and smaller fish sizes
(Cranfield et al. 2001; Jiang & Carbines 2002: Carbines et al. 2004). Fish species like blue
cod show significantly reduced growth rates in areas where reefs have been removed or
disrupted as a result of oyster dredging (Jiang & Carbines 2002).
Under favourable conditions habitat regeneration to Stage III (of V stages, with V being the
most diverse) may be achieved within 12 years post fishing disturbance (Cranfield et al.
2004). However, the ability and time to regenerate appears to depend greatly on the proximity
of intact biogenic reefs that could act as a source of propagules on habitat regeneration and
macrofauna assemblage succession (Cranfield et al. 2004). Some areas need considerably
longer to recover: One area had not been disturbed by dredging since 20 years but the level of
regeneration conformed only to stage II; another area had not been fished for oysters for 50
years but still showed no sign of recovery, the habitat was classified as Stage I i.e. the stage
observed in areas that are being still disturbed by dredging likely because the nearest habitats
that could act as a source for settling organisms were 13-21 km away (Cranfield et al. 2004).

4350 POP2011-08 Ellenberg & Mattern – Final Report June 2012
!�
In 2004/05 to 2006/07 penguins breeding along the Anglem Coast only foraged along the
fringes of the formerly expansive Foveaux epifaunal reef systems and did not forage in areas
that had been commercially targeted in the previous decade (Mattern et al. 2007b; Mattern
2008; section 4). Hence foraging grounds of yellow-eyed penguins have become spatially
very limited much to the detriment of the species. This clearly reflects in low prey diversity,
quality and quantities observed in penguins from the Anglem Coast (Browne et al 2011). Poor
foraging success causes chick starvation, and subsequently poor recruitment and declining
population numbers.
“In this light, it seems likely that the degradation of the benthic habitat associated with
dredging is limiting viable foraging habitat and prey diversity for Stewart Island penguins.
Since yellow-eyed penguins are at the top of the benthic food web, their rapid decline in the
past few years suggest that far more is at stake than the fate of a single species of penguin.
The unique biogenic reefs of Foveaux Strait off Stewart Island must also be disappearing at
an alarming rate” (Mattern 2008).
While there is already strong evidence for the impact of commercial oyster dredging in the
Foveaux Strait on benthic communities and ultimately yellow-eyed penguins on Stewart
Island, other such potential interactions have yet to be quantified. For example, yellow-eyed
penguins from Oamaru were found to forage at a few discrete, spatially limited areas that
were defined by the presence of horse mussels, which provide substrate for benthic
communities in an otherwise featureless sea floor environment dominated by sand and silt
(Mattern et al. 2007). Such horse mussel fields are scarcely and patchily distributed and
penguins foraged at the same locations not only on different days but in different years
(Mattern et al. 2007). Disturbance or destruction of even one of such horse mussel fields may
have severe consequences for the foraging success of local penguin populations.

4350 POP2011-08 Ellenberg & Mattern – Final Report June 2012
!�
Beyond the degradation of the benthic foraging habitat of yellow-eyed penguins, there are
indications for other interactions between the penguins and bottom fishing operations. A pilot
study examining the marine ecology of yellow-eyed penguins from the Otago Peninsula with
GPS dive loggers observed highly unusual foraging patterns (Mattern et al. 2005; compare
section 4): “On their trips, the penguins spent up to 94% of their foraging time swimming
along straight lines for up to 9.6 km (mean 3.3 km). These lines were not only parallel to the
coast but also parallel to each other. Astoundingly, the penguins navigated along the lines
with extreme accuracy, having a mean horizontal deviation from an ideal straight line course
of 37 m. In order to maintain such accurate navigation in open water, the penguins need cues.
Considering the scale of the lines and the accuracy of navigation, it seems unlikely that the
birds used natural features but rather used man-made cues. These could be fishing vessels but
it seems more likely that dredge marks from bottom trawls are used as linear guides” (Mattern
et al. 2005). To which extent such interactions affect the foraging success of yellow-eyed
penguins in the short as well as the long term is unclear and warrants further investigation.
Research approach
The at sea distribution, foraging effort and success of yellow-eyed penguins needs to be
documented by deployment of GPS dive loggers on breeding adults. In order to determine to
which extent the penguins’ foraging grounds are limited by degradation of the benthic habitat
as a result of commercial oyster extraction independent surveys of the sea floor (e.g. scuba
surveys or drop camera/ROV deployment) are required. Such surveys need to compare the
state of the benthic habitat (i.e. level of disruption, benthic diversity) within the penguins’

4350 POP2011-08 Ellenberg & Mattern – Final Report June 2012
!�
current foraging regions as well as within the foraging radius of yellow-eyed penguins during
the crucial early chick rearing stage (i.e. 20km from breeding sites)3.
Food supplied to the chicks needs to be examined (e.g. meal frequencies & sizes, prey
diversity & quality, chick growth rates). Furthermore, the current population status and
yellow-eyed penguin population parameters (i.e. numbers of breeding pairs, reproductive
success, fledgling weights, adult & juvenile survival, recruitment) on Northeast Stewart Island
needs to be re-assessed. Since population parameters and foraging ecology vary with
oceanographic and climatic conditions as well as fishing effort a comprehensive study needs
to encompass a minimum of 5 consecutive seasons.
Along the Otago coastline, it is essential to analyse the potential for fisheries induced benthic
habitat degradation. The vulnerability of yellow-eyed penguins to the degradation of patchy
distributed benthic communities and the species’ behavioural flexibility to compensate for
such disturbances needs to be quantified. This requires the analysis of foraging patterns and
diving behaviour of yellow-eyed penguins using GPS dive loggers in order to identify
important foraging hot spots i.e. areas of high benthic biodiversity and productivity that
should receive special attention with regard to potential fisheries impact.
3 During the chick guard stage, penguin chicks need to be fed frequently which limits the foraging radius of adult
penguins. Under normal conditions it is believed that adults seldom travel further than 20km from their breeding
site when rearing chicks (see section 4. Marine Ecology)

4350 POP2011-08 Ellenberg & Mattern – Final Report June 2012
!
5.2.2 Fisheries competition
Rationale
Moore and Wakelin (1997) suggest that a direct competition between commercial fisheries
and yellow-eyed penguins seems unlikely, as the penguins target smaller size classes of
commercially exploited species. An example given is red cod (Pseudophycis bachus) where
yellow-eyed penguins take principally juvenile red cod whereas fisheries focus on adult red
cod. At the same time, the authors point out that the occurrence of red cod in the diet of the
penguins peaked in the same years of high red cod landing by commercial fisheries. Yet “a
lag would be expected between a year of high penguin consumption (<2 year old fish) and
one of high catch in the fishery (3-4 year old fish)” (Moore and Wakelin 1997). Unless the
simultaneous peaks in red cod occurrence in the yellow-eyed penguin diet and red cod
landings is purely coincidental, it seems plausible that the abundance of juvenile and adult red
cod is determined by the same factors.
A fact sheet published by the Ministry of Fisheries published online (MFish 2007) concludes
that “red cod abundance is naturally variable [in response to environmental parameters] but
the length and magnitude of the decline in commercial landings […] indicates fishing
pressure may have significantly reduced spawning stock abundance” (page 273, point 27).
Therefore it appears that the availability of red cod is not only a product of environmental
variables, but is also determined by fishing pressure.
To which degree this fishing pressure may either directly or indirectly affect juvenile red cod
is unclear. However, “there are no distinct red cod juvenile grounds and distribution is similar
to that of red cod general distribution except for a few areas where they are more abundant
between about 250 and 450m.” (Nabis 2012). Furthermore, the majority of juvenile red cod
reside close to the species’ spawning hotspots before moving to the main commercial fishing

4350 POP2011-08 Ellenberg & Mattern – Final Report June 2012
!!
grounds (Nabis 2012). For Southern New Zealand these spawning hot spots are Canterbury
Bight, Puysegur and the Snares Shelf. Hence, it appears that red cod caught by yellow-eyed
penguins along the Otago coastline are probably sub-adults that intermingle with the adult
population.
The potential competition effects may therefore be of an indirect nature, e.g. via affecting
juvenile red cod during fishing operations and reducing the spawning population (MFish
2007). While red cod continues to be an important food source found in about half of all diet
samples the average contribution to total meal size has declined from 36% in the mid 1980s to
7.4% in the 1990s (van Heezik 1990; Moore & Wakelin 1997; Section 4). At any rate, a more
detailed examination of the potential impact of fisheries competition is warranted particularly
in areas where red cod fisheries and yellow-eyed penguin foraging grounds overlap.

4350 POP2011-08 Ellenberg & Mattern – Final Report June 2012
�""
Acknowledgements
We thank members of the Yellow-eyed penguin Research Advisory Group, namely Bruce
McKinlay, Chris Lalas, David McFarlane, Yolanda van Heezik, and Philip Seddon, as well as
John Darby and Graeme Loh for valuable feedback and stimulating discussions. Philip
Seddon, Director Postgraduate Wildlife Management Programme, University of Otago, Pablo
Garcia Borboroglu, CONICET, University of Washington & Global Penguin Society, Peter
Dann, Research Manager at the Phillip Island Nature Park & University of Melbourne, Dave
Houston, Department of Conservation, Igor Debski, Conservation Services Programme, and
John Darby have greatly improved this manuscript. This report was facilitated by Russell
Harding and Igor Debski, Conservation Services Programme, Department of Conservation,
Wellington.

4350 POP2011-08 Ellenberg & Mattern – Final Report June 2012
�"�
6. References
Alterio, N.; Moller, H.; Ratz, H. 1998: Movements and habitat use of feral house cats Feliscatus, stoats Mustela erminea and ferrets Mustela furo, in grassland surrounding yellow-eyed penguin Megadyptes antipodes breeding areas in spring. BiologicalConservation 83: 187-194.
Amey, J.; Moore, P.J. 1995: Yellow-eyed penguin on Campbell Island. Department of Conservation, Invercargill, New Zealand.
Argilla, L.S.; Gartrell, B.D.; Howe, L.; Alley, M.R.; Morgan, K.J. 2010: Investigation into the prevalence of Leucocytozoon in the endangered Yellow-eyed Penguin (Megadyptesantipodes) on Enderby Island. Abstracts of oral and poster presentations, 7th International Penguin Conference, Boston, Massachusetts USA, 30 August-3 September 2010.
Bart, J.; Droege, S.; Geissler, P.; Peterjohn, B.; Ralph, C. 2004: Density estimation in wildlife surveys. Wildlife Society Bulletin 32: 1242–1247.
Beer, K.J. 2010: Distribution of Yellow-eyed Penguins (Megadyptes antipodes) on the Auckland Islands: November – December 2009. Department of Zoology, University of Otago, Dunedin, New Zealand.
Boessenkool, S. 2009: Spatial and temporal genetic structuring in Yellow-eyed penguins. Unpublished Unpublished PhD thesis thesis. University of Otago, Dunedin, New Zealand.
Boessenkool, S.; Austin, J.J.; Worthy, T.H.; Scofield, P.; Cooper, A.; Seddon, P.J.; Waters, J.M. 2009a: Relict or colonizer? Extinction and range expansion of penguins in southern New Zealand. Proceedings of the Royal Society B-Biological Sciences 276:815-821.
Boessenkool, S.; Star, B.; Paul Scofield, R.; Seddon, P.J.; Waters, J.M. 2010a: Lost in translation or deliberate falsification? Genetic analyses reveal erroneous museum data for historic penguin specimens. Proceedings of the Royal Society B: Biological Sciences 277: 1057-1064.
Boessenkool, S.; Star, B.; Seddon, P.J.; Waters, J.M. 2010b: Temporal genetic samples indicate small effective population size of the endangered yellow-eyed penguin. Conservation Genetics 11: 539-546.
Boessenkool, S.; Star, B.; Waters, J.M.; Seddon, P.J. 2009b: Multilocus assignment analyses reveal multiple units and rare migration events in the recently expanded yellow-eyed penguin (Megadyptes antipodes). Molecular Ecology 18: 2390-2400.
Browne, T. 2007: Diet of Yellow-eyed penguins on Stewart and Codfish Islands: is diet responsible for poor Yellow-eyed penguin chick survival on Stewart Island? Unpublished MSc thesis. University of Otago, Dunedin, New Zealand. 85 p.

4350 POP2011-08 Ellenberg & Mattern – Final Report June 2012
�"�
Browne, T.; Lalas, C.; Mattern, T.; Van Heezik, Y. 2011: Chick starvation in yellow-eyed penguins: Evidence for poor diet quality and selective provisioning of chicks from conventional diet analysis and stable isotopes. Austral Ecology 36: 99-108.
Burger, A.E.; Wilson, R.P. 1988: Capillary-tube depth gauges for diving animals: an assessment of their accuracy and applicability. Journal of Field Ornithology 59: 345-354.
Busch, J.; Cullen, R. 2009: Effectiveness and cost-effectiveness of yellow-eyed penguin recovery. Ecological Economics 68: 762-776.
Caswell, H. 1982: Life history traits and the equilibrium status of populations. The American Naturalist 120: 317-339.
Clark, R.D. 2007: The spatial ecology of Yellow-eyed penguin nest site selection at breeding areas with different habitat types on the South Island of New Zealand. Unpublished MSc thesis. University of Otago, Dunedin, New Zealand.
Clark, R.D.; Mathieu, R.; Seddon, P.J. 2008: Geographic Information Systems in wildlife management: a case study using Yellow-eyed penguin nest site data. Department of Conservation, Wellington, New Zealand. 34 p.
Clutton-Brock, T.H. 1988: Reproductive Success: Studies of individual variation in contrasting breeding systems. University of Chicago Press, Chicago, IL.
Coulson, J.C.; Porter, J.M. 1985: Reproductive success of Kittiwakes Rissa tridactyla: the role of clutch size, chick growth rates, and parental quality. Ibis 127: 450-466.
Cranfield, H.J.; Manighetti, B.; Michael, K.P.; Hill, A. 2003: Effects of oyster dredging on the distribution of bryozoan biogenic reefs and associated sediments in Foveaux Strait, southern New Zealand. Continental Shelf Research 23: 1337-1357.
Cranfield, H.J.; Michael, K.P.; Doonan, I.J. 1999: Changes in the distribution of epifaunal reefs and oysters during 130 years of dredging for oysters in Foveaux Strait, southern New Zealand. Aquatic Conservation: Marine and Freshwater Ecosystems 9: 461-483.
Culik, B.; Hennicke, J.; Martin, T. 2000: Humboldt Penguins outmaneuvering El Niño. Journal of Experimental Biology 203: 2311-2322.
Curio, E. 1983: Why do young birds reproduce less well? Ibis 125: 400-404.
Darby, J.T. 1985: The great Yellow-eyed penguin count. Forest & Bird 16: 16-18.
Darby, J.T. 2003: The yellow-eyed penguin (Megadyptes antipodes) on Stewart and Codfish Islands. Notornis 50: 148-154.
Darby, J.T.; Dawson, S.M. 2000: Bycatch of yellow-eyed penguins (Megadyptes antipodes)in gillnets in New Zealand waters 1979-1997. Biological Conservation 93: 327-332.

4350 POP2011-08 Ellenberg & Mattern – Final Report June 2012
�"�
Darby, J.T.; Seddon, P.J. 1988: The breeding biology of the Yellow-eyed Penguin. Cormorant 16: 125-126.
Darby, J.T.; Seddon, P.J. 1990: Breeding biology of Yellow-eyed Penguins (Megadyptesantipodes). Pp. 45-62 in Davis, L.S.; Darby, J.T. (Ed.): Penguin Biology. Academic Press, San Diego.
Department of Conservation 1991: Hoiho species conservation plan. Department of Conservation, Dunedin, New Zealand.
Dunn, E.K. 1972: The effect of age on the fishing ability of sandwich terns, Sternasandvicensis. Ibis 114: 360-366.
Edge, K.A. 1998: Parental investment in penguins: a phylogenetic and experimental approach. Unpublished PhD thesis. University of Otago, Dunedin, New Zealand.
Edge, K.A.; Jamieson, I.G.; Darby, J.T. 1999: Parental investment and the management of an endangered penguin. Biological Conservation 88: 367-378.
Efford, M.G.; Edge, K.A. 1998: Can artificial brood reduction assist the conservation of yellow-eyed penguins (Megadyptes antipodes)? Animal Conservation 1: 263-271.
Efford, M.G.; Spencer, N.; Darby, J.T. 1994: A relational database for Yellow-eyed penguin banding and breeding records, unpublished report. Landcare Research, Dunedin, New Zealand.
Efford, M.G.; Spencer, N.J.; Darby, J.T. 1996: Population studies of Yellow-eyed penguins – 1993-94 progress report. Department of Conservation, Wellington, New Zealand.
Ellenberg, U.; Mattern, T.; Seddon, P.J. 2009: Habituation potential of yellow-eyed penguins depends on sex, character and previous experience with humans. Animal Behaviour 77: 289-296.
Ellenberg, U.; Setiawan, A.N.; Cree, A.; Houston, D.M.; Seddon, P.J. 2007: Elevated hormonal stress response and reduced reproductive output in Yellow-eyed penguins exposed to unregulated tourism. General and Comparative Endocrinology 152: 54-63.
Ellenberg, U. 2010. Assessing the impact of human disturbance on penguins. Unpublished PhD thesis. University of Otago, Dunedin, New Zealand. 257 p.
Erwin, R. 1981: Censusing wading bird colonies: an update on the ‘‘flight-line’’ count method. Colonial Waterbirds 4: 91-95.
Gill, J.M.; Darby, J.T. 1993: Deaths in Yellow-Eyed Penguins (Megadyptes-Antipodes) on the Otago Peninsula During the Summer of 1990. New Zealand Veterinary Journal 41:39-42.

4350 POP2011-08 Ellenberg & Mattern – Final Report June 2012
�"�
Hegg, D.; Giroir, T.; Ellenberg, U.; Seddon, P.J. 2012: Yellow-eyed Penguin (Megadyptes antipodes) as a case study to assess the reliability of nest counts. Journal of Ornithology 1-10.
Hill, A.G.; Howe, L.; Gartrell, B.D.; Alley, M.R. 2010: Prevalence of Leucocytozoon spp, in the endangered yellow-eyed penguin Megadyptes antipodes. Parasitology 137: 1477-1485.
Hiscock, J. 2008: Yellow Eyed Penguin Counts Northwest Bay and Southeast Harbour, Campbell Island, November 2008 (unpublished). Department of Conservation, Invercargill, New Zealand.
Hocken, A.G. 2005: Necropsy findings in yellow-eyed penguins (Megadyptes antipodes)from Otago, New Zealand. New Zealand Journal of Zoology 32: 1-8.
Houston, D.M. 2005: Diphtheritic stomatitis in yellow-eyed penguins. Pp. 267 in: 5th Oamaru Penguin Symposium, Hocken, A.J.
Houston, D.; Nelson, D. 2012: A survey of Yellow-eyed penguins on Codfish Island / Whenua Hou during 28 October – 3 November 2011, unpublished report. Yellow-eyed Penguin Trust and the Department of Conservation, Wellington, New Zealand. 14 p.
Hutchinson, A. 1979: Estimating numbers of colonial nesting seabirds: a comparison of techniques. Proceedings of the Colonial Waterbird Group 3: 235–244.
IUCN 2011: IUCN Red List of Threatened Species. Version 2011.2. www.iucnredlist.org.Downloaded on 01 March 2012.
Jones, J.; Lalas, C.; Houston, D.; Pearce, K.; van Heezik, Y. 2004: Translocation and other conservation measures to increase the population size of yellow-eyed penguins at North Otago, New Zealand. New Zealand Journal of Zoology 31: 118.
Jiang, W.; Carbines, G. 2002: Diet of blue cod, Parapercis colias, living on undisturbed biogenic reefs and on seabed modified by oyster dredging in Foveaux Strait, New Zealand. Aquatic Conservation: Marine and Freshwater Ecosystems 12: 257-272.
King, S. 2008a: Breeding success of Yellow-eyed penguins on Stewart Island and off-shore islands 2003-2008, unpublished report. Yellow-eyed Penguin Trust, in association with the Department of Conservation (Southland Conservancy), Invercargill, New Zealand. 41 p.
King, S. 2008b: Breeding success of yellow-eyed penguins on Stewart Island and offshore islands. New Zealand Journal of Zoology 35: 297-297.
King, S. 2009: Survey of Yellow-eyed penguins on Stewart Island / Rakiura, unpublished report. Yellow-eyed penguin Trust, in association with the Department of Conservation, Southland Conservancy, New Zealand.

4350 POP2011-08 Ellenberg & Mattern – Final Report June 2012
�"�
Korpimäki, E. 1992: Fluctuation food abundance determines the lifetime reproductive success of male Tengmalm’s owls. Journal of Animal Ecology 61: 103-111.
Lalas, C.; Ratz, H.; McEwan, K.; McConkey, S.D. 2007: Predation by New Zealand sea lions (Phocarctos hookeri) as a threat to the viability of yellow-eyed penguins (Megadyptesantipodes) at Otago Peninsula, New Zealand. Biological Conservation 135: 235-246.
Leseberg, A. 2011: The breeding success of yellow-eyed penguins Codfish Island, the Bravo Island and The Neck, unpublished report. Yellow-eyed Penguin Trust, Dunedin, New Zealand.
Massaro, M.; Blair, D. 2003: Comparison of population numbers of yellow-eyed penguins, Megadyptes antipodes, on Stewart Island and on adjacent cat-free islands. NewZealand Journal of Ecology 27: 107-113.
Massaro, M.; Darby, J.T.; Davis, L.S.; Edge, K.A.; Hazel, M.J. 2002: Investigation of interacting effects of female age, laying dates, and egg size in yellow-eyed penguins (Megadyptes antipodes). Auk 119: 1137-1141.
Massaro, M.; Davis, L.S.; Darby, J.T.; Robertson, G.J.; Setiawan, A.N. 2004: Intraspecific variation of incubation periods in Yellow-eyed Penguins Megadyptes antipodes: testing the influence of age, laying date and egg size. Ibis 146: 526-530.
Massaro, M.; Davis, L.S.; Davidson, R.S. 2006: Plasticity of brood patch development and its influence on incubation periods in the yellow-eyed penguin Megadyptes antipodes: an experimental approach. Journal of Avian Biology 37: 497-506.
Massaro, M.; Setiawan, A.N.; Davis, L.S. 2007: Effects of artificial eggs on prolactin secretion, steroid levels, brood patch development, incubation onset and clutch size in the yellow-eyed penguin (Megadyptes antipodes). General and Comparative Endocrinology 151: 220-229.
Mattern, T. 2006a: At-sea distribution, shore distances and basic dive behaviour of Yellow-eyed penguins Megadyptes antipodes along the species mainland breeding range, unpublished report. Ministry of Fisheries, Wellington, New Zealand. 18 p.
Mattern, T. 2006b: Marine ecology of offshore and inshore foraging penguins: The Snares penguin Eudyptes robustus and Yellow-eyed penguin Megadyptes antipodes.Unpublished PhD thesis. University of Otago, Dunedin. 160 p.
Mattern, T. 2008: The tip of the iceberg? The decline of Stewart Island Yellow-eyed penguins indicates serious problems at sea. New Zealand Journal of Zoology 35: 298.
Mattern, T. in press: Fiordland penguin. In Garcia Boroboroglu, P.; Boersma, P.D. (Ed.): Penguins: Natural History and Conservation. Washington University Press, Washington.
Mattern, T.; Ellenberg, U.; Davis, L.S. 2006: Starving chicks, short foraging ranges – the Stewart Island Paradox. Annual Yellow-eyed penguin Symposium, 5th August 2006

4350 POP2011-08 Ellenberg & Mattern – Final Report June 2012
�"�
Mattern, T.; Ellenberg, U.; Davis, L.S. 2007a: Decline for a delicacy: are decreased numbers of Yellow-eyed penguins on Stewart Island a result of commercial oyster dredging? Pp. in: 6th International Penguin Conference, Woehler, E.J.
Mattern, T.; Ellenberg, U.; Davis, L.S.; Houston, D.M. 2005: Fish and ships? Indications of substantial fisheries interaction of yellow-eyed penguins (Megadyptes antipodes). NewZealand Journal of Zoology 32: 270-270.
Mattern, T.; Ellenberg, U.; Houston, D.M.; Davis, L.S. 2007b: Consistent foraging routes and benthic foraging behaviour in yellow-eyed penguins. Marine Ecology Progress Series 343: 295-306.
Mattern, T.; Ludynia, K.; Houston, D.M.; Garthe, S.; Davis, L.S. 2005: How to get the most (or anything) out of GPS loggers: a case study with Snares penguins. Pp. in: 2nd International Bio-logging Science Symposium, St Andrews 2005,
Maunder, M.N.; Dunn, A.; Houston, D.M.; Seddon, P.J.; Kendrick, T. 2007: Evaluating fishery impact on a Yellow-eyed penguin population using mark-recapture data within a population dynamics model. Contract report submitted to the Ministry of Fisheries, Wellington, New Zealand. 23 p.
McClung, M.R.; Seddon, P.J.; Massaro, M.; Setiawan, A.N. 2004: Nature-based tourism impacts on yellow-eyed penguins Megadyptes antipodes: does unregulated visitor access affect fledging weight and juvenile survival? Biological Conservation 119:279-285.
McElderry, H. 2008: At sea observing using video-based electronic monitoring. Background paper prepared by Archipelago Marine Research Ltd. for the Electronic Monitoring Workshop July 29–30, 2008, Seattle WA, held by the North Pacific Fishery Management Council, the National Marine Fisheries Service, and the North Pacific Research Board: The efficacy of video-based monitoring for the halibut fishery. Available online at www.fakr.noaa.gov/npfmc/misc_pub/EMproceedings.pdf.
McElderry, H.; Beck, M.; Pria, M.J.; Anderson, S.A. 2011: Electronic monitoring in the New Zealand inshore trawl fishery - A pilot study. Department of Conservation, Wellington, New Zealand.
McKay, R. 1999: Nest-site selection by yellow-eyed penguins megadyptes antipodes on grazed Farmland. Marine Ornithology 27: 34-35.
McKinlay, B. 1997: The conservation of Yellow-eyed Penguins Megadyptes antipodes: Use of a PVA model to guide policy development for future conservation management direction. Wildlife Management Report. University of Otago, Dunedin. 62 p.
McKinlay, B. 2001: Hoiho (Megadyptes antipodes) recovery plan 2000-2025. Threatened species recovery plan. Department of Conservation, Wellington, New Zealand. 26 p.

4350 POP2011-08 Ellenberg & Mattern – Final Report June 2012
�"�
Meade, J.; Biro, D.; Guildford, T. 2005: Homing pigeons develop local route stereotypy. Proceedings of the Royal Society London B: Biological Sciences 272: 17-23.
Ministry of Fisheries & Department of Conservation 2004: National Plan of Action to Reduce the Incidental Catch of Seabirds in New Zealand Fisheries. Ministry of Fisheries and Department of Conservation, Wellington, New Zealand.
Miskelly, C.M.; Dowding, J.E.; Elliott, G.P.; Hitchmough, R.A.; Powlesland, R.G.; Robertson, H.A.; Sagar, P.M.; Scofield, R.P.; Taylor, G.A. 2008: Conservation status of New Zealand birds. Notornis 55: 117-135.
Moore, C.T.; Moffat, R.D. 1990: Yellow-eyed penguins on Campbell Island. Department of Conservation, Wellington, New Zealand.
Moore, P. 1990: Population survey of yellow-eyed penguins on the Auckland Islands, Nov-Dec 1989. Department of Conservation, Wellington, New Zealand. p.
Moore, P.J. 1992: Population estimates of Yellow-eyed penguins (Megadyptes antipodes) on Campbell and Auckland Islands. Notornis 39: 1-15.
Moore, P.J. 1999: Foraging range of the Yellow-eyed Penguin Megadyptes antipodes. MarineOrnithology 27: 49-58.
Moore, P.J. 2001: Historical records of yellow-eyed penguin (Megadyptes antipodes) in Southern New Zealand. Notornis 48: 145-156.
Moore, P.J.; Fletcher, D.; Amey, J. 2001: Population estimates of Yellow-eyed Penguins, Megadyptes antipodes, on Campbell Island, 1987-98. Emu 101: 225-236.
Moore, P.J.; Wakelin, M.; Douglas, M.E.; McKinlay, B.; Nelson, D.; Murphy, B. 1995: Yellow-eyed penguin foraging study, south-eastern New Zealand, 1991-1993. Department of Conservation, Wellington. 41 p.
Moore, P.J.; Wakelin, M.D. 1997: Diet of the Yellow-eyed penguin Megadyptes antipodes,South Island, New Zealand, 1991-1993. Marine Ornithology 25: 17-29.
Nettleship, D. 1976: Census techniques for seabirds of arctic and eastern Canada. Canadian Wildlife Service, Ottawa, Canada.
Newton, I. 1985: Lifetime reproductive output of female sparrowhawks. Journal of Animal Ecology 54: 241-253.
Newton, I. 1989: Age and reproduction in sparrowhawk. Pp. 201-219 in Clutton-Brock, T.H. (Ed.): Reproductive Success: Studies of individual variation in contrasting breeding systems. University of Chicago Press, Chicago, IL.
New Zealand Wildlife Service 1986: Yellow-eyed penguin Megadyptes antipodes. Draft species recovery plan. Department of Internal Affairs, Dunedin, New Zealand.

4350 POP2011-08 Ellenberg & Mattern – Final Report June 2012
�"
O'Driscoll, R.L.; Renner, M.; Austin, F.J.; Spencer, H.G. 1998: Distribution of seabirds in coastal waters off Otago, New Zealand. New Zealand Journal of Marine and Freshwater Research 32: 203-213.
Orians, G.H. 1969: On the evolution of mating systems in birds and mammals. The American Naturalist 103: 589-603.
Parker, S. 2009: Yellow Eyed Penguin Observations Banks Peninsula 08/09 Season. Department of Conservation, Mahaanui Area Office, Christchurch, New Zealand. 4 p.
Parker, S. 2010: Yellow Eyed Penguin Observations Banks Peninsula 09/10 Season. Department of Conservation, Mahaanui Area Office Christchurch. 8 p.
Partridge, L. 1989: Lifetime reproductive success and life-history evolution. Pp. 421-440 in Newton, I. (Ed.): Lifetime reproduction in birds. Academic Press, London.
Peacock, L. 1995: Investigations into climatic effects on Yellow-eyed penguins (Megadyptes antipodes). Unpublished MSc thesis thesis. University of Otago, Dunedin. 132p
Peacock, L.; Paulin, M.; Darby, J. 2000: Investigations into climate influence on population dynamics of yellow-eyed penguins Megadyptes antipodes. New Zealand Journal of Zoology, 27: 317-325.
Perriman, L.; Houston, D.M.; Steen, H.; Johannesen, E. 2000: Climate fluctuation effects on breeding of blue penguins (Eudyptula minor). New Zealand Journal of Zoology, 27:261-267.
Poole, J. 2005: The development and application of a GIS for monitoring Hoiho (Megadyptesantipodes) nesting sites on the Otago Peninsula. Unpublished BAppSci thesis. University of Otago, Dunedin, New Zealand.
Ramm, K. 2010: Conservation Services Programme Observer Report: 1 July 2008 to 30 June 2009. Final Draft Report. Department of Conservation, Wellington. 126 p. Available for download at http://www.doc.govt.nz/mcs.
Ramm, K. 2011: Conservation Services Programme Observer Report: 1 July 2009 to 30 June 2010. Final Report.Department of Conservation, Wellington. 103 p. Available for download at http://www.doc.govt.nz/mcs.
Ratz, H.; Darby, J.T.; Edge, K.A.; Thompson, C. 2004: Survival and breeding of yellow-eyed penguins (Megadyptes antipodes), at two locations on Otago Peninsula, South Island, New Zealand, 1991-96. New Zealand Journal of Zoology 31: 133-147.
Ratz, H.; Murphy, B. 1999: Effects of habitat and introduced mammalian predators on the breeding success of Yellow-eyed Penguins Megadyptes antipodes, South Island, New Zealand. Pacific Conservation Biology 5: 16-27.
Reid, K.; Prince, P.A.; Croxall, J.P. 2000: Fly or die: the role of fat stores in the growth and development of Grey-headed Albatross Diomedea chrysostoma chicks. Ibis 142: 188-198.

4350 POP2011-08 Ellenberg & Mattern – Final Report June 2012
�"!
Richard, Y.; Abraham, E.; Filippi, D. 2011: Assessment of the risk to seabird populations from New Zealand commercial fisheries. Ministry of Fisheries, Wellington, New Zealand. 66 p.
Richdale, L.E. 1941: A brief summary of the history of the Yellow-eyed penguin. Emu 40:265-287.
Richdale, L.E. 1942: A comprehensive history of the behaviour of the yellow-eyed penguin (Megadyptes antipodes). In: Homb. and Jacqu. Unpubl. papers MS 1260/70/1,2, Hocken Library, Dunedin.
Richdale, L.E. 1951: Sexual behavior in penguins. University of Kansas Press, Kansas.
Richdale, L.E. 1953: Composition of Megadyptes colonies. Pp. in: Unpublished papers MS 1260/65/11, Hocken Library, Dunedin
Richdale, L.E. 1957: A Population Study of Penguins. Clarendon Press, Oxford.
Roberts, C.L.; Roberts, S.L. 1973: Survival rate of Yellow-eyed Penguin eggs and chicks on the Otago Peninsula. Notornis 20: 1-5.
Roper, C.F.E.; Young, R.E. 1975: Vertical Distribution of Pelagic Squid. Smithsonion Institution Press, 60 p.
Rowe, S. 2008: Monitoring penguin bycatch in commercial setnet fisheries. New Zealand Journal of Zoology 35: 299.
Rowe, S. 2010a: Level 1 Risk Assessment for incidental seabird mortality associated with New Zealand fisheries in the NZ-EEZ. Marine Conservation Services, Department of Conservation, Wellington. 75 p. Available for download from http://www.doc.govt.nz/mcs.
Rowe, S.J. 2009: Conservation Services Programme observer report: 01 July 2004 to 30 June 2007. DOC Marine Conservation Services Series 1. Department of Conservation, Wellington. 93 p. Available for download at http://www.doc.govt.nz/mcs.
Rowe, S.J. 2010b: Conservation Services Programme observer report: 1 July 2007 to 30 June 2008. DOC Marine Conservation Services Series 4. Department of Conservation, Wellington. 97 p. Available for download at http://www.doc.govt.nz/mcs.
Sagar, P.M.; Horning, D.S. 1998: Mass-related survival of fledgling Sooty Shearwaters Puffinus griseus at The Snares, New Zealand. Ibis 140: 329-339.
Schweigman, P.; Darby, J. 1997: Predation of Yellow-eyed Penguins (Megadyptes antipodes)on mainland New Zealand by Hooker’s sealion (Phocarctos hookeri). Notornis 44:265-266.

4350 POP2011-08 Ellenberg & Mattern – Final Report June 2012
��"
Seddon, P.J.; Darby, J.T. 1990: Activity Budget for Breeding Yellow-Eyed Penguins. NewZealand Journal of Zoology 17: 527-532.
Seddon, P.J.; Davis, L.S. 1989: Nest-site selection by Yellow-eyed Penguins. Condor 91:653-659.
Seddon, P.J.; Ellenberg, U.; van Heezik, Y. in press: Yellow-eyed penguins, Megadyptesantipodes. Pp. in García-Borboroglu, P.G.; P.D., B. (Ed.): Penguins: Natural History and Conservation. University of Washington Press, Seattle, U.S.A.
Seddon, P.J.; van Heezik, Y. 1990: Diving Depths of the Yellow-eyed Penguin Megadyptesantipodes. Emu 90: 53-57.
Setiawan, A.N.; Davis, L.S.; Darby, J.T.; Lokman, P.M.; Young, G.; Blackberry, M.A.; Cannell, B.L.; Martin, G.B. 2007: Effects of artificial social stimuli on the reproductive schedule and hormone levels of yellow-eyed penguins (Megadyptes antipodes). Hormones and Behavior 51: 46-53.
Setiawan, A.N.; Massaro, M.; Darby, J.T.; Davis, L.S. 2005: Mate and territory retention in yellow-eyed penguins. Condor 107: 703-709.
Stearns, S.C. 1992: The Evolution of Life Histories. Oxford University Press, New York. 264 p.
Stein, A.M. 2012: Lifetime reproductive success in yellow-eyed penguins: life-history parameters and investigator disturbance. Unpublished thesis. University of Otago, Dunedin, New Zealand.
Stonehouse, B. 1967: The general biology and thermal balance of penguins. Pp. 131-196 in Cragg, J. (Ed.): Advances in Ecological Research. Academic Press, New York.
Sturrock, H.J.W.; Tompkins, D.M. 2007: Avian malaria (Plasmodium spp) in yellow-eyed penguins: Investigating the cause of high seroprevalence but low observed infection. New Zealand Veterinary Journal 55: 158-160.
Sturrock, H.J.W.; Tompkins, D.M. 2008: Avian malaria parasites (Plasmodium spp.) in Dunedin and on the Otago Peninsula, southern New Zealand. New Zealand Journal of Ecology 32: 98-102.
Taylor, G.A. 2000: Action Plan for Seabird conservation in New Zealand. Part A Threatened Seabirds. Department of Conservation, Wellington, New Zealand.
Thomas, L. 1996: Monitoring long-term population change: why are there so many analysis methods? Ecology 77: 49–58.
Triggs, S.; Darby, J.T. 1989: Genetics and Conservation of Yellow-eyed Penguin: An Interim Report. Department of Conservation, Wellington, New Zealand.

4350 POP2011-08 Ellenberg & Mattern – Final Report June 2012
���
van Heezik, Y. 1989: The growth and diet of the yellow-eyed penguin, Megadyptes antipodes. Unpublished PhD thesis thesis. University of Otago, Dunedin. 179 p.
van Heezik, Y. 1990a: Diets of yellow-eyed, Fiordland crested, and little blue penguins breeding sympatrically on Codfish Island, New Zealand. New Zealand Journal of Zoology, 27: 543-548.
van Heezik, Y. 1990b: Seasonal, geographical, and age-related variations in the diet of the Yellow-eyed Penguin (Megadyptes antipodes). New Zealand Journal of Zoology, 17:201–212.
van Heezik, Y.; Davis, L.S. 1990: Effects of food variability on growth rates, fledging sizes and reproductive success in the Yellow-eyed Penguin Megadyptes antipodes. Ibis 132:354–365.
van Heezik, Y.; Seddon, P.J. 1989: Stomach sampling in the Yellow-eyed Penguin: erosion of otoliths and squid beaks. Journal of Field Ornithology 60: 451–458.
Walter, S.; Rusch, D. 1997: Visibility bias on counts of nesting Canada geese. Journal of Wildlife Management 61: 768–772.
Williams, G.C. 1966: Natural selection, the cost of reproduction, and a refinement of Lack's principle. American Naturalist 100: 687-690.
Willis, T.J.; Bradley, A.; J, H.S.; Paavo, B.; Page, M.J.; James, M. 2008: Benthic offshore surveys of proposed dredge spoil disposal sites off Otago Peninsula. National Institute of Water and Atmospheris Research Ltd, Nelson. 54 p.
Wilson, R.P. 1994: An improved stomach pump for penguins and other seabirds. Journal of Field Ornithology 55: 109-111.
Wilson, R.P. 1995: Foraging ecology. Pp. 81–106 in Williams, T.D. (Ed.): The Penguins. Oxford University Press, Oxford.
Wilson, R.P. 2004: Reconstructing the past using futuristic developments: trends and perspectives in logger technology for penguins. Memoirs of the National Institute of Polar Research 58: 34-49.
Young, M. 2009a: Beach behaviour of Yellow-eyed penguins on Enderby Island, Auckland Island Group, New Zealand. University of Otago, Dunedin, New Zealand.
Young, M. 2009b: Beach counts (total counts) of Yellow-eyed penguins (Megadyptesantipodes) on Enderby Island, Auckland Islands, December 2008 – February 2009. Department of Conservation Southern Islands Area Office, Invercargill, New Zealand. 8 p.
Zar, J.H. 1999: Biostatistical Analysis. Prentice Hall, New Jersey.

4350 POP2011-08 Ellenberg & Mattern – Final Report June 2012
���
Table 3.1Published sources and estimates of adult survival in yellow-eyed penguins on the Otago Peninsula, South Island, New Zealand.
Source Dataset Survival Rate (%)
Range(%)
Method
Richdale 1957 1936-1954 85.4 72-94 Recovery rate
Edge 1996 1982-1994 - 83-94 JS model
Efford et al. 1994 1981/82-1991/92 83.2 49-100 JS estimate
Efford et al. 1994 1981/82-1991/92* 87 80-100 JS estimate
Efford et al. 1994 1989/90 50.0 - JS estimate
Edge 1996 1989/90 - 20-59 Recovery rate
Edge 1999 1992 91.3 - Recovery rate
Edge 1999 1993 90.3 - Recovery rate
Ratz et al. 2004 1991/92-1996/97 90 86-95 Recovery rate *Excluding 89/90

4350 POP2011-08 Ellenberg & Mattern – Final Report June 2012
���
Table 3.2Published sources of survival to adulthood for yellow-eyed penguins, for the Otago Peninsula, South Island, New Zealand.
Source Dataset Age survived
Number banded
Sighted as adult
Yearly Range (%)
Method
Richdale 1957 1939-1949 2 399 129 (32%) - Recovery rate
Richdale1957 1939-1949 3 399 108 (27%) - Recovery rate
Richdale 1957 1939-1954 4 491 411 (84%) - Recovery rate
Efford et al. 1994 1981/82-1991/92 2 587 122 (20.8%) 1.1-37.5% Recovery rate
Stein et al. 2012 1981-2003 2 2032 382 (18.8%) - Recovery rate

4350 POP2011-08 Ellenberg & Mattern – Final Report June 2012
���
Table 3.3Numbers and percentages of the age at first breeding in female and male yellow-eyed penguins from Richdale (1957) and Stein (2012).
Age at first breeding Richdale (1957) Stein et al. (2012)
Females
2 48% 19% (20)
3 48% 59% (63)
4 4% 13% (14)
5-7 - 9% (10)
Males
2 8% 8% (8)
3 47% 49% (50)
4 13% 19% (20)
5 - 24% (24)
6-9 - 13% (13)
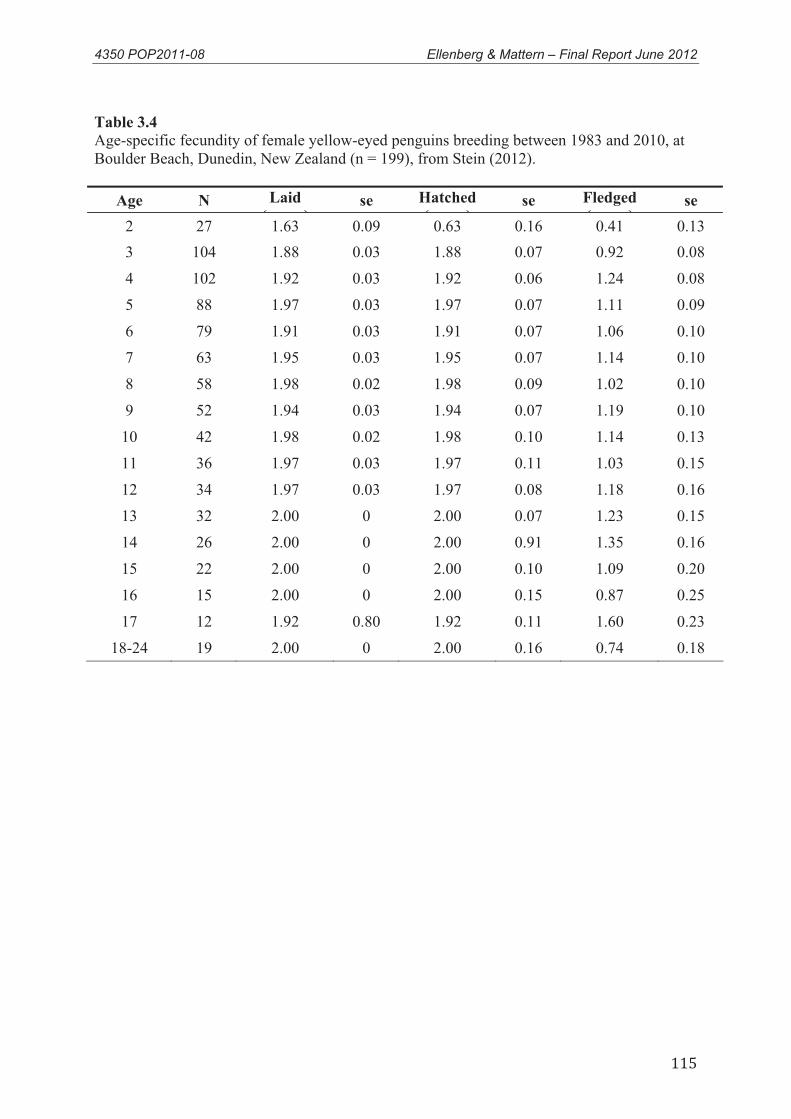
4350 POP2011-08 Ellenberg & Mattern – Final Report June 2012
���
Table 3.4Age-specific fecundity of female yellow-eyed penguins breeding between 1983 and 2010, at Boulder Beach, Dunedin, New Zealand (n = 199), from Stein (2012).
Age N Laid( )
se Hatched( )
se Fledged( )
se2 27 1.63 0.09 0.63 0.16 0.41 0.13 3 104 1.88 0.03 1.88 0.07 0.92 0.08
4 102 1.92 0.03 1.92 0.06 1.24 0.08
5 88 1.97 0.03 1.97 0.07 1.11 0.09
6 79 1.91 0.03 1.91 0.07 1.06 0.10
7 63 1.95 0.03 1.95 0.07 1.14 0.10
8 58 1.98 0.02 1.98 0.09 1.02 0.10
9 52 1.94 0.03 1.94 0.07 1.19 0.10
10 42 1.98 0.02 1.98 0.10 1.14 0.13
11 36 1.97 0.03 1.97 0.11 1.03 0.15
12 34 1.97 0.03 1.97 0.08 1.18 0.16
13 32 2.00 0 2.00 0.07 1.23 0.15
14 26 2.00 0 2.00 0.91 1.35 0.16
15 22 2.00 0 2.00 0.10 1.09 0.20
16 15 2.00 0 2.00 0.15 0.87 0.25
17 12 1.92 0.80 1.92 0.11 1.60 0.23
18-24 19 2.00 0 2.00 0.16 0.74 0.18
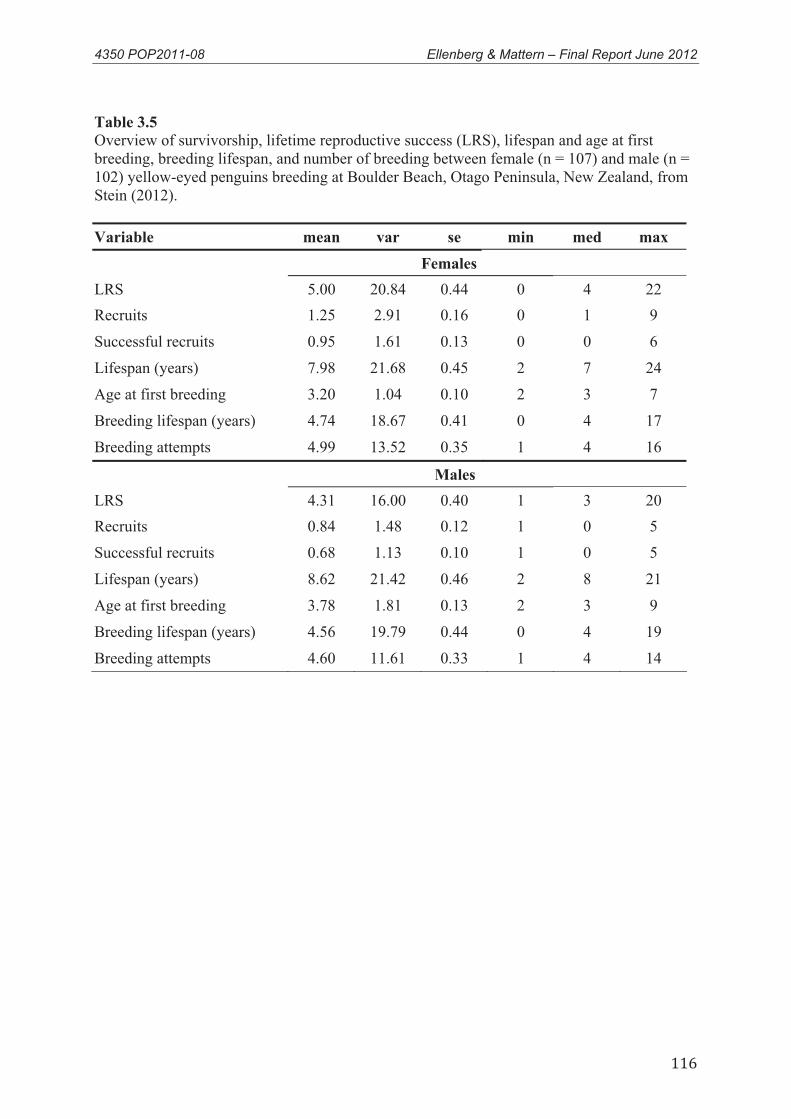
4350 POP2011-08 Ellenberg & Mattern – Final Report June 2012
���
Table 3.5Overview of survivorship, lifetime reproductive success (LRS), lifespan and age at first breeding, breeding lifespan, and number of breeding between female (n = 107) and male (n = 102) yellow-eyed penguins breeding at Boulder Beach, Otago Peninsula, New Zealand, fromStein (2012).
Variable mean var se min med max Females
LRS 5.00 20.84 0.44 0 4 22 Recruits 1.25 2.91 0.16 0 1 9
Successful recruits 0.95 1.61 0.13 0 0 6
Lifespan (years) 7.98 21.68 0.45 2 7 24
Age at first breeding 3.20 1.04 0.10 2 3 7
Breeding lifespan (years) 4.74 18.67 0.41 0 4 17
Breeding attempts 4.99 13.52 0.35 1 4 16
MalesLRS 4.31 16.00 0.40 1 3 20 Recruits 0.84 1.48 0.12 1 0 5
Successful recruits 0.68 1.13 0.10 1 0 5
Lifespan (years) 8.62 21.42 0.46 2 8 21
Age at first breeding 3.78 1.81 0.13 2 3 9
Breeding lifespan (years) 4.56 19.79 0.44 0 4 19
Breeding attempts 4.60 11.61 0.33 1 4 14

4350 POP2011-08 Ellenberg & Mattern – Final Report June 2012
���
Table 4.1a Foraging parameters of yellow-eyed penguins determined during the incubation stage of breeding.
Otago Peninsula 1988/89 1991/92 1992/93 1993/94 1994/95 Foraging Parameters No of Birds (n) 130 13 14 17 11
Trip duration (h) 33.6±9.6 64.9±41.2 27.3±23.3 42.0±31.1 57.8±40.5
Foraging range (km) - 26.3±11.3 16.9±9.8 - - Distance travelled (km) - - - - - Diving Parameters No of Birds (n) 24 - - - - Number of dives per trip - - - - - Proportion of benthic dives (%) - - - - - Mean dive duration (s) - - - - - Mean dive distance (m) - - - - - Max depth reached (m) 34±8 - - - - Foraging effort - - - - - Reference (1) (2) (2) (2) (2)
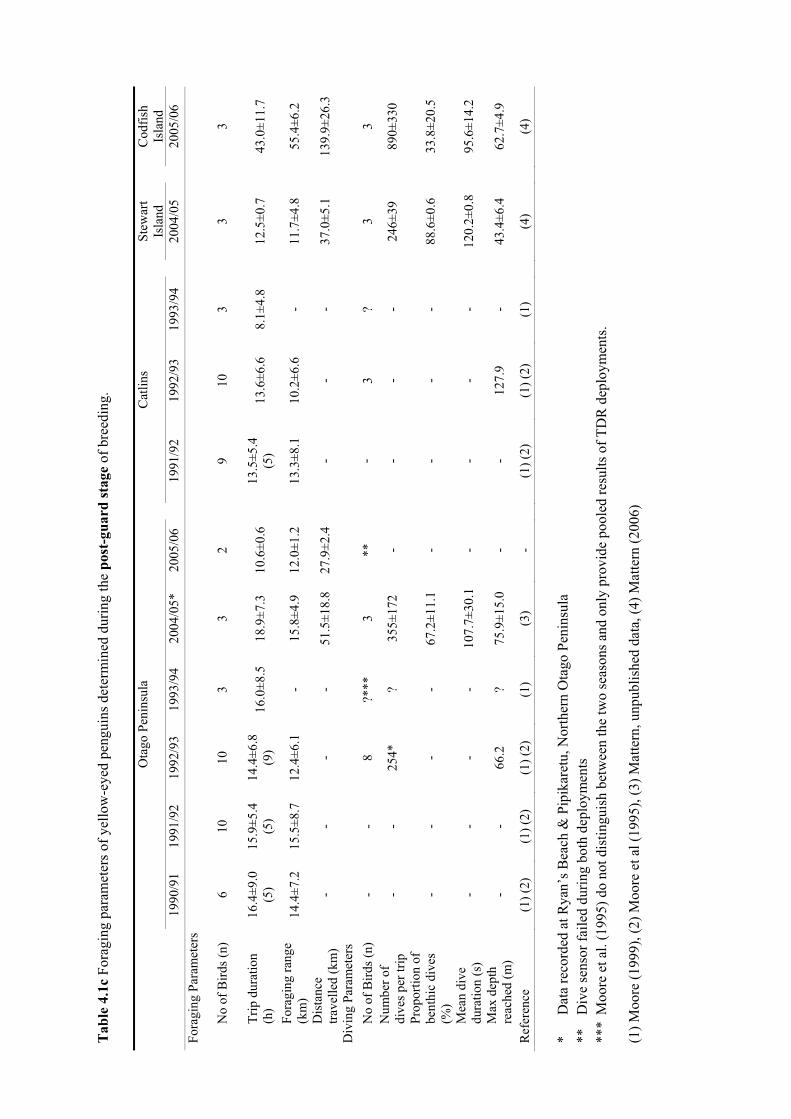
Tab
le 4
.1c
Fora
ging
par
amet
ers o
f yel
low
-eye
d pe
ngui
ns d
eter
min
ed d
urin
g th
e po
st-g
uard
stag
eof
bre
edin
g.
*D
ata
reco
rded
at R
yan’
s Bea
ch &
Pip
ikar
etu,
Nor
ther
n O
tago
Pen
insu
la**
Div
e se
nsor
faile
d du
ring
both
dep
loym
ents
***
Moo
re e
t al.
(199
5) d
o no
t dis
tingu
ish
betw
een
the
two
seas
ons a
nd o
nly
prov
ide
pool
ed re
sults
of T
DR
dep
loym
ents
.
(1) M
oore
(199
9), (
2) M
oore
et a
l (19
95),
(3) M
atte
rn, u
npub
lishe
d da
ta, (
4) M
atte
rn (2
006)
Ota
go P
enin
sula
Cat
lins
Stew
art
Isla
ndC
odfis
h Is
land
1990
/91
1991
/92
1992
/93
1993
/94
2004
/05*
2005
/06
1991
/92
1992
/93
1993
/94
2004
/05
2005
/06
Fora
ging
Par
amet
ers
No
of B
irds (
n)6
1010
33
29
103
33
Trip
dur
atio
n (h
)16
.4±9
.0(5
)15
.9±5
.4(5
)14
.4±6
.8(9
)16
.0±8
.518
.9±7
.310
.6±0
.613
.5±5
.4(5
)13
.6±6
.68.
1±4.
812
.5±0
.743
.0±1
1.7
Fora
ging
rang
e (k
m)
14.4
±7.2
15.5
±8.7
12.4
±6.1
-15
.8±4
.912
.0±1
.213
.3±8
.110
.2±6
.6-
11.7
±4.8
55.4
±6.2
Dis
tanc
e tra
velle
d (k
m)
--
--
51.5
±18.
827
.9±2
.4-
--
37.0
±5.1
139.
9±26
.3
Div
ing
Para
met
ers
No
of B
irds (
n)-
-8
?***
3**
-3
?3
3N
umbe
r of
dive
s per
trip
--
254*
?35
5±17
2-
--
-24
6±39
890±
330
Prop
ortio
n of
be
nthi
c di
ves
(%)
--
--
67.2
±11.
1-
--
-88
.6±0
.633
.8±2
0.5
Mea
n di
ve
dura
tion
(s)
--
--
107.
7±30
.1-
--
-12
0.2±
0.8
95.6
±14.
2
Max
dep
th
reac
hed
(m)
--
66.2
?75
.9±1
5.0
--
127.
9-
43.4
±6.4
62.7
±4.9
Ref
eren
ce(1
) (2)
(1) (
2)(1
) (2)
(1)
(3)
-(1
) (2)
(1) (
2)(1
)(4
)(4
)

Tab
le 4
.1b
Fora
ging
par
amet
ers o
f yel
low
-eye
d pe
ngui
ns d
eter
min
ed d
urin
g th
e ch
ick-
guar
dst
age
of b
reed
ing.
*D
ive
sens
or fa
iled
durin
g se
cond
dep
loym
ent;
dive
par
amet
ers r
epre
sent
the
indi
vidu
al m
eans
for b
ird 1
4647
whi
ch u
nder
took
thre
efor
agin
g tri
ps w
hile
fit
ted
with
GPS
logg
er.T
he b
ird’s
trip
s wer
e re
ason
ably
shor
t (m
ean
fora
ging
rang
e: 1
3.0±
4.2k
m, d
ista
nce
trave
lled:
38.
4±21
.6km
, trip
dur
atio
n: 7
.9±4
.2
hrs)
.**
Com
bine
d da
ta o
f eve
ning
(trip
dur
atio
n <5
hrs
) and
full
one-
day
trips
(>9
hour
s) o
f yel
low
-eye
d pe
ngui
ns e
quip
ped
with
GPS
Log
ger (
n=4
bird
s) a
nd T
DR
de
ploy
men
ts (n
=3 b
irds)
. See
Mat
tern
et a
l (20
07)f
or d
etai
ls o
n tri
p ty
pes.
No
even
ing
trips
wer
e ob
serv
ed in
200
4/05
.
(1) M
oore
(199
9), (
2) M
atte
rn e
t al (
2007
), (3
) Mat
tern
, unp
ublis
hed
data
, (4)
Mat
tern
(200
6)
Ota
go P
enin
sula
Nor
th O
tago
Stew
art I
slan
dC
odfis
h Is
land
1991
/92
1992
/93
1993
/94
2004
/05
2005
/06
2003
/04*
*20
04/0
520
05/0
620
06/0
720
05/0
620
06/0
7Fo
ragi
ng P
aram
eter
s
No
of B
irds (
n)52
5326
82
44
46
69
Trip
dur
atio
n (h
)14
.4±1
7.0
13.3
±5.9
12.8
±7.9
16.9
±5.5
9.4±
6.4
8.0±
4.5
(7)
12.9
±1.2
8.9±
2.3
8.7±
2.5
17.1
±2.4
22.2
±12.
0
Fora
ging
rang
e (k
m)
-15
.4±6
.915
.6±6
.325
.8±4
.39.
9±6.
912
.2±6
.918
.2±1
.19.
1±5.
110
.9±1
.624
.3±4
.834
.2±1
8.3
Dis
tanc
e tra
velle
d (k
m)
--
-63
.0±1
0.6
31.1
±23.
131
.5±1
8.0
46.0
±3.0
29.5
±1.0
31.4
±9.5
66.9
±9.5
87.4
±47.
3
Div
ing
Para
met
ers
No
of B
irds (
n)-
--
91*
75
46
69
Num
ber o
f di
ves p
er tr
ip-
--
282±
8621
8±11
6.3
180.
9±79
.428
6±66
187±
7218
0±74
351±
7752
0±36
5
Prop
ortio
n of
be
nthi
c di
ves
(%)
--
-57
.8±7
.840
.2±1
3.1
80.3
±11.
191
.5±2
.175
.0±3
.778
.1±8
.763
.4±1
4.7
47.8
±16.
1
Mea
n di
ve
dura
tion
(s)
--
-11
0±13
71.9
±12.
010
0.0±
14.4
112.
6±13
.512
8.1±
7.2
103.
3±6.
811
4.9
95.0
±18.
3
Max
dep
th
reac
hed
(m)
--
-71
.4±1
2.4
71.9
±12.
020
.3±4
.438
.4±8
.237
.6±2
0.9
45.8
±8.6
63.4
±2.7
64.3
±3.5
Ref
eren
ce(1
)(1
)(1
)(3
)(3
)(2
)(3)
(2) (
3)(3
) (4)
(3)
(3) (
4)(3
)

Tab
le 4
.2D
iet c
ompo
sitio
n of
yel
low
-eye
d pe
ngui
ns.%
FO d
escr
ibes
the
freq
uenc
y of
occ
urre
nce
of p
rey
spec
ies i
n al
l sam
ples
. % W
eigh
t giv
es th
e ca
lcul
ated
av
erag
e m
ass c
ontri
butio
n of
a p
rey
spec
ies t
o th
e m
ean
mea
l siz
e.
*ju
veni
le st
ages
are
also
pel
agic
**O
ften
over
look
ed is
the
diel
ver
tical
mig
ratio
n of
squi
d in
whi
ch th
e an
imal
s des
cend
to g
reat
er d
epth
s dur
ing
the
day.
Ove
r the
con
tinen
tal s
helf
this
brin
gsth
em in
to th
e de
mer
sal z
one
(Rop
er &
You
ng 1
975)
(1) v
an H
eezi
k (1
990)
, (2)
Moo
re &
Wak
elin
(199
7), (
3) v
an H
eezi
k (1
990b
), (4
) Bro
wne
et a
l(20
11)
Prey
spec
ies
Hab
itat
Ota
goC
odfis
h Is
land
Stew
art I
slan
d19
84-1
986
1991
-199
319
8820
06/0
720
06/0
7n=
512
n=19
8n=
22n=
17n=
8%
FO
%W
eigh
t%
FO
%W
eigh
t%
FO
%W
eigh
t%
FO
%W
eigh
t%
FO
%W
eigh
tR
ed c
od
Pseu
doph
ycis
bac
hus
dem
ersa
l*47
3645
.57.
486
<1-
--
-
Opa
lfish
Hem
eroc
oete
s spp
.de
mer
sal
4422
78.3
27.6
4520
5027
.5-
-
Arr
ow sq
uid
Not
otod
arus
sl
oani
pela
gic-
ocea
nic*
*47
959
.614
.436
<120
0.9
--
Spra
t Sp
rattu
s ant
ipod
umpe
lagi
c-ne
ritic
6712
34.8
2.2
<1<1
101.
5-
-
Ahu
ru
Auch
enoc
eros
pun
ctat
uspe
lagi
c-oc
eani
c17
713
.64.
810
0<1
--
--
Blu
e co
d Pa
rape
rcis
colia
sde
mer
sal
62
54.5
18.3
5077
7070
100
99.2
Silv
ersi
deAr
gent
inas
elo
ngat
ade
mer
sal
156
40.9
10.0
<1<1
--
--
Jock
Ste
war
t Hel
icol
enus
pe
rcoi
des
dem
ersa
l-
--
--
-10
<1-
-
Tara
kihi
N
emad
acty
lus m
acro
pter
usde
mer
sal
39.4
2.3
--
--
330.
8
Ref
eren
ce(1
)(2
)(3
)(4
)(4
)

4350 POP2011-08 Ellenberg & Mattern – Final Report June 2012
��!
Table 5.1 Yellow-eyed penguin bycatch observed during 2005-2010 in the inshore fishing fleet observer programme along the Southeast coast (SEC, Fisheries Management Area FMA 3) and the South coast (SOU, FMA 5) of the New Zealand South Island. Observer coverage refers to the entire FMA and reports do not specify as to how frequently vessels operated within 50km of important penguin breeding areas. However, observer coverage has been reported as “spatially limited” (Ramm 2012). For the last two years 2010/11 and 2011/12 data from the inshore fishing fleet observer programme are not yet available.
FMA / Season ObserverCoverage
Observedpenguinbycatch
Reference
SEC, FMA 3 2005/2006 0.43% 0 Rowe (2009)
2006/2007 0.88% 0 Rowe (2009)
2007/2008 6.84% 0 Rowe (2010)
2008/2009 21.48% 4 Ramm (2010)
2009/2010 18.14% 1 Ramm (2012)
Total 9.55% 5
SOU, FMA 5 2005/2006 5.20% 0 Rowe (2009)
2006/2007 10.87% 2 Rowe (2009)
2007/2008 25.04% 1 Rowe (2010)
2008/2009 23.96% 1 Ramm (2010)
2009/2010 18.14% 0 Ramm (2012)
Total 18.55% 4

4350 POP2011-08 Ellenberg & Mattern – Final Report June 2012
��"
Figure captions
Figure 1.1 Map of the current global distribution of yellow-eyed penguins Megadyptes
antipodes. Inserts show in more detail the distribution of the mainland
population in four distinct breeding regions on the New Zealand South Island
(Banks Peninsula, North Otago, Otago Peninsula, and the Catlins).
Figure 1.2 Map of the current global distribution of yellow-eyed penguins Megadyptes
antipodes. Inserts show in more detail the distribution of the mainland
population on Stewart Island and outliers, as well as the sub-Antarctic
populations on Campbell Island, based on landing sites found in 1988 and
1992 (adapted from Moore et al. 2001), and on the Auckland Island group
(adapted from Moore 1992 and Beer 2010).
Figure 2.1 Estimated number of yellow-eyed penguin breeding pairs in Otago, including
all known breeding locations in North Otago, Otago Peninsula and the Catlins,
southeast coast of the New Zealand South Island 1980-2010; numbers contain
best guesses for breeding areas that have not been searched during a particular
season (data provided by the Department of Conservation, Coastal Otago Area
Office).
Figure 2.2 Mean number of Yellow-eyed penguin nests per mainland breeding location
searched (Otago, New Zealand South Island, black dots) and number of
locations searched each breeding season (grey bars). A linear trend line
including 95% Confidence Intervals illustrates large fluctuations of breeding
pairs between seasons. The data has been extracted from the Yellow-eyed
penguin database managed by the Department of Conservation, NZ (adapted
from Seddon et al. in press – and updated).

4350 POP2011-08 Ellenberg & Mattern – Final Report June 2012
���
Figure 2.3 Number of yellow-eyed penguin breeding pairs observed 1992-2011 in (a) all
eight breeding areas in North Otago, New Zealand South Island (b) two
intensely managed colonies in North Otago, New Zealand South Island (c) six
remaining less intensely managed colonies in North Otago, New Zealand
South Island; solid line depicts linear regression analysis of population trends,
dashed lines are 95% confidence intervals (data provided by the Department of
Conservation, Coastal Otago Area Office; Appendix I).
Figure 2.4 Number of yellow-eyed penguin breeding pairs observed 1992-2011 on the
Otago Peninsula, New Zealand South Island, in ten breeding areas that were
considered to provide the most reliable and consistent nest count data; solid
line depicts linear regression analysis of population trends, dashed lines are
95% confidence intervals (data provided by the Department of Conservation,
Coastal Otago Area Office; Appendix I).
Figure 2.5 Number of yellow-eyed penguin breeding pairs observed 1992-2011 in the
Catlins, New Zealand South Island, in five breeding areas that were considered
to provide the most reliable and consistent nest count data; solid line depicts
linear regression analysis of population trends, dashed lines are 95%
confidence intervals. Additionally, the results of the complete Catlins census
established in 1997 to take place about every five years has been included into
the figure. (Data provided by the Department of Conservation, Coastal Otago
Area Office; Appendix I).
Figure 3.1 Bar plot displaying frequencies of the number of chicks fledged in their
lifetime (LRS) by female (n = 107) and male (n = 102) yellow-eyed penguins
breeding at Boulder Beach, Otago Peninsula, New Zealand, from Stein (2012).

4350 POP2011-08 Ellenberg & Mattern – Final Report June 2012
���
Figure 4.1 Benthic diving behaviour in Yellow-eyed penguins. The three graphs show the
dive profiles of all dives performed during a single foraging trip (upper graph),
a section of about 30 minutes (centre graph), and the profile of an individual
dive (lower graph). The red shaded areas in the upper and centre graph indicate
temporal position of the lower graph’s dive. Note the single mid-water dive
(fourth dive) in the centre graph.
Figure 4.2 Foraging ranges of Yellow-eyed penguins determined via VHF telemetry (blue
polygons; Moore et al. 1995, Moore 1999) and GPS logger deployments (green
polygons, Mattern et al. 2007, Mattern unpublished data).
Figure 4.3 Estimated foraging ranges of Yellow-eyed penguins.

Kaikai Beach
Green Island
Otago Harbour
Blueskin Bay
0 6 12 Km
Otago Peninsula
Nugget Point
Long Point
Slope Point
Mahaka Point
Curio Bay
Catlins
0 10 20 Km5
Flea Bay
Goughs Bay
0 10 Km
Auckland Islands
Campbell Island
Stewart Island
Catlins
Otago Peninsula
North Otago
Banks Peninsula
(Kaikoura?)
North Otago Waitaki River
Bushy Beach
Bobbys Head
Kaitiki Point
Moeraki
0 20 40 Km10
Waianakarua

Auckland Islands
Campbell Island
Stewart Island
Catlins
Otago Peninsula
North Otago
Banks Peninsula
(Kaikoura?)
Enderby Island
Adams Island
Port Ross
Carnley Harbour
Auckland Island
0 10 20 Km5
Campbell Island
North East Harbour
Perseverance Harbour
South West Harbour
Monument Harbour
North West Bay
Rocky Bay
Antarctic Bay
0 5 10 Km2.5
Port Pegasus
Codfish Island
Patterson Inlet
Anglem Coast
Mason
Bay
Stewart Island
0 20 40 Km10

Yel
low
-eye
d pe
ngui
n br
eedi
ng p
airs
100
200
300
400
500
600
700
breeding season
1995/96 2000/01 2005/06 2010/111980/81 1985/86 1990/91
Figure 2.1

breeding season1985 1990 1995 2000 2005 2010
mea
n nu
mbe
r of n
ests
per
loca
tion
4
6
8
10
12
14
16
18
num
ber o
f loc
atio
ns m
onito
red
0
20
40
60
80
100
120
140
160
Figure 2.2
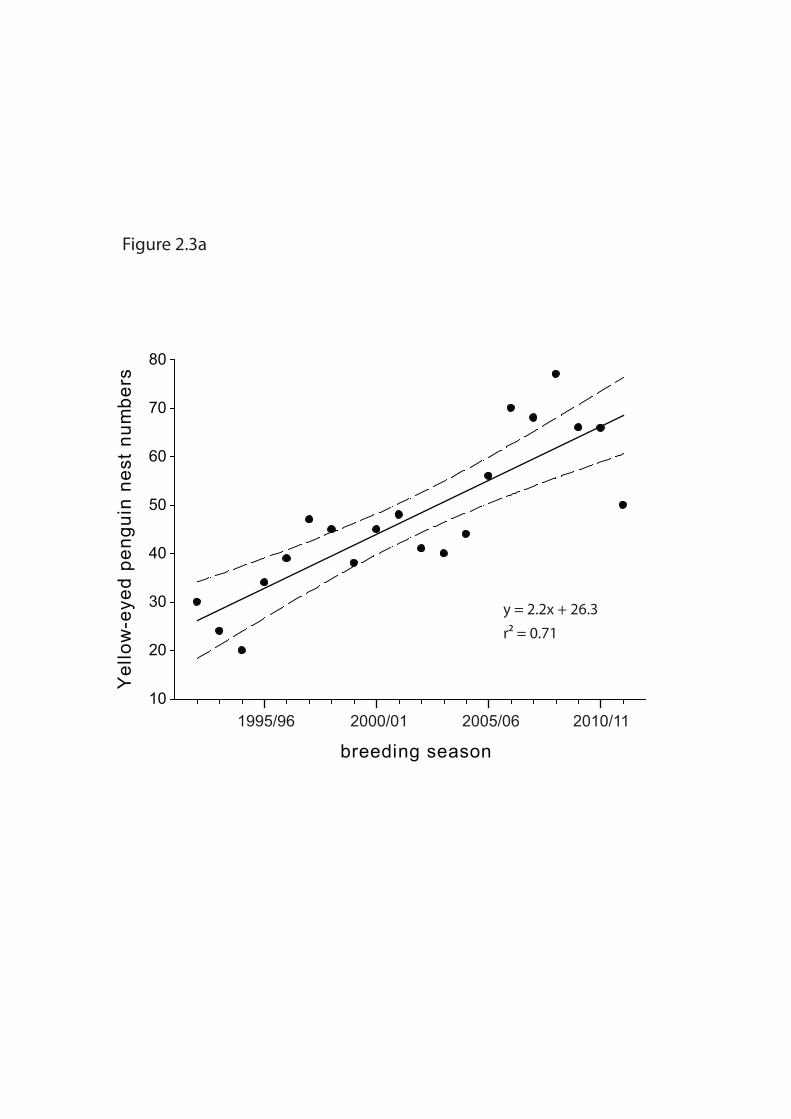
breeding season
Yel
low
-eye
d pe
ngui
n ne
st n
umbe
rs
10
20
30
40
50
60
70
80
y = 2.2x + 26.3r2 = 0.71
1995/96 2000/01 2005/06 2010/11
Figure 2.3a

breeding season
Yel
low
-eye
d pe
ngui
n ne
st n
umbe
rs
y = 2.2x + 6.6r2 = 0.87
1995/96 2000/01 2005/06 2010/110
10
20
30
40
50
60
Figure 2.3b

breeding season
Yel
low
-eye
d pe
ngui
n ne
st n
umbe
rs
1995/96 2000/01 2005/06 2010/118
10
12
14
16
18
20
22
24
26
28
Figure 2.3c

breeding season
Yel
low
-eye
d pe
ngui
n ne
st n
umbe
rs
y = -3.54x + 195r2 = 0.28
1995/96 2000/01 2005/06 2010/1180
100
120
140
160
180
200
220
240
260
Figure 2.4

breeding season
Yel
low
-eye
d pe
ngui
n ne
st n
umbe
rs
y = 1.19x + 88r2 = 0.10
1995/96 2000/01 2005/06 2010/11
y = -2.1x + 242r2 = 0.41
40
60
80
100
120
140
160
180
200
220
240
260
Figure 2.5

Figure 3.2

110
BENTHIC DIVE
0 20 40 60 80 100 120 140-50
-40
-30
-20
-10
0
Dep
th (m
)
-50
0
Dep
th (m
)
13:59:4513:36:5713:21:0213:02:3912:43:5212:29:48
-40
-20
0
06:17:55 17:46:00
Dep
th (m
)Figure 4.1

1000
m
500m
200m
150m
Long Point
Bushy Beach
Ryans Beach/Pipikaretu
Boulder Beach Complex
Golden BeachRollers Beach
Codfish Is
0 25 50Kilometers
Stewart Island
Otago Peninsula
Catlins
Figure 4.2

1000
m
500m200m
500m
200m
150m
Auckland Is.
Campbell Is.
Stewart Is
Banks Peninsula
Otago PeninsulaCatlins
Non-breeding periodForaging ranges limited by 150m contour. Principally juveniles/young breeders.
Foraging ranges limited by 150m contour, maximum foraging radius 20km from nest
Chick-guard
Incubation & Post-guardForaging ranges limited by 150m contour, max. foraging radius 50km from nest
Home Ranges (VHF)Yellow-eyed enguin ranges recorded at individual sites between 1991 and 1993
Home Ranges (GPS)Yellow-eyed enguin ranges recorded at individual sites between 2003 and 2007
Figure 4.3

App
endi
x I -
pag
e 1
Yel
low
-eye
d pe
ngui
n ne
st n
umbe
rs in
Ota
go, N
ew Z
eala
nd S
outh
Isla
nd, d
urin
g th
e br
eedi
ng s
easo
ns 1
992/
93-2
011/
12
at a
sel
ectio
n of
bre
edin
g si
tes
that
hav
e be
en m
onito
red
with
reas
onab
ly c
ompa
rabl
e ef
fort
and
nest
sea
rch
expe
rienc
e co
nsis
tent
ly o
ver 2
0 ye
ars
(Thi
s ne
st s
umm
ary
spre
adsh
eet i
s m
aint
aine
d by
the
Dep
artm
ent o
f Con
serv
atio
n C
oast
al O
tago
Are
a O
ffice
)
Bre
edin
g A
rea
1992
/93
1993
/94
1994
/95
1995
/96
1996
/97
1997
/98
1998
/99
1999
/00
Bus
hy B
each
34
36
78
85
Bea
ch R
oad
21
00
11
20
Wai
anak
arua
Blu
ff2
31
34
53
5B
arra
cout
a B
ay9
89
1213
1314
12K
atik
i Poi
nt1
11
43
77
7K
atik
i Bea
ch7
21
33
33
2S
hag
Poi
nt1
22
22
45
4Ta
vora
(Bob
bys
Hea
d)5
33
46
63
3O
mih
i4
44
44
54
4P
ipik
aret
u B
each
2625
2632
3736
3522
Rya
ns B
each
2016
2125
3434
2721
Oki
a12
711
1217
1515
8O
tapa
hi5
68
511
1817
19S
andf
ly B
ay15
1316
2324
2219
19D
oubl
e B
ay14
1819
2528
1717
15M
id-s
ectio
n21
2426
3743
3940
35A
111
1312
1425
2219
22H
ighc
liff
1618
1720
2526
2422
Nug
get P
oint
108
1010
2513
147
Ow
aka
Hea
ds7
78
1111
178
15P
engu
in B
ay14
1615
1722
1622
19H
inah
ina
Cov
e14
512
1321
1210
9Lo
ng P
oint
3236
3842
4748
3918
Otago Peninsula
(10 of 21 considered reliable)
Catlins
(5 of 24)
North Otago
(all breeding areas)

App
endi
x I -
pag
e 2
Yel
low
-eye
d pe
ngui
n ne
st n
umbe
rs in
Ota
go, N
ew Z
eala
nd S
outh
Isla
nd, d
urin
g th
e br
eedi
ng s
easo
ns 1
992/
93-2
011/
12
at a
sel
ectio
n of
bre
edin
g si
tes
that
hav
e be
en m
onito
red
with
reas
onab
ly c
ompa
rabl
e ef
fort
and
nest
sea
rch
expe
rienc
e co
nsis
tent
ly o
ver 2
0 ye
ars
(Thi
s ne
st s
umm
ary
spre
adsh
eet i
s m
aint
aine
d by
the
Dep
artm
ent o
f Con
serv
atio
n C
oast
al O
tago
Are
a O
ffice
)
Bre
edin
g A
rea
2000
/01
2001
/02
2002
/03
2003
/04
2004
/05
2005
/06
2006
/07
2007
/08
Bus
hy B
each
66
77
710
1112
Bea
ch R
oad
11
11
11
11
Wai
anak
arua
Blu
ff4
35
45
42
3B
arra
cout
a B
ay12
1512
1110
1318
18K
atik
i Poi
nt11
1210
1214
2125
26K
atik
i Bea
ch3
12
24
33
1S
hag
Poi
nt3
71
02
17
5Ta
vora
(Bob
bys
Hea
d)5
33
31
33
2O
mih
i4
54
12
32
4P
ipik
aret
u B
each
2732
1918
1522
1920
Rya
ns B
each
2026
2211
38
77
Oki
a4
108
106
914
17O
tapa
hi19
2420
2120
2218
22S
andf
ly B
ay12
169
1010
129
8D
oubl
e B
ay14
1613
1816
1419
14M
id-s
ectio
n31
3115
1313
1621
16A
115
159
1314
1218
16H
ighc
liff
2220
1516
1514
1616
Nug
get P
oint
923
1314
109.
512
15O
wak
a H
eads
813
94
48
57
Pen
guin
Bay
2324
1716
1418
2026
Hin
ahin
a C
ove
912
97
89
1418
Long
Poi
nt18
5131
2625
2527
39
Catlins
(5 of 24)
North Otago
(all breeding areas)
Otago Peninsula
(10 of 21 considered reliable)

App
endi
x I -
pag
e 3
Yel
low
-eye
d pe
ngui
n ne
st n
umbe
rs in
Ota
go, N
ew Z
eala
nd S
outh
Isla
nd, d
urin
g th
e br
eedi
ng s
easo
ns 1
992/
93-2
011/
12
at a
sel
ectio
n of
bre
edin
g si
tes
that
hav
e be
en m
onito
red
with
reas
onab
ly c
ompa
rabl
e ef
fort
and
nest
sea
rch
expe
rienc
e co
nsis
tent
ly o
ver 2
0 ye
ars
(Thi
s ne
st s
umm
ary
spre
adsh
eet i
s m
aint
aine
d by
the
Dep
artm
ent o
f Con
serv
atio
n C
oast
al O
tago
Are
a O
ffice
)
Bre
edin
g A
rea
2008
/09
2009
/10
2010
/11
2011
/12
data
relia
bilit
y?B
ushy
Bea
ch9
67
5da
ta tr
ustw
orth
y - i
nclu
de in
to a
naly
sis
Bea
ch R
oad
21
00
data
trus
twor
thy
- inc
lude
into
ana
lysi
sW
aian
akar
ua B
luff
64
32
data
trus
twor
thy
- inc
lude
into
ana
lysi
sB
arra
cout
a B
ay22
2323
22da
ta tr
ustw
orth
y - i
nclu
de in
to a
naly
sis
Kat
iki P
oint
3026
2718
data
trus
twor
thy
- inc
lude
into
ana
lysi
sK
atik
i Bea
ch2
11
1da
ta tr
ustw
orth
y - i
nclu
de in
to a
naly
sis
Sha
g P
oint
52
1.9
0da
ta tr
ustw
orth
y - i
nclu
de in
to a
naly
sis
Tavo
ra (B
obby
s H
ead)
13
32
data
trus
twor
thy
- inc
lude
into
ana
lysi
sO
mih
i6
56
4da
ta tr
ustw
orth
y - i
nclu
de in
to a
naly
sis
Pip
ikar
etu
Bea
ch26
1215
10da
ta tr
ustw
orth
y - i
nclu
de in
to a
naly
sis
Rya
ns B
each
109
64
data
trus
twor
thy
- inc
lude
into
ana
lysi
sO
kia
1714
1612
data
trus
twor
thy
- inc
lude
into
ana
lysi
sO
tapa
hi31
2223
18da
ta tr
ustw
orth
y - i
nclu
de in
to a
naly
sis
San
dfly
Bay
158
108
data
trus
twor
thy
- inc
lude
into
ana
lysi
sD
oubl
e B
ay17
1211
10da
ta tr
ustw
orth
y - i
nclu
de in
to a
naly
sis
Mid
-sec
tion
1816
1916
data
trus
twor
thy
- inc
lude
into
ana
lysi
sA
116
1210
9da
ta tr
ustw
orth
y - i
nclu
de in
to a
naly
sis
Hig
hclif
f18
2119
17da
ta tr
ustw
orth
y - i
nclu
de in
to a
naly
sis
Nug
get P
oint
2124
1622
data
+- (
som
e is
sues
) tru
stw
orth
y - i
nclu
de in
to a
naly
sis
Ow
aka
Hea
ds9
68
8da
ta +
- (so
me
issu
es) t
rust
wor
thy
- inc
lude
into
ana
lysi
sP
engu
in B
ay29
3032
19da
ta +
- (so
me
issu
es) t
rust
wor
thy
- inc
lude
into
ana
lysi
sH
inah
ina
Cov
e16
1318
12da
ta +
- (so
me
issu
es) t
rust
wor
thy
- inc
lude
into
ana
lysi
sLo
ng P
oint
4739
4949
data
+- (
som
e is
sues
) tru
stw
orth
y - i
nclu
de in
to a
naly
sis
North Otago
(all breeding areas)
Otago Peninsula
(10 of 21 considered reliable)
Catlins
(5 of 24)