yell uk steve chambers, chief commercial officer
TRANSCRIPT
YELL UK
Steve Chambers, Chief Commercial Officer
Disclaimer
During this presentation we will be discussing Yell’s business outlook and making certain forward-looking statements. Any statements that are not historical facts are subject to a number of risks and uncertainties, and actual results may differ materially.
We urge you to read the Risk Factors and cautionary language in our annual report on Form 20-F filed with the SEC on 8 June, 2004. We also draw your attention to our interim press release and SEC filing on Form 6-K which is posted on our web site, for more information on the risks and uncertainties.

3
End to End Marketing and Sales Process
CustomerStrategy
Sales Channel
ApproachCustomer
AdvertiserDevelopment
SalesForce
Management
UserDevelopment
Simple, Focused Strategy and Execution

4
Competing for the SME £
Yell thrives through building relationships with SMEs based on delivering better value than competitive media
Online
Consumer magazines
Local press
Directories
Nationalpress
Businessmagazines
118 / voice market
CUSTOMERS

5
Source: Saville Rossiter-Base and Yell Group (April 2003-March 2004)
Delivering Value to UK SMEs
FY 2004
Total annual uses 1.2bn
Uses resulting in leads 930m
Leads resulting in sales 528m
Average spend per sale £166
Resulting annual revenue £88bn
9 out of 10 of our advertisers say we are good value for money
6
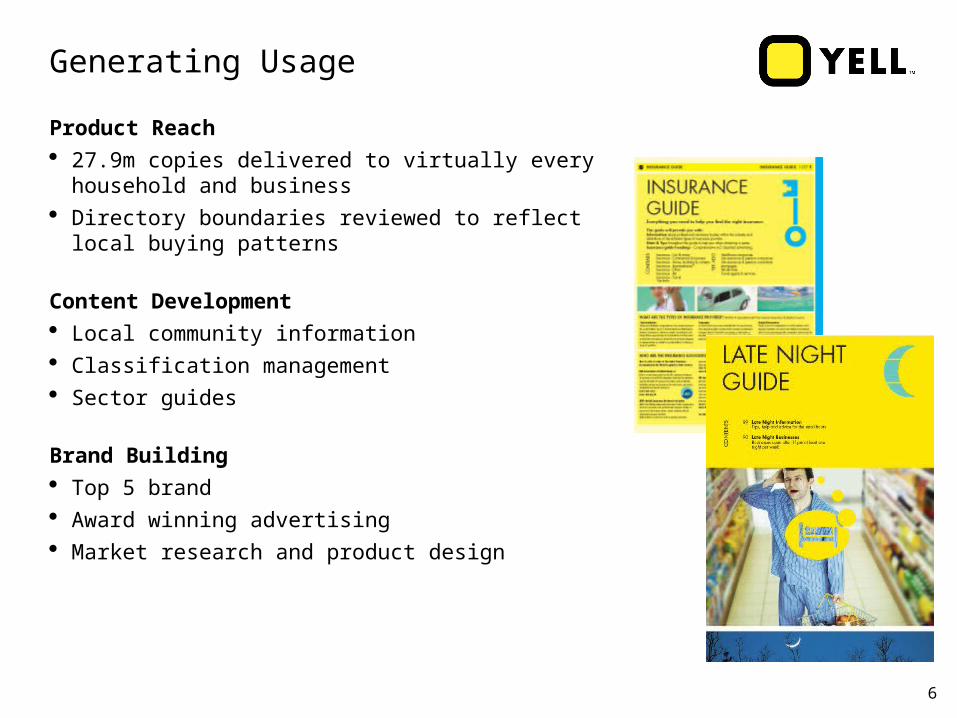
Generating Usage
Product Reach 27.9m copies delivered to virtually every
household and business Directory boundaries reviewed to reflect local
buying patterns
Content Development Local community information Classification management Sector guides
Brand Building Top 5 brand Award winning advertising Market research and product design

7
422
710
1291
Year 1 Year 2 Year 3plus
378418 438 451
480
2000 2001 2002 2003 2004
Revenue Drivers
Win Keep Grow
Price Product Rescoping Colour Communications
Sales Channel
UK Directories Turnover Growth
(£m)
UK Directories Unique Advertisers
(000s)
Growth In Average Turnover Per Unique
Advertiser Over 3 Years (£)
496 518 541574 594
2000 2001 2002 2003 2004

8
Using Price to Win New Advertisers
Segmented PricingMove InFirst Steps
50% Discount
40% Discount
No Offer
40% Discount
No Offer
Deep Discount
Incentive Offer

9
Colour
Yellow Pages users are 6 times more likely to choose a colour ad than a mono ad
Colour advertisers claim their new Yellow Pages ad has helped increased enquiries by 42% since the previous year
Source: Insight Report 9318 – “Directory Colour Performance by Edition Accounting Cycle”
% Ad Penetration
Average % Premium
Jan 02 Jul 02 Jan 03 Jul 03 Jan 04 Jul 04
Ad Penetration
Average Colour Premium

10
Yellow Pages Directory Rescopes:
Pre 1997 Directory Areas
Post 1997 Directory Areas
Non Rescoped Directory Areas
Directory Rescoping

11
Rescoping Adding Value for Users and Advertisers
User-driven process
Lower entry price for new advertisers
Same price for same coverage for existing advertisers
Positive user perception
Growth in advertiser acquisition
Improved First Year Retention and buy-up

12
Publication
Market Approach
Campaign-based, multi book approach. Year round service for National advertisers
Campaign duration – 6 months Fieldsales, 2 months Telesales
Multi-product sale. Specialist Telesales sell additional products outside main campaign
Automated Market Planning to optimise local opportunities
P
P P
P
Jan Feb Mar Apr May Jun Jul Aug Sep Oct Nov Dec Jan Feb Mar Apr May Jun Jul
Sales Campaign Brighton
Sales Campaign Portsmouth
P
PP

13
UK Sales
“These are amongst the highest satisfaction scores we have observed from over ten years of research – they are unrivalled and impressive showing service of the very highest level”
M.D. Critical Research Limited

14
Salesforce – Key Metrics
Telesales Field Sales National Sales
Key Purpose Advertiser acquisition
Keep and Grow existing accounts
High potential prospects
Key account management
Customer Allocation 37% 62% 1%
Headcount (inc. Managers)
643 1,151 114
Technology Desktop Laptop/Broadband Laptop/Broadband
Average Age 32 years 35 years 41 years
Average Service 3.5 years 4 years 11 years
Salesforce Churn 20% per annum 17% per annum 14% per annum
Over 1 million one on one sales contacts annually

15
Sales Automation – Adding Value at Point of Sale
Functionality Tele Field
Desktop and office-based connection
Laptop and home-based broadband connection
Workload management, reporting and forecasting
Comprehensive marketing information
Electronic sales presentation
Graphics package, automated visual request
Order / content capture

16
Sales Process and Sales Support
Defined, needs-based Sales
180,000 studio produced spec artwork
Customised Electronic Planning and Presentation
Mapping
Proven Value Data
RelationshipBuilding
Plan and Prepare
Conduct Business Review
Test Intention
Propose and Provide
SolutionsFinalise
Programme

Investor Relations: Jill Sherratt +44 (0)118 950 6984
www.yellgroup.com
Yell, Queens Walk, Oxford Road, Reading, Berkshire RG1 7PT
™Trade mark of Yell Limited