years together
TRANSCRIPT

5Years Together
SENKADAGALA FINANCE PLC
ANNUAL REPORT 2017/18


50 Years
Together
SENKADAGALA FINANCE PLC ANNUAL REPORT 2017/18


This year, Senkadagala Finance PLC celebrates a key milestone in its history –
50 years of dedicated enterprise as one of the most trusted, respected and
largest licensed financial institutions in the country. Innovative products
and services, an ever growing branch network, constant upgrades to IT and
system regimes together help deliver sustainable financial options to our loyal
customers – one of the Company’s greatest assets, whilst delivering optimal
value to all stakeholders.
50 years together…
S E N K A D A G A L A F I N A N C E P L C

About this Report
Report Structure
This is the Company’s second Integrated Report in which
its value creation story is exemplified with attention paid to
performance, strategy, the Company’s business model and
future outlook. In the Integrated Annual Report 2016/17,
the process of stakeholder identification led to an
examination of areas material to the Company and those that
need to be reported on. This year, the framework of reporting
is taken forward. The Integrated Annual Report 2017/18
will examine the Company’s value creation story in greater
depth and in turn indicate a maturing in reporting and overall
Company strategy.
The concepts and principles mentioned in the following
guides were used in the preparation of this Report where
applicable:
z Global Reporting Initiative (GRI) Sustainability Reporting
Guidelines G4 (2013) [www.globalreporting.org]
z The International Integrated Reporting Framework (2013)
[www.theiirc.org]
z The Smart Integrated Reporting MethodologyTM
[www.smart.lk]
Report Boundary
The focal points in this Report are the operations of
Senkadagala Finance PLC and its Subsidiaries, Senkadagala
Insurance Brokers (Pvt) Ltd. and Newest Capital Ltd. The
operations of the parent company and its subsidiaries
mentioned above are confined to Sri Lanka. There have not
been any significant changes to the scope and aspect of the
boundaries from previous reporting periods. There were also
no restatements of information provided in previous reports.
Compliance
The operations of Senkadagala Finance PLC from the
1 April 2017 to 31 March 2018 are communicated through
this Report. An annual reporting cycle for financial and
sustainability reporting is maintained and the sustainability
aspects are reported in accordance with the GRI G4
guidelines. The Company also abides by all other applicable
laws, rules, regulations, directions and standards while paying
attention to other guidelines for voluntary disclosures.
Queries
In the instance that any inquiry and/or further clarification has
to be made regarding the information contained in this Report
Please Contact:
The ESMS Planning Manager,
Senkadagala Finance PLC
2nd Floor
267, Galle Road
Colombo 3
Sri Lanka
Telephone: +94 11 230 1301
Fax: + 94 11 230 1937
Email: [email protected]

Contents
02ABOUT THIS REPORT
06HIGHLIGHTS
04ABOUT US
10CHAIRMAN’S MESSAGE
05GROUP STRUCTURE
14MANAGING DIRECTOR/
CEO’S REVIEW
18BUSINESS MODEL
Our Business Model 20
Operating Environment 22
Trusted Strategy 30
Stakeholder Engagement 33
Materiality 36
124FINANCIAL REPORTS
Annual Report of the Board of Directors of Senkadagala Finance PLC 126
Directors’ Statement on Internal Control over Financial Reporting 133
Independent Auditors’ Report 134
Income Statement 139
Statement of Other Comprehensive Income 140
Statement of Financial Position 141
Statement of Changes in Equity 143
Statement of Cash Flows 145
Notes to the Financial Statements 147
38VALUE CREATION AND
CAPITAL FORMATION
Financial Capital 40
Institutional Capital 51
Customer Capital 53
Employee Capital 60
Social and Environmental Capital 68
Shareholder and Investor Capital 70
222ANNEXES
Ten Year Summary 224
Key Ratios and Indicators 225
Branch/Service Centre Network 226
GRI Content Index 228
Notice of Meetings 232
Form of Proxy Enclosed
80STEWARDSHIP
Board of Directors’ Profiles 82
Corporate Governance 85
Report of the Audit Committee 102
Report of the Integrated Risk Management Committee 103
Report of the Remuneration Committee 104
Report of the Related Party Transactions Review Committee 105
Risk Management 107

SE
NK
AD
AG
AL
A F
INA
NC
E P
LC
AN
NU
AL
RE
PO
RT
20
17
/1
8
4
About Us
Vision
Our Vision is to be a leading financial institution in Sri Lanka
that delivers high quality services and achieves excellence
in all spheres of activity while being socially conscious,
at all times.
Mission
To provide a wide range of diversified financial services
and to acquire a portfolio of loanable funds that yields an
adequate return to our shareholders, whilst safeguarding
the interests of our depositors and other stakeholders.
About the Company
2018 marks the 50th Anniversary of Senkadagala Finance
PLC, a Company that first commenced operations in the city
of Kandy. Half a century since its inception the Company
has strategically expanded throughout the country and the
hundredth branch will be opened as a celebratory gesture
this year.
Since the Company was listed in the Diri Savi Board of the
Colombo Stock Exchange in March 2011, the Company has
also been recognised as one of the largest finance companies
in Sri Lanka. Today, Senkadagala Finance provides a gamut
of services such as finance leases, commercial loans and hire
purchases. The Company also accepts deposits in the form
of savings deposits, fixed deposits and certificates of deposit
in addition to providing pawn brokering and foreign currency
exchange services.
Furthermore, Senkadagala Insurance Brokers (Pvt) Ltd.
was incorporated in April 2012 with the view of expanding
operations further while Newest Capital Ltd., a specialised
leasing company was acquired in 2014. These have helped
the parent company widen the scope of its portfolio. As the
Company also constantly focuses on maintaining a healthy
asset quality while continuing to diversify its products and
services, the Company has been recognised by Fitch Ratings
Lanka Ltd. which affirmed the BBB+ (lka) credit rating of
the Company.
The Registered Office of the Company is situated at 2nd Floor,
No. 267, Galle Road, Colombo 03.

AN
NU
AL
RE
PO
RT
20
17
/1
8 S
EN
KA
DA
GA
LA
FIN
AN
CE
PL
C
5
Group Structure
Relationship : Subsidiary
Holding : 100%
Date of incorporation : 27 December 2011
Joined the Group on : 25 August 2014
Principal line of business : Investment Activities
Registered address : No. 267, Galle Road, Colombo 3
Board of Directors : Mr L Balasuriya
Dr A Balasuriya
Ms L Fernando
Dr P Ramanujam
Mr S D Bandaranayake
Financials (Rs. ‘000) 2017/18 2016/17 2015/16
Total assets 291,810 194,941 197,612
Total liabilities 9,925 9,196 14,487
Net assets 281,885 185,745 183,124
Total revenue 113,352 14,832 9,953
Profit before tax 102,057 3,610 3,199
Profit after tax 96,140 2,621 452
Relationship : Subsidiary
Holding : 100%
Date of incorporation : 17 April 2012
Joined the Group on : 17 April 2012
Principal line of business : Insurance Brokering
Registered address : 2nd Floor, No. 267,
Galle Road, Colombo 3
Board of Directors : Mr L Balasuriya
Dr A Balasuriya
Dr M Balasuriya
Ms L Fernando
Mr W A T Fernando
Mr S D Bandaranayake
Financials (Rs. ‘000) 2017/18 2016/17 2015/16
Total assets 100,025 48,711 54,864
Total liabilities 76,764 24,525 36,015
Net assets 23,261 24,185 18,849
Total revenue 143,979 119,947 98,780
Profit before tax 140,176 116,982 95,516
Profit after tax 100,575 84,336 68,538
Senkadagala Finance PLC
Subsidiaries
Newest Capital Ltd.Senkadagala Insurance Brokers (Pvt) Ltd.
Parent Company

SE
NK
AD
AG
AL
A F
INA
NC
E P
LC
AN
NU
AL
RE
PO
RT
20
17
/1
8
6
2018 2017 Change %
Financial Results of the Year (Rs. Mn.)
Total income 6,770 5,138 31.77
Interest income 6,472 4,826 34.12
Net interest income 3,062 2,423 26.35
Profit before VAT on financial services and taxation 1,573 1,280 22.82
Profit before taxation 1,357 1,119 21.29
Profit for the year 1,005 861 16.69
Dividends paid 213 186 14.62
Earnings retained during the year 787 668 17.91
Financial Position (Rs. Mn.)
Loans and advances 27,802 23,758 17.02
Total assets 36,104 30,919 16.77
Deposit base 9,507 7,231 31.48
Borrowings 15,376 13,744 11.88
Debentures 4,400 4,993 (11.87)
Shareholders’ funds 5,031 3,662 37.41
Operational Results of the Year (Rs. Mn.)
New advances disbursed 17,600 17,290 1.79
Net flow of deposits 2,276 721 215.67
Debt instruments issued – 3,000 (100.00)
Borrowings obtained 6,740 7,800 (13.59)
Capital expenditure incurred 359 641 (43.96)
Information per Ordinary Share (Rs.)
Earnings per share 13.97 13.05 7.00
Dividends per share 3.00 2.85 5.26
Net assets per share 69.42 56.14 23.67
Highlights
AN
NU
AL
RE
PO
RT
20
17
/1
8 S
EN
KA
DA
GA
LA
FIN
AN
CE
PL
C
7
HIG
HL
IGH
TS
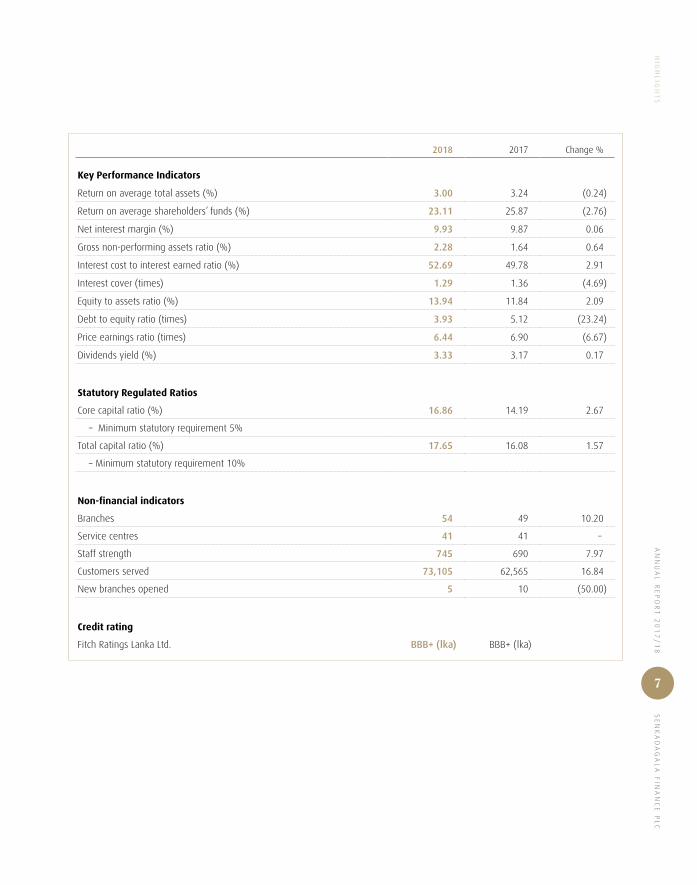
2018 2017 Change %
Key Performance Indicators
Return on average total assets (%) 3.00 3.24 (0.24)
Return on average shareholders’ funds (%) 23.11 25.87 (2.76)
Net interest margin (%) 9.93 9.87 0.06
Gross non-performing assets ratio (%) 2.28 1.64 0.64
Interest cost to interest earned ratio (%) 52.69 49.78 2.91
Interest cover (times) 1.29 1.36 (4.69)
Equity to assets ratio (%) 13.94 11.84 2.09
Debt to equity ratio (times) 3.93 5.12 (23.24)
Price earnings ratio (times) 6.44 6.90 (6.67)
Dividends yield (%) 3.33 3.17 0.17
Statutory Regulated Ratios
Core capital ratio (%) 16.86 14.19 2.67
– Minimum statutory requirement 5%
Total capital ratio (%) 17.65 16.08 1.57
– Minimum statutory requirement 10%
Non-financial indicators
Branches 54 49 10.20
Service centres 41 41 –
Staff strength 745 690 7.97
Customers served 73,105 62,565 16.84
New branches opened 5 10 (50.00)
Credit rating
Fitch Ratings Lanka Ltd. BBB+ (lka) BBB+ (lka)
SE
NK
AD
AG
AL
A F
INA
NC
E P
LC
AN
NU
AL
RE
PO
RT
20
17
/1
8
8
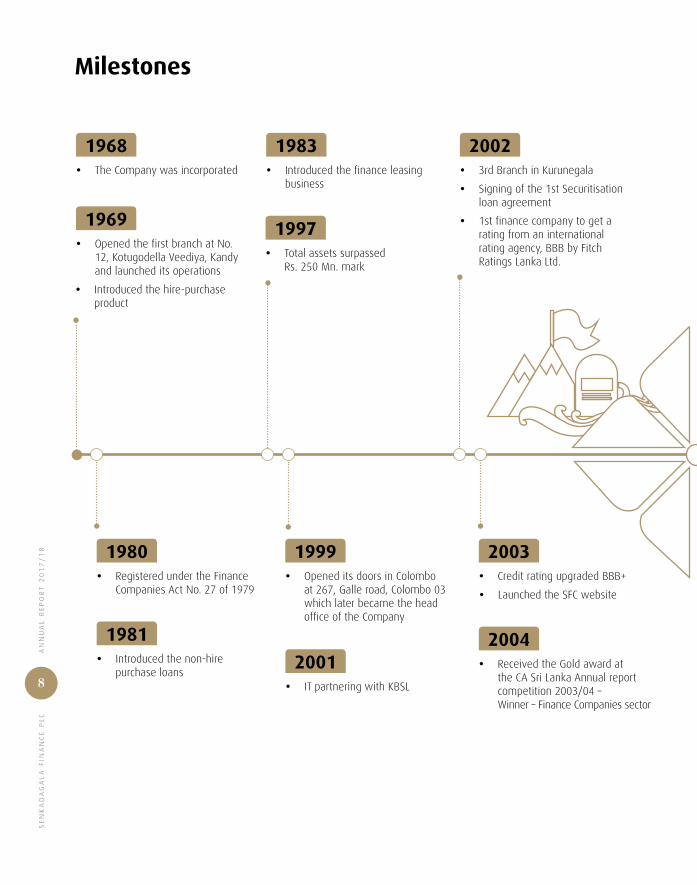
1968
� The Company was incorporated
1969
� Opened the first branch at No. 12, Kotugodella Veediya, Kandy and launched its operations
� Introduced the hire-purchase product
Milestones
1980 � Registered under the Finance
Companies Act No. 27 of 1979
1981
� Introduced the non-hire purchase loans
1997 � Total assets surpassed
Rs. 250 Mn. mark
1983
� Introduced the finance leasing business
2003 � Credit rating upgraded BBB+
� Launched the SFC website
2004 � Received the Gold award at
the CA Sri Lanka Annual report competition 2003/04 – Winner – Finance Companies sector
2001 � IT partnering with KBSL
1999
� Opened its doors in Colombo at 267, Galle road, Colombo 03 which later became the head office of the Company
2002 � 3rd Branch in Kurunegala
� Signing of the 1st Securitisation loan agreement
� 1st finance company to get a rating from an international rating agency, BBB by Fitch Ratings Lanka Ltd.
AN
NU
AL
RE
PO
RT
20
17
/1
8 S
EN
KA
DA
GA
LA
FIN
AN
CE
PL
C
9
MIL
ES
TO
NE
S
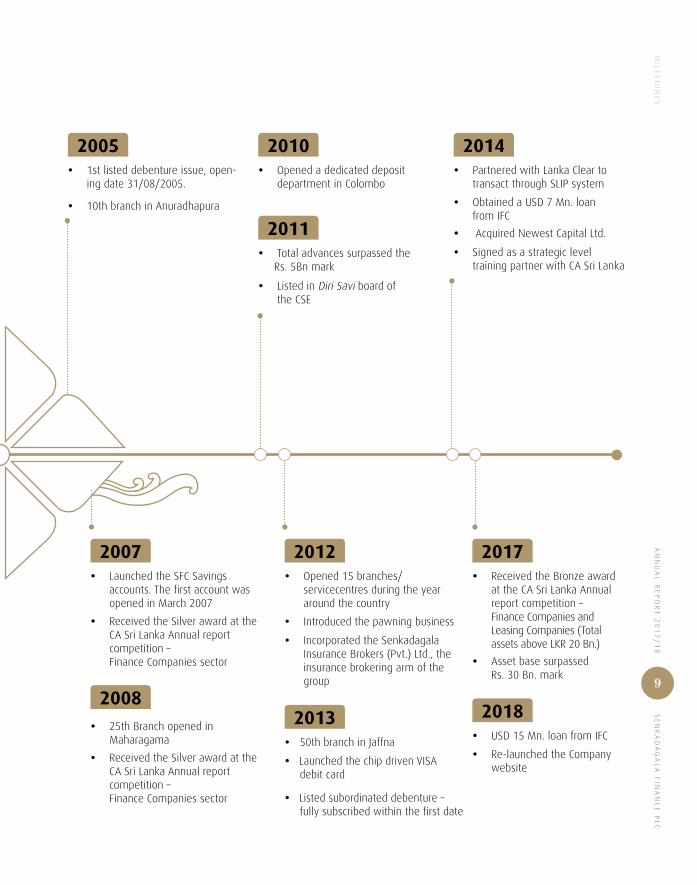
2005
� 1st listed debenture issue, open-ing date 31/08/2005.
� 10th branch in Anuradhapura
2008 � 25th Branch opened in
Maharagama
� Received the Silver award at the CA Sri Lanka Annual report competition – Finance Companies sector
2007 � Launched the SFC Savings
accounts. The first account was opened in March 2007
� Received the Silver award at the CA Sri Lanka Annual report competition – Finance Companies sector
2010 � Opened a dedicated deposit
department in Colombo
2011 � Total advances surpassed the
Rs. 5Bn mark
� Listed in Diri Savi board of the CSE
2012 � Opened 15 branches/
servicecentres during the year around the country
� Introduced the pawning business
� Incorporated the Senkadagala Insurance Brokers (Pvt.) Ltd., the insurance brokering arm of the group
2013
� 50th branch in Jaffna
� Launched the chip driven VISA debit card
� Listed subordinated debenture – fully subscribed within the first date
2017 � Received the Bronze award
at the CA Sri Lanka Annual report competition – Finance Companies and Leasing Companies (Total assets above LKR 20 Bn.)
� Asset base surpassed Rs. 30 Bn. mark
2018
� USD 15 Mn. loan from IFC
� Re-launched the Company website
2014 � Partnered with Lanka Clear to
transact through SLIP system
� Obtained a USD 7 Mn. loan from IFC
� Acquired Newest Capital Ltd.
� Signed as a strategic level training partner with CA Sri Lanka

SE
NK
AD
AG
AL
A F
INA
NC
E P
LC
AN
NU
AL
RE
PO
RT
20
17
/1
8
10
Chairman’s Message
AN
NU
AL
RE
PO
RT
20
17
/1
8 S
EN
KA
DA
GA
LA
FIN
AN
CE
PL
C
11
Strategy always governed our decisions. We continued to expand our customer value proposition in terms of products and services, reach, service standards and internal processes while pro-actively responding to the emerging developments in the operating environment.

SE
NK
AD
AG
AL
A F
INA
NC
E P
LC
AN
NU
AL
RE
PO
RT
20
17
/1
8
12
CH
AIR
MA
N’S
ME
SS
AG
E Dear Shareholders,
At this momentous juncture when your Company celebrates
fifty years of operation, I present you with the Annual Report
for the financial year 2017/18 and welcome you to the 49th
Annual General Meeting. It is an opportune moment for me
to recollect the past, ponder on the present and envision the
future of Senkadagala Finance PLC.
An illustrious past, an unblemished track record...
When we opened our doors half a century ago, we had
modest expectations, but were strategy driven throughout.
Today, your Company has opened 95 branches around the
country and has built a loyal customer base. During the
financial year, we opened five more branches and intend to
achieve our target of establishing hundred branches
on or before our 50th birthday which will be celebrated
on 29 December 2018.
Strategy always governed our decisions. We continued to
expand our customer value proposition in terms of products
and services, reach, service standards and internal processes
while pro-actively responding to the emerging developments
in the operating environment.
Moreover, from the very beginning, effective risk
management and sound corporate governance have
been at the core of our operations. We ensured that our
business activities secured greater market share and higher
profitability while always keeping in mind that we mitigate
exposure to risk in order to ensure optimum trade-off
between risk and return. All these were done on a foundation
of sound corporate governance practices.
A momentous present, creating intrinsic value...
As in the past, this year too we are pleased with the
Company’s overall performance in terms of business volume
growth, profitability, asset quality, operational efficiency and
stability as reflected by the key indicators. The Company
achieved a milestone when the profit after tax surpassed
the Rs. 1 Bn. mark for the first time with a salient growth of
17%. The deposit base too recorded a remarkable growth of
31% in comparison to the previous financial year.
While we take pride in these performance indicators,
we are resolved in our focus on enhancing the quality of
the asset base and strengthening our governance framework
to further augment and create sustainable value for all our
stakeholders. Unprecedented developments are also taking
place in the operating environment. In these circumstances,
the better we understand our stakeholders, customers in
particular, the greater the value we can create for them.
Hence, we are making a genuine effort to thoroughly
understand our stakeholders who sustain the operations of
the Company.
It is a mutually rewarding relationship that is best sustained.
We make great effort to provide a personalised service to
our customers and also provide our employees opportunities
for their growth and development. Moreover all our
operations are conducted in a socially responsible and
environmentally-friendly manner. We will carry these best
practices into the future and they will serve as pointers for
future plans and strategies.
In order to strengthen capital adequacy and thereby create
leeway for future business expansion, the Company made a
rights issue of 7,247,506 new ordinary voting shares at
Rs. 80/- per share increasing the capital by Rs. 579.8 Mn.
in April 2017. With Rs. 5 Bn. in capital funds and a total
capital ratio of 17.65% as at 31 March 2018, the Company
comfortably exceeds the new capital requirements that will
be phased in from 1 January 2018 to be fully implemented
by 1 January 2021.
A prosperous future, bolder aspirations…
Our value creation story is indicative of our future. Very
recently, we received a loan of USD 15 Mn. from the
International Finance Corporation of the World Bank Group
in partnership with Goldman Sachs. We hope to utilise the
proceeds thereof to uplift the lives of Sri Lankan women
entrepreneurs, empowering and encouraging them to take
the lead in their chosen fields.
It is going to be a digitalised world as never witnessed
before and your Company is geared to keep pace with the
rapid changes taking place in this regard. We are also equally
cognisant of underlying security threats and have taken the
necessary steps to address them.

AN
NU
AL
RE
PO
RT
20
17
/1
8 S
EN
KA
DA
GA
LA
FIN
AN
CE
PL
C
13
CH
AIR
MA
N’S
ME
SS
AG
E
Thank you, fifty times and over...
We have arrived at our 50th anniversary, thanks to the
sustained efforts of our specialised teams. Dispersed around
the country are also our customers who have stood with
us through the years and have always seen value in the
strategic decisions we made. I am immensely grateful for
your efforts and sustained presence and will continue to keep
your best interests at heart in the years to come.
My appreciation must be also extended to my colleagues on
the Board for their continued support and cooperation.
I especially thank our Managing Director/CEO, Mr Lakshman
Balasuriya, Additional CEO/Director, Mr Sanath Bandaranayake
and all the other staff members for their dedication and
commitment during the year. I appreciate the continued
support and guidance extended by the Director and the staff
of the Department of Supervision of Non-Bank Financial
Institutions of the Central Bank of Sri Lanka. I also deeply
appreciate the loyalty and confidence of our shareholders.
As we journey forward, I foresee continued success for
Senkadagala Finance PLC.
W M R S Dias
Chairman
31 May 2018

SE
NK
AD
AG
AL
A F
INA
NC
E P
LC
AN
NU
AL
RE
PO
RT
20
17
/1
8
14
ManagingDirector/CEO’s Review

AN
NU
AL
RE
PO
RT
20
17
/1
8 S
EN
KA
DA
GA
LA
FIN
AN
CE
PL
C
15
The year leading up to the Company’s 50th Anniversary was marked with noteworthy achievements. Accomplishing a significant milestone, the profit after tax reached Rs. 1,005 Mn., the highest ever reported so far, on a profit before tax of Rs. 1,357 Mn. Total assets grew to Rs. 36 Bn., a 17% growth compared to the last year.

SE
NK
AD
AG
AL
A F
INA
NC
E P
LC
AN
NU
AL
RE
PO
RT
20
17
/1
8
16
MA
NA
GIN
G D
IRE
CT
OR
/C
EO
’S R
EV
IEW The year leading up to the Company’s 50th Anniversary
was marked with noteworthy achievements. Accomplishing
a significant milestone, the profit after tax reached
Rs. 1,005 Mn., the highest ever reported so far, on a profit
before tax of Rs. 1,357 Mn. Total assets grew to Rs. 36 Bn.,
a 17% growth compared to the last year. Contributing to
the asset growth, the loans and advances portfolio reached
Rs. 27.8 Bn. despite the challenging conditions that prevailed
in the market.
Sector and industry performance
Despite the improved performance in the financial sector as
a whole with contributions from the banking and other
deposit taking financial institutions, only moderate growth
was reported by the Licensed Finance Companies (LFCs) and
the Specialised Leasing Companies (SLCs).
The growth of the NBFI sector was stifled primarily due
to macroprudential policy measures taken to reduce the
imports and restrict lending for motor vehicles through
stringent loan to value (LTV) ratios. Increased LTV ratios
improved the risk profile of motor vehicle leases, leading
the banks to aggressively market the product. Furthermore,
the demand for core lending products was also impacted
by the increasing trend of lending rates, adverse weather
conditions and the lacklustre economic growth. The impact of
these developments is seen in the low credit growth and the
deteriorating asset quality.
Impact and measures adopted
Stemming from the developments in the sector, the
Company’s NPL ratio increased to 2.28% during the financial
year from 1.64% last year. In order to meet challenges
that were presented throughout the year, the Company
strengthened its risk management framework further.
Processes and controls relating to the customer appraisals
were strengthened through the introduction of a new system
that maintains detailed records of the appraisal process,
thereby enhancing accountability and transparency.
The pawning arm of the business continued to grow
successfully. During the financial year, it experienced a growth
of 81% expanding the portfolio to Rs. 994 Mn. compared to
Rs. 548 Mn. last year. Despite the negativity that surrounds
the fluctuating prices of gold, the Company strengthened
its pawning business through localised promotions and
targeted campaigns. While keenly observing the market
developments, stringent LTV ratios were maintained to
mitigate the risk of price fluctuations to maintain the quality
of the portfolio.
Growing network
The Company rapidly yet strategically expanded its reach over
the past five years, opening 65 new branches and service
centres in strategic locations across the country. During the
financial year, Senkadagala Finance PLC opened its doors
in Bandaragama, Deniyaya, Mathugama, Wattegama and
Welimada. The branches opened in the recent past have
managed to break even. The operations in each of the
branches are handled by talented professionals who lead the
teams to achieve the targets set for them.
As the Company celebrates its 50th Anniversary, we have
taken measures to achieve the goal of expanding the
network to 100 branches. While continuing to strengthen
alternative channels further, we intend to expand our
presence in strategic locations in the coming years.
A digital age
From its modest beginnings with a localised network and a
few PCs, the Company has now developed a cutting-edge
ICT system that is specially tailored to the operations of
the Company and the requirements of its wide and diverse
customer base.
Online banking facilities and utility bill payment facilities were
made available to the Company’s savings customers while
SMS notifications have also been enabled for transactions
that are made with the use of debit cards. This year, the
Company also introduced a new VISA debit card with chip
and PIN authentication along with the PayWave facility. The
new card enhances security while enriching the customer
experience. It is also an initiative that creates additional value
for customers as the Company’s products are now coupled
with facilities that are in line with global developments.
Journeying together
In its fifty-year-long journey, the Company sustained
operations and ensured the retention of a trusted customer
base most of whom do repeat business. As mentioned
before, the Company consistently innovates products and
services that suit the diverse needs of its customers.

AN
NU
AL
RE
PO
RT
20
17
/1
8 S
EN
KA
DA
GA
LA
FIN
AN
CE
PL
C
17
MA
NA
GIN
G D
IRE
CT
OR
/C
EO
’S R
EV
IEW
Similarly, employees are recruited from the localities in which
the branches are established. This has created employment
opportunities for many. The Company also provides career
development opportunities for talented staff members to
ensure their professional growth within the Organisation.
Taking these long-established values further into the future,
Senkadagala Finance PLC will continue to grow strategically
in the years to come, capitalising on the core business of the
Company while preserving its asset quality.
A note of thanks
As the Company journeys towards a new era, appreciation
must be extended to customers and employees who have
been with the Company in the past and many who continue
to place their trust in Senkadagala Finance PLC. Gratitude
is extended to the Chairman, Mr. Ravi Dias and the Board
of Directors for their continuous support and guidance. I
must also thank the Senior Management team some of
whom count a long stint with the Company for their ongoing
dedication and significant efforts towards the success of the
Company. The continued support and guidance provided by
the Director and the staff of the Department of Supervision
of Non-Bank Financial Institutions of the Central Bank of
Sri Lanka are appreciated. A special note of thanks must also
be extended to the investors for their trust and support.
Lakshman Balasuriya
Managing Director/CEO
31 May 2018

18
SE
NK
AD
AG
AL
A F
INA
NC
E P
LC
AN
NU
AL
RE
PO
RT
20
17
/1
8
BusinessModel
20 22 30 33 36Our
Business Model
Operating Environment
Trusted Strategy
Stakeholder Engagement
Materiality

AN
NU
AL
RE
PO
RT
20
17
/1
8 S
EN
KA
DA
GA
LA
FIN
AN
CE
PL
C
19
20 22 30 33 36Our
Business Model
Operating Environment
Trusted Strategy
Stakeholder Engagement
Materiality

SE
NK
AD
AG
AL
A F
INA
NC
E P
LC
AN
NU
AL
RE
PO
RT
20
17
/1
8H
EA
DIN
G
20
Senkadagala Finance PLCFrom Stakeholders
Operating Environment
Support
services
Support
services
Maturity transformation
Financialintermediation
(Augmenting/transforming the value of input capitals for the benefit of stakeholders)
Inputs Process
Vision Mission Values Strategy
Financial CapitalRs. 5,031 Mn. in shareholders' funds
Rs. 19,776 Mn. borrowings from other investors
Property, plant and equipment
Financial covenants
Institutional CapitalInstitutionalised knowledge
Internally developed tailor made IT system
Corporate governance framework
System of internal control
Social and Environmental Management System
Customer data and insights
Best practice
Business collaborations and alliances
CustomersRs. 9,507 Mn. in customer deposits
Findings from customer satisfaction survey
Employees745 employees with a cumulative
service of 3,246 years
Competencies
Findings from employee satisfaction survey
Society and environmentLand, water, energy, paper
Our Business Model
Funding & Liquidity M
anagement
Capi
tal M
anag
emen
t
Risk Management
Governance
Streamlined Internal ProcessesEx
celle
nt S
ervi
ce S
tand
ards
Range of Products and Services
Network of Delivery Channels and Branches

AN
NU
AL
RE
PO
RT
20
17
/1
8 S
EN
KA
DA
GA
LA
FIN
AN
CE
PL
CH
EA
DIN
G
21
Senkadagala Finance PLCTo Stakeholders
Shareholders and other investorsLending and investment portfolio
Deposit base
Sustainable growth
Profits and profitability
Institutional CapitalEnhanced productivity
Optimum risk - return trade-off
Benchmarked service standards
New products developed
Assurances and confirmations
CustomersInterest income for depositors
Funding for borrowers
Financial advice
Value added services
EmployeesRemuneration
Training & development
Career prospects
Creativity and innovativeness
Society and environmentTaxes and levies to Government
Contribution to Popham Arboretum Project
Rs. 3.7 Mn. spent on other CSR activities
166 new staff recruitments from localities
Shareholders and other investorsDividends, interest and capital gains
Higher Price to Book Value
Stability
A loyal investor base with a long-term view
Institutional CapitalBrand value and brand equity
Unblemished track record
Competitive advantage
Asset quality
BBB+(lka) rating from Fitch
Innovation
CustomersSafety and security for deposits
Realised growth opportunities
Unparelleled convenience
A satisfied and growing customer base
EmployeesCareer development
Job satisfactionHigh employee retentionOccupational health and safety
Society and environmentResponsible financingFinancial inclusionFacilitating economic growth and community development“Social License” to operate
(Augmenting/transforming the value of input capitals for the benefit of stakeholders)
Outputs Outcomes
Vision Mission Values Strategy
Support
services
Support
servicesFunding &
Liquidity Managem
ent
Capi
tal M
anag
emen
t
Risk Management
Governance
Streamlined Internal ProcessesEx
celle
nt S
ervi
ce S
tand
ards
Range of Products and Services
Network of Delivery Channels and Branches

SE
NK
AD
AG
AL
A F
INA
NC
E P
LC
AN
NU
AL
RE
PO
RT
20
17
/1
8
22
Operating Environment
The Global Setting
Despite negative forecasts stemming from political turmoil
and situations of unrest, the global economy grew by 3.7% in
2017. The growth is broad based while notable contributions
from Europe and Asia have been reported. This trend will be
sustained in the future as the growth forecasts for both 2018
and 2019 have been revised up to 3.9%.
Moreover, around 120 economies which account for three
quarters of the world GDP have also experienced marked
improvements in terms of growth in year on year terms
within 2017. This is also the broadest harmonised global
growth since 2010. These encouraging developments have
particularly impacted the economies of Brazil, China and
South Africa.
Capital flows to emerging markets remained strong during
the third quarter of 2017. Moreover, the currencies of these
market economies also appreciated during the latter part
of 2017 and early 2018 resulting in stronger commodity
prices. However, there is a possibility that growth can be
dampened as rich asset valuations and very compressed
term premiums raise the possibility of a financial market
correction. Growth could be further hampered by an increase
in the core inflation and interest rates as demand accelerates
in advanced economies.
The increase in fuel prices also contributed towards the
raising of headline inflation in developed economies while in
emerging market economies inflation has increased slightly
towards the start of 2018 after having dropped at the latter
part of 2017. Moreover, in the third quarter of 2017, capital
flows to emerging markets remained resilient with continued
strength in non-resident portfolio inflows.
The monetary policy changes made in certain emerging
markets also contributed towards the progression in
their economies. In terms of the future of fiscal policy in
commodity-dependent emerging markets and developing
economies, it is advised that policy makers guard against the
temptation to defer reforms and budgetary adjustments later.
If this growth momentum is maintained, steady economic
developments will be made in 2018 and 2019 as well.
Growth in Asian economies is expected, particularly those
that are looking to engage in global trade and investment.
April 2017 October 2017 Source: World Economic Outlook – October 2017
GDP Growth (Annualised semiannual percent change)
Advanced Economies
4
3
2
1
0
9
8
7
6
5
4
32013H1
2013H1
2015H1
2015H1
2017H1
2017H1
2011 H1
2011 H1
2018H2
2018H2
Emerging Market and Developing Economies
AN
NU
AL
RE
PO
RT
20
17
/1
8 S
EN
KA
DA
GA
LA
FIN
AN
CE
PL
C
23
OP
ER
AT
ING
EN
VIR
ON
ME
NT
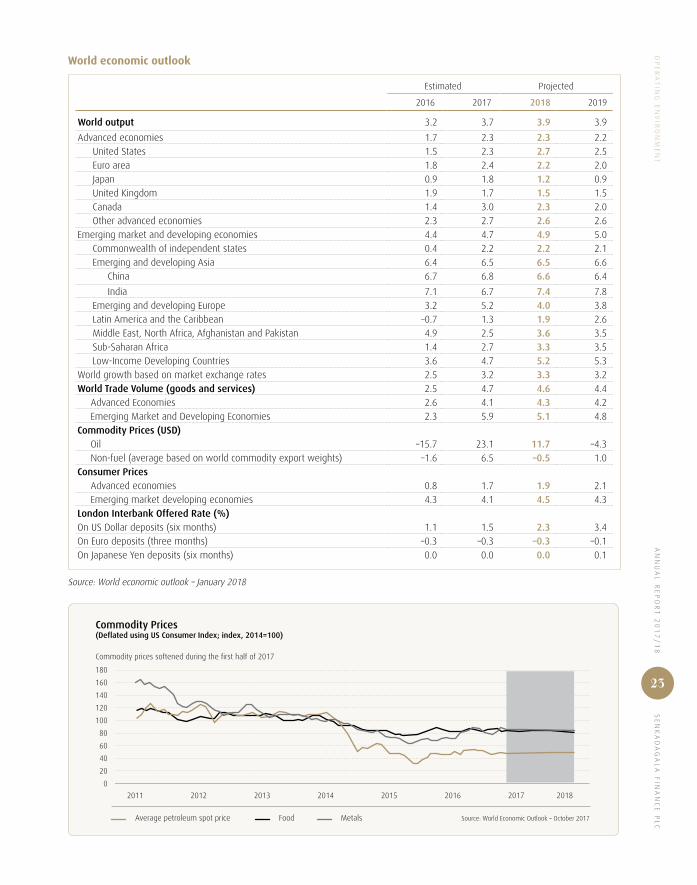
World economic outlook
Estimated Projected
2016 2017 2018 2019
World output 3.2 3.7 3.9 3.9
Advanced economies 1.7 2.3 2.3 2.2United States 1.5 2.3 2.7 2.5Euro area 1.8 2.4 2.2 2.0Japan 0.9 1.8 1.2 0.9United Kingdom 1.9 1.7 1.5 1.5Canada 1.4 3.0 2.3 2.0Other advanced economies 2.3 2.7 2.6 2.6
Emerging market and developing economies 4.4 4.7 4.9 5.0Commonwealth of independent states 0.4 2.2 2.2 2.1Emerging and developing Asia 6.4 6.5 6.5 6.6
China 6.7 6.8 6.6 6.4
India 7.1 6.7 7.4 7.8Emerging and developing Europe 3.2 5.2 4.0 3.8Latin America and the Caribbean –0.7 1.3 1.9 2.6Middle East, North Africa, Afghanistan and Pakistan 4.9 2.5 3.6 3.5Sub-Saharan Africa 1.4 2.7 3.3 3.5Low-Income Developing Countries 3.6 4.7 5.2 5.3
World growth based on market exchange rates 2.5 3.2 3.3 3.2World Trade Volume (goods and services) 2.5 4.7 4.6 4.4
Advanced Economies 2.6 4.1 4.3 4.2Emerging Market and Developing Economies 2.3 5.9 5.1 4.8
Commodity Prices (USD)Oil –15.7 23.1 11.7 –4.3Non-fuel (average based on world commodity export weights) –1.6 6.5 –0.5 1.0
Consumer PricesAdvanced economies 0.8 1.7 1.9 2.1Emerging market developing economies 4.3 4.1 4.5 4.3
London Interbank Offered Rate (%)On US Dollar deposits (six months) 1.1 1.5 2.3 3.4On Euro deposits (three months) –0.3 –0.3 –0.3 –0.1On Japanese Yen deposits (six months) 0.0 0.0 0.0 0.1
Source: World economic outlook – January 2018
Average petroleum spot price Food Metals Source: World Economic Outlook – October 2017
Commodity Prices(Deflated using US Consumer Index; index, 2014=100)
Commodity prices softened during the first half of 2017
2011 2012 2013 2014 2015 2016
180
160
140
120
100
80
60
40
20
0
20182017
SE
NK
AD
AG
AL
A F
INA
NC
E P
LC
AN
NU
AL
RE
PO
RT
20
17
/1
8
24
OP
ER
AT
ING
EN
VIR
ON
ME
NT
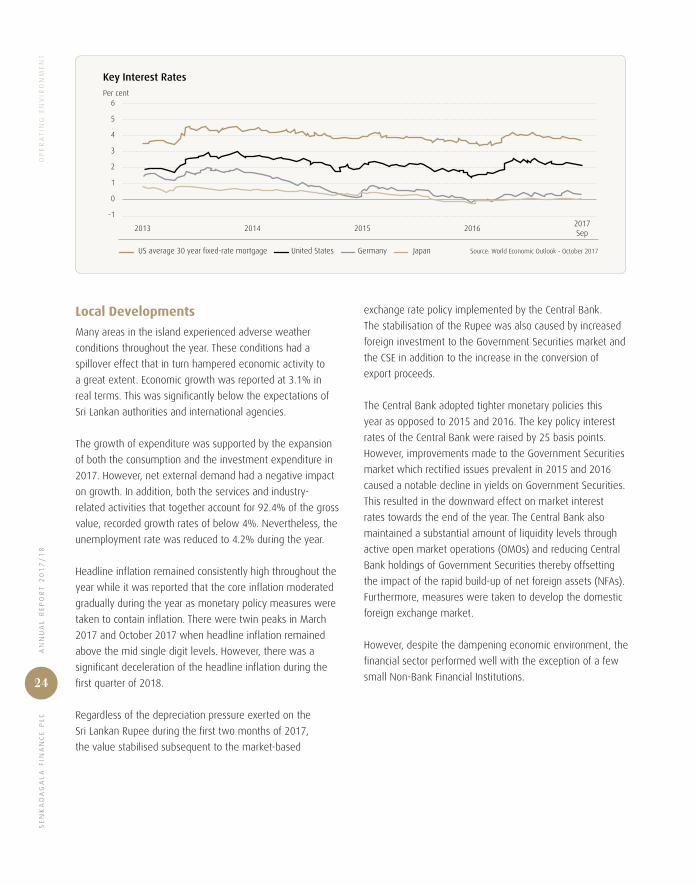
US average 30 year fixed-rate mortgage United States Germany Japan Source: World Economic Outlook - October 2017
Key Interest Rates
2013 2014 2015 2016
6
5
4
3
2
1
0
-12017Sep
Per cent
Local Developments
Many areas in the island experienced adverse weather
conditions throughout the year. These conditions had a
spillover effect that in turn hampered economic activity to
a great extent. Economic growth was reported at 3.1% in
real terms. This was significantly below the expectations of
Sri Lankan authorities and international agencies.
The growth of expenditure was supported by the expansion
of both the consumption and the investment expenditure in
2017. However, net external demand had a negative impact
on growth. In addition, both the services and industry-
related activities that together account for 92.4% of the gross
value, recorded growth rates of below 4%. Nevertheless, the
unemployment rate was reduced to 4.2% during the year.
Headline inflation remained consistently high throughout the
year while it was reported that the core inflation moderated
gradually during the year as monetary policy measures were
taken to contain inflation. There were twin peaks in March
2017 and October 2017 when headline inflation remained
above the mid single digit levels. However, there was a
significant deceleration of the headline inflation during the
first quarter of 2018.
Regardless of the depreciation pressure exerted on the
Sri Lankan Rupee during the first two months of 2017,
the value stabilised subsequent to the market-based
exchange rate policy implemented by the Central Bank.
The stabilisation of the Rupee was also caused by increased
foreign investment to the Government Securities market and
the CSE in addition to the increase in the conversion of
export proceeds.
The Central Bank adopted tighter monetary policies this
year as opposed to 2015 and 2016. The key policy interest
rates of the Central Bank were raised by 25 basis points.
However, improvements made to the Government Securities
market which rectified issues prevalent in 2015 and 2016
caused a notable decline in yields on Government Securities.
This resulted in the downward effect on market interest
rates towards the end of the year. The Central Bank also
maintained a substantial amount of liquidity levels through
active open market operations (OMOs) and reducing Central
Bank holdings of Government Securities thereby offsetting
the impact of the rapid build-up of net foreign assets (NFAs).
Furthermore, measures were taken to develop the domestic
foreign exchange market.
However, despite the dampening economic environment, the
financial sector performed well with the exception of a few
small Non-Bank Financial Institutions.
AN
NU
AL
RE
PO
RT
20
17
/1
8 S
EN
KA
DA
GA
LA
FIN
AN
CE
PL
C
25
OP
ER
AT
ING
EN
VIR
ON
ME
NT
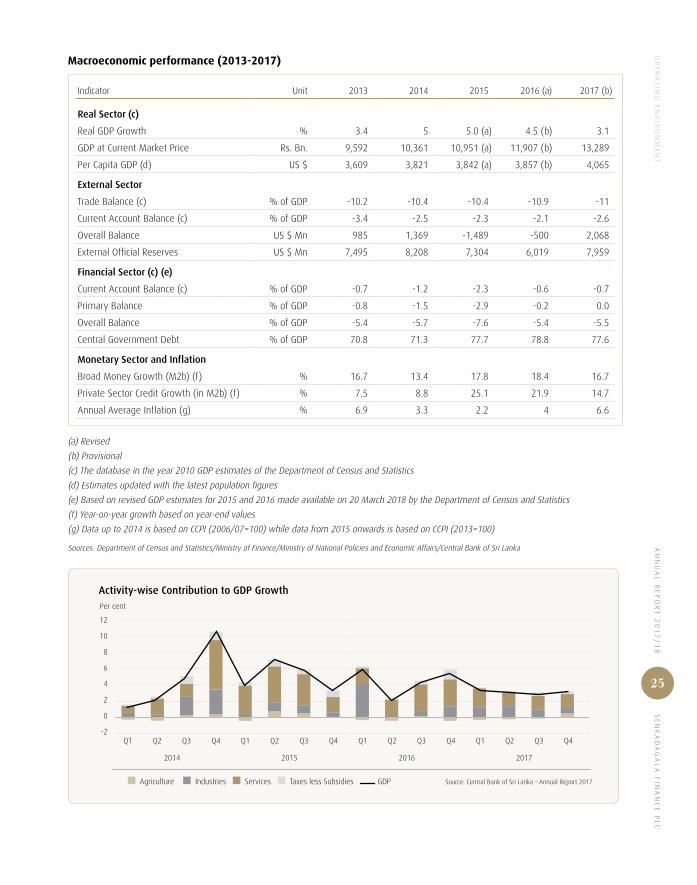
Macroeconomic performance (2013-2017)
Indicator Unit 2013 2014 2015 2016 (a) 2017 (b)
Real Sector (c)
Real GDP Growth % 3.4 5 5.0 (a) 4.5 (b) 3.1
GDP at Current Market Price Rs. Bn. 9,592 10,361 10,951 (a) 11,907 (b) 13,289
Per Capita GDP (d) US $ 3,609 3,821 3,842 (a) 3,857 (b) 4,065
External Sector
Trade Balance (c) % of GDP -10.2 -10.4 -10.4 -10.9 -11
Current Account Balance (c) % of GDP -3.4 -2.5 -2.3 -2.1 -2.6
Overall Balance US $ Mn 985 1,369 -1,489 -500 2,068
External Official Reserves US $ Mn 7,495 8,208 7,304 6,019 7,959
Financial Sector (c) (e)
Current Account Balance (c) % of GDP -0.7 -1.2 -2.3 -0.6 -0.7
Primary Balance % of GDP -0.8 -1.5 -2.9 -0.2 0.0
Overall Balance % of GDP -5.4 -5.7 -7.6 -5.4 -5.5
Central Government Debt % of GDP 70.8 71.3 77.7 78.8 77.6
Monetary Sector and Inflation
Broad Money Growth (M2b) (f) % 16.7 13.4 17.8 18.4 16.7
Private Sector Credit Growth (in M2b) (f) % 7.5 8.8 25.1 21.9 14.7
Annual Average Inflation (g) % 6.9 3.3 2.2 4 6.6
(a) Revised
(b) Provisional
(c) The database in the year 2010 GDP estimates of the Department of Census and Statistics
(d) Estimates updated with the latest population figures
(e) Based on revised GDP estimates for 2015 and 2016 made available on 20 March 2018 by the Department of Census and Statistics
(f) Year-on-year growth based on year-end values
(g) Data up to 2014 is based on CCPI (2006/07=100) while data from 2015 onwards is based on CCPI (2013=100)
Sources: Department of Census and Statistics/Ministry of Finance/Ministry of National Policies and Economic Affairs/Central Bank of Sri Lanka
Agriculture Industries Services Taxes less Subsidies GDP Source: Central Bank of Sri Lanka – Annual Report 2017
Activity-wise Contribution to GDP Growth
2014 2015 2016
12
10
8
6
4
2
0
-2
2017
Q1 Q1 Q1 Q1Q2 Q2 Q2 Q2Q3 Q3 Q3 Q3Q4 Q4 Q4 Q4
Per cent
SE
NK
AD
AG
AL
A F
INA
NC
E P
LC
AN
NU
AL
RE
PO
RT
20
17
/1
8
26
OP
ER
AT
ING
EN
VIR
ON
ME
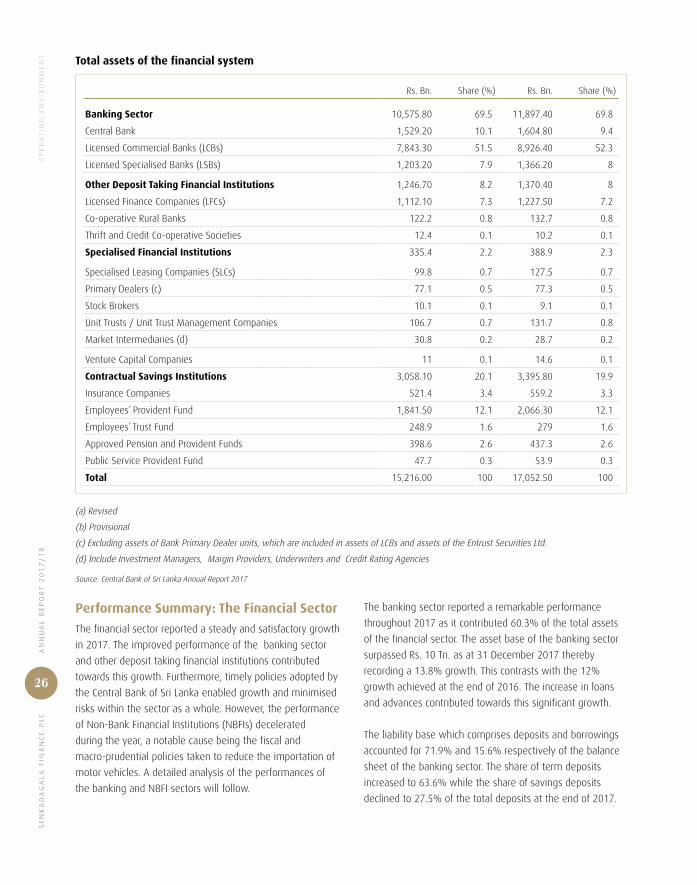
NT Total assets of the financial system
Rs. Bn. Share (%) Rs. Bn. Share (%)
Banking Sector 10,575.80 69.5 11,897.40 69.8
Central Bank 1,529.20 10.1 1,604.80 9.4
Licensed Commercial Banks (LCBs) 7,843.30 51.5 8,926.40 52.3
Licensed Specialised Banks (LSBs) 1,203.20 7.9 1,366.20 8
Other Deposit Taking Financial Institutions 1,246.70 8.2 1,370.40 8
Licensed Finance Companies (LFCs) 1,112.10 7.3 1,227.50 7.2
Co-operative Rural Banks 122.2 0.8 132.7 0.8
Thrift and Credit Co-operative Societies 12.4 0.1 10.2 0.1
Specialised Financial Institutions 335.4 2.2 388.9 2.3
Specialised Leasing Companies (SLCs) 99.8 0.7 127.5 0.7
Primary Dealers (c) 77.1 0.5 77.3 0.5
Stock Brokers 10.1 0.1 9.1 0.1
Unit Trusts / Unit Trust Management Companies 106.7 0.7 131.7 0.8
Market Intermediaries (d) 30.8 0.2 28.7 0.2
Venture Capital Companies 11 0.1 14.6 0.1
Contractual Savings Institutions 3,058.10 20.1 3,395.80 19.9
Insurance Companies 521.4 3.4 559.2 3.3
Employees’ Provident Fund 1,841.50 12.1 2,066.30 12.1
Employees’ Trust Fund 248.9 1.6 279 1.6
Approved Pension and Provident Funds 398.6 2.6 437.3 2.6
Public Service Provident Fund 47.7 0.3 53.9 0.3
Total 15,216.00 100 17,052.50 100
(a) Revised
(b) Provisional
(c) Excluding assets of Bank Primary Dealer units, which are included in assets of LCBs and assets of the Entrust Securities Ltd.
(d) Include Investment Managers, Margin Providers, Underwriters and Credit Rating Agencies
Source: Central Bank of Sri Lanka Annual Report 2017
The banking sector reported a remarkable performance
throughout 2017 as it contributed 60.3% of the total assets
of the financial sector. The asset base of the banking sector
surpassed Rs. 10 Tn. as at 31 December 2017 thereby
recording a 13.8% growth. This contrasts with the 12%
growth achieved at the end of 2016. The increase in loans
and advances contributed towards this significant growth.
The liability base which comprises deposits and borrowings
accounted for 71.9% and 15.6% respectively of the balance
sheet of the banking sector. The share of term deposits
increased to 63.6% while the share of savings deposits
declined to 27.5% of the total deposits at the end of 2017.
Performance Summary: The Financial Sector
The financial sector reported a steady and satisfactory growth
in 2017. The improved performance of the banking sector
and other deposit taking financial institutions contributed
towards this growth. Furthermore, timely policies adopted by
the Central Bank of Sri Lanka enabled growth and minimised
risks within the sector as a whole. However, the performance
of Non-Bank Financial Institutions (NBFIs) decelerated
during the year, a notable cause being the fiscal and
macro-prudential policies taken to reduce the importation of
motor vehicles. A detailed analysis of the performances of
the banking and NBFI sectors will follow.
AN
NU
AL
RE
PO
RT
20
17
/1
8 S
EN
KA
DA
GA
LA
FIN
AN
CE
PL
C
27
OP
ER
AT
ING
EN
VIR
ON
ME
NT
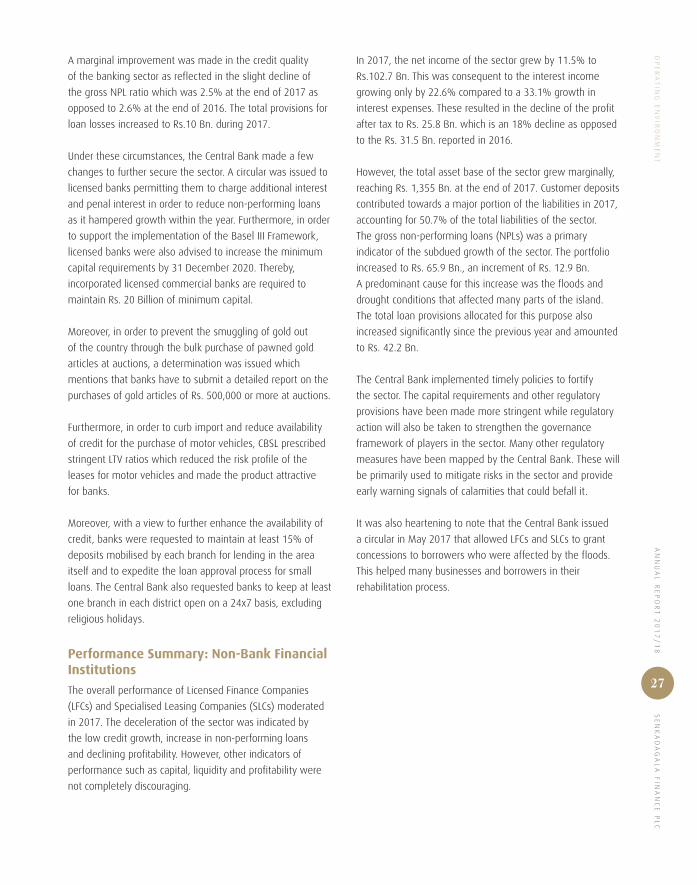
A marginal improvement was made in the credit quality
of the banking sector as reflected in the slight decline of
the gross NPL ratio which was 2.5% at the end of 2017 as
opposed to 2.6% at the end of 2016. The total provisions for
loan losses increased to Rs.10 Bn. during 2017.
Under these circumstances, the Central Bank made a few
changes to further secure the sector. A circular was issued to
licensed banks permitting them to charge additional interest
and penal interest in order to reduce non-performing loans
as it hampered growth within the year. Furthermore, in order
to support the implementation of the Basel III Framework,
licensed banks were also advised to increase the minimum
capital requirements by 31 December 2020. Thereby,
incorporated licensed commercial banks are required to
maintain Rs. 20 Billion of minimum capital.
Moreover, in order to prevent the smuggling of gold out
of the country through the bulk purchase of pawned gold
articles at auctions, a determination was issued which
mentions that banks have to submit a detailed report on the
purchases of gold articles of Rs. 500,000 or more at auctions.
Furthermore, in order to curb import and reduce availability
of credit for the purchase of motor vehicles, CBSL prescribed
stringent LTV ratios which reduced the risk profile of the
leases for motor vehicles and made the product attractive
for banks.
Moreover, with a view to further enhance the availability of
credit, banks were requested to maintain at least 15% of
deposits mobilised by each branch for lending in the area
itself and to expedite the loan approval process for small
loans. The Central Bank also requested banks to keep at least
one branch in each district open on a 24x7 basis, excluding
religious holidays.
Performance Summary: Non-Bank Financial Institutions
The overall performance of Licensed Finance Companies
(LFCs) and Specialised Leasing Companies (SLCs) moderated
in 2017. The deceleration of the sector was indicated by
the low credit growth, increase in non-performing loans
and declining profitability. However, other indicators of
performance such as capital, liquidity and profitability were
not completely discouraging.
In 2017, the net income of the sector grew by 11.5% to
Rs.102.7 Bn. This was consequent to the interest income
growing only by 22.6% compared to a 33.1% growth in
interest expenses. These resulted in the decline of the profit
after tax to Rs. 25.8 Bn. which is an 18% decline as opposed
to the Rs. 31.5 Bn. reported in 2016.
However, the total asset base of the sector grew marginally,
reaching Rs. 1,355 Bn. at the end of 2017. Customer deposits
contributed towards a major portion of the liabilities in 2017,
accounting for 50.7% of the total liabilities of the sector.
The gross non-performing loans (NPLs) was a primary
indicator of the subdued growth of the sector. The portfolio
increased to Rs. 65.9 Bn., an increment of Rs. 12.9 Bn.
A predominant cause for this increase was the floods and
drought conditions that affected many parts of the island.
The total loan provisions allocated for this purpose also
increased significantly since the previous year and amounted
to Rs. 42.2 Bn.
The Central Bank implemented timely policies to fortify
the sector. The capital requirements and other regulatory
provisions have been made more stringent while regulatory
action will also be taken to strengthen the governance
framework of players in the sector. Many other regulatory
measures have been mapped by the Central Bank. These will
be primarily used to mitigate risks in the sector and provide
early warning signals of calamities that could befall it.
It was also heartening to note that the Central Bank issued
a circular in May 2017 that allowed LFCs and SLCs to grant
concessions to borrowers who were affected by the floods.
This helped many businesses and borrowers in their
rehabilitation process.

SE
NK
AD
AG
AL
A F
INA
NC
E P
LC
AN
NU
AL
RE
PO
RT
20
17
/1
8
28
OP
ER
AT
ING
EN
VIR
ON
ME
NT Composition of assets and liabilities of the LFCs/SLCs sector
Item 2016 (a) 2017 (b) Change (%)
Rs. Bn. Share (%) Rs. Bn. Share (%) 2016 (a) 2017 (b)
Assets
Loans and advances (net) 962.7 79.4 1,057.1 78.0 21.0 9.8
Investments 111.7 9.2 118.1 8.7 12.1 5.7
Other 137.5 11.3 179.8 13.3 36.6 30.8
Liabilities
Total deposits 530.7 43.8 686.7 50.7 10.4 29.4
Total borrowings 438.7 36.2 396.0 29.2 39.6 -9.7
Capital elements 146.1 12.1 169.7 12.5 18.7 16.1
Other 96.4 8.0 102.6 7.6 23.5 6.4
Total assets/liabilities 1,211.9 100.0 1,355.0 100.0 21.7 11.8
(a) Revised Source: Central Bank of Sri Lanka – Annual Report 2017
(b) Provisional
Profitability Indicators of the LFC and SLC sector
%
Net Interest Margin ROA ROE Source: Central Bank of Sri Lanka - Annual Report 2017
20172013 2014 2015 2016
25
20
15
10
5
0
9.0
14.0 12.4
23.1
16.1
6.98.0 8.7 7.9 7.7
2.3 3.1 3.0 4.0 3.2
AN
NU
AL
RE
PO
RT
20
17
/1
8 S
EN
KA
DA
GA
LA
FIN
AN
CE
PL
C
29
OP
ER
AT
ING
EN
VIR
ON
ME
NT
Gross NPA (Left Y Axis) Gross NPA Ratio (Right Y Axis)
Net-NPA Ratio (Right Y Axis)
Total Provisions (Left Y Axis)
Total Provisions Ratio (Right Y Axis)
2014 20142015 20152016 20162013 20132017 2017
70
60
50
40
30
20
10
0
8
7
6
5
4
3
2
1
0
45
40
35
30
25
20
15
10
5
0
68
66
64
62
60
58
56
54
52
50
Rs. billion Rs. billion% %
Non-Performing Loans and Provision Coverage of the LFC and SLC Sector
Source: Central Bank of Sri Lanka - Annual Report 2017
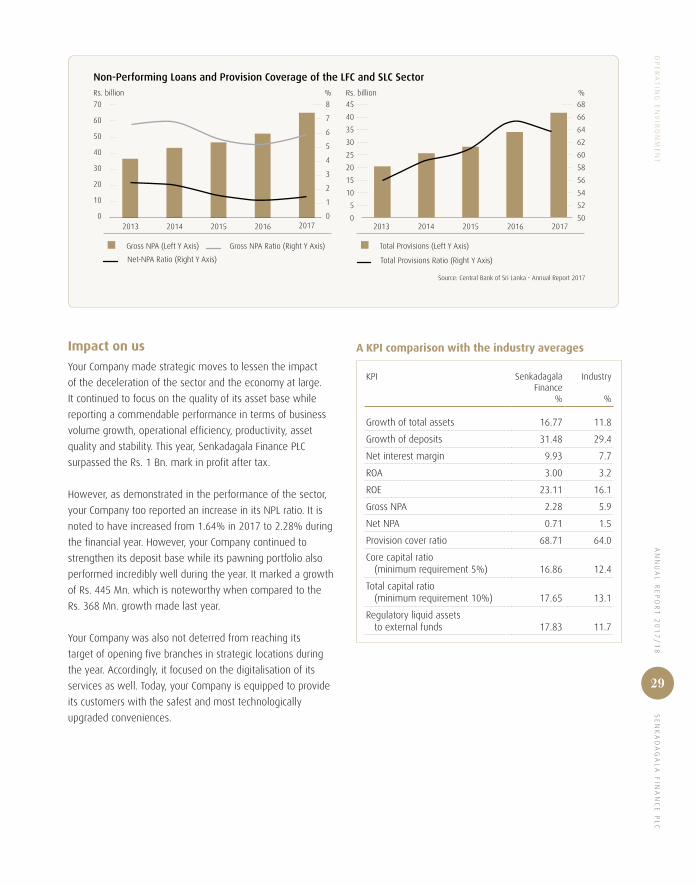
Impact on us
Your Company made strategic moves to lessen the impact
of the deceleration of the sector and the economy at large.
It continued to focus on the quality of its asset base while
reporting a commendable performance in terms of business
volume growth, operational efficiency, productivity, asset
quality and stability. This year, Senkadagala Finance PLC
surpassed the Rs. 1 Bn. mark in profit after tax.
However, as demonstrated in the performance of the sector,
your Company too reported an increase in its NPL ratio. It is
noted to have increased from 1.64% in 2017 to 2.28% during
the financial year. However, your Company continued to
strengthen its deposit base while its pawning portfolio also
performed incredibly well during the year. It marked a growth
of Rs. 445 Mn. which is noteworthy when compared to the
Rs. 368 Mn. growth made last year.
Your Company was also not deterred from reaching its
target of opening five branches in strategic locations during
the year. Accordingly, it focused on the digitalisation of its
services as well. Today, your Company is equipped to provide
its customers with the safest and most technologically
upgraded conveniences.
A KPI comparison with the industry averages
KPI Senkadagala Finance
%
Industry
%
Growth of total assets 16.77 11.8
Growth of deposits 31.48 29.4
Net interest margin 9.93 7.7
ROA 3.00 3.2
ROE 23.11 16.1
Gross NPA 2.28 5.9
Net NPA 0.71 1.5
Provision cover ratio 68.71 64.0
Core capital ratio (minimum requirement 5%) 16.86 12.4
Total capital ratio (minimum requirement 10%) 17.65 13.1
Regulatory liquid assets to external funds 17.83 11.7

SE
NK
AD
AG
AL
A F
INA
NC
E P
LC
AN
NU
AL
RE
PO
RT
20
17
/1
8
30
Strengths
� Nearly 50 years of operational expertise
� Skilled, well trained and experienced human capital
� Robust risk management system
� Healthy capital adequacy ratios
� Healthy liquid asset levels
� Strategically located network of branches and service centres
� Internally developed IT system replete with a solid database, an MIS system and an online banking platform tailor-made to our specific needs
� Loyal customer base and high customer retention
How strengths were leveraged/built upon to
create value
� Built a loyal customer base capitalising on the unblemished operational record of the Company
� Continuous training and development programs to enhance technical skills of the work force
� Proactive risk management to optimise risk return tradeoff
� Raised Rs. 579.8 Mn. via a rights issue to further strengthen the capital adequacy position
� Facilitated business growth with smooth business functions
� Widening the reach to tap into customers in segments that were unexplored
� Meeting customer expectations with speedy service while retaining centralised controls to ensure a healthy financial position
� Enabled repeat business and improving cross sell ratio
� 38.8% of the existing fixed deposit customers have been with the Company for 5 years or more.
Weaknesses
� Rapid expansion of the branch network pressurising profitability
� Challenges in maintaining operational efficiency
� High emphasis and concentration on traditional product lines
� High emphasis and concentration on borrowings to finance new business growth
� Slow growth in the deposit base
How weaknesses were overcome/converted to create value
� Limited the number of new branches/centres opened during the year to 5, giving emphasis to breaking even in these branches
� High turnover from recent business growth improved the Cost to Income ratio to 51.6%
� Setting KPIs in relation to the cost to income ratio
� Promoting new product lines such as savings, pawning, and foreign currency operations
� Procuring low cost borrowings to finance the growth during the year
� Issuing listed debentures to balance the encumbered to unencumbered portfolio mix
� Promoted deposits as a cost effective funding tool
� Introducing 15 and 18 months tenure fixed deposits to attract price sensitive customers
� Introduced KPIs and performance incentives to promote deposit growth
Leveraging strengthsto create value
Overcoming weaknessesto create value
Trusted Strategy SWOT analysis

AN
NU
AL
RE
PO
RT
20
17
/1
8 S
EN
KA
DA
GA
LA
FIN
AN
CE
PL
C
31
TR
US
TE
D S
TR
AT
EG
Y
Opportunities
� Boom in certain economic sectors
� Future economic growth
� Infrastructure developments
� Growth in the financial services sector
� Changes in investor preference to regular income products as opposed to high risk equity investments
� Technological developments and substantial use of ICT in businesses
How opportunities were capitalised/built upon to create value
� Emphasis was given to promote business in identified economic sectors such as construction and tourism to reap the benefits of growth
� Identified untapped markets and opened new branches/centres in various locations to capitalise on the economic developments
� Focused business promotions to support services and related industries
� Promoted business growth to capitalise on the developments in the industry
� Promoted fixed deposit products
� Introduced new tenures for FD products
� System developments are ongoing to introduce latest developments in ICT to enhance the customer experience and operational efficiency
� New technologically-driven products are developed to tap in to the tech savvy customer segments
� Streamlined the interest rates offered for FDs to better match market trends and customer demand
Threats
� Increasing trend in market interest rates
� Improved customer awareness and increasing price sensitivity
� Intense competition due to increased number of participants in leasing business
� Exposure to the high risk segments of the market
� Increasing job opportunities to skilled and trained staff and changing demographics
� Various regulatory restrictions
� Deteriorating asset quality
How we responded/mitigated the impact to create value
� Procured long term low cost funding to fix the cost of borrowing at a lower rate
� Streamlined the funding structure to exploit the increasing trend in customer deposits
� Introduced new value added services coupled with products to stand out from the crowd
� Product differentiation and identified niche market segments for business
� Maintained stringent customer screening processes
� Strengthened recovery process
� Developed customer relations to identify potential defaults in advances
� Provided growth opportunities to skilled staff members within the Company
� Mapped career progression lines for employees with potential within the Company
� Internal skilled staff were promoted to fill the vacancies in the new branches/centres opened
� Strengthened the compliance function � Promoted business on registered vehicles as
opposed to the unregistered segment
Capitalising on opportunities to create value
Responding to threats to create value
SE
NK
AD
AG
AL
A F
INA
NC
E P
LC
AN
NU
AL
RE
PO
RT
20
17
/1
8
32
TR
US
TE
D S
TR
AT
EG
Y Strategic focuses
The Company’s intention has always been to identify needs
that are material to its shareholders and ensure that by
delivering value to them, the Company too will yield value.
This in turn propels the Company forward and ensures
sustainable operations. The following are the strategies that
are currently being pursued.
Achieving sustainable growth
Early in the year, the Company concluded a Rights issue of
7,247,506 shares for a value of Rs. 579.8 Mn. This issue
helped maintain the Core Capital ratio at 16.86% as opposed
to 14.19% of last year. This ensured that capital ratios well
above the regulatory requirement were maintained.
The management hopes to establish its 100th branch within
the first few months of the financial year 2018/19. Thereby
expanding the reach of the Company by exploiting untapped
market segments.
In March 2018, the Company secured a USD 15 Mn. funding
line from the IFC. This is the second time the member of the
World Bank Group extended funding to Senkadagala Finance
PLC. This is one among many efforts the Company has made
to gain better access to institutional credit and low cost
customer deposits to acquire a cost efficient funding base.
Upholding stakeholder primacy
During the year, the Company made the noteworthy
achievement of increasing its deposit base by 31.5%.
This accomplishment exceeds the objective set at the outset
of the year. Hence, the Company has been able to secure a
loyal customer base by promoting customer satisfaction.
Internal promotions were granted to high performing
employees when new branches were opened during the
year. This helped the management establish internal controls
and promote corporate culture. This also helped retain teams
of loyal employees.
This year, around 21% of new advances have been granted
towards promoting women and women entrepreneurs.
By 2020, the Company also plans to increase the credit
dedicated for women to Rs. 7 Bn. Thereby improving banking
for women and women-owned SMEs.
Tech forward
The Company introduced its new corporate website during
the year which is equipped with a user-friendly interface
and online banking facilities. Development is underway to
launch a mobile app, equipped with further value addition,
within the next financial year. These initiatives will reduce
operational costs, increase efficiency and enhance the
customer experience.
AN
NU
AL
RE
PO
RT
20
17
/1
8 S
EN
KA
DA
GA
LA
FIN
AN
CE
PL
C
33
Stakeholder Engagement
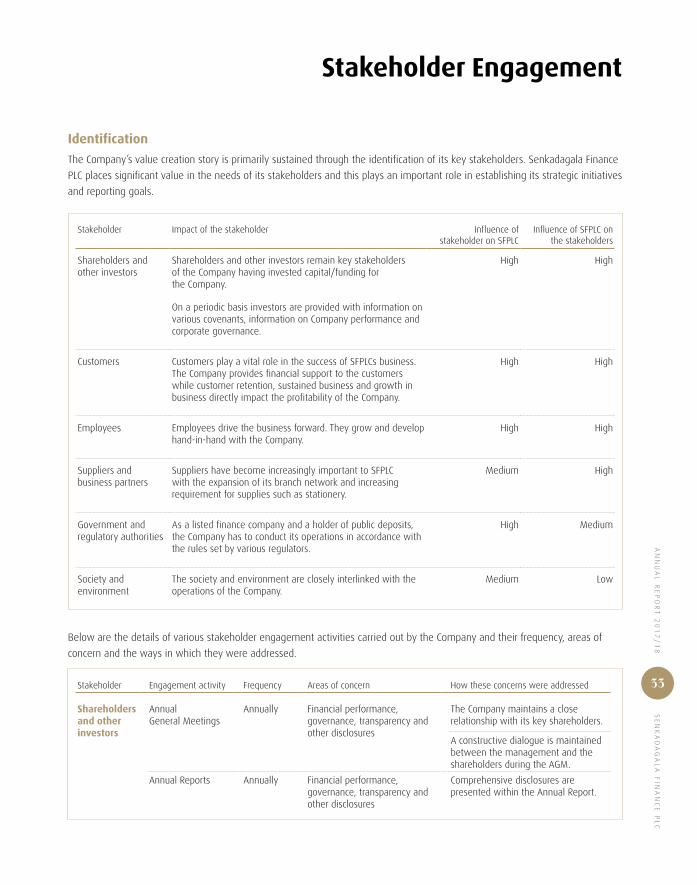
Identification
The Company’s value creation story is primarily sustained through the identification of its key stakeholders. Senkadagala Finance
PLC places significant value in the needs of its stakeholders and this plays an important role in establishing its strategic initiatives
and reporting goals.
Stakeholder Impact of the stakeholder Influence of stakeholder on SFPLC
Influence of SFPLC on the stakeholders
Shareholders and other investors
Shareholders and other investors remain key stakeholders of the Company having invested capital/funding for the Company.
High High
On a periodic basis investors are provided with information on various covenants, information on Company performance and corporate governance.
Customers Customers play a vital role in the success of SFPLCs business. The Company provides financial support to the customers while customer retention, sustained business and growth in business directly impact the profitability of the Company.
High High
Employees Employees drive the business forward. They grow and develop hand-in-hand with the Company.
High High
Suppliers and business partners
Suppliers have become increasingly important to SFPLC with the expansion of its branch network and increasing requirement for supplies such as stationery.
Medium High
Government and regulatory authorities
As a listed finance company and a holder of public deposits, the Company has to conduct its operations in accordance with the rules set by various regulators.
High Medium
Society and environment
The society and environment are closely interlinked with the operations of the Company.
Medium Low
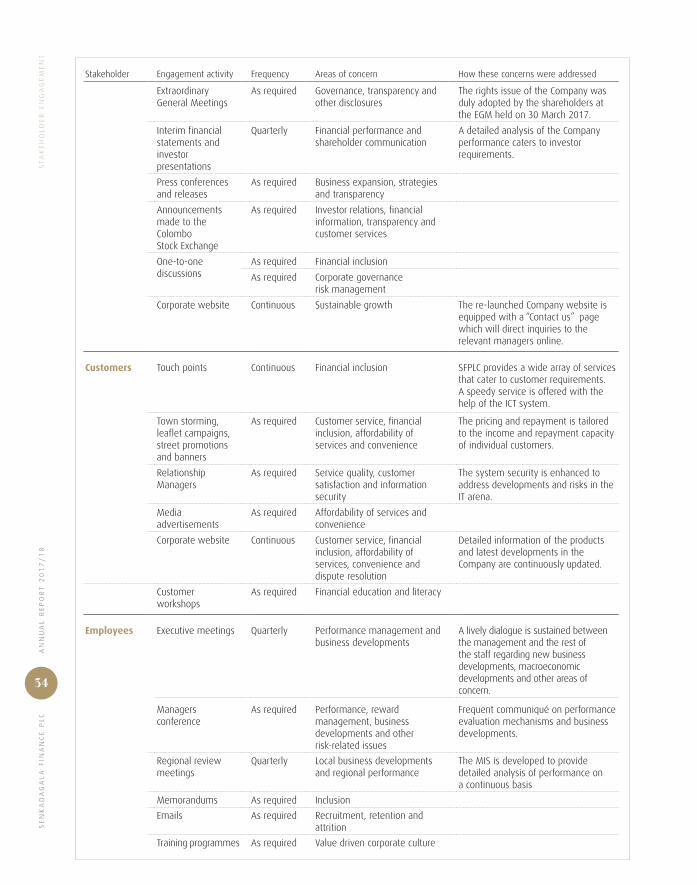
Below are the details of various stakeholder engagement activities carried out by the Company and their frequency, areas of
concern and the ways in which they were addressed.
Stakeholder Engagement activity Frequency Areas of concern How these concerns were addressed
Shareholders and other investors
AnnualGeneral Meetings
Annually Financial performance, governance, transparency and other disclosures
The Company maintains a close relationship with its key shareholders.
A constructive dialogue is maintained between the management and the shareholders during the AGM.
Annual Reports Annually Financial performance, governance, transparency and other disclosures
Comprehensive disclosures are presented within the Annual Report.
SE
NK
AD
AG
AL
A F
INA
NC
E P
LC
AN
NU
AL
RE
PO
RT
20
17
/1
8
34
ST
AK
EH
OL
DE
R E
NG
AG
EM
EN
T
Stakeholder Engagement activity Frequency Areas of concern How these concerns were addressed
Extraordinary General Meetings
As required Governance, transparency and other disclosures
The rights issue of the Company was duly adopted by the shareholders at the EGM held on 30 March 2017.
Interim financial statements andinvestor presentations
Quarterly Financial performance and shareholder communication
A detailed analysis of the Company performance caters to investor requirements.
Press conferences and releases
As required Business expansion, strategies and transparency
Announcements made to the ColomboStock Exchange
As required Investor relations, financial information, transparency and customer services
One-to-one discussions
As required Financial inclusion
As required Corporate governancerisk management
Corporate website Continuous Sustainable growth The re-launched Company website is equipped with a “Contact us” page which will direct inquiries to the relevant managers online.
Customers Touch points Continuous Financial inclusion SFPLC provides a wide array of services that cater to customer requirements. A speedy service is offered with the help of the ICT system.
Town storming, leaflet campaigns, street promotions and banners
As required Customer service, financial inclusion, affordability of services and convenience
The pricing and repayment is tailored to the income and repayment capacity of individual customers.
Relationship Managers
As required Service quality, customer satisfaction and information security
The system security is enhanced to address developments and risks in the IT arena.
Media advertisements
As required Affordability of services and convenience
Corporate website Continuous Customer service, financial inclusion, affordability of services, convenience and dispute resolution
Detailed information of the products and latest developments in the Company are continuously updated.
Customer workshops
As required Financial education and literacy
Employees Executive meetings Quarterly Performance management and business developments
A lively dialogue is sustained between the management and the rest of the staff regarding new business developments, macroeconomic developments and other areas of concern.
Managers conference
As required Performance, reward management, business developments and other risk-related issues
Frequent communiqué on performance evaluation mechanisms and business developments.
Regional review meetings
Quarterly Local business developments and regional performance
The MIS is developed to provide detailed analysis of performance on a continuous basis
Memorandums As required Inclusion
Emails As required Recruitment, retention and attrition
Training programmes As required Value driven corporate culture
AN
NU
AL
RE
PO
RT
20
17
/1
8 S
EN
KA
DA
GA
LA
FIN
AN
CE
PL
C
35
ST
AK
EH
OL
DE
R E
NG
AG
EM
EN
T
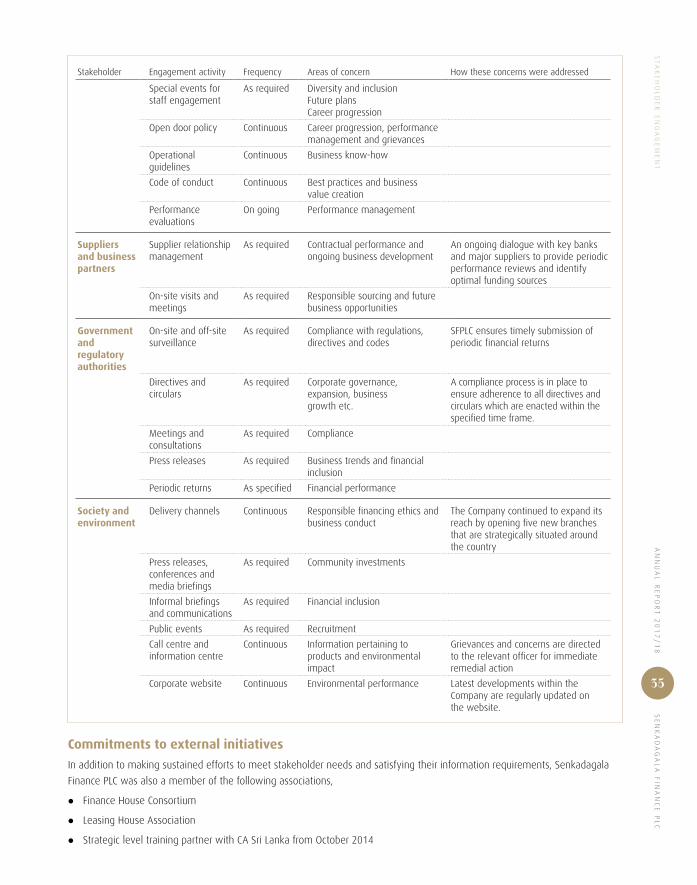
Stakeholder Engagement activity Frequency Areas of concern How these concerns were addressed
Special events for staff engagement
As required Diversity and inclusionFuture plans Career progression
Open door policy Continuous Career progression, performance management and grievances
Operational guidelines
Continuous Business know-how
Code of conduct Continuous Best practices and business value creation
Performance evaluations
On going Performance management
Suppliers and business partners
Supplier relationship management
As required Contractual performance and ongoing business development
An ongoing dialogue with key banks and major suppliers to provide periodic performance reviews and identify optimal funding sources
On-site visits and meetings
As required Responsible sourcing and future business opportunities
Government and regulatory authorities
On-site and off-site surveillance
As required Compliance with regulations, directives and codes
SFPLC ensures timely submission of periodic financial returns
Directives and circulars
As required Corporate governance, expansion, business growth etc.
A compliance process is in place to ensure adherence to all directives and circulars which are enacted within the specified time frame.
Meetings and consultations
As required Compliance
Press releases As required Business trends and financial inclusion
Periodic returns As specified Financial performance
Society and environment
Delivery channels Continuous Responsible financing ethics and business conduct
The Company continued to expand its reach by opening five new branches that are strategically situated around the country
Press releases, conferences and media briefings
As required Community investments
Informal briefings and communications
As required Financial inclusion
Public events As required Recruitment
Call centre and information centre
Continuous Information pertaining to products and environmental impact
Grievances and concerns are directed to the relevant officer for immediate remedial action
Corporate website Continuous Environmental performance Latest developments within the Company are regularly updated on the website.
Commitments to external initiatives
In addition to making sustained efforts to meet stakeholder needs and satisfying their information requirements, Senkadagala
Finance PLC was also a member of the following associations,
z Finance House Consortium
z Leasing House Association
z Strategic level training partner with CA Sri Lanka from October 2014
SE
NK
AD
AG
AL
A F
INA
NC
E P
LC
AN
NU
AL
RE
PO
RT
20
17
/1
8
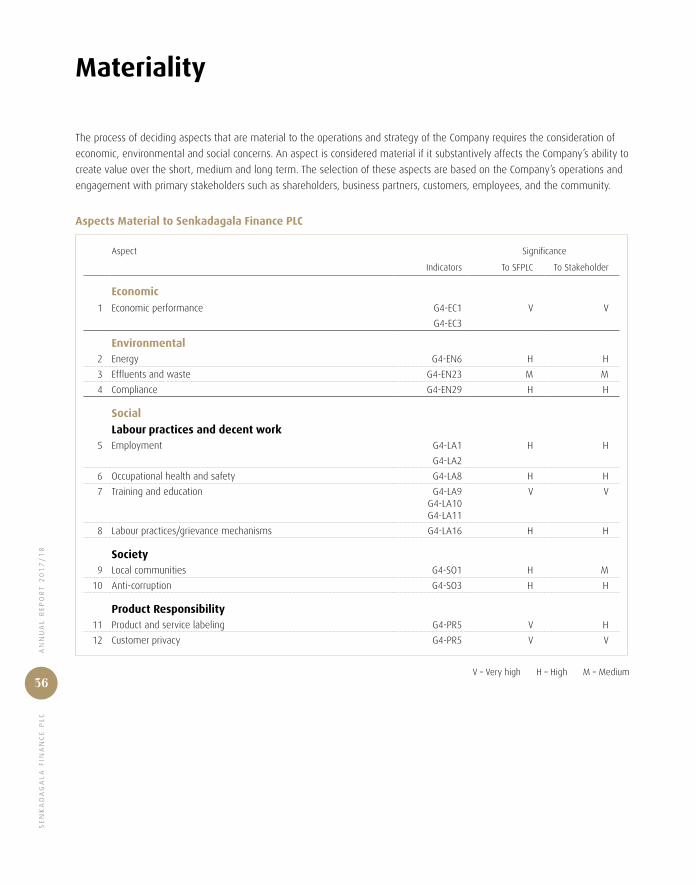
36
The process of deciding aspects that are material to the operations and strategy of the Company requires the consideration of
economic, environmental and social concerns. An aspect is considered material if it substantively affects the Company’s ability to
create value over the short, medium and long term. The selection of these aspects are based on the Company’s operations and
engagement with primary stakeholders such as shareholders, business partners, customers, employees, and the community.
Aspects Material to Senkadagala Finance PLC
Aspect Significance
Indicators To SFPLC To Stakeholder
Economic 1 Economic performance G4-EC1 V V
G4-EC3
Environmental2 Energy G4-EN6 H H
3 Effluents and waste G4-EN23 M M
4 Compliance G4-EN29 H H
Social
Labour practices and decent work 5 Employment G4-LA1 H H
G4-LA2
6 Occupational health and safety G4-LA8 H H
7 Training and education G4-LA9G4-LA10G4-LA11
V V
8 Labour practices/grievance mechanisms G4-LA16 H H
Society 9 Local communities G4-SO1 H M
10 Anti-corruption G4-SO3 H H
Product Responsibility 11 Product and service labeling G4-PR5 V H
12 Customer privacy G4-PR5 V V
V – Very high H – High M – Medium
Materiality
AN
NU
AL
RE
PO
RT
20
17
/1
8 S
EN
KA
DA
GA
LA
FIN
AN
CE
PL
C
37
MA
TE
RIA
LIT
Y
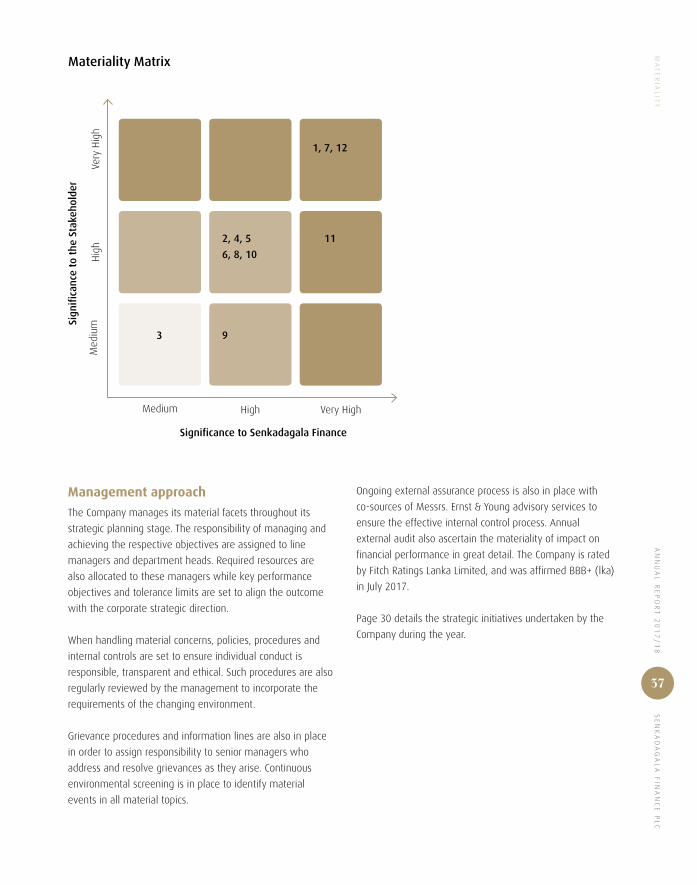
Significance to Senkadagala Finance
Materiality MatrixSi
gnif
ican
ce t
o th
e St
akeh
olde
r
Very HighHigh
Hig
h
Medium
Med
ium
Very
Hig
h
1, 7, 12
112, 4, 5
6, 8, 10
93
Management approach
The Company manages its material facets throughout its
strategic planning stage. The responsibility of managing and
achieving the respective objectives are assigned to line
managers and department heads. Required resources are
also allocated to these managers while key performance
objectives and tolerance limits are set to align the outcome
with the corporate strategic direction.
When handling material concerns, policies, procedures and
internal controls are set to ensure individual conduct is
responsible, transparent and ethical. Such procedures are also
regularly reviewed by the management to incorporate the
requirements of the changing environment.
Grievance procedures and information lines are also in place
in order to assign responsibility to senior managers who
address and resolve grievances as they arise. Continuous
environmental screening is in place to identify material
events in all material topics.
Ongoing external assurance process is also in place with
co-sources of Messrs. Ernst & Young advisory services to
ensure the effective internal control process. Annual
external audit also ascertain the materiality of impact on
financial performance in great detail. The Company is rated
by Fitch Ratings Lanka Limited, and was affirmed BBB+ (lka)
in July 2017.
Page 30 details the strategic initiatives undertaken by the
Company during the year.

SE
NK
AD
AG
AL
A F
INA
NC
E P
LC
AN
NU
AL
RE
PO
RT
20
17
/1
8
38
Value Creation and Capital Formation
40 51 53Financial
CapitalInstitutional
CapitalCustomer
Capital

AN
NU
AL
RE
PO
RT
20
17
/1
8 S
EN
KA
DA
GA
LA
FIN
AN
CE
PL
C
39
60 68 70Employee
CapitalSocial and
Environmental Capital
Shareholder & investor
Capital
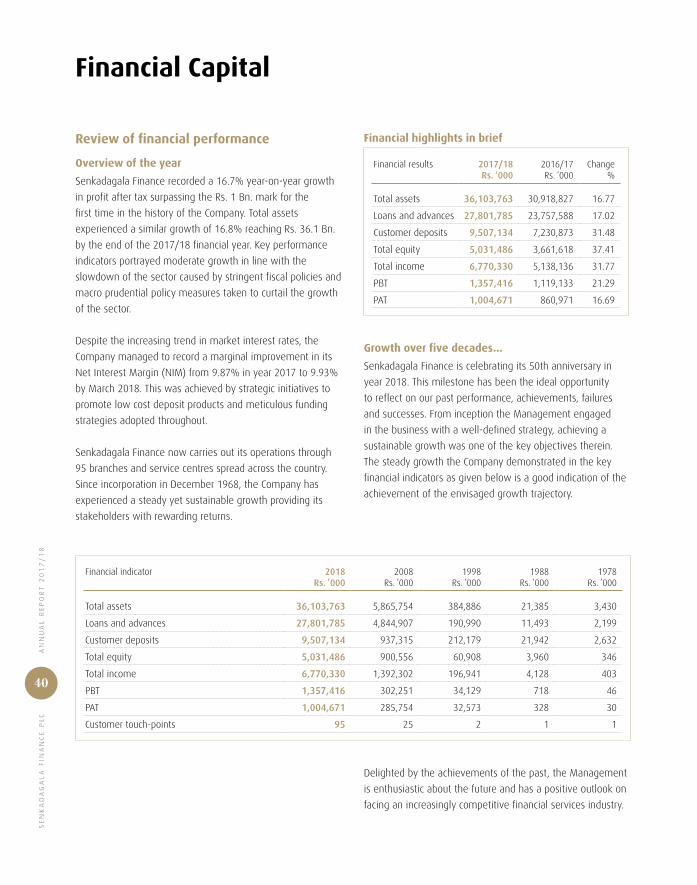
SE
NK
AD
AG
AL
A F
INA
NC
E P
LC
AN
NU
AL
RE
PO
RT
20
17
/1
8
40
Financial Capital
Review of financial performance
Overview of the year
Senkadagala Finance recorded a 16.7% year-on-year growth
in profit after tax surpassing the Rs. 1 Bn. mark for the
first time in the history of the Company. Total assets
experienced a similar growth of 16.8% reaching Rs. 36.1 Bn.
by the end of the 2017/18 financial year. Key performance
indicators portrayed moderate growth in line with the
slowdown of the sector caused by stringent fiscal policies and
macro prudential policy measures taken to curtail the growth
of the sector.
Despite the increasing trend in market interest rates, the
Company managed to record a marginal improvement in its
Net Interest Margin (NIM) from 9.87% in year 2017 to 9.93%
by March 2018. This was achieved by strategic initiatives to
promote low cost deposit products and meticulous funding
strategies adopted throughout.
Senkadagala Finance now carries out its operations through
95 branches and service centres spread across the country.
Since incorporation in December 1968, the Company has
experienced a steady yet sustainable growth providing its
stakeholders with rewarding returns.
Financial highlights in brief
Financial results 2017/18Rs. ‘000
2016/17Rs. ‘000
Change%
Total assets 36,103,763 30,918,827 16.77
Loans and advances 27,801,785 23,757,588 17.02
Customer deposits 9,507,134 7,230,873 31.48
Total equity 5,031,486 3,661,618 37.41
Total income 6,770,330 5,138,136 31.77
PBT 1,357,416 1,119,133 21.29
PAT 1,004,671 860,971 16.69
Growth over five decades…
Senkadagala Finance is celebrating its 50th anniversary in
year 2018. This milestone has been the ideal opportunity
to reflect on our past performance, achievements, failures
and successes. From inception the Management engaged
in the business with a well-defined strategy, achieving a
sustainable growth was one of the key objectives therein.
The steady growth the Company demonstrated in the key
financial indicators as given below is a good indication of the
achievement of the envisaged growth trajectory.
Financial indicator 2018Rs. ’000
2008Rs. ’000
1998Rs. ’000
1988Rs. ’000
1978Rs. ’000
Total assets 36,103,763 5,865,754 384,886 21,385 3,430
Loans and advances 27,801,785 4,844,907 190,990 11,493 2,199
Customer deposits 9,507,134 937,315 212,179 21,942 2,632
Total equity 5,031,486 900,556 60,908 3,960 346
Total income 6,770,330 1,392,302 196,941 4,128 403
PBT 1,357,416 302,251 34,129 718 46
PAT 1,004,671 285,754 32,573 328 30
Customer touch-points 95 25 2 1 1
Delighted by the achievements of the past, the Management
is enthusiastic about the future and has a positive outlook on
facing an increasingly competitive financial services industry.
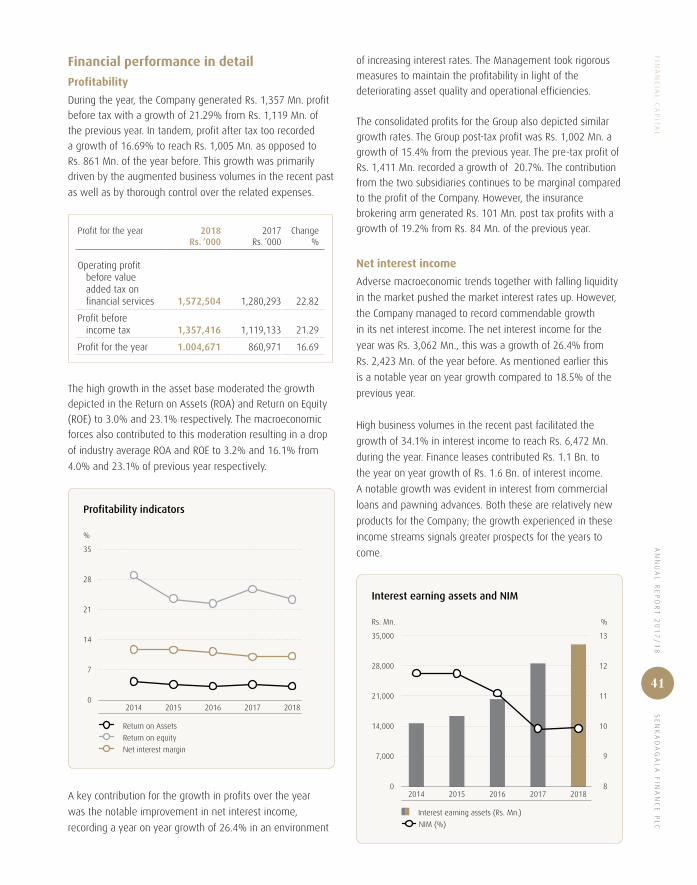
AN
NU
AL
RE
PO
RT
20
17
/1
8 S
EN
KA
DA
GA
LA
FIN
AN
CE
PL
C
41
FIN
AN
CIA
L C
AP
ITA
L
Financial performance in detail
Profitability
During the year, the Company generated Rs. 1,357 Mn. profit
before tax with a growth of 21.29% from Rs. 1,119 Mn. of
the previous year. In tandem, profit after tax too recorded
a growth of 16.69% to reach Rs. 1,005 Mn. as opposed to
Rs. 861 Mn. of the year before. This growth was primarily
driven by the augmented business volumes in the recent past
as well as by thorough control over the related expenses.
Profit for the year 2018Rs. ‘000
2017Rs. ‘000
Change%
Operating profit before value added tax on financial services 1,572,504 1,280,293 22.82
Profit before income tax 1,357,416 1,119,133 21.29
Profit for the year 1.004,671 860,971 16.69
The high growth in the asset base moderated the growth
depicted in the Return on Assets (ROA) and Return on Equity
(ROE) to 3.0% and 23.1% respectively. The macroeconomic
forces also contributed to this moderation resulting in a drop
of industry average ROA and ROE to 3.2% and 16.1% from
4.0% and 23.1% of previous year respectively.
Return on Assets
Return on equity
Net interest margin
Profitability indicators
35
28
21
14
7
0
%
20182014 2015 2016 2017
A key contribution for the growth in profits over the year
was the notable improvement in net interest income,
recording a year on year growth of 26.4% in an environment
of increasing interest rates. The Management took rigorous
measures to maintain the profitability in light of the
deteriorating asset quality and operational efficiencies.
The consolidated profits for the Group also depicted similar
growth rates. The Group post-tax profit was Rs. 1,002 Mn. a
growth of 15.4% from the previous year. The pre-tax profit of
Rs. 1,411 Mn. recorded a growth of 20.7%. The contribution
from the two subsidiaries continues to be marginal compared
to the profit of the Company. However, the insurance
brokering arm generated Rs. 101 Mn. post tax profits with a
growth of 19.2% from Rs. 84 Mn. of the previous year.
Net interest income
Adverse macroeconomic trends together with falling liquidity
in the market pushed the market interest rates up. However,
the Company managed to record commendable growth
in its net interest income. The net interest income for the
year was Rs. 3,062 Mn., this was a growth of 26.4% from
Rs. 2,423 Mn. of the year before. As mentioned earlier this
is a notable year on year growth compared to 18.5% of the
previous year.
High business volumes in the recent past facilitated the
growth of 34.1% in interest income to reach Rs. 6,472 Mn.
during the year. Finance leases contributed Rs. 1.1 Bn. to
the year on year growth of Rs. 1.6 Bn. of interest income.
A notable growth was evident in interest from commercial
loans and pawning advances. Both these are relatively new
products for the Company; the growth experienced in these
income streams signals greater prospects for the years to
come.
Interest earning assets (Rs. Mn.)
NIM (%)
Interest earning assets and NIM
35,000
28,000
21,000
14,000
7,000
0
Rs. Mn. %
20182014 2015 2016 2017
13
12
11
10
9
8

SE
NK
AD
AG
AL
A F
INA
NC
E P
LC
AN
NU
AL
RE
PO
RT
20
17
/1
8
42
FIN
AN
CIA
L C
AP
ITA
L Market interest rates were on the rise from the beginning of the year. Shifts in the funding mix also instigated changes in the composition of interest expenses. During the year, the total interest expenses increased to Rs. 3,410 Mn. compared to Rs. 2,402 Mn., a growth of 41.9%. Interest on bank and other securitised borrowings continued to be a key element of this expense category. However despite the sharp increase on customer deposits, the respective interest expense only increased by Rs. 295 Mn. This demonstrates the cost-effectiveness of deposits as a funding instrument.
Income
The total income of the Company increased to Rs. 6,770 Mn. a growth of 31.8% compared to Rs. 5,138 Mn. of the previous year. The fund-based income remained the key
contributing factor to the notable growth. Other income categories showed a drop of 4.6%. With the slowdown of business during the year, the fee-based income dropped by 27.7% to Rs. 100 Mn. compared to Rs. 139 Mn. of the year before.
The Company managed to record a growth in income from trading activities. Due to lackluster performance of equity market, gains from equity trading saw a drop of Rs. 1.2 Mn. Mark to market of tradable equity instruments generated a gain of Rs. 2 Mn. as opposed to a loss of Rs. 6 Mn. of the year before. The Company managed investment in units and money market instruments to compensate for the drop-in income from equity instruments, and thereby generated a gain of Rs. 5.5 Mn. This helped to record the growth in return from trading activities.
Sources and Utilisation of Income
2018Rs. ‘000 %
2017Rs. ‘000 %
Sources of income
Interest income from leases 4,320,975 63.82 3,205,693 62.39
Interest income from hire purchases 85,438 1.26 295,474 5.75
Interest income from other loans and advances 1,721,297 25.42 1,031,665 20.08
Interest income from Government Securities 99,981 1.48 88,819 1.73
Income from other investments 244,423 3.61 204,062 3.97
Fee and commission income 100,250 1.48 138,664 2.70
Other income 197,966 2.93 173,759 3.38
Total 6,770,330 5,138,136
Sources of Income 2018
Interest income from Leases
Interest income from other loans and advances
Income from other investments
Other income
Interest incomefrom Hire purchases
Interest income from government securities
Fee and commission income
2% 3%4%
1%
25%
1%
64%
Sources of Income 2017
Interest income from Leases
Interest income from other loans and advances
Income from other investments
Other income
Interest incomefrom Hire purchases
Interest income from government securities
Fee and commission income
3% 3%4%
2%
20%
6%62%
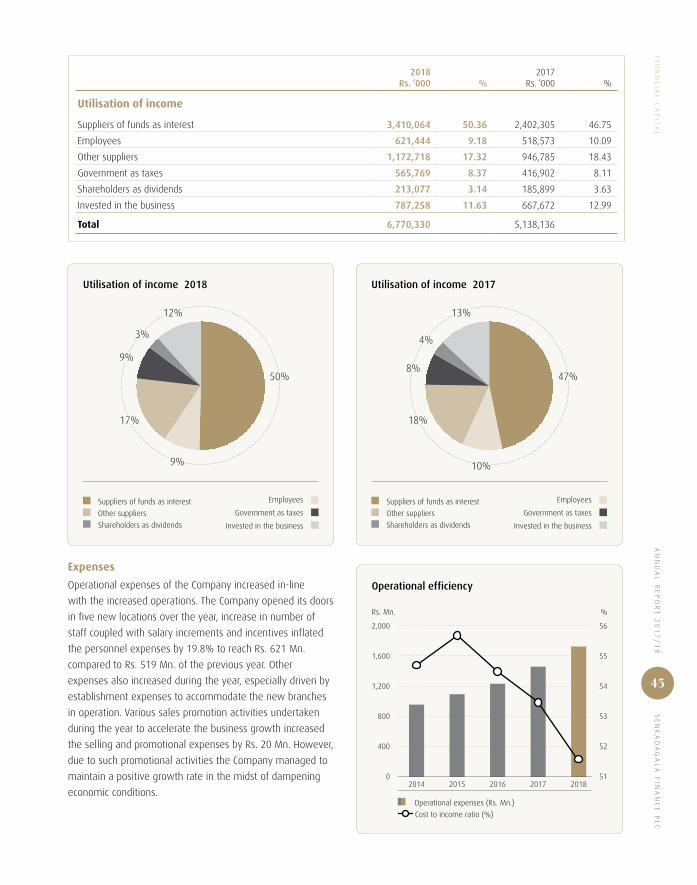
AN
NU
AL
RE
PO
RT
20
17
/1
8 S
EN
KA
DA
GA
LA
FIN
AN
CE
PL
C
43
FIN
AN
CIA
L C
AP
ITA
L
2018Rs. ‘000 %
2017Rs. ‘000 %
Utilisation of income
Suppliers of funds as interest 3,410,064 50.36 2,402,305 46.75
Employees 621,444 9.18 518,573 10.09
Other suppliers 1,172,718 17.32 946,785 18.43
Government as taxes 565,769 8.37 416,902 8.11
Shareholders as dividends 213,077 3.14 185,899 3.63
Invested in the business 787,258 11.63 667,672 12.99
Total 6,770,330 5,138,136
Expenses
Operational expenses of the Company increased in-line
with the increased operations. The Company opened its doors
in five new locations over the year, increase in number of
staff coupled with salary increments and incentives inflated
the personnel expenses by 19.8% to reach Rs. 621 Mn.
compared to Rs. 519 Mn. of the previous year. Other
expenses also increased during the year, especially driven by
establishment expenses to accommodate the new branches
in operation. Various sales promotion activities undertaken
during the year to accelerate the business growth increased
the selling and promotional expenses by Rs. 20 Mn. However,
due to such promotional activities the Company managed to
maintain a positive growth rate in the midst of dampening
economic conditions. Operational expenses (Rs. Mn.)
Cost to income ratio (%)
Operational efficiency
2,000
1,600
1,200
800
400
0
Rs. Mn. %
20182014 2015 2016 2017
56
55
54
53
52
51
Utilisation of income 2018
Suppliers of funds as interest
Other suppliers
Shareholders as dividends
Employees
Government as taxes
Invested in the business
3%
12%
9%
17%
9%
50%
Utilisation of income 2017
Suppliers of funds as interest
Other suppliers
Shareholders as dividends
Employees
Government as taxes
Invested in the business
4%
13%
8%
18%
10%
47%
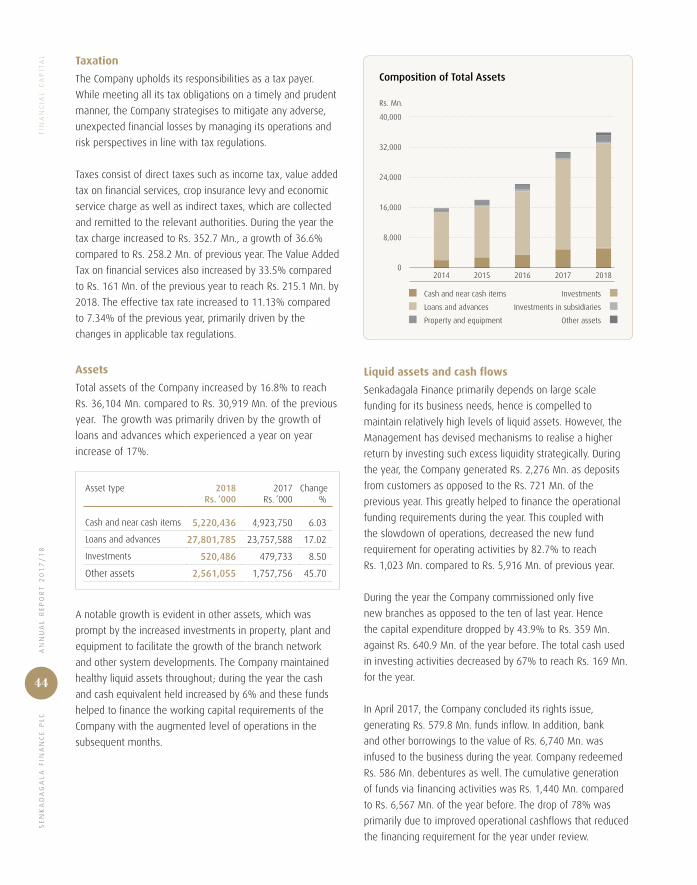
SE
NK
AD
AG
AL
A F
INA
NC
E P
LC
AN
NU
AL
RE
PO
RT
20
17
/1
8
44
FIN
AN
CIA
L C
AP
ITA
L Taxation
The Company upholds its responsibilities as a tax payer.
While meeting all its tax obligations on a timely and prudent
manner, the Company strategises to mitigate any adverse,
unexpected financial losses by managing its operations and
risk perspectives in line with tax regulations.
Taxes consist of direct taxes such as income tax, value added
tax on financial services, crop insurance levy and economic
service charge as well as indirect taxes, which are collected
and remitted to the relevant authorities. During the year the
tax charge increased to Rs. 352.7 Mn., a growth of 36.6%
compared to Rs. 258.2 Mn. of previous year. The Value Added
Tax on financial services also increased by 33.5% compared
to Rs. 161 Mn. of the previous year to reach Rs. 215.1 Mn. by
2018. The effective tax rate increased to 11.13% compared
to 7.34% of the previous year, primarily driven by the
changes in applicable tax regulations.
Assets
Total assets of the Company increased by 16.8% to reach
Rs. 36,104 Mn. compared to Rs. 30,919 Mn. of the previous
year. The growth was primarily driven by the growth of
loans and advances which experienced a year on year
increase of 17%.
Asset type 2018Rs. ‘000
2017Rs. ‘000
Change%
Cash and near cash items 5,220,436 4,923,750 6.03
Loans and advances 27,801,785 23,757,588 17.02
Investments 520,486 479,733 8.50
Other assets 2,561,055 1,757,756 45.70
A notable growth is evident in other assets, which was
prompt by the increased investments in property, plant and
equipment to facilitate the growth of the branch network
and other system developments. The Company maintained
healthy liquid assets throughout; during the year the cash
and cash equivalent held increased by 6% and these funds
helped to finance the working capital requirements of the
Company with the augmented level of operations in the
subsequent months.
Cash and near cash items
Loans and advances
Property and equipment
Investments
Investments in subsidiaries
Other assets
Composition of Total Assets
40,000
32,000
24,000
16,000
8,000
0
Rs. Mn.
20172014 2015 2016 2018
Liquid assets and cash flows
Senkadagala Finance primarily depends on large scale
funding for its business needs, hence is compelled to
maintain relatively high levels of liquid assets. However, the
Management has devised mechanisms to realise a higher
return by investing such excess liquidity strategically. During
the year, the Company generated Rs. 2,276 Mn. as deposits
from customers as opposed to the Rs. 721 Mn. of the
previous year. This greatly helped to finance the operational
funding requirements during the year. This coupled with
the slowdown of operations, decreased the new fund
requirement for operating activities by 82.7% to reach
Rs. 1,023 Mn. compared to Rs. 5,916 Mn. of previous year.
During the year the Company commissioned only five
new branches as opposed to the ten of last year. Hence
the capital expenditure dropped by 43.9% to Rs. 359 Mn.
against Rs. 640.9 Mn. of the year before. The total cash used
in investing activities decreased by 67% to reach Rs. 169 Mn.
for the year.
In April 2017, the Company concluded its rights issue,
generating Rs. 579.8 Mn. funds inflow. In addition, bank
and other borrowings to the value of Rs. 6,740 Mn. was
infused to the business during the year. Company redeemed
Rs. 586 Mn. debentures as well. The cumulative generation
of funds via financing activities was Rs. 1,440 Mn. compared
to Rs. 6,567 Mn. of the year before. The drop of 78% was
primarily due to improved operational cashflows that reduced
the financing requirement for the year under review.

AN
NU
AL
RE
PO
RT
20
17
/1
8 S
EN
KA
DA
GA
LA
FIN
AN
CE
PL
C
45
FIN
AN
CIA
L C
AP
ITA
L
The cash and other liquid assets grew by 6% over the year.
High volumes of liquid assets were held to finance the
increased level of operations. The Government Securities held
by the Company increased by Rs. 1,972 Mn. to accommodate
the regulatory requirements for the rising customer deposits.
Additional liquid assets were invested in commercial banks
and other short-term investments to maximise the return
during the year.
Composition of liquid assets
Cash and cash equivalents
Deposits with licensed commercial banks
Repurchase agreements
Treasury bills and bonds
15%18%
56%
11%
Loans and advances
Loan type 2018Rs. ‘000
2017Rs. ‘000
Change%
Finance leases 23,887,237 20,014,694 19.35
Hire purchase 162,468 645,872 (74.85)
Commercial loans 2,145,243 2,059,388 4.17
Pawning advances 993,680 548,403 81.20
Other advances 613,157 489,231 25.33
The total loans and advances grew by 17% over the year
reaching Rs. 27,802 Mn. against Rs. 23,758 Mn. of the
previous year. This is a commendable growth as it was
recorded amidst stringent adverse macroprudential policy
measures. During the calendar year, the LFC and SLC sector
only achieved a 9.8% growth in loans and advances.
The key loan product, finance leases achieved a growth
of 19.4% to reach Rs. 23,887 Mn. net of impairment. This
is a slowdown from the 43.2% growth achieved in the
previous year. During the year Rs. 14.9 Bn. was granted as
new finance leases and the average loan to value (LTV) of
such loans was to 61.79%. The Company primarily finances
registered vehicles, hence Senkadagala Finance managed
to withstand the crippling effects of the stringent LTV ratios
imposed by the regulator.
The commercial loans experienced a notable slowdown
compared to its Rs. 1.7 Bn. growth of the previous year,
primarily due to the higher interest rates that prevailed
and the general economic downturn. During the year, the
commercial loans only recorded a growth of 4.17%. However,
the return on the existing portfolio, 28.6% significantly
contributed to the growth in the profitability for the year.
Finance leases
Commercial loans
Pawning advances
Hire purchases
Personal loans
Other advances
Growth of loans advances
30,000
24,000
18,000
12,000
6,000
0
Rs. Mn.
20172014 2015 2016 2018
Pawning, the latest addition to the loan portfolio of the
Company recorded a growth of 81.2% to reach Rs. 993.7 Mn.
over Rs. 548.4 Mn. of previous year. Regardless of the
speculations of price fluctuations, the Company promoted
the pawning business. Stringent LTV ratios were maintained
to safeguard against any such price fluctuations in the
immediate future. The return on pawning portfolio for the
year was 17.8%.

SE
NK
AD
AG
AL
A F
INA
NC
E P
LC
AN
NU
AL
RE
PO
RT
20
17
/1
8
46
FIN
AN
CIA
L C
AP
ITA
L Asset quality
From inception of business, the Management has
considered maintaining the quality of the loan portfolio
a strategic imperative since this has been considered a
key aspect in achieving sustainable business growth. With
continuous upgrade of credit appraisal systems, post sanction
monitoring mechanisms, policies and procedures, the
Company has managed to maintain one of the lowest NPA
ratios in the industry.
During the year, due to adverse weather conditions and the
general downturn of the economic conditions increased
the gross NPA ratio of the industry to 5.9% from 5.3% of
the previous year. The Company’s Gross NPL, which is gross
non-performing assets as a percentage of total advances,
increased to 2.28% compared to 1.64% of the previous year.
The net NPL ratio too followed a similar trend to reach 0.71%
compared to 0.29% of the year before.
The Company maintained high provisions to remedy the
increase in non-performing loans over the year. The total
impairment provision for loans and advances increased by
30.4% to reach Rs. 448.5 Mn. for the year compared to
Rs. 343.8 Mn. of the previous year. Major increase in
provision was recorded in individually significant loans,
which recorded a growth of Rs. 83.9 Mn. Rs. 104.7 Mn.
was charged to the profit and loss account as impairment
on loans and advances as opposed to Rs. 25.6 Mn. of the
year before. However, Rs. 49 Mn. worth of other loan losses
were reversed as opposed to Rs. 33 Mn. of previous year, an
improvement of 49.5%.
Non performing advances (Rs.Mn.)
Gross NPA ratio (%)
Net NPA ratio (%)
Asset quality
Rs. Mn. %
20182014 2015 2016 2017
5
4
3
2
1
0
750
600
450
300
150
0
Changes in impairment methodology
From the ensuing financial year, the Company will adopt LKRS 9,
Financial Instruments to account for loans and advances.
Accordingly, the impairment is expected to increase as the new
standard requires providing for loan losses based on expected
loss model as opposed to the incurred loss model followed
now. Preliminary calculations are been carried out to assess the
impact on the bottom-line. The Management is committed to
maintain the capital ratios and other key indicators at optimal
levels despite the outcome of the exercise.
Deposits from customers
Debentures
Other liabilities
Borrowings
Deferred tax liability
Liabilities
35,000
28,000
21,000
14,000
7,000
0
Rs. Mn.
20172014 2015 2016 2018
Liabilities
The total liabilities of the Company grew by 14% to reach Rs.
31,072 Mn. compared to Rs. 27,257 Mn. of 2017. Mid to long
term securitised loans account for Rs. 8,309 Mn. compared
to Rs. 4,845 Mn. of the year before, a growth of 71.5%. Mid
to long-term bank borrowings decreased by 14% to reach
Rs. 6,009 Mn. by the year end. The short term commercial
paper financing also reduced by 45% and dropped to
Rs. 1,058 Mn., to better match the maturities of the asset
base of the Company. The volatile market conditions that
prevailed throughout the year prompted the move-away form
short-term funding avenues.
In March 2018, the Company entered into a second loan
agreement with the International Finance Corporations (IFC),
for USD 15 Mn. equivalent in rupees. The fund flow at the
end of the year inflated the liquid assets at the balance
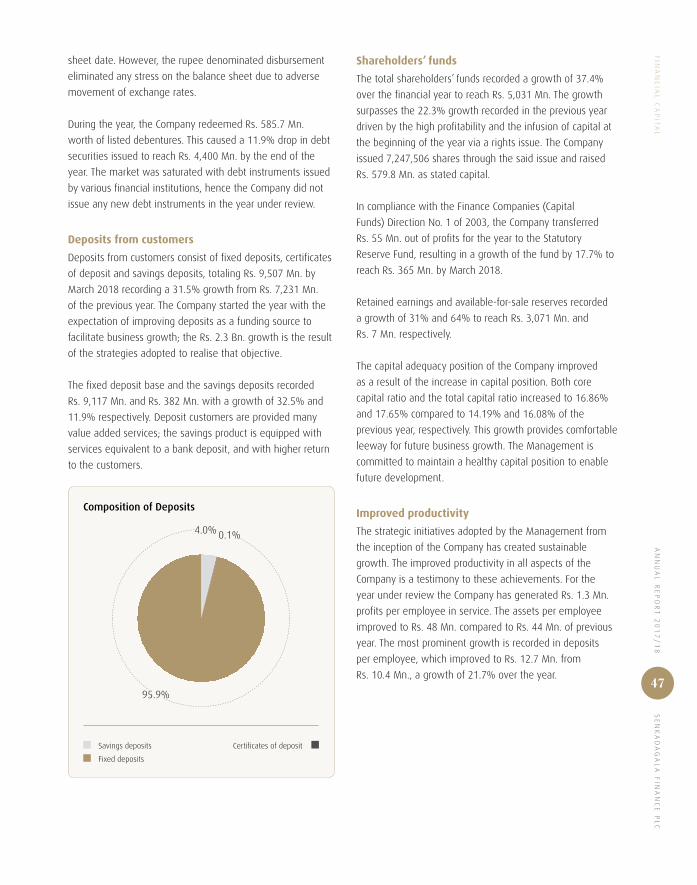
AN
NU
AL
RE
PO
RT
20
17
/1
8 S
EN
KA
DA
GA
LA
FIN
AN
CE
PL
C
47
FIN
AN
CIA
L C
AP
ITA
L
sheet date. However, the rupee denominated disbursement
eliminated any stress on the balance sheet due to adverse
movement of exchange rates.
During the year, the Company redeemed Rs. 585.7 Mn.
worth of listed debentures. This caused a 11.9% drop in debt
securities issued to reach Rs. 4,400 Mn. by the end of the
year. The market was saturated with debt instruments issued
by various financial institutions, hence the Company did not
issue any new debt instruments in the year under review.
Deposits from customers
Deposits from customers consist of fixed deposits, certificates
of deposit and savings deposits, totaling Rs. 9,507 Mn. by
March 2018 recording a 31.5% growth from Rs. 7,231 Mn.
of the previous year. The Company started the year with the
expectation of improving deposits as a funding source to
facilitate business growth; the Rs. 2.3 Bn. growth is the result
of the strategies adopted to realise that objective.
The fixed deposit base and the savings deposits recorded
Rs. 9,117 Mn. and Rs. 382 Mn. with a growth of 32.5% and
11.9% respectively. Deposit customers are provided many
value added services; the savings product is equipped with
services equivalent to a bank deposit, and with higher return
to the customers.
Composition of Deposits
Savings deposits
Fixed deposits
Certificates of deposit
0.1%4.0%
95.9%
Shareholders’ funds
The total shareholders’ funds recorded a growth of 37.4%
over the financial year to reach Rs. 5,031 Mn. The growth
surpasses the 22.3% growth recorded in the previous year
driven by the high profitability and the infusion of capital at
the beginning of the year via a rights issue. The Company
issued 7,247,506 shares through the said issue and raised
Rs. 579.8 Mn. as stated capital.
In compliance with the Finance Companies (Capital
Funds) Direction No. 1 of 2003, the Company transferred
Rs. 55 Mn. out of profits for the year to the Statutory
Reserve Fund, resulting in a growth of the fund by 17.7% to
reach Rs. 365 Mn. by March 2018.
Retained earnings and available-for-sale reserves recorded
a growth of 31% and 64% to reach Rs. 3,071 Mn. and
Rs. 7 Mn. respectively.
The capital adequacy position of the Company improved
as a result of the increase in capital position. Both core
capital ratio and the total capital ratio increased to 16.86%
and 17.65% compared to 14.19% and 16.08% of the
previous year, respectively. This growth provides comfortable
leeway for future business growth. The Management is
committed to maintain a healthy capital position to enable
future development.
Improved productivity
The strategic initiatives adopted by the Management from
the inception of the Company has created sustainable
growth. The improved productivity in all aspects of the
Company is a testimony to these achievements. For the
year under review the Company has generated Rs. 1.3 Mn.
profits per employee in service. The assets per employee
improved to Rs. 48 Mn. compared to Rs. 44 Mn. of previous
year. The most prominent growth is recorded in deposits
per employee, which improved to Rs. 12.7 Mn. from
Rs. 10.4 Mn., a growth of 21.7% over the year.
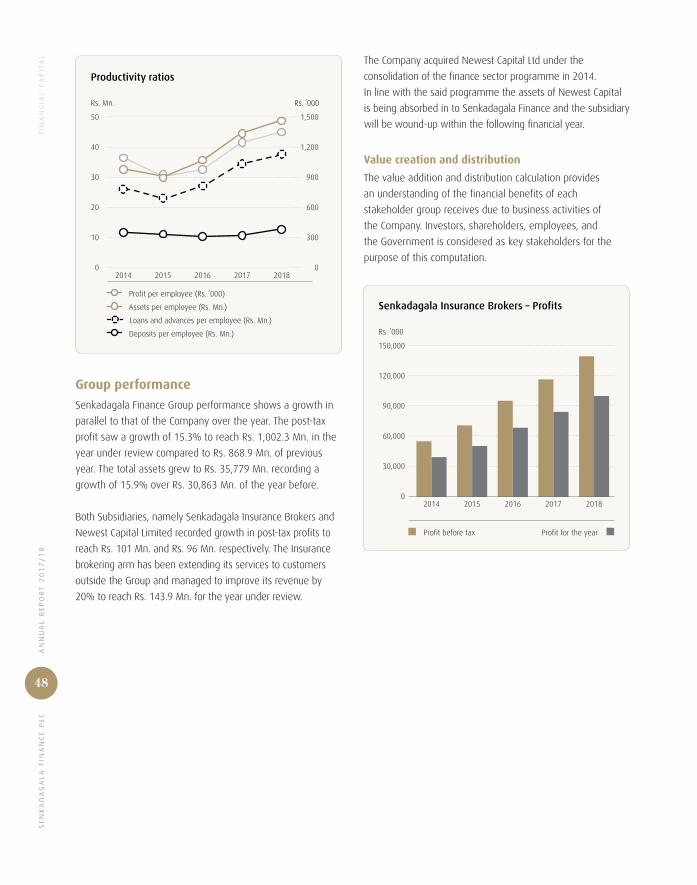
SE
NK
AD
AG
AL
A F
INA
NC
E P
LC
AN
NU
AL
RE
PO
RT
20
17
/1
8
48
FIN
AN
CIA
L C
AP
ITA
L
Rs. Mn. Rs. ’000
Profit per employee (Rs. ’000)
Assets per employee (Rs. Mn.)
Loans and advances per employee (Rs. Mn.)
Deposits per employee (Rs. Mn.)
Productivity ratios
50
40
30
20
10
0
1,500
1,200
900
600
300
020182014 2015 2016 2017
Group performance
Senkadagala Finance Group performance shows a growth in
parallel to that of the Company over the year. The post-tax
profit saw a growth of 15.3% to reach Rs. 1,002.3 Mn. in the
year under review compared to Rs. 868.9 Mn. of previous
year. The total assets grew to Rs. 35,779 Mn. recording a
growth of 15.9% over Rs. 30,863 Mn. of the year before.
Both Subsidiaries, namely Senkadagala Insurance Brokers and
Newest Capital Limited recorded growth in post-tax profits to
reach Rs. 101 Mn. and Rs. 96 Mn. respectively. The Insurance
brokering arm has been extending its services to customers
outside the Group and managed to improve its revenue by
20% to reach Rs. 143.9 Mn. for the year under review.
The Company acquired Newest Capital Ltd under the
consolidation of the finance sector programme in 2014.
In line with the said programme the assets of Newest Capital
is being absorbed in to Senkadagala Finance and the subsidiary
will be wound-up within the following financial year.
Value creation and distribution
The value addition and distribution calculation provides
an understanding of the financial benefits of each
stakeholder group receives due to business activities of
the Company. Investors, shareholders, employees, and
the Government is considered as key stakeholders for the
purpose of this computation.
Profit before tax Profit for the year
Senkadagala Insurance Brokers – Profits
150,000
120,000
90,000
60,000
30,000
0
Rs. ’000
2014 2015 20172016 2018
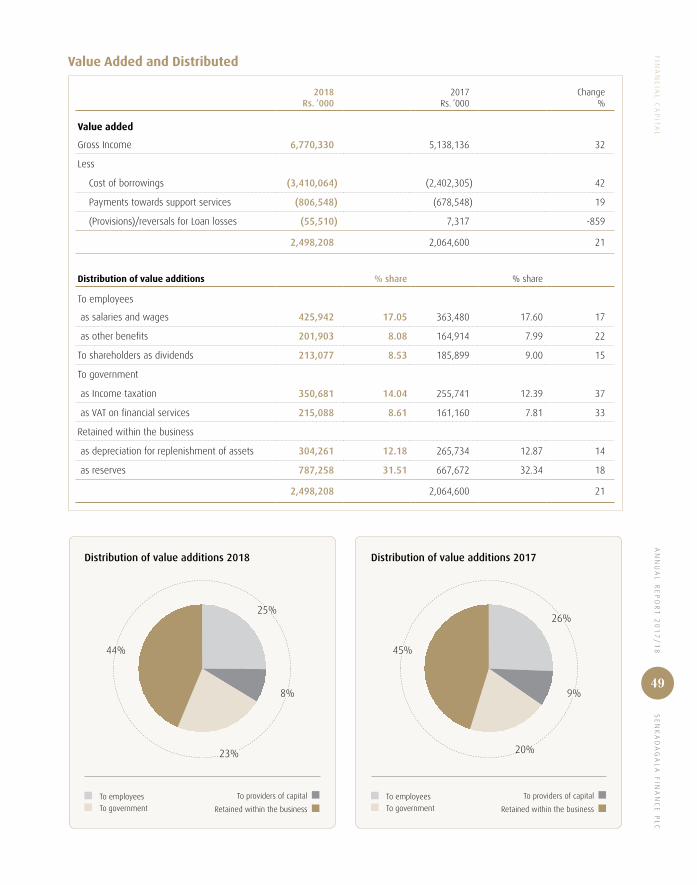
AN
NU
AL
RE
PO
RT
20
17
/1
8 S
EN
KA
DA
GA
LA
FIN
AN
CE
PL
C
49
FIN
AN
CIA
L C
AP
ITA
L
Value Added and Distributed
2018Rs. ‘000
2017Rs. ‘000
Change%
Value added
Gross Income 6,770,330 5,138,136 32
Less
Cost of borrowings (3,410,064) (2,402,305) 42
Payments towards support services (806,548) (678,548) 19
(Provisions)/reversals for Loan losses (55,510) 7,317 -859
2,498,208 2,064,600 21
Distribution of value additions % share % share
To employees
as salaries and wages 425,942 17.05 363,480 17.60 17
as other benefits 201,903 8.08 164,914 7.99 22
To shareholders as dividends 213,077 8.53 185,899 9.00 15
To government
as Income taxation 350,681 14.04 255,741 12.39 37
as VAT on financial services 215,088 8.61 161,160 7.81 33
Retained within the business
as depreciation for replenishment of assets 304,261 12.18 265,734 12.87 14
as reserves 787,258 31.51 667,672 32.34 18
2,498,208 2,064,600 21
Distribution of value additions 2018
To employees
To government
To providers of capital
Retained within the business
44%
8%
23%
25%
Distribution of value additions 2017
To employees
To government
To providers of capital
Retained within the business
45%
9%
20%
26%

SE
NK
AD
AG
AL
A F
INA
NC
E P
LC
AN
NU
AL
RE
PO
RT
20
17
/1
8
50
Sustainability to the foreAcknowledging all external factors that contribute towards the operations of the Company is one that has sustained its growth. It will propel the Company to greater heights.

AN
NU
AL
RE
PO
RT
20
17
/1
8 S
EN
KA
DA
GA
LA
FIN
AN
CE
PL
C
51
Institutional Capital
Throughout fifty years of operation, Senkadagala Finance PLC
built a sound institutional capital structure. These intangible
assets have enhanced stakeholder engagement while
creating a corporate culture and identity that is unique to
the Company.
As in the past, this year too the Company focused on
upgrading its ICT systems while carrying out plans to
establish the brand name and develop brand equity and
corporate culture.
System and Service Upgrades
The tailor-made ICT system continues to improve the
operations of the Company while providing customers ease
of access to information and services. The system was
developed internally and is equipped with a tailor-made
management information system unique to the Company. It
quickens the operations of both the front and back office and
it is estimated that its carrying value of licenses as indicated
in the balance sheet is Rs. 57 Mn. while the intrinsic value of
the system is immeasurable.
The system promptly addresses the operational needs of
employees while enhancing the customer experience. In
addition, it supports the finance division in carrying out
payments, receipting, and managing repossessed assets,
the general ledger and more importantly, Management
Information System (MIS) to meet internal and external
reporting needs. Through the automation of basic functions,
the Company is able to minimise user interactions and non-
value adding expenditure. It is also continuously upgraded
to be in line with technological changes and the needs of
customers and employees.
Senkadagala Finance PLC first launched its corporate website
in December 2003. During the year, under review the
Company revamped its website, in time to usher a new era
of growth. The present upgrades provide customers with a
user-friendly interface through which they can make online,
realtime fund transfers, utility bill payments etc., while also
getting additional information about products and services.
Revamped the Company web-site for an improved customer experience
The Company also introduced its new debit card during the financial year. It is equipped with security features, such as the chip and pin authentication, preventing the use of the card for POS transactions, if the card is stolen. Moreover, contactless transactions are allowed up to the value of Rs.3,000.
New VISA debit card with enhanced security features and contactless transaction facilities
Establishing the BrandThe Company’s logo, the registered trademark of the Company, depicts the four leaf clover - a symbol of prosperity and good fortune. It has accompanied Senkadagala Finance PLC’s corporate brand and identity since its inception and is now symbolic of the Company’s ethos which is one that gives priority to maintaining lasting relationships with all its stakeholders.
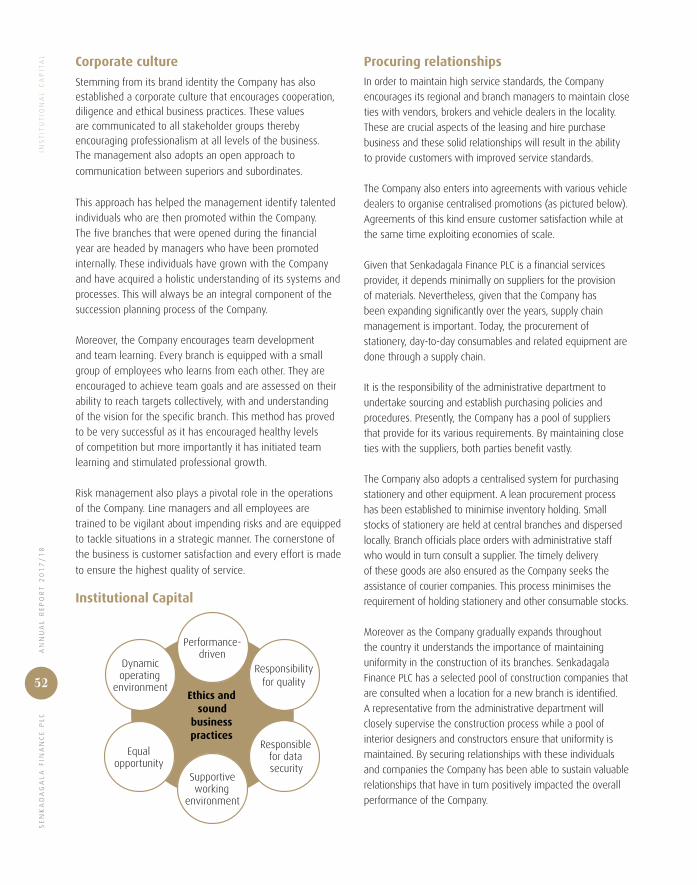
SE
NK
AD
AG
AL
A F
INA
NC
E P
LC
AN
NU
AL
RE
PO
RT
20
17
/1
8
52
INS
TIT
UT
ION
AL
CA
PIT
AL Corporate culture
Stemming from its brand identity the Company has also established a corporate culture that encourages cooperation, diligence and ethical business practices. These values are communicated to all stakeholder groups thereby encouraging professionalism at all levels of the business. The management also adopts an open approach to
communication between superiors and subordinates.
This approach has helped the management identify talented
individuals who are then promoted within the Company.
The five branches that were opened during the financial
year are headed by managers who have been promoted
internally. These individuals have grown with the Company
and have acquired a holistic understanding of its systems and
processes. This will always be an integral component of the
succession planning process of the Company.
Moreover, the Company encourages team development
and team learning. Every branch is equipped with a small
group of employees who learns from each other. They are
encouraged to achieve team goals and are assessed on their
ability to reach targets collectively, with and understanding
of the vision for the specific branch. This method has proved
to be very successful as it has encouraged healthy levels
of competition but more importantly it has initiated team
learning and stimulated professional growth.
Risk management also plays a pivotal role in the operations
of the Company. Line managers and all employees are
trained to be vigilant about impending risks and are equipped
to tackle situations in a strategic manner. The cornerstone of
the business is customer satisfaction and every effort is made
to ensure the highest quality of service.
Ethics and sound
business practices
Performance- driven
Responsibility for quality
Responsible for data security
Supportive working
environment
Equal opportunity
Dynamic operating
environment
Institutional Capital
Procuring relationshipsIn order to maintain high service standards, the Company
encourages its regional and branch managers to maintain close
ties with vendors, brokers and vehicle dealers in the locality.
These are crucial aspects of the leasing and hire purchase
business and these solid relationships will result in the ability
to provide customers with improved service standards.
The Company also enters into agreements with various vehicle
dealers to organise centralised promotions (as pictured below).
Agreements of this kind ensure customer satisfaction while at
the same time exploiting economies of scale.
Given that Senkadagala Finance PLC is a financial services
provider, it depends minimally on suppliers for the provision
of materials. Nevertheless, given that the Company has
been expanding significantly over the years, supply chain
management is important. Today, the procurement of
stationery, day-to-day consumables and related equipment are
done through a supply chain.
It is the responsibility of the administrative department to
undertake sourcing and establish purchasing policies and
procedures. Presently, the Company has a pool of suppliers
that provide for its various requirements. By maintaining close
ties with the suppliers, both parties benefit vastly.
The Company also adopts a centralised system for purchasing
stationery and other equipment. A lean procurement process
has been established to minimise inventory holding. Small
stocks of stationery are held at central branches and dispersed
locally. Branch officials place orders with administrative staff
who would in turn consult a supplier. The timely delivery
of these goods are also ensured as the Company seeks the
assistance of courier companies. This process minimises the
requirement of holding stationery and other consumable stocks.
Moreover as the Company gradually expands throughout
the country it understands the importance of maintaining
uniformity in the construction of its branches. Senkadagala
Finance PLC has a selected pool of construction companies that
are consulted when a location for a new branch is identified.
A representative from the administrative department will
closely supervise the construction process while a pool of
interior designers and constructors ensure that uniformity is
maintained. By securing relationships with these individuals
and companies the Company has been able to sustain valuable
relationships that have in turn positively impacted the overall
performance of the Company.
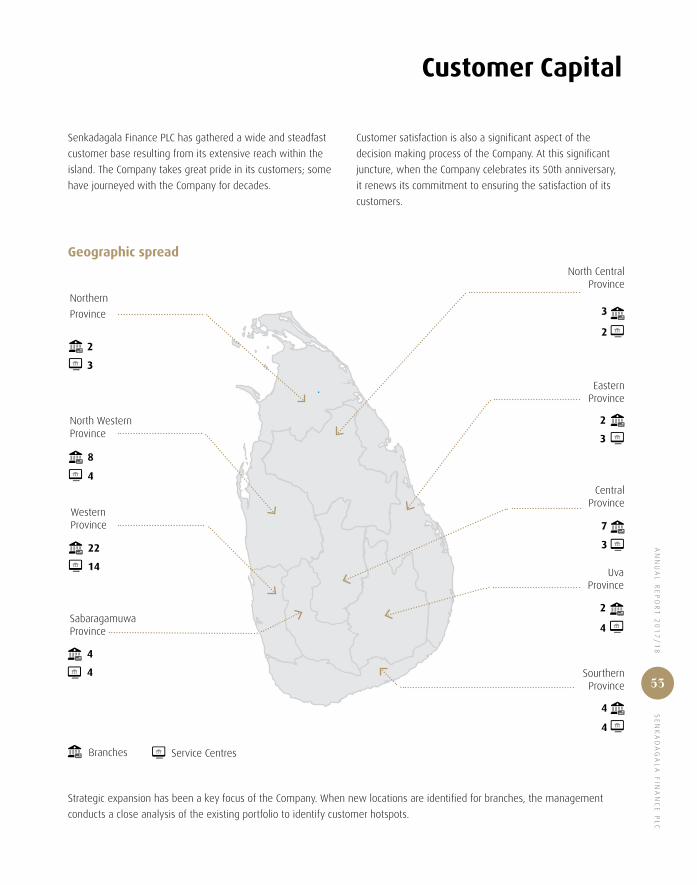
AN
NU
AL
RE
PO
RT
20
17
/1
8 S
EN
KA
DA
GA
LA
FIN
AN
CE
PL
C
53
Customer Capital
Senkadagala Finance PLC has gathered a wide and steadfast
customer base resulting from its extensive reach within the
island. The Company takes great pride in its customers; some
have journeyed with the Company for decades.
Customer satisfaction is also a significant aspect of the
decision making process of the Company. At this significant
juncture, when the Company celebrates its 50th anniversary,
it renews its commitment to ensuring the satisfaction of its
customers.
Geographic spread
Northern
Province
North Western Province
Western Province
Sabaragamuwa Province
Sourthern Province
Branches Service Centres
Uva Province
Central Province
Eastern Province
North Central Province
2
3
3
4
4
3
3
2
7
2
4
2
4
8
14
22
4
4
Strategic expansion has been a key focus of the Company. When new locations are identified for branches, the management
conducts a close analysis of the existing portfolio to identify customer hotspots.
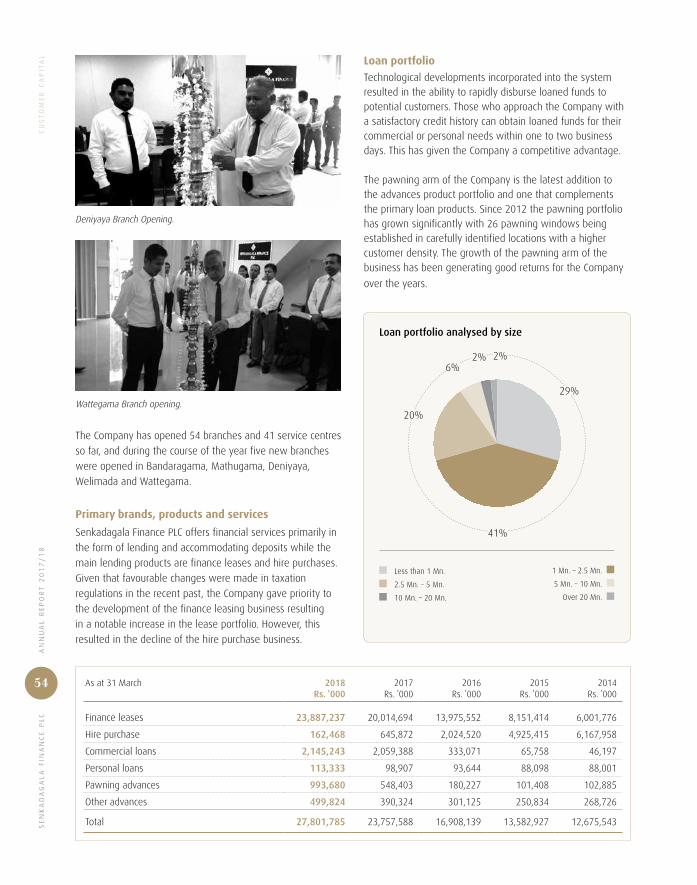
SE
NK
AD
AG
AL
A F
INA
NC
E P
LC
AN
NU
AL
RE
PO
RT
20
17
/1
8
54
CU
ST
OM
ER
CA
PIT
AL
Deniyaya Branch Opening.
Wattegama Branch opening.
The Company has opened 54 branches and 41 service centres
so far, and during the course of the year five new branches
were opened in Bandaragama, Mathugama, Deniyaya,
Welimada and Wattegama.
Primary brands, products and services
Senkadagala Finance PLC offers financial services primarily in
the form of lending and accommodating deposits while the
main lending products are finance leases and hire purchases.
Given that favourable changes were made in taxation
regulations in the recent past, the Company gave priority to
the development of the finance leasing business resulting
in a notable increase in the lease portfolio. However, this
resulted in the decline of the hire purchase business.
Loan portfolio
Technological developments incorporated into the system resulted in the ability to rapidly disburse loaned funds to potential customers. Those who approach the Company with a satisfactory credit history can obtain loaned funds for their commercial or personal needs within one to two business days. This has given the Company a competitive advantage.
The pawning arm of the Company is the latest addition to the advances product portfolio and one that complements the primary loan products. Since 2012 the pawning portfolio has grown significantly with 26 pawning windows being established in carefully identified locations with a higher customer density. The growth of the pawning arm of the business has been generating good returns for the Company
over the years.
As at 31 March 2018Rs. ’000
2017Rs. ’000
2016Rs. ’000
2015Rs. ’000
2014Rs. ’000
Finance leases 23,887,237 20,014,694 13,975,552 8,151,414 6,001,776
Hire purchase 162,468 645,872 2,024,520 4,925,415 6,167,958
Commercial loans 2,145,243 2,059,388 333,071 65,758 46,197
Personal loans 113,333 98,907 93,644 88,098 88,001
Pawning advances 993,680 548,403 180,227 101,408 102,885
Other advances 499,824 390,324 301,125 250,834 268,726
Total 27,801,785 23,757,588 16,908,139 13,582,927 12,675,543
Loan portfolio analysed by size
Less than 1 Mn.
2.5 Mn. – 5 Mn.
10 Mn. – 20 Mn.
1 Mn. – 2.5 Mn.
5 Mn. – 10 Mn.
Over 20 Mn.
6%2% 2%
20%
29%
41%

AN
NU
AL
RE
PO
RT
20
17
/1
8 S
EN
KA
DA
GA
LA
FIN
AN
CE
PL
C
55
CU
ST
OM
ER
CA
PIT
AL
Loan portfolio analysed by tenure
I year or less
2-3 years
4-5 years
1-2 years
3-4 years
Over 5 years
2% 3% 5%
36%
15%
39%
Geographical analysis of loans and advances
Central
North Central
Northern
Southern
Western
Eastern
North Western
Sabaragamuwa
Uva
11%
44%
3%
6%
10%
4%
10%
7%5%
Loan portfolio analysed by customer type
Male
Corporate customers
Female
4%
24%
72%
Deposit portfolio
Deposits are primarily accommodated through fixed deposits.
Sub-products of the category also exist to accommodate
the savings habits of different customer groups. Attractive
interest rates are also offered within the CBSL regulated rates.
Moreover, given that the Company revamped its website,
customers are able to use online facilities to check their
deposit balance, find out latest interest rates, transfer funds,
withdraw deposits and create new deposits. In addition,
the Company grants loans depending on the status of a
customer’s fixed deposits. This enables customers to utilise
funds in emergency cases without compromising the interest
at maturity.
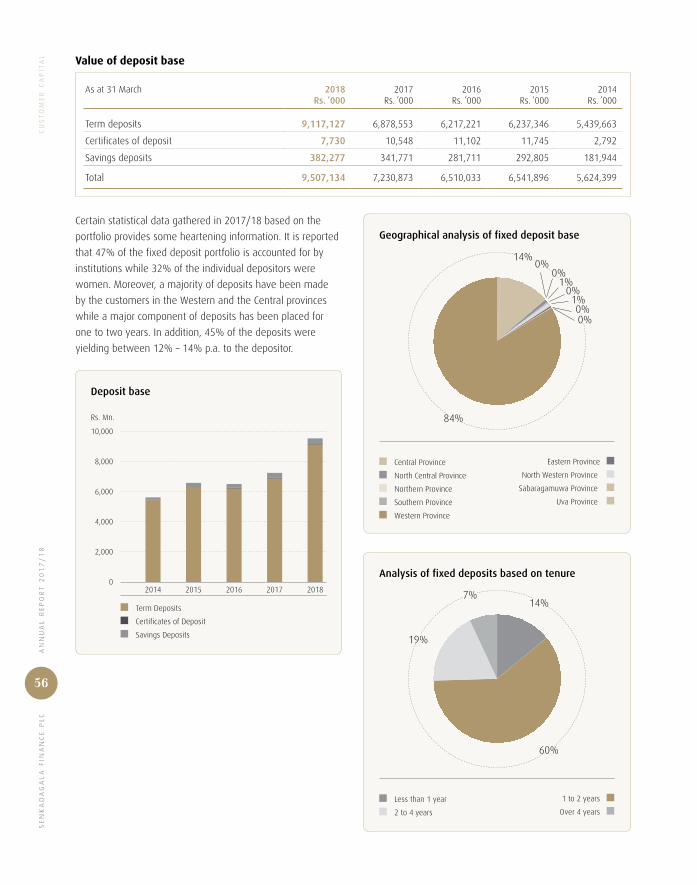
SE
NK
AD
AG
AL
A F
INA
NC
E P
LC
AN
NU
AL
RE
PO
RT
20
17
/1
8
56
CU
ST
OM
ER
CA
PIT
AL Value of deposit base
As at 31 March 2018Rs. ’000
2017Rs. ’000
2016Rs. ’000
2015Rs. ’000
2014Rs. ’000
Term deposits 9,117,127 6,878,553 6,217,221 6,237,346 5,439,663
Certificates of deposit 7,730 10,548 11,102 11,745 2,792
Savings deposits 382,277 341,771 281,711 292,805 181,944
Total 9,507,134 7,230,873 6,510,033 6,541,896 5,624,399
Certain statistical data gathered in 2017/18 based on the
portfolio provides some heartening information. It is reported
that 47% of the fixed deposit portfolio is accounted for by
institutions while 32% of the individual depositors were
women. Moreover, a majority of deposits have been made
by the customers in the Western and the Central provinces
while a major component of deposits has been placed for
one to two years. In addition, 45% of the deposits were
yielding between 12% – 14% p.a. to the depositor.
Term Deposits
Certificates of Deposit
Savings Deposits
Deposit base
10,000
8,000
6,000
4,000
2,000
0
Rs. Mn.
20182014 2015 2016 2017
Geographical analysis of fixed deposit base
Central Province
North Central Province
Northern Province
Southern Province
Western Province
Eastern Province
North Western Province
Sabaragamuwa Province
Uva Province
0%
1%0%0%
0%1%
0%
14%
84%
Analysis of fixed deposits based on tenure
Less than 1 year
2 to 4 years
1 to 2 years
Over 4 years
7%14%
19%
60%
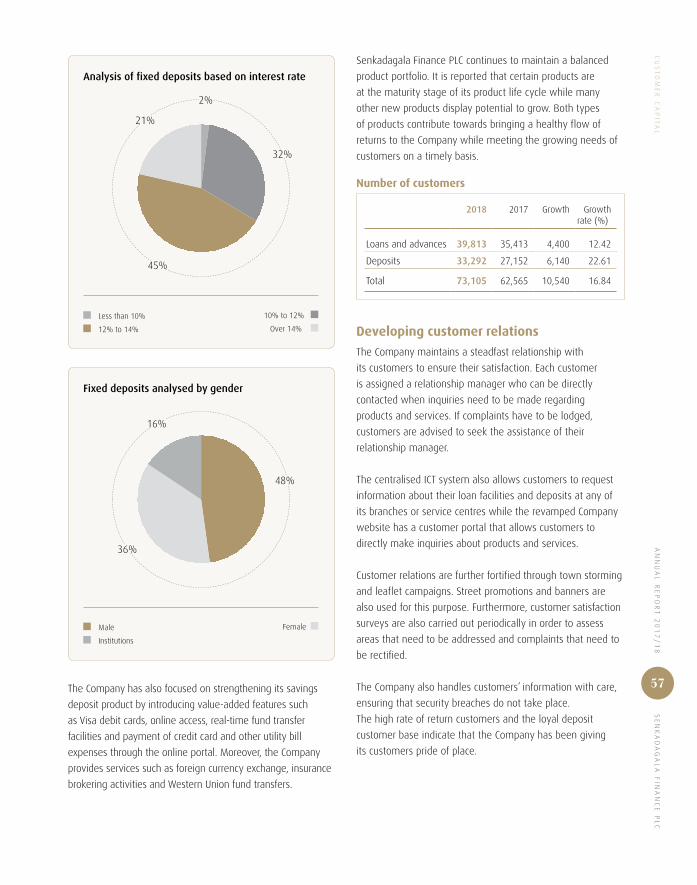
AN
NU
AL
RE
PO
RT
20
17
/1
8 S
EN
KA
DA
GA
LA
FIN
AN
CE
PL
C
57
CU
ST
OM
ER
CA
PIT
AL
Analysis of fixed deposits based on interest rate
Less than 10%
12% to 14%
10% to 12%
Over 14%
2%
32%
21%
45%
Fixed deposits analysed by gender
Male
Institutions
Female
16%
36%
48%
The Company has also focused on strengthening its savings
deposit product by introducing value-added features such
as Visa debit cards, online access, real-time fund transfer
facilities and payment of credit card and other utility bill
expenses through the online portal. Moreover, the Company
provides services such as foreign currency exchange, insurance
brokering activities and Western Union fund transfers.
Senkadagala Finance PLC continues to maintain a balanced
product portfolio. It is reported that certain products are
at the maturity stage of its product life cycle while many
other new products display potential to grow. Both types
of products contribute towards bringing a healthy flow of
returns to the Company while meeting the growing needs of
customers on a timely basis.
Number of customers
2018 2017 Growth Growth rate (%)
Loans and advances 39,813 35,413 4,400 12.42
Deposits 33,292 27,152 6,140 22.61
Total 73,105 62,565 10,540 16.84
Developing customer relations
The Company maintains a steadfast relationship with
its customers to ensure their satisfaction. Each customer
is assigned a relationship manager who can be directly
contacted when inquiries need to be made regarding
products and services. If complaints have to be lodged,
customers are advised to seek the assistance of their
relationship manager.
The centralised ICT system also allows customers to request
information about their loan facilities and deposits at any of
its branches or service centres while the revamped Company
website has a customer portal that allows customers to
directly make inquiries about products and services.
Customer relations are further fortified through town storming
and leaflet campaigns. Street promotions and banners are
also used for this purpose. Furthermore, customer satisfaction
surveys are also carried out periodically in order to assess
areas that need to be addressed and complaints that need to
be rectified.
The Company also handles customers’ information with care,
ensuring that security breaches do not take place.
The high rate of return customers and the loyal deposit
customer base indicate that the Company has been giving
its customers pride of place.
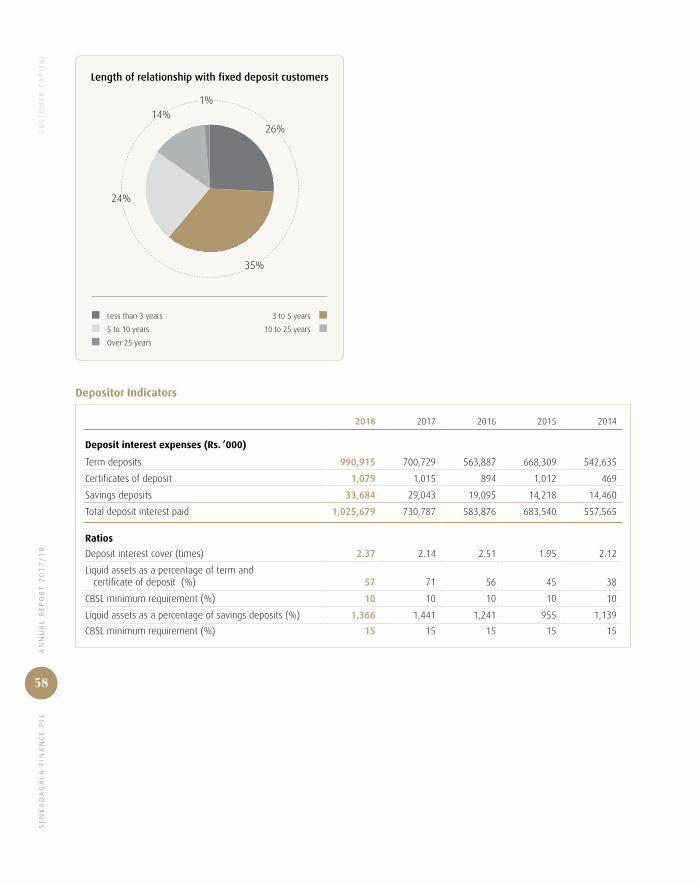
SE
NK
AD
AG
AL
A F
INA
NC
E P
LC
AN
NU
AL
RE
PO
RT
20
17
/1
8
58
CU
ST
OM
ER
CA
PIT
AL
Length of relationship with fixed deposit customers
Less than 3 years
5 to 10 years
Over 25 years
3 to 5 years
10 to 25 years
1%
26%14%
24%
35%
Depositor Indicators
2018 2017 2016 2015 2014
Deposit interest expenses (Rs. ’000)
Term deposits 990,915 700,729 563,887 668,309 542,635
Certificates of deposit 1,079 1,015 894 1,012 469
Savings deposits 33,684 29,043 19,095 14,218 14,460
Total deposit interest paid 1,025,679 730,787 583,876 683,540 557,565
Ratios
Deposit interest cover (times) 2.37 2.14 2.51 1.95 2.12
Liquid assets as a percentage of term and certificate of deposit (%) 57 71 56 45 38
CBSL minimum requirement (%) 10 10 10 10 10
Liquid assets as a percentage of savings deposits (%) 1,366 1,441 1,241 955 1,139
CBSL minimum requirement (%) 15 15 15 15 15

AN
NU
AL
RE
PO
RT
20
17
/1
8 S
EN
KA
DA
GA
LA
FIN
AN
CE
PL
C
59
Unwavering trustTrust is interwoven into the very fabric of the Company. It is a value that has secured the loyalty of all its stakeholders.

SE
NK
AD
AG
AL
A F
INA
NC
E P
LC
AN
NU
AL
RE
PO
RT
20
17
/1
8
60
Employee Capital
On arriving at its 50th anniversary, Senkadagala Finance PLC
looks back on the critical role its employees have played
throughout the years. The well being of the Company’s
employees has continuously played a significant role in the
decision making processes of the Company and will continue
to influence its mission and vision in the future.
The Company also ensures that all employee rights are
secure by adopting policies mentioned in the Wages Boards
Ordinance and Shop and Office Employees Act. It also adds
value to these compliance aspects by adopting an all-
inclusive approach, paying equal attention to its employees
regardless of gender, ethnicity, race, religion and disability.
Workforce analysis
Statistical analysis: geography, gender and age
It has been heartening to note the gradual increase of female
employees over the years. The 2% growth since last year, is
one that the Company hopes to build on in the coming years
as well. As in the past financial year, the most amount of
employees were from the Western and the Central Provinces.
However, as the Company continues to recruit from areas in
which it establishes new branches, growth has been reported
in the Eastern and the North Western provinces this year.
The statistics that indicate the ages of the employees remain
unchanged since last year while a higher number of those
recruited were qualified as diploma holders and graduates.
This has resulted in a growing number of senior executives,
executives and branch managers.
Gender analysis
Male Female
22%
78%
Geographical analysis
Central Province
North Central Province
North Western Province
Southern Province
Western Province
Eastern Province
Northern Province
Sabaragamuwa Province
Uva Province
42%
19%
4%6%
7%
8%
5%
4%
5%
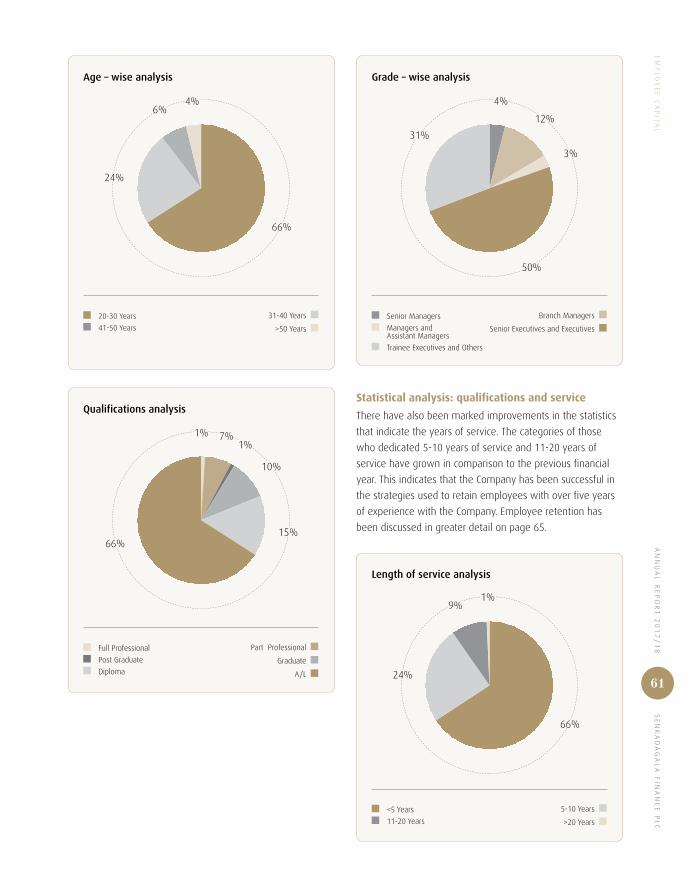
AN
NU
AL
RE
PO
RT
20
17
/1
8 S
EN
KA
DA
GA
LA
FIN
AN
CE
PL
C
61
EM
PL
OY
EE
CA
PIT
AL
Age – wise analysis
20-30 Years
41-50 Years
31-40 Years
>50 Years
24%
66%
6%4%
Qualifications analysis
Full Professional
Post Graduate
Diploma
Part Professional
Graduate
A/L
66%
7%
15%
10%
1%1%
Grade – wise analysis
Senior Managers
Managers and Assistant Managers
Trainee Executives and Others
Branch Managers
Senior Executives and Executives
50%
31%
3%
12%
4%
Statistical analysis: qualifications and service
There have also been marked improvements in the statistics
that indicate the years of service. The categories of those
who dedicated 5-10 years of service and 11-20 years of
service have grown in comparison to the previous financial
year. This indicates that the Company has been successful in
the strategies used to retain employees with over five years
of experience with the Company. Employee retention has
been discussed in greater detail on page 65.
Length of service analysis
<5 Years
11-20 Years
5-10 Years
>20 Years
24%
66%
9%1%
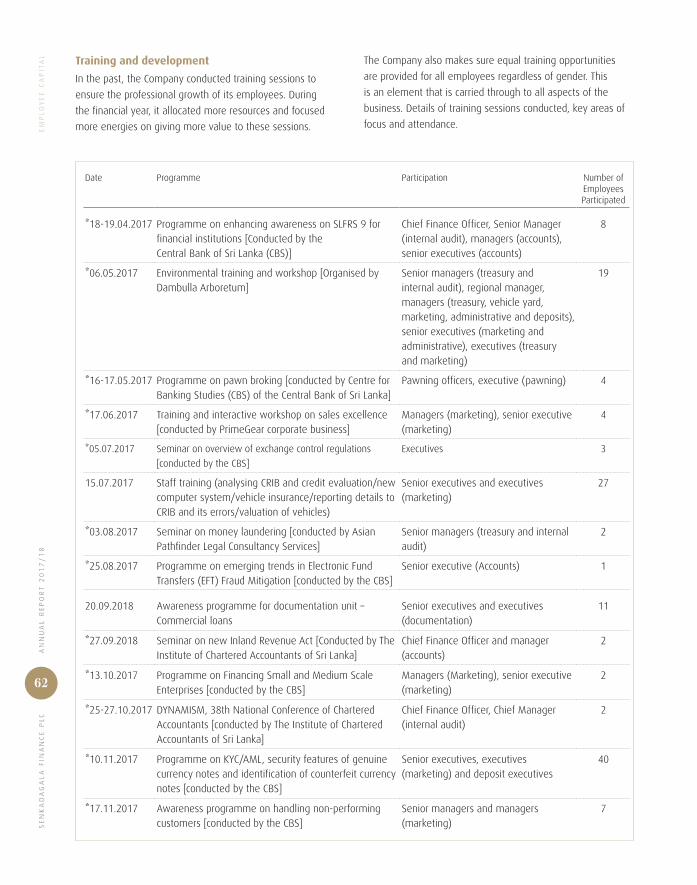
SE
NK
AD
AG
AL
A F
INA
NC
E P
LC
AN
NU
AL
RE
PO
RT
20
17
/1
8
62
EM
PL
OY
EE
CA
PIT
AL Training and development
In the past, the Company conducted training sessions to
ensure the professional growth of its employees. During
the financial year, it allocated more resources and focused
more energies on giving more value to these sessions.
Date Programme Participation Number of Employees Participated
*18-19.04.2017 Programme on enhancing awareness on SLFRS 9 for financial institutions [Conducted by the Central Bank of Sri Lanka (CBS)]
Chief Finance Officer, Senior Manager (internal audit), managers (accounts), senior executives (accounts)
8
*06.05.2017 Environmental training and workshop [Organised by Dambulla Arboretum]
Senior managers (treasury and internal audit), regional manager, managers (treasury, vehicle yard, marketing, administrative and deposits), senior executives (marketing and administrative), executives (treasury and marketing)
19
*16-17.05.2017 Programme on pawn broking [conducted by Centre for Banking Studies (CBS) of the Central Bank of Sri Lanka]
Pawning officers, executive (pawning) 4
*17.06.2017 Training and interactive workshop on sales excellence [conducted by PrimeGear corporate business]
Managers (marketing), senior executive (marketing)
4
*05.07.2017 Seminar on overview of exchange control regulations
[conducted by the CBS]
Executives 3
15.07.2017 Staff training (analysing CRIB and credit evaluation/new computer system/vehicle insurance/reporting details to CRIB and its errors/valuation of vehicles)
Senior executives and executives (marketing)
27
*03.08.2017 Seminar on money laundering [conducted by Asian Pathfinder Legal Consultancy Services]
Senior managers (treasury and internal audit)
2
*25.08.2017 Programme on emerging trends in Electronic Fund Transfers (EFT) Fraud Mitigation [conducted by the CBS]
Senior executive (Accounts) 1
20.09.2018 Awareness programme for documentation unit – Commercial loans
Senior executives and executives (documentation)
11
*27.09.2018 Seminar on new Inland Revenue Act [Conducted by The Institute of Chartered Accountants of Sri Lanka]
Chief Finance Officer and manager (accounts)
2
*13.10.2017 Programme on Financing Small and Medium Scale Enterprises [conducted by the CBS]
Managers (Marketing), senior executive (marketing)
2
*25-27.10.2017 DYNAMISM, 38th National Conference of Chartered Accountants [conducted by The Institute of Chartered Accountants of Sri Lanka]
Chief Finance Officer, Chief Manager (internal audit)
2
*10.11.2017 Programme on KYC/AML, security features of genuine currency notes and identification of counterfeit currency notes [conducted by the CBS]
Senior executives, executives (marketing) and deposit executives
40
*17.11.2017 Awareness programme on handling non-performing customers [conducted by the CBS]
Senior managers and managers (marketing)
7
The Company also makes sure equal training opportunities
are provided for all employees regardless of gender. This
is an element that is carried through to all aspects of the
business. Details of training sessions conducted, key areas of
focus and attendance.
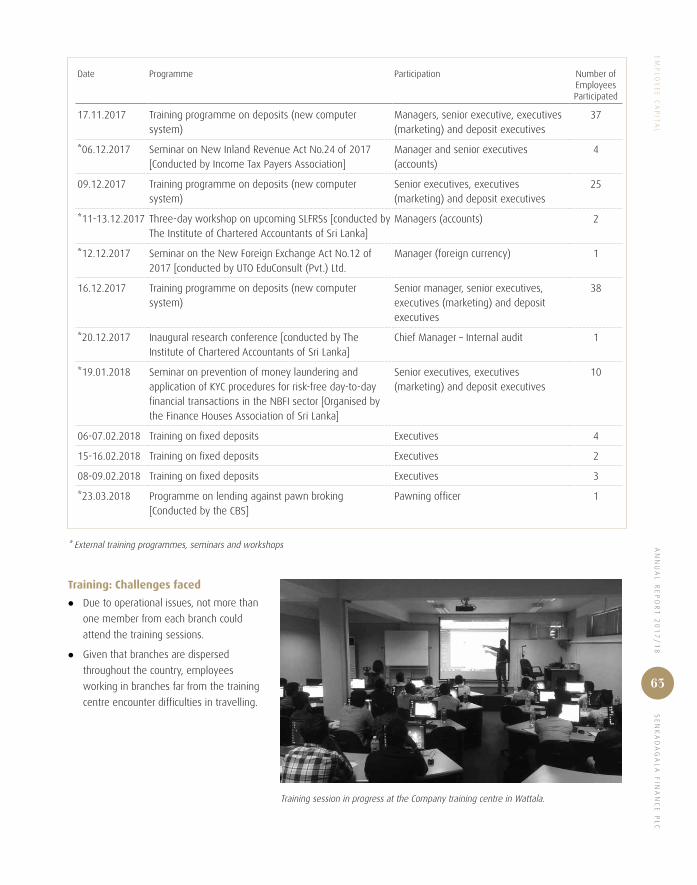
AN
NU
AL
RE
PO
RT
20
17
/1
8 S
EN
KA
DA
GA
LA
FIN
AN
CE
PL
C
63
EM
PL
OY
EE
CA
PIT
AL
Date Programme Participation Number of Employees Participated
17.11.2017 Training programme on deposits (new computer system)
Managers, senior executive, executives (marketing) and deposit executives
37
*06.12.2017 Seminar on New Inland Revenue Act No.24 of 2017 [Conducted by Income Tax Payers Association]
Manager and senior executives (accounts)
4
09.12.2017 Training programme on deposits (new computer system)
Senior executives, executives (marketing) and deposit executives
25
*11-13.12.2017 Three-day workshop on upcoming SLFRSs [conducted by The Institute of Chartered Accountants of Sri Lanka]
Managers (accounts) 2
*12.12.2017 Seminar on the New Foreign Exchange Act No.12 of 2017 [conducted by UTO EduConsult (Pvt.) Ltd.
Manager (foreign currency) 1
16.12.2017 Training programme on deposits (new computer system)
Senior manager, senior executives, executives (marketing) and deposit executives
38
*20.12.2017 Inaugural research conference [conducted by The Institute of Chartered Accountants of Sri Lanka]
Chief Manager – Internal audit 1
*19.01.2018 Seminar on prevention of money laundering and application of KYC procedures for risk-free day-to-day financial transactions in the NBFI sector [Organised by the Finance Houses Association of Sri Lanka]
Senior executives, executives (marketing) and deposit executives
10
06-07.02.2018 Training on fixed deposits Executives 4
15-16.02.2018 Training on fixed deposits Executives 2
08-09.02.2018 Training on fixed deposits Executives 3
*23.03.2018 Programme on lending against pawn broking [Conducted by the CBS]
Pawning officer 1
* External training programmes, seminars and workshops
Training: Challenges faced
z Due to operational issues, not more than
one member from each branch could
attend the training sessions.
z Given that branches are dispersed
throughout the country, employees
working in branches far from the training
centre encounter difficulties in travelling.
Training session in progress at the Company training centre in Wattala.

SE
NK
AD
AG
AL
A F
INA
NC
E P
LC
AN
NU
AL
RE
PO
RT
20
17
/1
8
64
EM
PL
OY
EE
CA
PIT
AL Recruitment
Statistical analysis
During the financial year, recruitments were carried out to
meet staff requirements in new and old branches. The total
number of recruits amounted to 174, with a majority of them
being from the Western Province. More than hundred of the
new recruits were designated the role of executive officers.
A vast majority of them were males.
Recruitments during the year by gender
Male Female
23%
77%
Recruitments during the year by employment grade
Managers
Executives
Senior executives
Other
30%
5%
64%
1%
Recruitments during the year by geographical region
Central Province
North Central Province
Eastern Province
Sabaragamuwa Province
North Western Province
Western Province
Southern Province
Northern Province
Uva Province
5%
16%
5%
10%
47%
3%
6%4%
4%
Recruitment procedure
The following procedure is followed when positions
are vacant as a result of resignation, promotion or the
requirement of new manpower.
1. The position is advertised in a widely read week-end
newspaper.
2. Applications are processed.
3. A short list is prepared and suitable applicants are called
for interviews at least two days in advance for the first
interview.
4. Applicants are interviewed by the Chief Manager
Personnel at their first interview.
5. Shortlisted candidates are interviewed by a panel of
interviewers including the line managers, section heads,
GM, Deputy CEO and Additional CEO, as required.
6. A suitable candidate is selected.
Subsequent to the interview procedure, the panel marks their
comments in the interview guide form which is attached to
the application form. The HR Department issues the offer
letter and thereafter the letter of appointment.
Moreover, other relevant departments will be informed
about the recruitment to facilitate other related documents,
formats, passwords, etc. in order to initiate the induction
process. Requests for reference letters are sent to the
referees mentioned in the CV and employment verifications
are done, if required.

AN
NU
AL
RE
PO
RT
20
17
/1
8 S
EN
KA
DA
GA
LA
FIN
AN
CE
PL
C
65
EM
PL
OY
EE
CA
PIT
AL
Employee turnover
2017-18 2016-17
Comparison of length of service of employees
500
400
300
200
100
0
Nos.
>20Years
<5 Years
5-10Years
11-20Years
Based on the statistical analysis above, it was noted that employees who dedicate over five years of service have increased during the financial year. While the statistics are very encouraging, Senkadagala Finance PLC will enhance the measures adopted to retain its employees.
Retention: Methods adoptedAnnual promotions as per the staff career path policy, annual increments and fringe benefits are a few methods adopted to ensure employee retention. Moreover, geographical recruitments ensure that employees live in close proximity to their place of work while performance-based annual bonuses, staff training and exit interviews also ensure that the employee turnover rate gradually decreases.
Retention: Challenges facedGiven that the finance industry is very competitive, it presents a number of challenges for employee retention. The new generation also sees many other employment opportunities opening up and are reluctant to dedicate a number of years to a single place of work.
Benefits and rewards
z Medical leave
z Nursing intervals
z Performance incentives
Employees are paid an annual bonus depending on the profitability of the Company and the employee’s performance. The payment of a bonus is subject to achieving key performance indicators or at the discretion of the Management.
Medical benefits Hospitalisation expenses can be claimed and are subject to the maximum amount specified in the hospital and surgical expenses insurance policy.
Personal accident coverAll employees are covered by personal accident insurance.
Staff loans
Employees with a long service record are eligible for a loan subjected to a maximum of 60 months repayment period.
Salary advanceEmployees who have been confirmed are eligible to apply for a salary advance equal to one month’s salary which is subject to a maximum of six month’s repayment period.
Festival advanceEmployees who have been confirmed are eligible to apply for a festival advance equal to one month’s salary subject to a maximum of ten months repayment period. Festival advances are granted to employees during their respective cultural and religious festive seasons. All advances are subject to total deductions not exceeding 40% of their salary.
Company vehicleCars or motor bikes are assigned to specific employees.
Mobile SIMA mobile connection with an allowance is provided to all employees.
Parental leave
Maternity leave
The Company is sensitive to the needs of its employees, especially the care of newborns. In line with labour regulations, all female employees are entitled to fully paid leave up to 84 working days at the birth of their first two children. For subsequent births, they would be entitled to 42 working days. Saturday is counted as half a day in both instances. Also, regardless of the number of children, all new mothers are allowed to avail one hour every working day to
care for the baby for one year since the birth of the child.
Work life balance
With a view to ensure employee well-being, the Company focuses on maintaining a work life balance. A key initiative taken to promote this is localised recruitments. During the year, 96% of recruitments were from the respective localities. This ensures that employees commute to work is shorter, and would allow more time for personal and family commitments. Transfers are also provided to staff to
SE
NK
AD
AG
AL
A F
INA
NC
E P
LC
AN
NU
AL
RE
PO
RT
20
17
/1
8
66
EM
PL
OY
EE
CA
PIT
AL facilitate their personal needs. The Company encourages its
employees to manage their personal and work life to ensure life fulfilment.
Performance evaluationThe Company has in place an internally developed performance evaluation framework, that allows the management to assess the performance of individuals and branches/centers collectively in line with key performance indicators of the Company. Collective assessment criteria include profitability of the branch/centre, performance during the year, portfolio quality, deposit mobilisation, etc. The individual assessment criteria consist of knowledge of work, initiative, quality of work done, personality, dependability and quantity of work carried out during the period of appraisal.The evaluation framework ensures aligning personal objectives with the corporate strategies and objectives. Hence, the framework is adaptive to changing business needs from time to time.
Employee satisfaction surveyAn employee satisfaction survey was not carried out during the year under review.
Occupational health and safety
Security
The Company has adopted various measures to ensure the safety and security of all persons and property through the hiring of security officers, fixing CCTV cameras, use of security alarms and the like.
Health and safety
The Company is committed to providing a safe working environment to its employees. However, it is also the responsibility of the employees to follow certain procedures and measures.
z Co-operate with the “life and fire safety officer” in the case of a fire or disaster-related evacuation.
z Take responsibility for the health and safety of oneself and others at work.
z Notify a supervisor, manager, assistant manager administration or department personnel when encountering discomfort at a work station which could lead to injury.
z Inform a supervisor, manager, assistant manager administration or department personnel if any damage has been caused to the fire fighting equipment, blockage of fire exits and the like.
z Personal work spaces have to be tidy to ensure the comfort of all employees.
z Employees have to be up-to-date with the contact numbers of service providers in case of an emergency.
Fire protectionThe Company also gives priority to protecting its properties in the case of a fire.
z Complies with rules, regulations and requirements specified by the local authorities when establishing a new branch or department.
z Designs and arranges buildings and premises abiding by stipulated fire safety measures (emergency exits, symbols, etc.).
z Provides required fire fighting equipment and fire extinguishers and arranges periodical testing.
z Conducts required training and awareness programmes for staff.
z Trains selected staff members from each department and branch and appoints them as “life and fire safety officers”.
Employee grievance handling
Senkadagala Finance PLC fosters a work culture that encourages open communication between senior and junior staff members. Given this foundation, all employee grievances are also treated with seriousness and sensitivity. The Company believes in taking immediate remedial action for issues that cause discomfort to one or more employees. A grievance should be first conveyed to the immediate officer before it is brought to the notice of a higher officer unless the immediate officer is the cause of it. Instances of this nature are well documented and will help in decision making processes in the future.
Procedure:
z Grievances must first be conveyed to the immediate officer.
z In the event that the immediate officer does not take adequate action, the employee may convey the grievance to the line manager.
z If the manager fails to take action, the employee may convey the grievance to the Head of HR.
z In the instance that the Head of HR also does not address the issue, it may be conveyed to the Deputy CEO.
z If the Deputy CEO does not take adequate action the grievance may be conveyed to the Additional CEO or Managing Director.
z As indicated above, every effort is taken to resolve the grievance at the point of origin or to bring it to the notice of a senior officer within three working days.
z The grievance handling process should ideally be completed within five working days and a maximum of ten working days.

AN
NU
AL
RE
PO
RT
20
17
/1
8 S
EN
KA
DA
GA
LA
FIN
AN
CE
PL
C
67
A vision for the futureMaintaining a strategic focus has benefited the Company in a multiplicity of ways. It continues to enable the Company to create value in the short, medium and long term.

SE
NK
AD
AG
AL
A F
INA
NC
E P
LC
AN
NU
AL
RE
PO
RT
20
17
/1
8
68
Social and Environmental Capital
Social Capital
Social awareness is central to the mission of Senkadagala
Finance PLC. Its consciousness is rooted in its responsibility
towards customers, employees and the communities in
which it operates. However, it also broadens its awareness
to encompass society as a whole. The Company maintains
a culture of sharing, that in turn benefits it in the short,
medium and long term.
Localised recruitments
The expansion of the Company has been both strategic and
responsible. During the financial year, five branches were
established. The staff employed to handle the operations of
these branches were recruited from the localities while 98%
of the senior staff live in the respective area as well. The
centralised ICT system also helps facilitate and coordinate the
overall operations of the Company.
Internship programme
Similarly, the Company also continued its internship
programme. During the financial year, 10 students interned at
the Company while six completed their tenure and one was
recruited as part of the permanent cadres. The programme
was initially launched with the aim of giving youngsters
adequate training to enter the workforce with particular
attention on the corporate sector. The interns are given the
opportunity to engage with aspects of the business such as
marketing, customer handling, credit, accounting and finance,
HR functions, treasury activities and the deposit operations
of the Company. As mentioned before, at the end of the
six-month internship period, one intern was absorbed into
the business while it is reported that all others have found
employment in other established organisations.
Commitment to external initiatives and memberships
Senkadagala Finance PLC is a strategic level training partner
of The Institute of Chartered Accountants of Sri Lanka (CA Sri
Lanka). The Company provides the students of the Institute
with managerial and strategic level training.
Donation of medical equipment at Dompe hospital.
Donation in support of the maintenance work at Kandy General Hospital.
During the year the Company also participated in a training
programme on credit evaluations. It was conducted by the
Finance Houses Association of Sri Lanka.
Moreover, the Company is a member of the Leasing
Association of Sri Lanka and has been a member of the
Finance Houses Association of Sri Lanka from its inception.
Donations: Kandy General Hospital
During the financial year, the Company made a donation of
paint and relevant equipment to the Kandy General Hospital.
Relevant maintenance work has been subsequently carried
out. This is the third time the Company made donations to
the hospital. On prior occasions donations of catheters and
colostomy bags were made by the Company. When providing
donations, it makes a point to identify the needs of the
hospital and make donations accordingly.
Donations: Dompe Hospital
The Company also made a donation of medical equipment
worth Rs. 100,000 to the district hospital of Dompe.
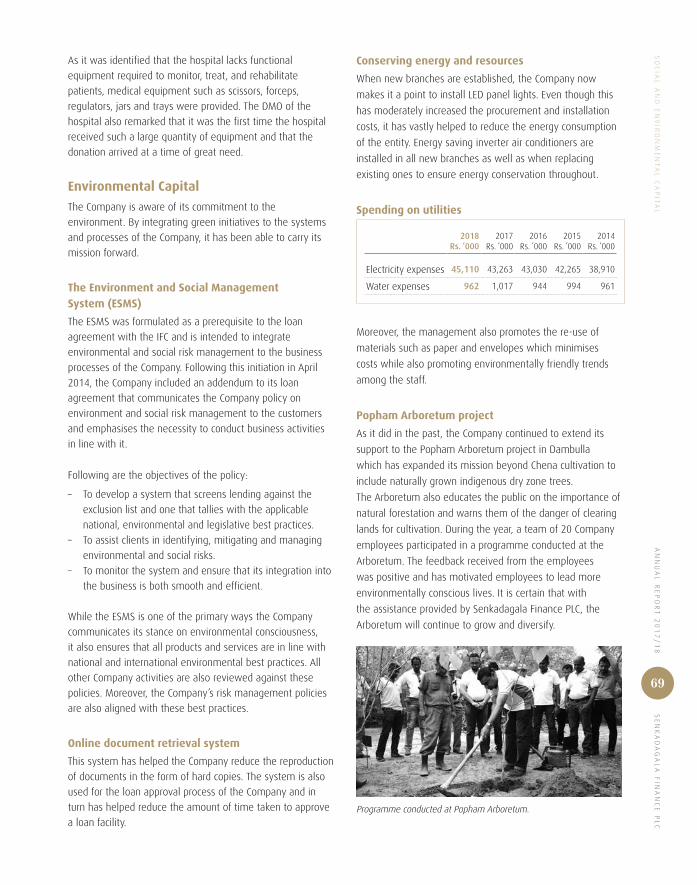
AN
NU
AL
RE
PO
RT
20
17
/1
8 S
EN
KA
DA
GA
LA
FIN
AN
CE
PL
C
69
SO
CIA
L A
ND
EN
VIR
ON
ME
NT
AL
CA
PIT
AL
As it was identified that the hospital lacks functional
equipment required to monitor, treat, and rehabilitate
patients, medical equipment such as scissors, forceps,
regulators, jars and trays were provided. The DMO of the
hospital also remarked that it was the first time the hospital
received such a large quantity of equipment and that the
donation arrived at a time of great need.
Environmental Capital
The Company is aware of its commitment to the
environment. By integrating green initiatives to the systems
and processes of the Company, it has been able to carry its
mission forward.
The Environment and Social Management System (ESMS)
The ESMS was formulated as a prerequisite to the loan
agreement with the IFC and is intended to integrate
environmental and social risk management to the business
processes of the Company. Following this initiation in April
2014, the Company included an addendum to its loan
agreement that communicates the Company policy on
environment and social risk management to the customers
and emphasises the necessity to conduct business activities
in line with it.
Following are the objectives of the policy:
– To develop a system that screens lending against the
exclusion list and one that tallies with the applicable
national, environmental and legislative best practices.
– To assist clients in identifying, mitigating and managing
environmental and social risks.
– To monitor the system and ensure that its integration into
the business is both smooth and efficient.
While the ESMS is one of the primary ways the Company
communicates its stance on environmental consciousness,
it also ensures that all products and services are in line with
national and international environmental best practices. All
other Company activities are also reviewed against these
policies. Moreover, the Company’s risk management policies
are also aligned with these best practices.
Online document retrieval system
This system has helped the Company reduce the reproduction
of documents in the form of hard copies. The system is also
used for the loan approval process of the Company and in
turn has helped reduce the amount of time taken to approve
a loan facility.
Conserving energy and resources
When new branches are established, the Company now
makes it a point to install LED panel lights. Even though this
has moderately increased the procurement and installation
costs, it has vastly helped to reduce the energy consumption
of the entity. Energy saving inverter air conditioners are
installed in all new branches as well as when replacing
existing ones to ensure energy conservation throughout.
Spending on utilities
2018Rs. ’000
2017Rs. ’000
2016Rs. ’000
2015Rs. ’000
2014Rs. ’000
Electricity expenses 45,110 43,263 43,030 42,265 38,910
Water expenses 962 1,017 944 994 961
Moreover, the management also promotes the re-use of
materials such as paper and envelopes which minimises
costs while also promoting environmentally friendly trends
among the staff.
Popham Arboretum project
As it did in the past, the Company continued to extend its
support to the Popham Arboretum project in Dambulla
which has expanded its mission beyond Chena cultivation to
include naturally grown indigenous dry zone trees.
The Arboretum also educates the public on the importance of
natural forestation and warns them of the danger of clearing
lands for cultivation. During the year, a team of 20 Company
employees participated in a programme conducted at the
Arboretum. The feedback received from the employees
was positive and has motivated employees to lead more
environmentally conscious lives. It is certain that with
the assistance provided by Senkadagala Finance PLC, the
Arboretum will continue to grow and diversify.
Programme conducted at Popham Arboretum.
SE
NK
AD
AG
AL
A F
INA
NC
E P
LC
AN
NU
AL
RE
PO
RT
20
17
/1
8
70
Shareholder and Investor Capital
At its inception in 1968, Senkadagala Finance PLC had three
shareholders who were the Directors of the Company at
the time. Since then, the Company has grown significantly,
understanding that shareholder trust is a key reason for
the success and stability of the Company in the short,
medium and long term. It relies on investors for equity and
on individuals and institutions for debt capital. Today, the
Company maintains an optimal level of equity to debt capital
giving it the degree of stability a financial services institution
requires and also enabling it to increase the returns to all
investors and other stakeholders.
As demonstrated with the rights issue of shares during the
year, today, the Company has a loyal base of shareholders
who are ever willing to support the Company with any
further capital requirements to support expansion.
During the financial year, there were several developments
in relation to the capital of the NBFIs. The Department of
Supervision of Non-Bank Financial Institutions (DSNBFI)
issued a consultation paper on the implementation of the
new capital adequacy framework for Licensed Finance
Companies (LFCs) and Specialised Leasing Companies (SLCs)
The proposed framework requires NBFIs to maintain capital
for credit risk under The Standardised Approach and for
operational risk under The Basic Indicator Approach of the
third BASEL Accord, as opposed to the existing requirement
which focuses solely on credit risk.
New regulation will be phased in, increasing the minimum
requirement of the Tier 1 ratio up to 7% and the total
capital ratio to 12% by 2020. It would also affect the capital
instruments that could be considered for the calculation of
Tier 1 and Tier 2 Capital. The risk weighting for different asset
categories have also been changed drastically. Off balance
sheet items are considered for the purpose of risk weighting.
Given this development, sourcing capital funds would be a
challenge for NBFIs.
Nevertheless, presently the Company maintains healthy
capital ratios while providing its shareholders with a steady
flow of dividends.
In March 2011, Senkadagala Finance PLC was listed in the
Diri Savi Board of the Colombo Stock Exchange, providing
shareholders with a liquid form of investment. The Company
only has equity in the form of voting shares in issue.
The Company has issued several Debentures to exploit the
favourable market conditions. During the financial year, one
such debenture was redeemed at maturity. Several debenture
holders opted to convert their holding in to deposits with the
Company, at the point of redemption.
Dividend policy
The Company takes into consideration a number of factors
such as earnings after tax, current capital ratios, capital
requirements to support future growth, strategies and
industry practices when deciding dividend payouts.
During the year under review, the Company distributed
21.21% of its earnings compared to 21.59% of the previous
year. Details of dividends paid to shareholders during the
year are as follows:
2018 2017
Dividend payment Amount (Rs.) DPS (Rs.) Paid date Amount (Rs.) DPS (Rs.) Paid date
1st interim dividend paid 36,237,531 0.50 01.11.2017 39,136,533 0.60 24.11.2016
2nd interim dividend paid 68,851,308 0.95 21.02.2018 58,704,800 0.90 26.01.2017
3rd interim dividend paid 72,475,061 1.00 03.05.2018 39,136,533 0.60 07.04.2017
Final dividend proposed/paid 68,851,308 0.95 Subject toAGM approval
68,851,308 0.95 11.07.2017
Total dividends proposed 246,415,208 205,829,173
Dividends paid during the year 213,076,679 185,898,532
Earnings during the year 1,004,671,318 860,971,242
Dividends pay-out ratio (%) 21.21 21.59
Earnings retention ratio (%) 78.79 78.41
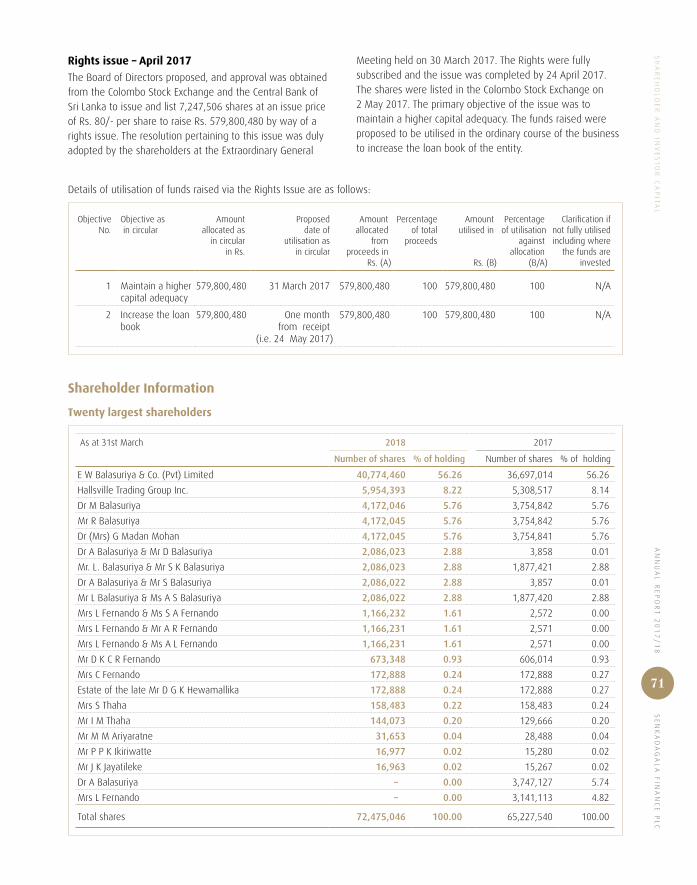
AN
NU
AL
RE
PO
RT
20
17
/1
8 S
EN
KA
DA
GA
LA
FIN
AN
CE
PL
C
71
SH
AR
EH
OL
DE
R A
ND
INV
ES
TO
R C
AP
ITA
L
Rights issue – April 2017
The Board of Directors proposed, and approval was obtained from the Colombo Stock Exchange and the Central Bank of Sri Lanka to issue and list 7,247,506 shares at an issue price of Rs. 80/- per share to raise Rs. 579,800,480 by way of a rights issue. The resolution pertaining to this issue was duly adopted by the shareholders at the Extraordinary General
Meeting held on 30 March 2017. The Rights were fully subscribed and the issue was completed by 24 April 2017. The shares were listed in the Colombo Stock Exchange on 2 May 2017. The primary objective of the issue was to maintain a higher capital adequacy. The funds raised were proposed to be utilised in the ordinary course of the business to increase the loan book of the entity.
Details of utilisation of funds raised via the Rights Issue are as follows:
Objective No.
Objective as in circular
Amountallocated as
in circularin Rs.
Proposeddate of
utilisation asin circular
Amountallocated
fromproceeds in
Rs. (A)
Percentageof total
proceeds
Amountutilised in
Rs. (B)
Percentage of utilisation
againstallocation
(B/A)
Clarification if not fully utilised including where
the funds are invested
1 Maintain a higher capital adequacy
579,800,480 31 March 2017 579,800,480 100 579,800,480 100 N/A
2 Increase the loan book
579,800,480 One month from receipt
(i.e. 24 May 2017)
579,800,480 100 579,800,480 100 N/A
Shareholder Information
Twenty largest shareholders
As at 31st March 2018 2017
Number of shares % of holding Number of shares % of holding
E W Balasuriya & Co. (Pvt) Limited 40,774,460 56.26 36,697,014 56.26
Hallsville Trading Group Inc. 5,954,393 8.22 5,308,517 8.14
Dr M Balasuriya 4,172,046 5.76 3,754,842 5.76
Mr R Balasuriya 4,172,045 5.76 3,754,842 5.76
Dr (Mrs) G Madan Mohan 4,172,045 5.76 3,754,841 5.76
Dr A Balasuriya & Mr D Balasuriya 2,086,023 2.88 3,858 0.01
Mr. L. Balasuriya & Mr S K Balasuriya 2,086,023 2.88 1,877,421 2.88
Dr A Balasuriya & Mr S Balasuriya 2,086,022 2.88 3,857 0.01
Mr L Balasuriya & Ms A S Balasuriya 2,086,022 2.88 1,877,420 2.88
Mrs L Fernando & Ms S A Fernando 1,166,232 1.61 2,572 0.00
Mrs L Fernando & Mr A R Fernando 1,166,231 1.61 2,571 0.00
Mrs L Fernando & Ms A L Fernando 1,166,231 1.61 2,571 0.00
Mr D K C R Fernando 673,348 0.93 606,014 0.93
Mrs C Fernando 172,888 0.24 172,888 0.27
Estate of the late Mr D G K Hewamallika 172,888 0.24 172,888 0.27
Mrs S Thaha 158,483 0.22 158,483 0.24
Mr I M Thaha 144,073 0.20 129,666 0.20
Mr M M Ariyaratne 31,653 0.04 28,488 0.04
Mr P P K Ikiriwatte 16,977 0.02 15,280 0.02
Mr J K Jayatileke 16,963 0.02 15,267 0.02
Dr A Balasuriya – 0.00 3,747,127 5.74
Mrs L Fernando – 0.00 3,141,113 4.82
Total shares 72,475,046 100.00 65,227,540 100.00
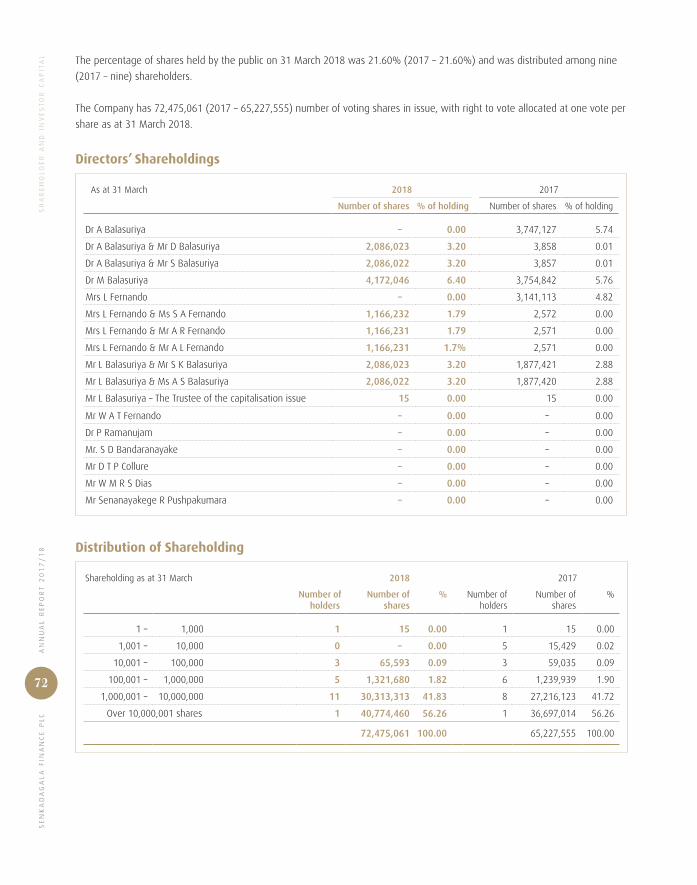
SE
NK
AD
AG
AL
A F
INA
NC
E P
LC
AN
NU
AL
RE
PO
RT
20
17
/1
8
72
SH
AR
EH
OL
DE
R A
ND
IN
VE
ST
OR
CA
PIT
AL The percentage of shares held by the public on 31 March 2018 was 21.60% (2017 – 21.60%) and was distributed among nine
(2017 – nine) shareholders.
The Company has 72,475,061 (2017 – 65,227,555) number of voting shares in issue, with right to vote allocated at one vote per
share as at 31 March 2018.
Directors’ Shareholdings
As at 31 March 2018 2017
Number of shares % of holding Number of shares % of holding
Dr A Balasuriya – 0.00 3,747,127 5.74
Dr A Balasuriya & Mr D Balasuriya 2,086,023 3.20 3,858 0.01
Dr A Balasuriya & Mr S Balasuriya 2,086,022 3.20 3,857 0.01
Dr M Balasuriya 4,172,046 6.40 3,754,842 5.76
Mrs L Fernando – 0.00 3,141,113 4.82
Mrs L Fernando & Ms S A Fernando 1,166,232 1.79 2,572 0.00
Mrs L Fernando & Mr A R Fernando 1,166,231 1.79 2,571 0.00
Mrs L Fernando & Mr A L Fernando 1,166,231 1.7% 2,571 0.00
Mr L Balasuriya & Mr S K Balasuriya 2,086,023 3.20 1,877,421 2.88
Mr L Balasuriya & Ms A S Balasuriya 2,086,022 3.20 1,877,420 2.88
Mr L Balasuriya – The Trustee of the capitalisation issue 15 0.00 15 0.00
Mr W A T Fernando – 0.00 – 0.00
Dr P Ramanujam – 0.00 – 0.00
Mr. S D Bandaranayake – 0.00 – 0.00
Mr D T P Collure – 0.00 – 0.00
Mr W M R S Dias – 0.00 – 0.00
Mr Senanayakege R Pushpakumara – 0.00 – 0.00
Distribution of Shareholding
Shareholding as at 31 March 2018 2017
Number ofholders
Number ofshares
% Number ofholders
Number ofshares
%
1 – 1,000 1 15 0.00 1 15 0.00
1,001 – 10,000 0 – 0.00 5 15,429 0.02
10,001 – 100,000 3 65,593 0.09 3 59,035 0.09
100,001 – 1,000,000 5 1,321,680 1.82 6 1,239,939 1.90
1,000,001 – 10,000,000 11 30,313,313 41.83 8 27,216,123 41.72
Over 10,000,001 shares 1 40,774,460 56.26 1 36,697,014 56.26
72,475,061 100.00 65,227,555 100.00
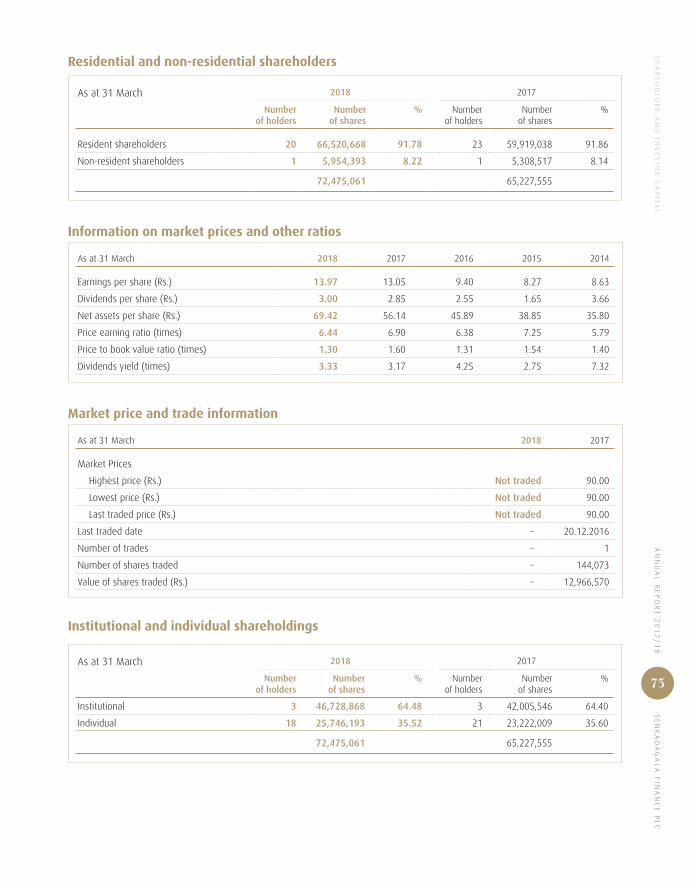
AN
NU
AL
RE
PO
RT
20
17
/1
8 S
EN
KA
DA
GA
LA
FIN
AN
CE
PL
C
73
SH
AR
EH
OL
DE
R A
ND
INV
ES
TO
R C
AP
ITA
L
Residential and non-residential shareholders
As at 31 March 2018 2017
Number of holders
Number of shares
% Number of holders
Number of shares
%
Resident shareholders 20 66,520,668 91.78 23 59,919,038 91.86
Non-resident shareholders 1 5,954,393 8.22 1 5,308,517 8.14
72,475,061 65,227,555
Information on market prices and other ratios
As at 31 March 2018 2017 2016 2015 2014
Earnings per share (Rs.) 13.97 13.05 9.40 8.27 8.63
Dividends per share (Rs.) 3.00 2.85 2.55 1.65 3.66
Net assets per share (Rs.) 69.42 56.14 45.89 38.85 35.80
Price earning ratio (times) 6.44 6.90 6.38 7.25 5.79
Price to book value ratio (times) 1.30 1.60 1.31 1.54 1.40
Dividends yield (times) 3.33 3.17 4.25 2.75 7.32
Market price and trade information
As at 31 March 2018 2017
Market Prices
Highest price (Rs.) Not traded 90.00
Lowest price (Rs.) Not traded 90.00
Last traded price (Rs.) Not traded 90.00
Last traded date – 20.12.2016
Number of trades – 1
Number of shares traded – 144,073
Value of shares traded (Rs.) – 12,966,570
Institutional and individual shareholdings
As at 31 March 2018 2017
Number of holders
Number of shares
% Number of holders
Number of shares
%
Institutional 3 46,728,868 64.48 3 42,005,546 64.40
Individual 18 25,746,193 35.52 21 23,222,009 35.60
72,475,061 65,227,555
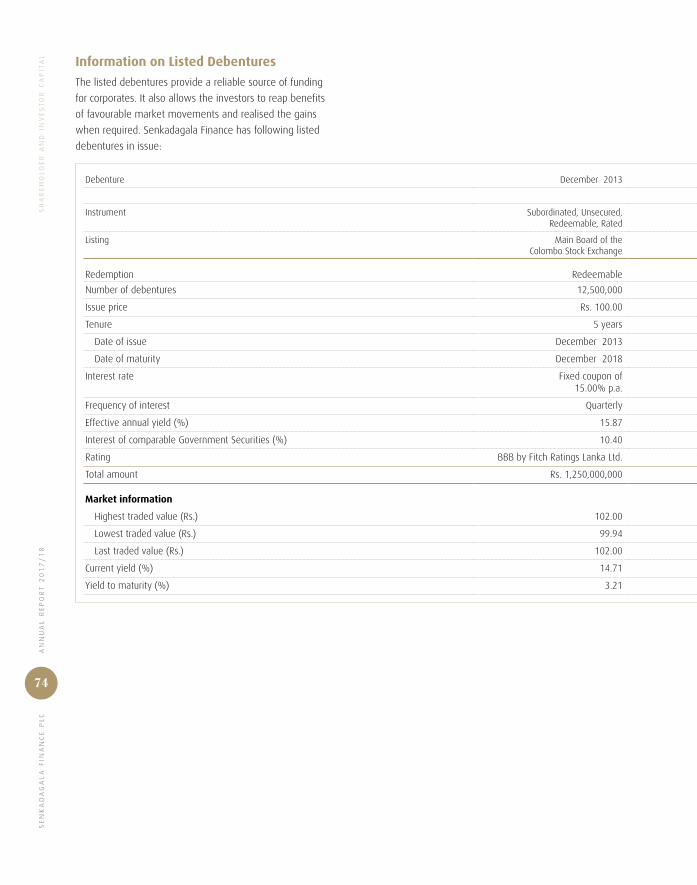
SE
NK
AD
AG
AL
A F
INA
NC
E P
LC
AN
NU
AL
RE
PO
RT
20
17
/1
8
74
SH
AR
EH
OL
DE
R A
ND
IN
VE
ST
OR
CA
PIT
AL Information on Listed Debentures
The listed debentures provide a reliable source of funding
for corporates. It also allows the investors to reap benefits
of favourable market movements and realised the gains
when required. Senkadagala Finance has following listed
debentures in issue:
Debenture December 2013 November 2016
Type A Type B Type C Type D Type E
Instrument Subordinated, Unsecured, Redeemable, Rated
Senior, Unsecured, Redeemable, Rated
Listing Main Board of the Colombo Stock Exchange
Main Board of the Colombo Stock Exchange
Redemption Redeemable Redeemable Redeemable Redeemable Redeemable Redeemable
Number of debentures 12,500,000 3,972,700 100 1,895,100 622,700 23,509,400
Issue price Rs. 100.00 Rs. 100.00 Rs. 100.00 Rs. 100.00 Rs. 100.00 Rs. 100.00
Tenure 5 years 2 years 3 years 3 years 4 years 4 years
Date of issue December 2013 November 2016 November 2016 November 2016 November 2016 November 2016
Date of maturity December 2018 November 2018 November 2019 November 2019 November 2020 November 2020
Interest rate Fixed coupon of15.00% p.a.
Fixed coupon of 12.50% p.a.
6-Month Gross T Bill+ 1.50%
Fixed coupon of13.25% p.a.
6-Month Gross T Bill + 1.75%
Fixed coupon of 13.75% p.a.
Frequency of interest Quarterly Semi-annually Semi-annually Semi-annually Semi-annually Semi-annually
Effective annual yield (%) 15.87 12.89 – 13.69 – 14.22
Interest of comparable Government Securities (%) 10.40 10.00 10.05 10.05 10.20 10.20
Rating BBB by Fitch Ratings Lanka Ltd. BBB+ by Fitch Ratings Lanka Ltd.
Total amount Rs. 1,250,000,000 Rs. 397,270,000 Rs. 10,000 Rs. 189,510,000 Rs. 62,270,000 Rs. 2,350,940,000
Market information
Highest traded value (Rs.) 102.00 99.70 Not traded Not traded Not traded 100.00
Lowest traded value (Rs.) 99.94 97.00 Not traded Not traded Not traded 100.00
Last traded value (Rs.) 102.00 99.00 Not traded Not traded Not traded 100.00
Current yield (%) 14.71 12.63 – – – 13.75
Yield to maturity (%) 3.21 6.80 – – – 6.88

AN
NU
AL
RE
PO
RT
20
17
/1
8 S
EN
KA
DA
GA
LA
FIN
AN
CE
PL
C
75
Information on Listed Debentures
The listed debentures provide a reliable source of funding
for corporates. It also allows the investors to reap benefits
of favourable market movements and realised the gains
when required. Senkadagala Finance has following listed
debentures in issue:
Debenture December 2013 November 2016
Type A Type B Type C Type D Type E
Instrument Subordinated, Unsecured, Redeemable, Rated
Senior, Unsecured, Redeemable, Rated
Listing Main Board of the Colombo Stock Exchange
Main Board of the Colombo Stock Exchange
Redemption Redeemable Redeemable Redeemable Redeemable Redeemable Redeemable
Number of debentures 12,500,000 3,972,700 100 1,895,100 622,700 23,509,400
Issue price Rs. 100.00 Rs. 100.00 Rs. 100.00 Rs. 100.00 Rs. 100.00 Rs. 100.00
Tenure 5 years 2 years 3 years 3 years 4 years 4 years
Date of issue December 2013 November 2016 November 2016 November 2016 November 2016 November 2016
Date of maturity December 2018 November 2018 November 2019 November 2019 November 2020 November 2020
Interest rate Fixed coupon of15.00% p.a.
Fixed coupon of 12.50% p.a.
6-Month Gross T Bill+ 1.50%
Fixed coupon of13.25% p.a.
6-Month Gross T Bill + 1.75%
Fixed coupon of 13.75% p.a.
Frequency of interest Quarterly Semi-annually Semi-annually Semi-annually Semi-annually Semi-annually
Effective annual yield (%) 15.87 12.89 – 13.69 – 14.22
Interest of comparable Government Securities (%) 10.40 10.00 10.05 10.05 10.20 10.20
Rating BBB by Fitch Ratings Lanka Ltd. BBB+ by Fitch Ratings Lanka Ltd.
Total amount Rs. 1,250,000,000 Rs. 397,270,000 Rs. 10,000 Rs. 189,510,000 Rs. 62,270,000 Rs. 2,350,940,000
Market information
Highest traded value (Rs.) 102.00 99.70 Not traded Not traded Not traded 100.00
Lowest traded value (Rs.) 99.94 97.00 Not traded Not traded Not traded 100.00
Last traded value (Rs.) 102.00 99.00 Not traded Not traded Not traded 100.00
Current yield (%) 14.71 12.63 – – – 13.75
Yield to maturity (%) 3.21 6.80 – – – 6.88
SH
AR
EH
OL
DE
R A
ND
INV
ES
TO
R C
AP
ITA
L
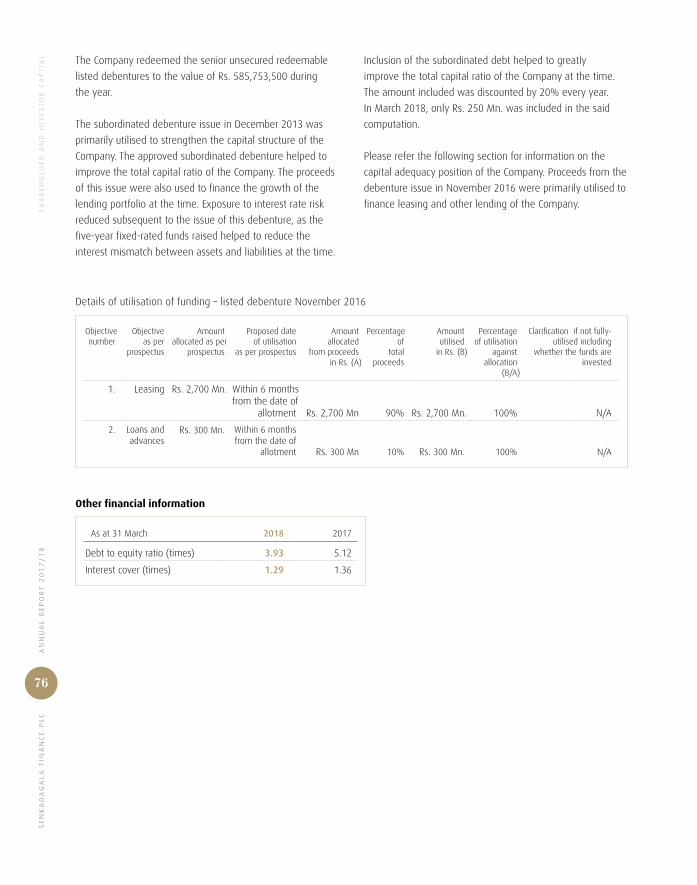
SE
NK
AD
AG
AL
A F
INA
NC
E P
LC
AN
NU
AL
RE
PO
RT
20
17
/1
8
76
SH
AR
EH
OL
DE
R A
ND
IN
VE
ST
OR
CA
PIT
AL The Company redeemed the senior unsecured redeemable
listed debentures to the value of Rs. 585,753,500 during
the year.
The subordinated debenture issue in December 2013 was
primarily utilised to strengthen the capital structure of the
Company. The approved subordinated debenture helped to
improve the total capital ratio of the Company. The proceeds
of this issue were also used to finance the growth of the
lending portfolio at the time. Exposure to interest rate risk
reduced subsequent to the issue of this debenture, as the
five-year fixed-rated funds raised helped to reduce the
interest mismatch between assets and liabilities at the time.
Inclusion of the subordinated debt helped to greatly
improve the total capital ratio of the Company at the time.
The amount included was discounted by 20% every year.
In March 2018, only Rs. 250 Mn. was included in the said
computation.
Please refer the following section for information on the
capital adequacy position of the Company. Proceeds from the
debenture issue in November 2016 were primarily utilised to
finance leasing and other lending of the Company.
Details of utilisation of funding – listed debenture November 2016
Objectivenumber
Objective as per
prospectus
Amountallocated as per
prospectus
Proposed date of utilisation
as per prospectus
Amountallocated
from proceeds in Rs. (A)
Percentage of
total proceeds
Amount utilised
in Rs. (B)
Percentage of utilisation
againstallocation
(B/A)
Clarification if not fully-utilised including
whether the funds areinvested
1. Leasing Rs. 2,700 Mn. Within 6 monthsfrom the date of
allotment Rs. 2,700 Mn 90% Rs. 2,700 Mn. 100% N/A
2. Loans andadvances
Rs. 300 Mn. Within 6 monthsfrom the date of
allotment Rs. 300 Mn 10% Rs. 300 Mn. 100% N/A
Other financial information
As at 31 March 2018 2017
Debt to equity ratio (times) 3.93 5.12
Interest cover (times) 1.29 1.36
AN
NU
AL
RE
PO
RT
20
17
/1
8 S
EN
KA
DA
GA
LA
FIN
AN
CE
PL
C
77
Capital Adequacy
The maintenance of adequate capital funds is essential to be
stable in volatile economic conditions. The Central Bank of Sri
Lanka has issued several directives to strengthen the capital
position of NBFIs. In early 2017, a Direction was issued
specifying the minimum core capital required by an LFC, with
the view of encouraging consolidation of LFCs. Following are
the Directives governing the capital position of LFCs and the
requirements therein,
z Finance Companies (Capital Funds) Direction No. 1
of 2003; specifies that every finance company shall
maintain capital funds which shall at all time be more
than 10% of its total deposit liabilities also every finance
company shall maintain a Statutory Reserve Fund,
transferring a specified fraction of its net profit for the
year based on the ratio of capital funds to total deposit
liabilities.
z Finance Companies (Risk Weighted Capital Adequacy
Ratio) Direction No. 2 of 2006; specifies that every finance
company shall, at all times maintain its core capital at a
level not less than 5% of its risk weighted assets, with
the total capital constituting not less than 10% of its risk
weighted assets.
Tier 1 – Core capital: comprising paid up ordinary share
capital, statutory reserves and or any other reserves
created or increased by transferring of retained earnings
excluding special purpose reserves.
Tier 2 – Supplementary capital: comprising revaluation
reserves, general provisions and other capital instruments
which combine characteristics of equity and debt
instruments and unsecured subordinated term debts.
Risk weighted assets – The Central Bank defines
weightages based on the risk inherent in each category
of assets. Cash and cash equivalent items as well as
government securities are 0% weighted, securitised
assets are weighted in accordance with risk exposure of
the security, etc.
z Finance Companies (Minimum Core Capital) Direction
No. 02 of 2017; specifies, that every finance company
shall at all times maintain an unimpaired core capital not
less than Rs. 1 Bn. until 1 January 2018 and thereafter
maintain an unimpaired core capital at levels stipulated
therein by the specified dates.
At Senkadagala Finance PLC
As at 31 March 2018, the Company recorded a core capital
ratio of 16.86% and a total capital ratio of 17.65%. Moreover,
the Company maintained a Statutory Reserve Fund, amounting
to Rs. 365,036,033 as at 31 March 2018. Additionally,
Rs. 55 Mn. out of the profits were transferred to the said fund
during the year. Out of profits for the year, Rs. 787 Mn. was
retained within the Company to support future growth and to
strengthen the capital base of the Company.
In April 2017, the Company issued 7,247,506 shares by way
of a Rights Issue, infusing Rs. 579.8 Mn. with the primary
objective of enhancing the capital position of the Company.
Subsequent to the issue, the core capital ratio and the total
capital ratio increased to 16.44% and 18.33% respectively.
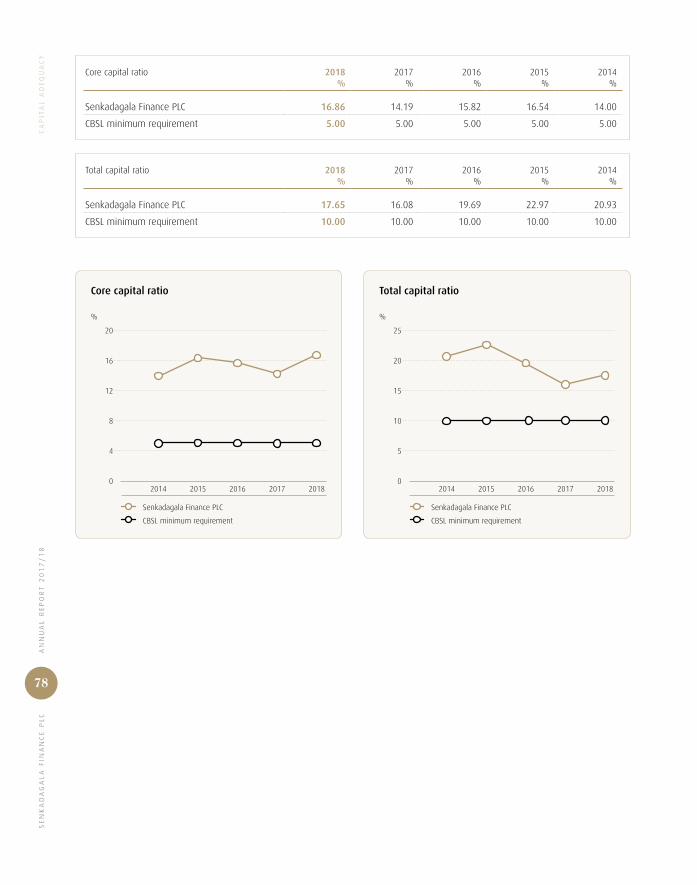
SE
NK
AD
AG
AL
A F
INA
NC
E P
LC
AN
NU
AL
RE
PO
RT
20
17
/1
8
78
CA
PIT
AL
AD
EQ
UA
CY
Core capital ratio 2018%
2017%
2016%
2015%
2014%
Senkadagala Finance PLC 16.86 14.19 15.82 16.54 14.00
CBSL minimum requirement 5.00 5.00 5.00 5.00 5.00
Total capital ratio 2018%
2017%
2016%
2015%
2014%
Senkadagala Finance PLC 17.65 16.08 19.69 22.97 20.93
CBSL minimum requirement 10.00 10.00 10.00 10.00 10.00
20
16
12
8
4
020182015 2016 2017
%
Senkadagala Finance PLC
CBSL minimum requirement
Core capital ratio
2014
25
20
15
10
5
020182015 2016 2017
%
Senkadagala Finance PLC
CBSL minimum requirement
Total capital ratio
2014
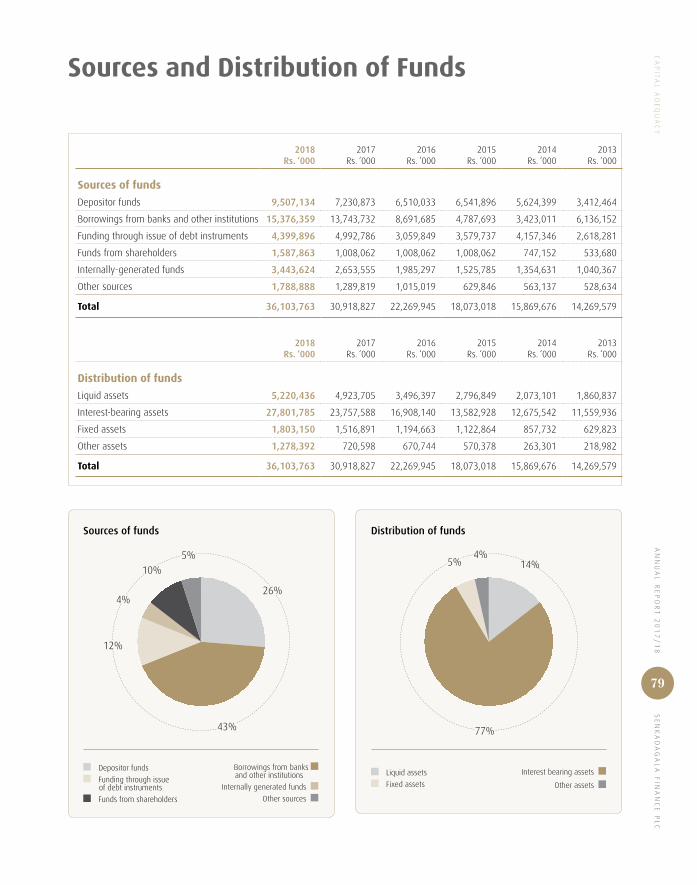
AN
NU
AL
RE
PO
RT
20
17
/1
8 S
EN
KA
DA
GA
LA
FIN
AN
CE
PL
C
79
CA
PIT
AL
AD
EQ
UA
CY
Sources and Distribution of Funds
2018Rs. ‘000
2017Rs. ‘000
2016Rs. ‘000
2015Rs. ‘000
2014Rs. ‘000
2013Rs. ‘000
Sources of funds
Depositor funds 9,507,134 7,230,873 6,510,033 6,541,896 5,624,399 3,412,464
Borrowings from banks and other institutions 15,376,359 13,743,732 8,691,685 4,787,693 3,423,011 6,136,152
Funding through issue of debt instruments 4,399,896 4,992,786 3,059,849 3,579,737 4,157,346 2,618,281
Funds from shareholders 1,587,863 1,008,062 1,008,062 1,008,062 747,152 533,680
Internally-generated funds 3,443,624 2,653,555 1,985,297 1,525,785 1,354,631 1,040,367
Other sources 1,788,888 1,289,819 1,015,019 629,846 563,137 528,634
Total 36,103,763 30,918,827 22,269,945 18,073,018 15,869,676 14,269,579
2018Rs. ‘000
2017Rs. ‘000
2016Rs. ‘000
2015Rs. ‘000
2014Rs. ‘000
2013Rs. ‘000
Distribution of funds
Liquid assets 5,220,436 4,923,705 3,496,397 2,796,849 2,073,101 1,860,837
Interest-bearing assets 27,801,785 23,757,588 16,908,140 13,582,928 12,675,542 11,559,936
Fixed assets 1,803,150 1,516,891 1,194,663 1,122,864 857,732 629,823
Other assets 1,278,392 720,598 670,744 570,378 263,301 218,982
Total 36,103,763 30,918,827 22,269,945 18,073,018 15,869,676 14,269,579
14%
Distribution of funds
Liquid assets
Fixed assets
Interest bearing assets
Other assets
4%
77%
5%
Sources of funds
Depositor funds
Funding through issue of debt instruments
Funds from shareholders
Borrowings from banks and other institutions
Internally generated funds
Other sources
5%
26%
10%
4%
43%
12%

SE
NK
AD
AG
AL
A F
INA
NC
E P
LC
AN
NU
AL
RE
PO
RT
20
17
/1
8
80
Stewardship
82 85 102Board Of
Directors’ Profiles Corporate
Governance Report of the
Audit Committee
AN
NU
AL
RE
PO
RT
20
17
/1
8 S
EN
KA
DA
GA
LA
FIN
AN
CE
PL
C
81
103 104 105 107Report of the
Integrated Risk Management
Committee
Report of the Remuneration
Committee
Report of the Related Party
Transactions Review Committee
Risk Management
SE
NK
AD
AG
AL
A F
INA
NC
E P
LC
AN
NU
AL
RE
PO
RT
20
17
/1
8
82
Board of Directors’ Profiles
Mr W M R S Dias
FCIBC (London), LLB, Hubert H Humphrey Fellow
Chairman
Mr Ravi Dias, a banker by profession, retired as the Managing
Director/Chief Executive Officer of Commercial Bank of
Ceylon PLC after long years of service. He is a Fellow of the
Chartered Institute of Bankers – UK, holds a Degree in Law
(LL.B) and is a Hubert H Humphrey Fellow.
Mr Dias serves on the Boards of Seylan Bank PLC (Chairman),
Carson Cumberbatch PLC, Tokyo Cement (Lanka) PLC, Ceylon
Tea Marketing (Pvt) Ltd (Deputy Chairman) and South Asia
Textile Industries Lanka (Pvt) Ltd. He is the Co-Chair of the
National Advisory Committee on Finance and Capital of the
Ceylon Chamber of Commerce.
He previously served on the Boards of Lanka Clear (Pvt)
Ltd., Lanka Financial Services Bureau Ltd., and was a Council
Member of the Employers' Federation of Ceylon.
Dr Prathap Ramanujam
BSc (Hons), MSc (UK), PhD (Aus)
Deputy Chairman
Dr Ramanujam holds a first class BSc (Hons) Degree from
the University of Peradeniya and a MSc Degree in Economics
from the University of Bristol (UK). He obtained his PhD in
Economics from the Australian National University, Canberra,
Australia. He retired after 38 years of distinguished service
in the public sector. He was also the Permanent Secretary
to several key ministries including Tourism, Livestock
Development and Estate Infrastructure, Civil Aviation and
Urban Development during the last 14 years of his career
in the public sector. He served as a Director of the National
Savings Bank and the State Mortgage and Investment Bank
during his career in the public sector.
In recognition of his service in the public sector Dr Ramanujam
was appointed as a member of the independent Public Service
Commission by the Constitutional Council.
Dr Ramanujam is currently Chairman of Panasian Power PLC,
Chairman and Director of Manelwela Hydropower (Pvt) Ltd.,
and Padiyapelella Hydropower (Pvt) Ltd. He is also a
Director of Panasian Investments (Pvt) Ltd., and a Director
of Ceylon Agro Industries Ltd. He functions as an Advisor
to the Director General of the International Water
Management Institute.
Mr Lakshman Balasuriya
BSc (London), MSc (Lancaster)
Managing Director/Chief Executive Officer
Mr Lakshman Balasuriya is a Director of Senkadagala Hotels
Ltd., E. W. Balasuriya & Co. (Pvt) Ltd. and Thompsons Beach
Hotels Ltd. He holds a BSc (London) and MSc (Lancaster)
and has 37 years of experience in finance, hotels and other
commercial fields. He is the Managing Director and Chief
Executive Officer of Senkadagala Finance PLC.
Dr Asoka Balasuriya
BSc (London), PhD (London)
Executive Director
Dr Balasuriya holds a BSc (Lon) and a PhD (Lon) and has over
34 years of experience in the field of gems and jewellery.
He is also a Director of Senkadagala Hotels Ltd., Thompsons
Beach Hotels Ltd., and is the Chairman of E W Balasuriya &
Co. (Pvt) Ltd.
Ms Lakshmi Fernando
BSc (Hons)
Executive Director
Ms Fernando holds a BSc (Hons) and has over 22 years
of experience in the field of finance as well as in hotel
management. She is a Director of Thompsons Beach
Hotels Ltd., Senkadagala Hotels Ltd., and E W Balasuriya &
Co. (Pvt) Ltd.

AN
NU
AL
RE
PO
RT
20
17
/1
8 S
EN
KA
DA
GA
LA
FIN
AN
CE
PL
C
83
BO
AR
D O
F D
IRE
CT
OR
S’ P
RO
FIL
ES
Dr Mahendra Balasuriya
BVSc
Executive Director
Dr Balasuriya is a Director of Senkadagala Hotels Ltd.,
E W Balasuriya & Co. (Pvt) Ltd., and Thompsons Beach Hotels
Ltd. He holds a Bachelor’s Degree in Veterinary Science and
has over 34 years of experience in the hotel industry and
other related fields.
Mr Widanalage Ajith Terence Fernando
FCMA, MA (Colombo)
Independent Non-Executive Director
Mr Fernando is a Fellow of the Chartered Institute of
Management Accountants of the United Kingdom (FCMA)
and has a MA in Financial Economics from the University
of Colombo.
He has over 27 years of experience in the capital markets of
Sri Lanka. He founded Capital Alliance in 2000 and currently
serves as the Group CEO. The Capital Alliance Group includes
Capital Alliance Ltd. (a primary dealer for Government
Securities, appointed by the Central Bank of Sri Lanka), Capital
Alliance Securities (Pvt) Ltd. (which is a trading member of
the Colombo Stock Exchange), Capital Alliance Investments
Ltd. (a licensed unit trust manager), and Capital Alliance
Partners Ltd., the leading Investment banking firm.
In addition, he serves on the Boards of many listed and
unlisted companies including ADZ Insurance Brokers (Pvt)
Ltd., Ashthi Holdings (Pvt) Ltd. and Ceylon Tea Brokers PLC.
Mr Sanath Divale Bandaranayake
BSc (University of Sri Lanka)
Executive Director/Additional CEO
Mr. Bandaranayake joined the Company after his retirement
from Commercial Bank of Ceylon PLC, the largest and the
most awarded bank in Sri Lanka, having completed 36 years
of service.
He has served the Bank in various capacities such as
Branch Manager (Kandy, City Office), Chief Manager,
Assistant General Manager and Deputy General Manager
(Operations) and was a core member of the Management
teams which led the Bank to important milestones such
as introducing Banking Software to improve the bank’s
operations (which is used even today), Holiday Banking and
Supermarket Banking.
During his career at the Bank he was appointed as Director
of LankaClear. He also served as the Director of Commex
Sri Lanka S.R.L. (a subsidiary of Commercial Bank located
in Italy) and OneZero Company Ltd. (a subsidiary of
Commercial Bank that engages in the business of Information
Technology). Mr. Bandaranayake holds a Bachelor’s Degree
in Physical Sciences from the University of Sri Lanka,
Vidyodaya Campus.
Mr Tilak Collure
BSc (Colombo) MPA (USJ)
Independent Non-Executive Director
Mr Collure is a former public servant from the Sri Lanka
Administrative Service Special Grade who held a number
of senior positions during 35 years in Government service
mainly in the areas of trade, commerce and logistics.
He has served as the Secretary of the Ministries of Industry
and Commerce, Transport and Ports, Shipping and Aviation.
During his career, he has also headed several major public
sector corporate institutions.
At present, he serves as a Member of the National Police
Commission. Mr Collure holds a BSc in Natural Sciences
(Colombo) and a Masters in Public Administration with a
Merit Award (PIM/University of Sri Jayewardenepura).
Mr Senanayakege Raja Pushpakumara
FCA, BCo (Special) (USJ), PGDip (BMgt)
Independent Non-Executive Director
Mr Senanayakege completed his articles at M/s. Ernst &
Young qualifying as a Chartered Accountant and joined Singer
Industries (Ceylon) PLC in 1991 as a Financial Accountant.
In 1994, he joined Commercial Bank of Ceylon PLC as the
Senior Manager Finance where he worked for 13 years. He
also held the position of Assistant General Manager (Finance
and Planning). Thereafter he resigned to join Nations
Trust Bank PLC as the Chief Financial Officer. Subsequent
to resigning from NTB, he commenced working for Smart
Media – The Annual Report Company helping the Company in
all aspects of annual report production.
Mr Senanayakege also serves as an independent
non-executive Director of Serendib Finance Ltd., a fully-
owned subsidiary of Commercial Bank of Ceylon PLC and
a Director of Virtual Capital Technologies (Pvt.) Ltd., a start-up
IT company.

SE
NK
AD
AG
AL
A F
INA
NC
E P
LC
AN
NU
AL
RE
PO
RT
20
17
/1
8
84
Founded on stability, throughout half a century, Senkadagala Finance PLC has molded and remolded its systems and processes to ensure a secure future.
A solid base
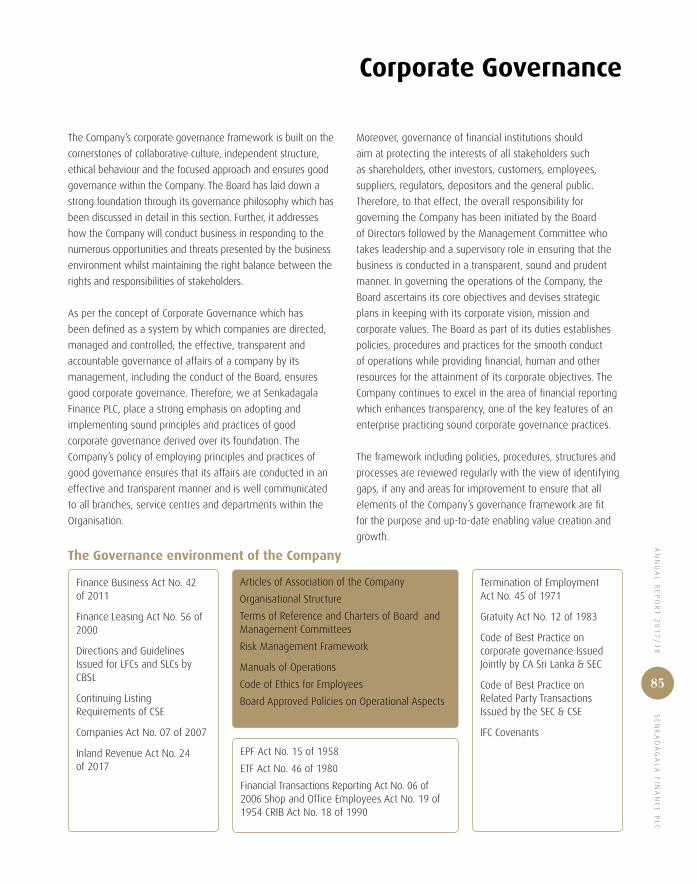
AN
NU
AL
RE
PO
RT
20
17
/1
8 S
EN
KA
DA
GA
LA
FIN
AN
CE
PL
C
85
Corporate Governance
The Company’s corporate governance framework is built on the
cornerstones of collaborative culture, independent structure,
ethical behaviour and the focused approach and ensures good
governance within the Company. The Board has laid down a
strong foundation through its governance philosophy which has
been discussed in detail in this section. Further, it addresses
how the Company will conduct business in responding to the
numerous opportunities and threats presented by the business
environment whilst maintaining the right balance between the
rights and responsibilities of stakeholders.
As per the concept of Corporate Governance which has
been defined as a system by which companies are directed,
managed and controlled; the effective, transparent and
accountable governance of affairs of a company by its
management, including the conduct of the Board, ensures
good corporate governance. Therefore, we at Senkadagala
Finance PLC, place a strong emphasis on adopting and
implementing sound principles and practices of good
corporate governance derived over its foundation. The
Company’s policy of employing principles and practices of
good governance ensures that its affairs are conducted in an
effective and transparent manner and is well communicated
to all branches, service centres and departments within the
Organisation.
Moreover, governance of financial institutions should
aim at protecting the interests of all stakeholders such
as shareholders, other investors, customers, employees,
suppliers, regulators, depositors and the general public.
Therefore, to that effect, the overall responsibility for
governing the Company has been initiated by the Board
of Directors followed by the Management Committee who
takes leadership and a supervisory role in ensuring that the
business is conducted in a transparent, sound and prudent
manner. In governing the operations of the Company, the
Board ascertains its core objectives and devises strategic
plans in keeping with its corporate vision, mission and
corporate values. The Board as part of its duties establishes
policies, procedures and practices for the smooth conduct
of operations while providing financial, human and other
resources for the attainment of its corporate objectives. The
Company continues to excel in the area of financial reporting
which enhances transparency, one of the key features of an
enterprise practicing sound corporate governance practices.
The framework including policies, procedures, structures and
processes are reviewed regularly with the view of identifying
gaps, if any and areas for improvement to ensure that all
elements of the Company’s governance framework are fit
for the purpose and up-to-date enabling value creation and
growth.
The Governance environment of the Company
Articles of Association of the Company
Organisational Structure
Terms of Reference and Charters of Board and Management Committees
Risk Management Framework
Manuals of Operations
Code of Ethics for Employees
Board Approved Policies on Operational Aspects
Finance Business Act No. 42 of 2011
Finance Leasing Act No. 56 of 2000
Directions and Guidelines Issued for LFCs and SLCs by CBSL
Continuing Listing Requirements of CSE
Companies Act No. 07 of 2007
Inland Revenue Act No. 24 of 2017
Termination of Employment Act No. 45 of 1971
Gratuity Act No. 12 of 1983
Code of Best Practice on corporate governance Issued Jointly by CA Sri Lanka & SEC
Code of Best Practice on Related Party Transactions Issued by the SEC & CSE
IFC Covenants
EPF Act No. 15 of 1958
ETF Act No. 46 of 1980
Financial Transactions Reporting Act No. 06 of 2006 Shop and Office Employees Act No. 19 of 1954 CRIB Act No. 18 of 1990
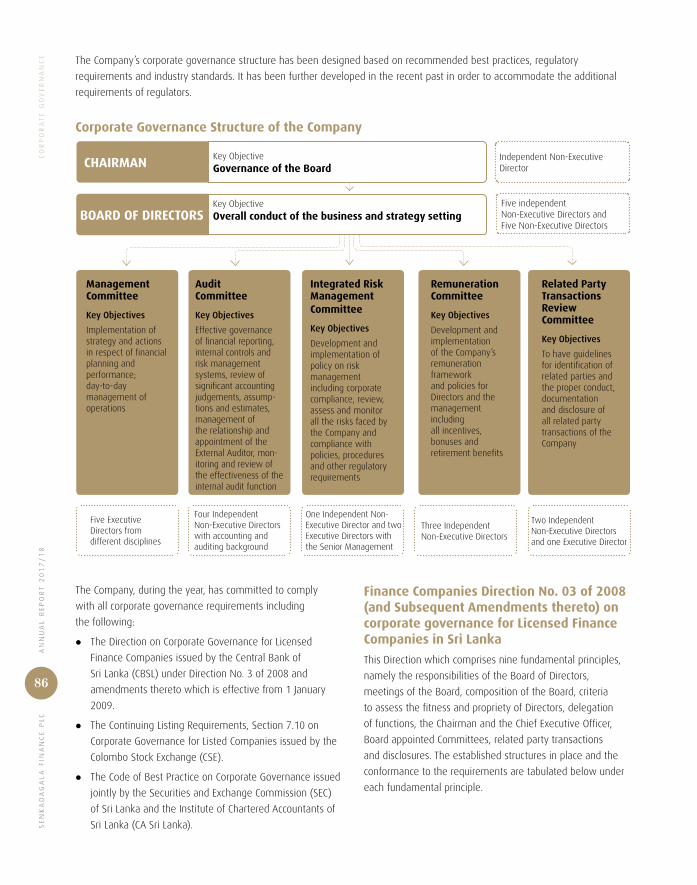
SE
NK
AD
AG
AL
A F
INA
NC
E P
LC
AN
NU
AL
RE
PO
RT
20
17
/1
8
86
CO
RP
OR
AT
E G
OV
ER
NA
NC
E
The Company, during the year, has committed to comply
with all corporate governance requirements including
the following:
z The Direction on Corporate Governance for Licensed
Finance Companies issued by the Central Bank of
Sri Lanka (CBSL) under Direction No. 3 of 2008 and
amendments thereto which is effective from 1 January
2009.
z The Continuing Listing Requirements, Section 7.10 on
Corporate Governance for Listed Companies issued by the
Colombo Stock Exchange (CSE).
z The Code of Best Practice on Corporate Governance issued
jointly by the Securities and Exchange Commission (SEC)
of Sri Lanka and the Institute of Chartered Accountants of
Sri Lanka (CA Sri Lanka).
The Company’s corporate governance structure has been designed based on recommended best practices, regulatory
requirements and industry standards. It has been further developed in the recent past in order to accommodate the additional
requirements of regulators.
Corporate Governance Structure of the Company
BOARD OF DIRECTORSFive independent Non-Executive Directors and Five Non-Executive Directors
Independent Non-Executive DirectorCHAIRMAN
Key ObjectiveGovernance of the Board
Key ObjectiveOverall conduct of the business and strategy setting
Five Executive Directors from different disciplines
Four Independent Non-Executive Directors with accounting and auditing background
One Independent Non- Executive Director and two Executive Directors with the Senior Management
Three Independent Non-Executive Directors
Two Independent Non-Executive Directors and one Executive Director
Management Committee
Key Objectives
Implementation of strategy and actions in respect of financial planning and performance; day-to-day management of operations
Audit Committee
Key Objectives
Effective governance of financial reporting, internal controls and risk management systems, review of significant accounting judgements, assump-tions and estimates, management of the relationship and appointment of the External Auditor, mon-itoring and review of the effectiveness of the internal audit function
Integrated Risk Management Committee
Key Objectives
Development and implementation of policy on risk management including corporate compliance, review, assess and monitor all the risks faced by the Company and compliance with policies, procedures and other regulatory requirements
Remuneration Committee
Key Objectives
Development and implementation of the Company’s remuneration framework and policies for Directors and the management including all incentives, bonuses and retirement benefits
Related Party Transactions Review Committee
Key Objectives
To have guidelines for identification of related parties and the proper conduct, documentation and disclosure of all related party transactions of the Company
Finance Companies Direction No. 03 of 2008 (and Subsequent Amendments thereto) on corporate governance for Licensed Finance Companies in Sri Lanka
This Direction which comprises nine fundamental principles,
namely the responsibilities of the Board of Directors,
meetings of the Board, composition of the Board, criteria
to assess the fitness and propriety of Directors, delegation
of functions, the Chairman and the Chief Executive Officer,
Board appointed Committees, related party transactions
and disclosures. The established structures in place and the
conformance to the requirements are tabulated below under
each fundamental principle.

AN
NU
AL
RE
PO
RT
20
17
/1
8 S
EN
KA
DA
GA
LA
FIN
AN
CE
PL
C
87
CO
RP
OR
AT
E G
OV
ER
NA
NC
E
CBSLRule
Corporate Governance Principle
Compliance Status
Level of Compliance
2. The Responsibilities of the Board of Directors
2 (1) Strengthening the safety and soundness of the operations of the Finance Company
Complied The Board is responsible for overseeing the strategic direction, ensuring adequacy of risk management procedures, maintaining effective communication with all stakeholders, reviewing internal control systems and management information systems for their effectiveness, identifying and defining the responsibilities of Key Management Personnel including succession planning, understanding the regulatory environment and exercising due diligence in hiring and oversight of External Auditors.
2 (2) Chairman and CEO Complied The functions and the responsibilities of the Non-Executive Chairman and the Managing Director/CEO have been in line with Section 7 of the Direction.
The Chairman is required to provide leadership to the Board to ensure that the Board effectively discharges its responsibilities. The Managing Director/CEO on the other hand being an Executive Director is responsible for effective running of day-to-day operations of the Company.
2 (3) Independent professional advice
Complied Independent professional advice could be obtained by the Directors as and when required, at the Company’s expense.
2 (4) Voting for resolutions in matters of interest
Complied There had been no such circumstances that arose during the year and procedure is in place to avoid conflicts of interest in relation to matters of interest.
There is proper identification and disclosure of Directors’ Interest in Contracts and Related Party Transactions through proper recording and disclosure in Financial Statements.
2 (5) Formal schedule of matters
Complied The Board ensures direction and the control of the Finance Company is under its authority through decisions made by way of a formal schedule of matters reserved for it, which has been approved by the Board.
2 (6) Situation of Insolvency Complied Such situation has not arisen as Company fulfilled all its obligations accordingly.
The Company makes payment of interest and capital on due maturity dates to its depositors and its borrowers, when they fall due.
2 (7) Corporate Governance Report
Complied This Report satisfies the stipulated requirement.
2 (8) Scheme of self-assessment
Complied Annual self-assessment by each Director on Board Performance has been done accordingly.
3 Meetings of the Board
3 (1) No. of meetings Complied Please refer table of Directors attendance for the Board meetings given later in this section.
Board papers and other matters which require the Board’s consent had been taken up directly at Board meetings as much as possible.
3 (2) Inclusion of proposals by all Directors in the agenda
Complied All Directors are able to submit proposals for discussion on matters pertaining to promotion of business and the risk management of the Company.
3 (3) Notice of Meetings Complied Directors are given adequate time and minimum notice period for all Board meetings.
3 (4) Attendance of Directors
Complied All Directors have attended the Board meetings as stipulated by the Direction.
Attendance of Directors at Board Meetings is given later on in this Annual Report.
3 (5) Board Secretary Complied A Board Secretary has been appointed by the Board to handle secretarial services of the Board and other functions specified by the statutes.

SE
NK
AD
AG
AL
A F
INA
NC
E P
LC
AN
NU
AL
RE
PO
RT
20
17
/1
8
88
CO
RP
OR
AT
E G
OV
ER
NA
NC
E
CBSLRule
Corporate Governance Principle
Compliance Status
Level of Compliance
3 (6) Agenda for Board Meetings
Complied Board Secretary prepares the agenda for Board meetings under direct supervision of the Chairman.
Prior to circulation, Board Secretary obtains Chairman’s approval for the Notice of Meeting and the agenda.
3 (7) Access to the Company Secretary
Complied All Directors have the opportunity to obtain advice and services of the Company Secretary without any restriction.
3 (8) Minutes of Board Meetings
Complied Duly perfected minutes of the Board meetings are available with the Board Secretary and those are accessible by any Director at any point in time.
3 (9) Details of Minutes Complied Minutes of all Board meetings are duly recorded in sufficient details and retained by the Board Secretary under the direct supervision of the Chairman.
4. Composition of the Board
4 (1) Number of Directors Complied There were ten Directors in the Board as at the end of the financial year.
4 (2) Period of Service of a Director
Complied Period of service of Non-Executive Directors has not exceeded nine years.
Name of Director Directorship Status Number of Months/ Years in Position as at 31 March 2018
Mr W M R S Dias Chairman – Independent Non-Executive Director
Completed three years and seven months
Dr P Ramanujam Independent Non-Executive Director
Completed five years and seven months
Mr W A T Fernando Independent Non-Executive Director
Completed seven years and eight months
Mr T Collure Independent Non-Executive Director
Completed three years and ten months
Mr Raja Senanayake Independent Non-Executive Director
Completed one year
4 (3) Appointment of an employee as a Director
Complied No such situation has arisen during the year.
4 (4) Number of Independent Non-Executive Directors
Complied Board comprised five Independent Non-Executive Directors out of total of ten Directors in the Board as at the end of the financial year.
4 (5) Alternate Director Complied No such situation has arisen during the year.
4 (6) Skills and Experience of Non-Executive Directors
Complied All five Non-Executive Directors of the Board possess adequate skills and experience to contribute to the Board in effectively discharging its obligations.
The details of qualifications and experience of each Non-Executive Director have been set out on pages 82 and 83 in this Report.
4 (7) Non-Executive Directors in the Quorum of the Meetings
Complied Required quorum was maintained at the Board Meetings convened during the year and the satisfactory proportion of Non-Executive Directors was present at these meetings.
4 (8) Directors Information Complied Composition of the Board by category of Directors, Executive Directors, Non-Executive Directors and Independent Non-Executive Directors has been disclosed in this Report in pages 82 and 83.
4 (9) Appointment of new Directors
Complied There has been a formal and transparent procedure for the appointment of new Directors to the Board.
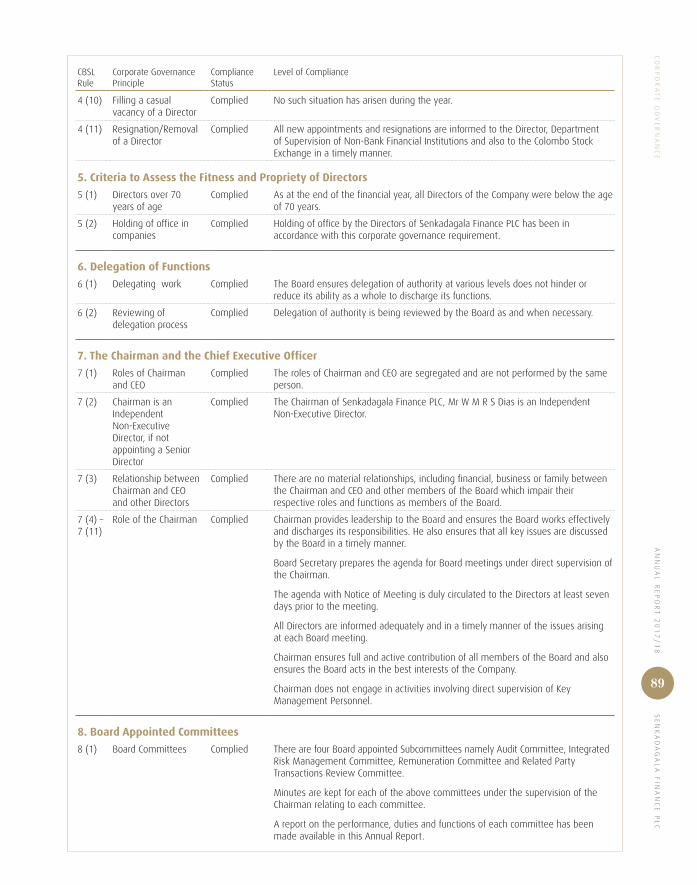
AN
NU
AL
RE
PO
RT
20
17
/1
8 S
EN
KA
DA
GA
LA
FIN
AN
CE
PL
C
89
CO
RP
OR
AT
E G
OV
ER
NA
NC
E
CBSLRule
Corporate Governance Principle
Compliance Status
Level of Compliance
4 (10) Filling a casual vacancy of a Director
Complied No such situation has arisen during the year.
4 (11) Resignation/Removal of a Director
Complied All new appointments and resignations are informed to the Director, Department of Supervision of Non-Bank Financial Institutions and also to the Colombo Stock Exchange in a timely manner.
5. Criteria to Assess the Fitness and Propriety of Directors
5 (1) Directors over 70 years of age
Complied As at the end of the financial year, all Directors of the Company were below the age of 70 years.
5 (2) Holding of office in companies
Complied Holding of office by the Directors of Senkadagala Finance PLC has been in accordance with this corporate governance requirement.
6. Delegation of Functions
6 (1) Delegating work Complied The Board ensures delegation of authority at various levels does not hinder or reduce its ability as a whole to discharge its functions.
6 (2) Reviewing of delegation process
Complied Delegation of authority is being reviewed by the Board as and when necessary.
7. The Chairman and the Chief Executive Officer
7 (1) Roles of Chairman and CEO
Complied The roles of Chairman and CEO are segregated and are not performed by the same person.
7 (2) Chairman is an Independent Non-Executive Director, if not appointing a Senior Director
Complied The Chairman of Senkadagala Finance PLC, Mr W M R S Dias is an Independent Non-Executive Director.
7 (3) Relationship between Chairman and CEO and other Directors
Complied There are no material relationships, including financial, business or family between the Chairman and CEO and other members of the Board which impair their respective roles and functions as members of the Board.
7 (4) – 7 (11)
Role of the Chairman Complied Chairman provides leadership to the Board and ensures the Board works effectively and discharges its responsibilities. He also ensures that all key issues are discussed by the Board in a timely manner.
Board Secretary prepares the agenda for Board meetings under direct supervision of the Chairman.
The agenda with Notice of Meeting is duly circulated to the Directors at least seven days prior to the meeting.
All Directors are informed adequately and in a timely manner of the issues arising at each Board meeting.
Chairman ensures full and active contribution of all members of the Board and also ensures the Board acts in the best interests of the Company.
Chairman does not engage in activities involving direct supervision of Key Management Personnel.
8. Board Appointed Committees
8 (1) Board Committees Complied There are four Board appointed Subcommittees namely Audit Committee, Integrated Risk Management Committee, Remuneration Committee and Related Party Transactions Review Committee.
Minutes are kept for each of the above committees under the supervision of the Chairman relating to each committee.
A report on the performance, duties and functions of each committee has been made available in this Annual Report.
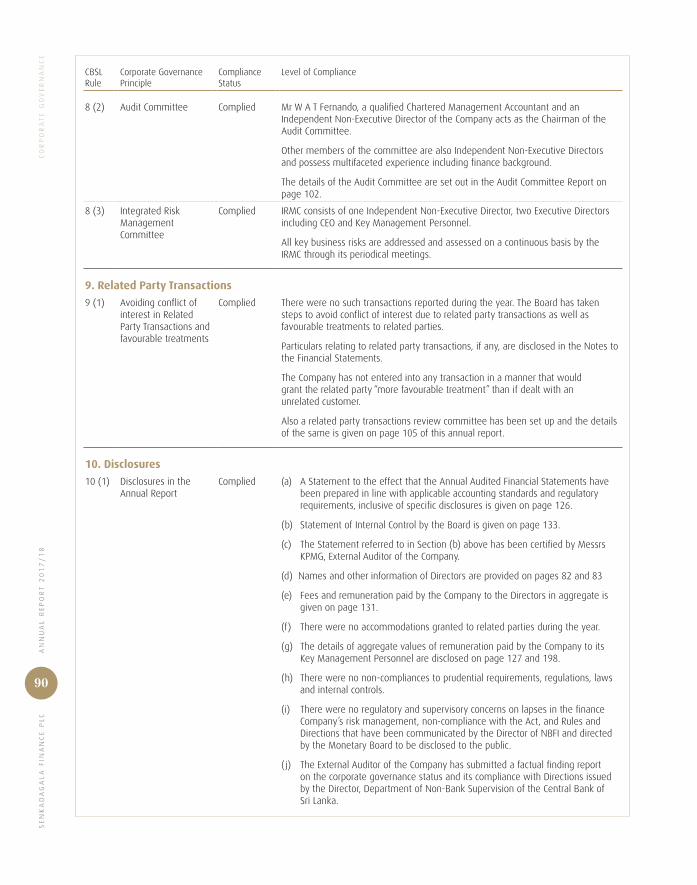
SE
NK
AD
AG
AL
A F
INA
NC
E P
LC
AN
NU
AL
RE
PO
RT
20
17
/1
8
90
CO
RP
OR
AT
E G
OV
ER
NA
NC
E
CBSLRule
Corporate Governance Principle
Compliance Status
Level of Compliance
8 (2) Audit Committee Complied Mr W A T Fernando, a qualified Chartered Management Accountant and an Independent Non-Executive Director of the Company acts as the Chairman of the Audit Committee.
Other members of the committee are also Independent Non-Executive Directors and possess multifaceted experience including finance background.
The details of the Audit Committee are set out in the Audit Committee Report on page 102.
8 (3) Integrated Risk Management Committee
Complied IRMC consists of one Independent Non-Executive Director, two Executive Directors including CEO and Key Management Personnel.
All key business risks are addressed and assessed on a continuous basis by the IRMC through its periodical meetings.
9. Related Party Transactions
9 (1) Avoiding conflict of interest in Related Party Transactions and favourable treatments
Complied There were no such transactions reported during the year. The Board has taken steps to avoid conflict of interest due to related party transactions as well as favourable treatments to related parties.
Particulars relating to related party transactions, if any, are disclosed in the Notes to the Financial Statements.
The Company has not entered into any transaction in a manner that would grant the related party “more favourable treatment” than if dealt with an unrelated customer.
Also a related party transactions review committee has been set up and the details of the same is given on page 105 of this annual report.
10. Disclosures
10 (1) Disclosures in the Annual Report
Complied (a) A Statement to the effect that the Annual Audited Financial Statements have been prepared in line with applicable accounting standards and regulatory requirements, inclusive of specific disclosures is given on page 126.
(b) Statement of Internal Control by the Board is given on page 133.
(c) The Statement referred to in Section (b) above has been certified by Messrs KPMG, External Auditor of the Company.
(d) Names and other information of Directors are provided on pages 82 and 83
(e) Fees and remuneration paid by the Company to the Directors in aggregate is given on page 131.
(f) There were no accommodations granted to related parties during the year.
(g) The details of aggregate values of remuneration paid by the Company to its Key Management Personnel are disclosed on page 127 and 198.
(h) There were no non-compliances to prudential requirements, regulations, laws and internal controls.
(i) There were no regulatory and supervisory concerns on lapses in the finance Company’s risk management, non-compliance with the Act, and Rules and Directions that have been communicated by the Director of NBFI and directed by the Monetary Board to be disclosed to the public.
( j) The External Auditor of the Company has submitted a factual finding report on the corporate governance status and its compliance with Directions issued by the Director, Department of Non-Bank Supervision of the Central Bank of Sri Lanka.

AN
NU
AL
RE
PO
RT
20
17
/1
8 S
EN
KA
DA
GA
LA
FIN
AN
CE
PL
C
91
CO
RP
OR
AT
E G
OV
ER
NA
NC
E
The Continuing Listing Requirements, Section 7.10 on
Corporate Governance for Listed Companies issued by
the Colombo Stock Exchange (CSE)
Section 7.10 of the CSE Listing Rules requires a listed entity
to publish in the Annual Report relating to the financial year
commencing on or after 1 April 2007 a statement confirming
that as at the date of the Annual Report they are in
compliance with the Corporate Governance Rules and if they
are unable to confirm compliance, set out the reasons for
its inability to comply. The rule addresses the areas such as
Non-Executive Directors, Independent Directors, Disclosures
relating to Directors, Criteria for defining Independence,
Remuneration and Audit Committees. Following table depicts
the level of compliance of the Company under each area:
CSERule
Corporate Governance Principle
Compliance Status
Level of Compliance
7.10.1 Non-Executive Directors
Complied There were five Non-Executive Directors and it was more than one-third of the Board of Directors.
7.10.2 Independent Directors Complied All five Non-Executive Directors were Independent Directors as well. Non-Executive Directors have submitted the signed declarations of their independence.
7.10.3 Disclosures relating to Directors
Complied Annual determinations as to the independence of Directors have been made and disclosed in the Annual Report. (Refer Directorship status under Board and Committee meetings attendance on page 101)
Brief resume of each Director has been set out on pages 82 and 83.
Information relating to new appointments to the Board is disclosed to the CSE, when appointments are made to the Board.
7.10.4 Criteria for defining independence
Complied All criteria given for determining the independence of Directors have been taken into consideration for the determination of independence status of the Company’s Independent Directors.
7.10.5 Remuneration Committee
Complied The Remuneration Committee solely consists of Independent Non-Executive Directors and the MD/CEO attends the meeting by invitation.
The Report of the Remuneration Committee including its policy and scope has been set out on page 104 of this Annual Report.
7.10.6 Audit Committee Complied The Audit Committee consists of four Independent Non-Executive Directors.
The Report of the Audit Committee including its composition, policy and scope has been set out on page 102 of this Annual Report.

SE
NK
AD
AG
AL
A F
INA
NC
E P
LC
AN
NU
AL
RE
PO
RT
20
17
/1
8
92
Code of Best Practice on Corporate Governance issued
jointly by The Securities and Exchange Commission
(SEC) of Sri Lanka and The Institute of Chartered
Accountants of Sri Lanka (CA Sri Lanka)
This voluntary code consists of seven fundamental principles,
namely Directors, Directors’ Remuneration, Relations with
Shareholders, Accountability and Audit, Institutional Investors,
Other Investors and Sustainability Reporting. The level
of adoption of the best practices mentioned under each
fundamental principle is depicted below:
Number Corporate Governance Principle
Adoption Status
Level of Adoption
A Directors A.1 The Board
Senkadagala Finance is headed by an effective Board which direct, lead and control the Company.
A.1.1 Board Meetings Adopted Board met 12 times during the year, at approximately monthly intervals. Details of the meetings and individual attendance are given on page 101.
A.1.2 Board responsibilities Adopted The Board of Directors of Senkadagala Finance is responsible for the following:
– Formulating, implementing and executing a sound business strategy.
– Ensuring CEO and the management team possesses the skills, experience and knowledge to device the strategy.
– Having a proper succession plan for the Key Management Personnel including CEO.
– Securing integrity of information, prudent management of risks, designing effective internal controls, and ensuring business continuity.
– Ensuring compliance with laws and regulations.
– Considering all stakeholder interests in the corporate decision-making process.
– Recognising sustainable business development in Company’s strategy, decisions and other activities.
– Company’s values and standards are set with emphasis on adopting appropriate accounting policies.
A.1.3 Independent professional advice
Adopted Independent professional advice could be obtained by the Directors as and when required at the Company’s expense.
A.1.4 Access to the Company Secretary
Adopted All Directors have the opportunity to obtain advice and services of the Company Secretary without any restriction.
There has not been any instance where there is a requirement to remove the Secretaries of the Company.
A.1.5 Independent judgement of Directors
Adopted Directors bring independent judgement and scrutiny on decisions taken by the Board on issues of strategy, performance, resources and standard of its business conduct.
A.1.6 Directors’ dedication of adequate time and efforts
Adopted Board of Directors of the Company dedicates sufficient time to review Board papers and call for additional information and clarifications if required. And also follows up on actions taken for issues discussed at the meetings.
A.1.7 Training for Directors Adopted All Directors are given the opportunity to get trained. Specific training on financial services industry is also available by way of presentations to the Board and attending seminars such as Director’s symposium at CBSL, etc.
CO
RP
OR
AT
E G
OV
ER
NA
NC
E

AN
NU
AL
RE
PO
RT
20
17
/1
8 S
EN
KA
DA
GA
LA
FIN
AN
CE
PL
C
93
Number Corporate Governance Principle
Adoption Status
Level of Adoption
A.2 Chairman and Chief Executive Officer
In Senkadagala Finance PLC, Chairman is responsible for conducting the business of the Board while MD/CEO of the Company is responsible for conducting the business of the Company.
A.2.1 Key tasks of Chairman and CEO
Adopted The roles of the Chairman and MD/CEO have been separated to ensure that no individual has unfettered powers of decision-making.
A.3 Chairman’s Role
Chairman of the Company is responsible for effective conduct of the Board as to preserve the order and good corporate governance.
A.3.1 Role of the Chairman Adopted The Chairman who is an Independent Non-Executive Director ensures effective discharge of Board functions through:
– Having monthly Board meetings with adequate notice preserving the agenda prepared by the Company Secretary under his close supervision.
– Ensuring effective participation of both Executive and Non-Executive Directors in the decision-making process while maintaining the balance of power among them.
– Encouraging effective contribution of all the Directors’ respective capabilities towards benefit of the Company.
– Obtaining views of all Directors for issues under consideration.
– Ensuring that the Board is in complete control of the Company’s affairs and alerts to its obligations to shareholders while maintaining proper communication with all the stakeholders.
A.4 Financial Acumen
The Board of the Company consists of members with sufficient financial acumen and knowledge to offer guidance on matters of finance.
A.4.1 Availability of sufficient financial acumen and knowledge
Adopted The Board includes fellow members of both local and international professional accounting bodies. (The details of qualifications of Directors are given on pages 82 and 83). These Directors are having sufficient financial acumen and knowledge to offer guidance on matters of finance to the Board.
A.5 Board Balance
The Board of the Company consists of five Non-Executive Directors and five Executive Directors.
A.5.1 Ratio of Executive and Non-Executive Directors
Adopted The Company has a 1:1 ratio and it ensures that the Board decisions are taken impartially. The roles of the Chairman and the MD/CEO are not vested in one person.
A.5.2 Independent Directors Adopted All the Non-Executive Directors are independent and within the requirements of the Code.
A.5.3 Mode of Independent Adopted All Independent Directors are Independent of Management and free of business relationships so that they could exercise their unfettered and independent judgement over decisions without any material interference.
A.5.4 Declaration of Independence
Adopted All Independent Non-Executive Directors submit their annual declarations as to their independence against the specified criteria.
A.5.5 Determination of independence of the Directors by the Board
Adopted The Board determines that the submission of declaration by the Independent Directors as to their independence is a fair representation and continues to evaluate it annually.
A.5.6 Alternate Director Not Applicable The requirement for appointing an Alternate Director has not arisen during the year.
A.5.7 &A.5.8
Senior Independent Director
Not Applicable Such situation has not arisen as roles of the Chairman and the MD/CEO have been clearly separated.
CO
RP
OR
AT
E G
OV
ER
NA
NC
E
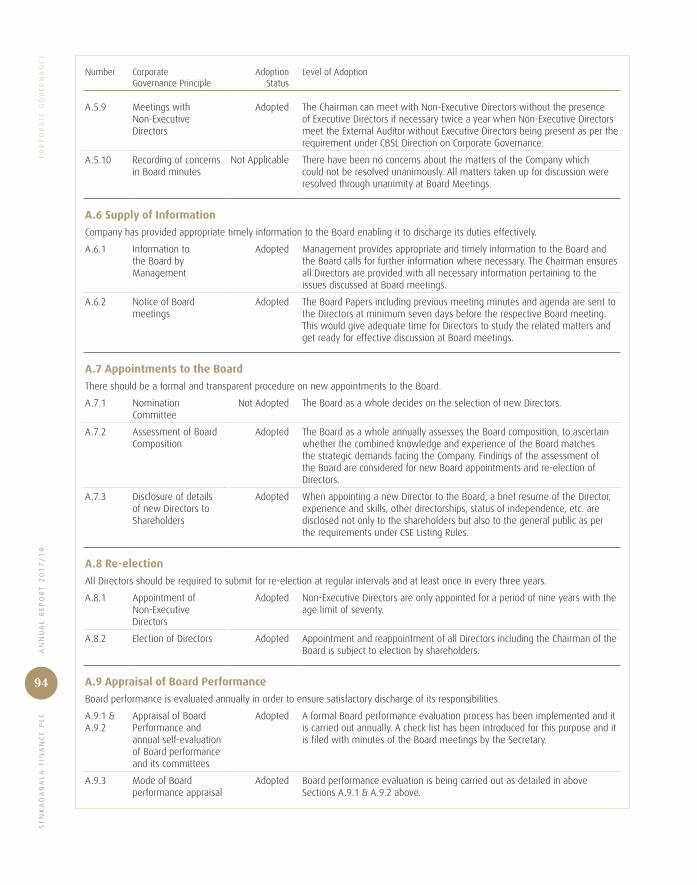
SE
NK
AD
AG
AL
A F
INA
NC
E P
LC
AN
NU
AL
RE
PO
RT
20
17
/1
8
94
Number Corporate Governance Principle
Adoption Status
Level of Adoption
A.5.9 Meetings with Non-Executive Directors
Adopted The Chairman can meet with Non-Executive Directors without the presence of Executive Directors if necessary twice a year when Non-Executive Directors meet the External Auditor without Executive Directors being present as per the requirement under CBSL Direction on Corporate Governance.
A.5.10 Recording of concerns in Board minutes
Not Applicable There have been no concerns about the matters of the Company which could not be resolved unanimously. All matters taken up for discussion were resolved through unanimity at Board Meetings.
A.6 Supply of Information
Company has provided appropriate timely information to the Board enabling it to discharge its duties effectively.
A.6.1 Information to the Board by Management
Adopted Management provides appropriate and timely information to the Board and the Board calls for further information where necessary. The Chairman ensures all Directors are provided with all necessary information pertaining to the issues discussed at Board meetings.
A.6.2 Notice of Board meetings
Adopted The Board Papers including previous meeting minutes and agenda are sent to the Directors at minimum seven days before the respective Board meeting. This would give adequate time for Directors to study the related matters and get ready for effective discussion at Board meetings.
A.7 Appointments to the Board
There should be a formal and transparent procedure on new appointments to the Board.
A.7.1 Nomination Committee
Not Adopted The Board as a whole decides on the selection of new Directors.
A.7.2 Assessment of Board Composition
Adopted The Board as a whole annually assesses the Board composition, to ascertain whether the combined knowledge and experience of the Board matches the strategic demands facing the Company. Findings of the assessment of the Board are considered for new Board appointments and re-election of Directors.
A.7.3 Disclosure of details of new Directors to Shareholders
Adopted When appointing a new Director to the Board, a brief resume of the Director, experience and skills, other directorships, status of independence, etc. are disclosed not only to the shareholders but also to the general public as per the requirements under CSE Listing Rules.
A.8 Re-election
All Directors should be required to submit for re-election at regular intervals and at least once in every three years.
A.8.1 Appointment of Non-Executive Directors
Adopted Non-Executive Directors are only appointed for a period of nine years with the age limit of seventy.
A.8.2 Election of Directors Adopted Appointment and reappointment of all Directors including the Chairman of the Board is subject to election by shareholders.
A.9 Appraisal of Board Performance
Board performance is evaluated annually in order to ensure satisfactory discharge of its responsibilities.
A.9.1 &A.9.2
Appraisal of Board Performance and annual self-evaluation of Board performance and its committees
Adopted A formal Board performance evaluation process has been implemented and it is carried out annually. A check list has been introduced for this purpose and it is filed with minutes of the Board meetings by the Secretary.
A.9.3 Mode of Board performance appraisal
Adopted Board performance evaluation is being carried out as detailed in above Sections A.9.1 & A.9.2 above.
CO
RP
OR
AT
E G
OV
ER
NA
NC
E

AN
NU
AL
RE
PO
RT
20
17
/1
8 S
EN
KA
DA
GA
LA
FIN
AN
CE
PL
C
95
Number Corporate Governance Principle
Adoption Status
Level of Adoption
A.10 Disclosure of Information in Respect of Directors
Details of Directors should be made available for the shareholders.
A.10.1 Disclosure of details of Directors in the Annual Report
Adopted The Name, qualifications and the brief profiles including nature of expertise of all the Directors have been set out on pages 82 and 83 in this Report.Please refer the table given in page 101 for directorship status, Board meeting and other Committee meeting attendance by the Directors of the Company.
A.11 Appraisal of Chief Executive Officer (CEO)
Performance of CEO is to be assessed at least annually to see whether the Company has achieved the objectives set by the Board.
A.11.1 Financial and non-financial targets for the CEO
Adopted At the commencement of the financial year, reasonable financial and non-financial targets for the CEO are set by the Board in consultation with the CEO in line with the short, medium and long-term objectives of the Company.
A.11.2 Evaluation of the performance of CEO
Adopted The Board periodically assesses the performance of the Company to ensure its short, medium and long-term objectives are achieved against its targets set and approved by the Board.
B. Directors’ Remuneration B.1 Remuneration Procedure
Company should have a well-established, formal and transparent procedure for developing an effective policy on Executive remuneration and remuneration packages for individual Directors where no Director is involved in deciding his/her own remuneration.
B.1.1 Remuneration Committee
Adopted A Remuneration Committee has been set-up to make recommendations to the Board on the Company’s remuneration framework. Details have been given on page 104 in the Report of the Remuneration Committee.
B.1.2 Composition of the Remuneration Committee
Adopted All the members of the Remuneration Committee are Independent Non-Executive Directors.
B.1.3 Disclosures in the Annual Report
Adopted Details of the members and the Chairman of the Remuneration Committee have been given on page 104 of this Annual Report under Report of the Remuneration Committee.
B.1.4 Remuneration of the Non-Executive Directors
Adopted The Board as a whole decide on the remuneration of the Non-Executive Directors.
B.1.5 Consultation of the Chairman or the CEO and access to professional advice
Adopted Remuneration Committee consults the Chairman about its proposals where necessary. CEO attends the Remuneration Committee meetings by invitation. External professional advice is obtained where necessary in determining the remuneration of the Directors and senior level staff members.
B.2 The Level and Make-Up of Remuneration
The Code requires the Board to establish the levels of remuneration for both Executive and Non-Executive Directors which should be sufficient to attract and retain the Directors needed to run the Company successfully. A proportion of the Executive Directors’ remuneration should be structured to link rewards to corporate and individual performance.
B.2.1 Remuneration of Executive Directors
Adopted The remuneration framework of the Executive Directors has been designed to attract, retain and motivate them of the quality required and avoid paying more than what is necessary for the purpose.
B.2.2 Positioning remuneration levels of the Company
Adopted The Remuneration Committee in deciding the remuneration levels of the Company takes account of such levels in comparable companies while paying attention to its relative performance.
B.2.3 Comparison of Remuneration with other companies in the Group
Not Applicable This is not applicable as there are no units comparable for this purpose within the Group.
CO
RP
OR
AT
E G
OV
ER
NA
NC
E
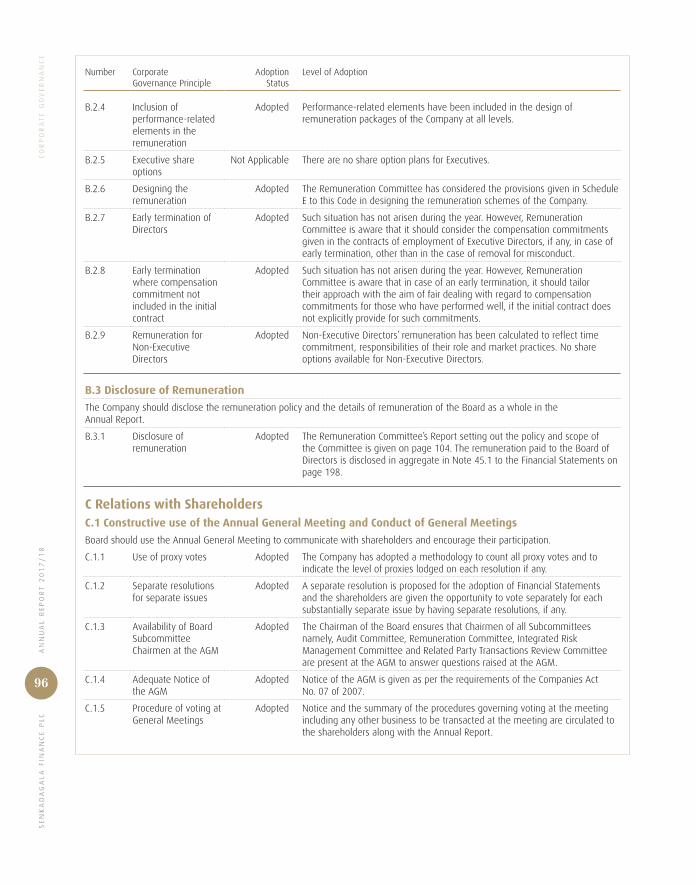
SE
NK
AD
AG
AL
A F
INA
NC
E P
LC
AN
NU
AL
RE
PO
RT
20
17
/1
8
96
Number Corporate Governance Principle
Adoption Status
Level of Adoption
B.2.4 Inclusion of performance-related elements in the remuneration
Adopted Performance-related elements have been included in the design of remuneration packages of the Company at all levels.
B.2.5 Executive share options
Not Applicable There are no share option plans for Executives.
B.2.6 Designing the remuneration
Adopted The Remuneration Committee has considered the provisions given in Schedule E to this Code in designing the remuneration schemes of the Company.
B.2.7 Early termination of Directors
Adopted Such situation has not arisen during the year. However, Remuneration Committee is aware that it should consider the compensation commitments given in the contracts of employment of Executive Directors, if any, in case of early termination, other than in the case of removal for misconduct.
B.2.8 Early termination where compensation commitment not included in the initial contract
Adopted Such situation has not arisen during the year. However, Remuneration Committee is aware that in case of an early termination, it should tailor their approach with the aim of fair dealing with regard to compensation commitments for those who have performed well, if the initial contract does not explicitly provide for such commitments.
B.2.9 Remuneration for Non-Executive Directors
Adopted Non-Executive Directors’ remuneration has been calculated to reflect time commitment, responsibilities of their role and market practices. No share options available for Non-Executive Directors.
B.3 Disclosure of Remuneration
The Company should disclose the remuneration policy and the details of remuneration of the Board as a whole in the Annual Report.
B.3.1 Disclosure of remuneration
Adopted The Remuneration Committee’s Report setting out the policy and scope of the Committee is given on page 104. The remuneration paid to the Board of Directors is disclosed in aggregate in Note 45.1 to the Financial Statements on page 198.
C Relations with Shareholders C.1 Constructive use of the Annual General Meeting and Conduct of General Meetings
Board should use the Annual General Meeting to communicate with shareholders and encourage their participation.
C.1.1 Use of proxy votes Adopted The Company has adopted a methodology to count all proxy votes and to indicate the level of proxies lodged on each resolution if any.
C.1.2 Separate resolutions for separate issues
Adopted A separate resolution is proposed for the adoption of Financial Statements and the shareholders are given the opportunity to vote separately for each substantially separate issue by having separate resolutions, if any.
C.1.3 Availability of Board Subcommittee Chairmen at the AGM
Adopted The Chairman of the Board ensures that Chairmen of all Subcommittees namely, Audit Committee, Remuneration Committee, Integrated Risk Management Committee and Related Party Transactions Review Committee are present at the AGM to answer questions raised at the AGM.
C.1.4 Adequate Notice of the AGM
Adopted Notice of the AGM is given as per the requirements of the Companies Act No. 07 of 2007.
C.1.5 Procedure of voting at General Meetings
Adopted Notice and the summary of the procedures governing voting at the meeting including any other business to be transacted at the meeting are circulated to the shareholders along with the Annual Report.
CO
RP
OR
AT
E G
OV
ER
NA
NC
E

AN
NU
AL
RE
PO
RT
20
17
/1
8 S
EN
KA
DA
GA
LA
FIN
AN
CE
PL
C
97
Number Corporate Governance Principle
Adoption Status
Level of Adoption
C.2 Communication with Shareholders
Board should implement effective communication with shareholders.
C.2.1 Channel to reach all shareholders of the Company
Adopted The Annual Report and the AGM form the primary channel of communication. Shareholders are given the Annual Report with adequate time to raise any issues at AGM based on the information published therein. Moreover, interim reports, stock exchange announcements, etc. also form part of effective communication as those are available in the respective websites and in the Company website.
C.2.2 Policy and Methodology for communication with shareholders
Adopted The Company has adopted an open communication policy with its shareholders by making them available timely, relevant and accurate information with fair disclosures.
C.2.3 Disclosure of Implementation of the above Policy and Methodology
Adopted Printed Annual Reports are sent along with the Notice of the AGM. Annual Report, Interim Financial Statements and CSE announcements are published in respective institution’s website and the Company website.
C.2.4 Contact person for communication
Adopted The Directors and the Senior Management could be contacted by the shareholders. The contact details are available in the Company’s website and for any questions, requests and comments, Shareholders may at any time contact the Company Secretary.
C.2.5 &C.2.6
Communication by the shareholders with the Company
Adopted The Company Secretary receives all the correspondence and delivers to the Board or relevant individual Director at the earliest possible time.
C.2.7 The process for responding to shareholders’ matters
Adopted Through the Company’s Board Secretary the Board or individual Director/s will respond to shareholders’ matters.
C.3 Major and Material Transactions
Directors should disclose all major and material transactions to shareholders.
C.3.1 Major transactions Not Applicable Company did not enter into or committed to any “major transaction” during the financial year.
D Accountability and AuditD.1 Financial Reporting
The Board should present a balanced and understandable assessment of the Company’s financial position, performance and prospects.
D.1.1 Board’s responsibility for statutory and regulatory reporting
Adopted Interim and Annual Financial Statements, other price sensitive public reports, reports to regulators and reports required as per statutory requirements have been presented as per the requirements of the Companies Act No. 07 of 2007, the Finance Business Act No. 42 of 2011, Other Regulatory Authorities such as the Central Bank of Sri Lanka, Colombo Stock Exchange and Department of Inland Revenue.
D.1.2 Declarations in the Directors’ Report
Adopted The Directors have made all their declarations in the, “Annual Report of the Board of Directors” given on pages 126 to 132.
D.1.3 Statement of Directors’ and Auditors’ Responsibility for Financial Statements and Statement on Internal Controls
Adopted The Statement of “Directors’ Responsibility for Financial Reporting” is given on pages 126 and 133 of the Annual Report.
Auditors’ reporting responsibility is given in their Report on the Financial Statements on pages 134 to 138.
The Directors’ Statement on Internal Controls is given on page 133 and Auditors’ certification on the Directors’ Statement on Internal Controls is also given on page 133.
CO
RP
OR
AT
E G
OV
ER
NA
NC
E
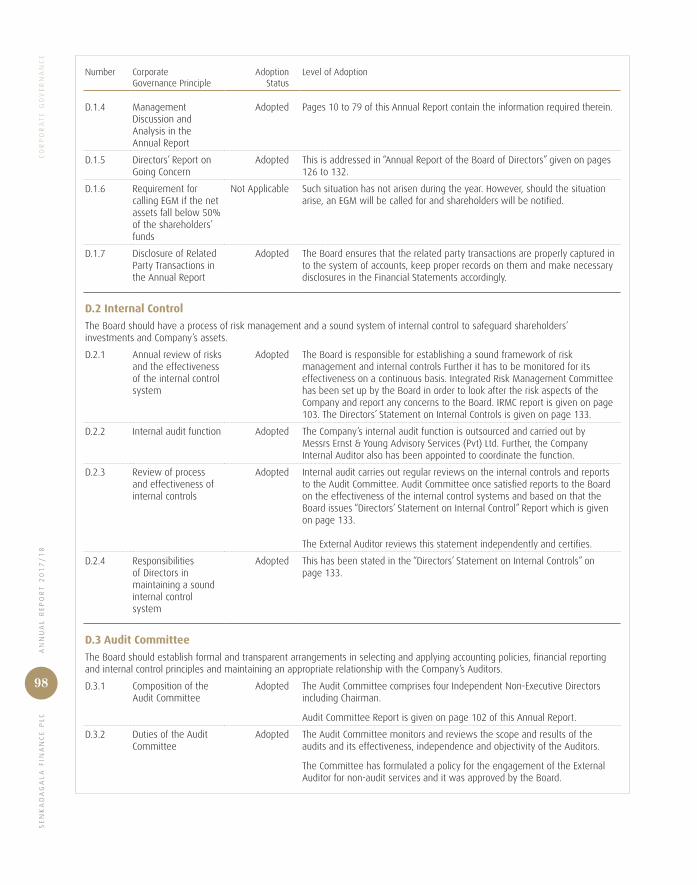
SE
NK
AD
AG
AL
A F
INA
NC
E P
LC
AN
NU
AL
RE
PO
RT
20
17
/1
8
98
Number Corporate Governance Principle
Adoption Status
Level of Adoption
D.1.4 Management Discussion and Analysis in the Annual Report
Adopted Pages 10 to 79 of this Annual Report contain the information required therein.
D.1.5 Directors’ Report on Going Concern
Adopted This is addressed in “Annual Report of the Board of Directors” given on pages 126 to 132.
D.1.6 Requirement for calling EGM if the net assets fall below 50% of the shareholders’ funds
Not Applicable Such situation has not arisen during the year. However, should the situation arise, an EGM will be called for and shareholders will be notified.
D.1.7 Disclosure of Related Party Transactions in the Annual Report
Adopted The Board ensures that the related party transactions are properly captured in to the system of accounts, keep proper records on them and make necessary disclosures in the Financial Statements accordingly.
D.2 Internal Control
The Board should have a process of risk management and a sound system of internal control to safeguard shareholders’ investments and Company’s assets.
D.2.1 Annual review of risks and the effectiveness of the internal control system
Adopted The Board is responsible for establishing a sound framework of risk management and internal controls Further it has to be monitored for its effectiveness on a continuous basis. Integrated Risk Management Committee has been set up by the Board in order to look after the risk aspects of the Company and report any concerns to the Board. IRMC report is given on page 103. The Directors’ Statement on Internal Controls is given on page 133.
D.2.2 Internal audit function Adopted The Company’s internal audit function is outsourced and carried out by Messrs Ernst & Young Advisory Services (Pvt) Ltd. Further, the Company Internal Auditor also has been appointed to coordinate the function.
D.2.3 Review of process and effectiveness of internal controls
Adopted Internal audit carries out regular reviews on the internal controls and reports to the Audit Committee. Audit Committee once satisfied reports to the Board on the effectiveness of the internal control systems and based on that the Board issues “Directors’ Statement on Internal Control” Report which is given on page 133.
The External Auditor reviews this statement independently and certifies.
D.2.4 Responsibilities of Directors in maintaining a sound internal control system
Adopted This has been stated in the “Directors’ Statement on Internal Controls” on page 133.
D.3 Audit Committee
The Board should establish formal and transparent arrangements in selecting and applying accounting policies, financial reporting and internal control principles and maintaining an appropriate relationship with the Company’s Auditors.
D.3.1 Composition of the Audit Committee
Adopted The Audit Committee comprises four Independent Non-Executive Directors including Chairman.
Audit Committee Report is given on page 102 of this Annual Report.
D.3.2 Duties of the Audit Committee
Adopted The Audit Committee monitors and reviews the scope and results of the audits and its effectiveness, independence and objectivity of the Auditors.
The Committee has formulated a policy for the engagement of the External Auditor for non-audit services and it was approved by the Board.
CO
RP
OR
AT
E G
OV
ER
NA
NC
E

AN
NU
AL
RE
PO
RT
20
17
/1
8 S
EN
KA
DA
GA
LA
FIN
AN
CE
PL
C
99
Number Corporate Governance Principle
Adoption Status
Level of Adoption
D.3.3 Terms of Reference of the Audit Committee
Adopted The Audit Committee has been established by the Board of Directors to assist oversight of financial reporting, internal controls, risk management and functions relating to internal and external audit.
The Committee holds the responsibility for overseeing the preparation and presentation of the Company’s Financial Statements with adequate disclosures in the Financial Statements in accordance with the Companies Act No. 07 of 2007 and applicable Sri Lanka Financial Reporting Standards. The Committee is also responsible for ensuring the adequacy and efficiency of internal controls adopted by the Company in maintaining accounting records and preparing Financial Statements and make recommendations to the Board of Directors on matters regarding the Internal and External Auditors including their independence, performance, terms of engagement and remuneration.
D.3.4 Disclosures of the Audit Committee
Adopted The names of the members of the Audit Committee are given in the Audit Committee Report on page 102.
The Audit Committee has undertaken an annual evaluation of the independence and objectivity of the External Auditor and the effectiveness of the audit process and is satisfied as disclosed in the Audit Committee Report on page 102.
D.4 Code of Business Conduct and Ethics
Company must adopt a Code of Business Conduct and Ethics for Directors and Key Management Personnel and must promptly disclosed any deviations from that code.
D.4.1 Code of Business Conduct and Ethics
Adopted Senkadagala Finance has incorporated in its HR code as well as in other manuals of operations, areas such as addressing of conflict of interests, conditions in receiving gifts or any other benefits, accountability, confidentiality of information, record keeping, corporate opportunities, fair dealing, protection and proper use of the Company’s assets and compliance with applicable laws and regulations including insider trading laws and encouraging the reporting of any illegal or unethical behaviour.
D.4.2 Affirmation of the Code of Conduct and Ethics
Adopted The Chairman, hereby confirms that he is not aware of any material violations of the terms and conditions contained in above mentioned Code of Conduct and Ethics.
D.5 Corporate Governance Disclosures
Company should disclose the extent of adherence to principles and practices of good Corporate Governance.
D.5.1 Corporate Governance Report
Adopted This Report from pages 80 to 105 satisfies the requirement.
CO
RP
OR
AT
E G
OV
ER
NA
NC
E

SE
NK
AD
AG
AL
A F
INA
NC
E P
LC
AN
NU
AL
RE
PO
RT
20
17
/1
8
100
Number Corporate Governance Principle
Adoption Status
Level of Adoption
E. Institutional Investors E.1 Shareholder Voting
Institutional shareholders have a responsibility to make considered use of their votes and encouraged to ensure that their voting intentions are translated into practice
E.1.1 Communication with Institutional Shareholders
Adopted Mainly the AGM is used for effective communication with the shareholders. The Chairman communicates the views and queries of the shareholders to the Board and Senior Management.
E.2 Evaluation of Governance Disclosures
Company should encourage institutional investors to give due weightage to all relevant factors drawn to their attention when evaluating the governance arrangements of the Company, particularly those relating to Board structure and composition.
E.2 Evaluation of the Corporate Governance arrangements
Adopted When evaluating the Company’s Corporate Governance arrangements, institutional investors are encouraged to give due weight to all relevant factors drawn to their attention, particularly the Board structure and composition.
F. Other InvestorsF.1 Investing/Divesting Decisions
Individual shareholders should be encouraged to carry out adequate analysis or seek independent advice in investing and divesting decisions.
F.1 Individual investors investing/divesting decisions
Adopted By disclosing all required information that would be useful for individual shareholders, the Company encourages them to carry out adequate analysis or seek independent advice on investing or divesting decisions.
F.2 Shareholder Voting
Individual shareholders should be encouraged to participate and exercise their voting rights in General Meetings.
F.2 Individual shareholders’ voting rights
Adopted The Company sends adequate notices to all shareholders encouraging them to participate at General Meetings and this adequate time allows them to be prepared to duly exercise their voting rights.
G. Sustainability ReportingG.1 Principles of Sustainability Reporting
Company is moving towards sustainability reporting since 2013 and the details of how Company is adopting the seven principles under sustainability reporting have been given on pages 38 to 99.
CO
RP
OR
AT
E G
OV
ER
NA
NC
E

AN
NU
AL
RE
PO
RT
20
17
/1
8 S
EN
KA
DA
GA
LA
FIN
AN
CE
PL
C
101
Board and Committee Meetings – Attendance
Name Directorship Status Board Audit Committee
Integrated Risk
ManagementCommittee**
RemunerationCommittee
Related PartyTransactions
ReviewCommittee
Number of Meetings Held 12 04 11 04 03
Mr W M R S Dias ChairmanIndependent Non-Executive Director
12/12* – – – –
Dr P Ramanujam Deputy ChairmanIndependent Non-Executive Director
12/12 04/04 – 04/04 03/03
Mr L Balasuriya Managing Director/Chief Executive Officer Executive Director
11/12 04/04 – 04/04 –
Dr A Balasuriya Director – OperationsExecutive Director
09/12 – – – –
Dr M Balasuriya Director – PlanningExecutive Director
11/12 – – – –
Mrs L Fernando Director – Human Resources Executive Director
10/12 – – – –
Mr W A T Fernando Independent Non-Executive Director
09/12 04/04 – – –
Mr R Senanayake Independent Non-Executive Director
12/12 03/04 – 03/04 –
Mr T Collure Independent Non-Executive Director
11/12 04/04 04/11 03/04 03/03
Mr S Bandaranayake Additional Chief Executive Officer/ Executive Director
12/12 04/04 11/11 04/04 03/03
*Attended/Eligible to attend
**Key Management Personnel have attended the meetings
CO
RP
OR
AT
E G
OV
ER
NA
NC
E

SE
NK
AD
AG
AL
A F
INA
NC
E P
LC
AN
NU
AL
RE
PO
RT
20
17
/1
8
102
Report of the Audit Committee
The Audit Committee has been established by the Board of
Directors to assist oversight of financial reporting, internal
controls and functions relating to internal and external audit.
The Committee holds the responsibility for overseeing the
preparation and presentation of the Company’s Financial
Statements with adequate disclosures in the Financial
Statements in accordance with the Companies Act No. 07 of
2007 and applicable Sri Lanka Financial Reporting Standards.
The Committee is also responsible for ensuring the adequacy
and efficiency of internal controls adopted by the Company
in maintaining accounting records and preparing Financial
Statements and make recommendations to the Board of
Directors on matters regarding the Internal and External
Auditors including their independence, performance, terms
of engagement and remuneration.
Composition
The audit committee comprised following directors;
z Mr W A T Fernando (FCMA) (MA) Colombo, Independent
Non-Executive Director – Chairman of the Audit Committee
z Dr P Ramanujam – Independent Non-Executive Director
z Mr T Collure – Independent Non-Executive Director
z Mr Raja Senanayake – Independent Non-Executive Director
(Brief profiles of Directors have been set out on page 82 in
this Report)
In addition, the Managing Director/Chief Executive Officer,
Executive Director/Additional CEO, AGM-Accounts, Chief
Financial Officer, Chief Manager-Risk and Audit and
representatives of Internal and External audit firms attend
the Audit Committee meetings by invitation to brief the
Committee on specific issues.
Other Senior Managers of the Company also attend whenever
their presence is requested.
Policy and Scope
The Committee discharges its responsibilities through a
series of meetings during the year. At these meetings,
the Committee reviews the reports of Internal Auditors
and External Auditors of the Company and interim and
final Financial Statements of the Company ensuring their
compliance with statutory and other requirements. The
number of meetings and attendance by the Committee
members at each of those meetings are given in the table
on page 101 of the Annual Report.
The Committee has reviewed the independence, objectivity
and performance of the internal audit function and the
adequacy of its resources. The findings of internal audits,
their evaluation of Company’s internal control systems and
level of risks pertaining to those findings, effectiveness
of implementation of audit recommendations are being
thoroughly discussed at the meetings and accordingly
advised the Board on matters of high significance.
The Audit Committee has undertaken the annual evaluation
of the independence and objectivity of the External Auditor
and the effectiveness of the audit process. And also the Audit
Committee had meetings with the External Auditors without
the presence of Executive Directors as per the corporate
governance requirements.
W A T Fernando
Chairman
Audit Committee
31 May 2018
AN
NU
AL
RE
PO
RT
20
17
/1
8 S
EN
KA
DA
GA
LA
FIN
AN
CE
PL
C
103
Report of the Integrated Risk Management Committee
The Integrated Risk Management Committee was formed in
order to assess the overall risk faced by the Company mainly
credit, market, liquidity, operational, strategy and other
statutory and regulatory risks.
Composition
The Integrated Risk Management Committee comprised
following Directors:
z Mr S D Bandaranayake – Executive Director/
Additional CEO – Chairman of the Committee
z Mr L Balasuriya – Executive Director,
CEO/Managing Director
z Mr T Collure – Independent Non-Executive Director
Senior Management representatives who attend the
meetings are:
z Mr P Ikiriwatte – Deputy CEO
z Mr J Jayatilake – GM-Operations
z Mr T De Silva – DGM – IT
z Mr T K Aturupana – AGM – Accounts
z Mr A D Hettiarachchi – AGM – Credit Control
z Mr N Rasingolla – AGM – IT
z Mr S D R S Fernando – AGM – Personnel and Administration
z Mr N Karunaratne – AGM – Legal/Customer Services
z Mr K Rajapaksa – Chief Financial Officer
z Mr S Supramaniam – Chief Manager – Treasury
z Mr L Perera - Manager – Foreign Currency
z Mr T Ranathunga – Chief Manager – Risk and Audit
Policy and Scope
The Committee meets on a regular basis and minutes
are maintained to ensure timely and adequate follow up.
Remedial actions are taken to address the areas of high
significance. The policies and the scope of activities of the
Committee are as follows:
z Assessing all risks, including credit, market, liquidity,
operational and strategic risk on a continuous basis using
specific risk indicators through the Company’s reporting
systems.
z Ensuring the level of current risk of the Company is within
the prudent levels acceptable to the Management based
on the Company’s risk appetite and the regulatory and
supervisory requirements.
z Taking appropriate remedial actions to mitigate the
effects of specific risks in case such risks are beyond
the prudent and acceptable levels on the basis of
the Company’s policies, procedures and regulatory
requirements.
z Review of the portfolio on a business line basis such as
product, region, sector, etc. to evaluate trends.
z Review of the performance branch-wise, district-wise and
region-wise in evaluating the branch expansion criteria.
z Reviewing any compliance related matters with applicable
laws and regulations.
S D Bandaranayake
Chairman
Integrated Risk Management Committee
31 May 2018

SE
NK
AD
AG
AL
A F
INA
NC
E P
LC
AN
NU
AL
RE
PO
RT
20
17
/1
8
104
Report of the Remuneration Committee
The Remuneration Committee has been set-up to determine
the human resources and remuneration policies relating
to Directors, the Managing Director/CEO and other Key
Management Personnel of the Company.
Composition
z Dr P Ramanujam – Independent Non-Executive Director-
Chairman of the Remuneration Committee
z Mr T Collure – Independent Non-Executive Director
z Mr Raja Senanayake – Independent Non-Executive Director
Mr L Balasuriya – Managing Director/Chief Executive Officer
and Mr S D Bandaranayake – Executive Director/Additional
Chief Executive Officer, attend meetings of the Remuneration
Committee by invitation.
Brief profiles of the members of the Committee are set out
on pages 82 of the Annual Report.
Policy and Scope
The Company’s remuneration policy aims to attract, motivate
and retain talent in a highly competitive environment with
the appropriate professional, managerial and operational
expertise necessary to achieve the objectives of the
Company. The Company remuneration framework for the
Managing Director/CEO and the Corporate Management team
is designed to create and enhance value for all stakeholders
of the Company and to ensure alignment between short
and long-term interests of the Company. The Committee
reviews all significant human resource policies and initiatives,
salary structures and terms and conditions relating to staff
at executive level. The Committee deliberates upon and
recommends to the Board of Directors the remuneration
packages, annual increments and bonuses of the Managing
Director, members of the Corporate Management team and
Senior Staff.
Fees
All Non-Executive Directors receive a fee for attendance at
Board meetings and for serving on Sub-Committees.
Committee Meetings
Number of meetings and attendance of the members of such
meetings are set out in page 101 of this Annual Report.
Access to Professional Advice
The Committee is authorised to seek external professional
advice as and when it deems necessary.
Dr P Ramanujam
Chairman
Remuneration Committee
31 May 2018
AN
NU
AL
RE
PO
RT
20
17
/1
8 S
EN
KA
DA
GA
LA
FIN
AN
CE
PL
C
105
Report of the Related Party Transactions Review Committee
The Related Party Transactions Review Committee has been
set up by the Board of Directors in order to strengthen the
process of identifying, recording and reporting of related
party transactions which in turn ensure strict compliance
with the rules and regulations governing Related Party
Transactions of Listed Entities and thus improve its internal
control mechanisms.
Composition
z Dr P Ramanujam – Independent Non-Executive Director
– Chairman of the Related Party Transactions Review
Committee
z Mr T Collure – Independent Non-Executive Director
z Mr S D Bandaranayake – Executive Director/Additional
Chief Executive Officer
Mr Kumudu Rajapakshe – Chief Financial Officer and
Mr Thushara Ranathunga – Chief Manager Risk and Audit
attend the meeting by invitation.
Policy and Scope
With the approval of the Board, Company has adopted a
policy on Related Party Transactions of the Company that
gives necessary guidelines in recognising, recording and
reporting of such transactions. It helps to determine whether
Related Party Transactions that are to be entered into by the
Company require the approval of the Board or shareholders
of the Company. Further the policy ensures that no Director of
the Company shall participate in any discussion of a proposed
Related Party Transaction for which he or she is a related
party, unless such Director is requested to do so by the
Committee for the express purpose of providing information
concerning the Related Party Transaction to the Committee.
Also it ensures that immediate market disclosures and
disclosures in the Annual Report as required by the applicable
rules/regulations are made in a timely and detailed manner.
Related Party Transactions During 2017/18
During the year 2017/18, there were no non-recurrent
or recurrent related party transactions that exceeded the
respective thresholds mentioned in the Listing Rules of the
Colombo Stock Exchange.
Details of other related party transactions of the Company
during the above period are disclosed in Note 45 to the
Financial Statements.
Committee Meetings
The number of meetings and attendance of the members of
such meetings are set out on page 101 of this Annual Report
Declaration
A declaration by the Board of Directors in the Annual Report
as a negative statement that no related party transaction
which exceeds the threshold levels mentioned in the Listing
Rules was entered into by the Company during 2017/18 is
given on page 127 of the Annual Report.
Dr P Ramanujam
Chairman
Related Party Transactions Review Committee
31 May 2018

SE
NK
AD
AG
AL
A F
INA
NC
E P
LC
AN
NU
AL
RE
PO
RT
20
17
/1
8
106
A wealth of knowledgeFifty years of knowledge has been carefully gathered. Today, it informs the operations of the Company every step of the way.
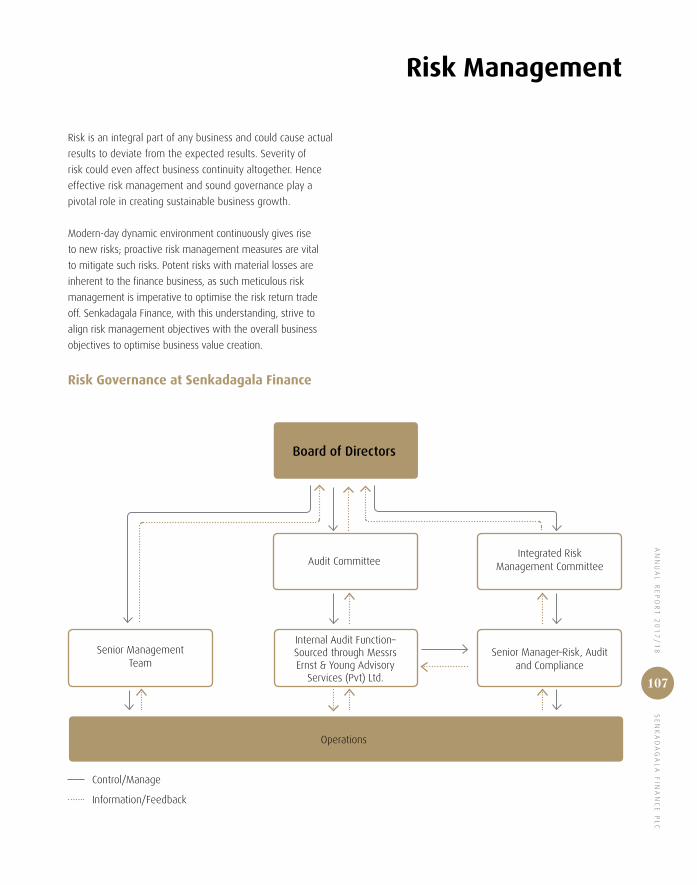
AN
NU
AL
RE
PO
RT
20
17
/1
8 S
EN
KA
DA
GA
LA
FIN
AN
CE
PL
C
107
Risk Management
Risk is an integral part of any business and could cause actual
results to deviate from the expected results. Severity of
risk could even affect business continuity altogether. Hence
effective risk management and sound governance play a
pivotal role in creating sustainable business growth.
Modern-day dynamic environment continuously gives rise
to new risks; proactive risk management measures are vital
to mitigate such risks. Potent risks with material losses are
inherent to the finance business, as such meticulous risk
management is imperative to optimise the risk return trade
off. Senkadagala Finance, with this understanding, strive to
align risk management objectives with the overall business
objectives to optimise business value creation.
Risk Governance at Senkadagala Finance
Control/Manage
Information/Feedback
Board of Directors
Audit CommitteeIntegrated Risk
Management Committee
Senior ManagementTeam
Internal Audit Function–Sourced through MessrsErnst & Young Advisory
Services (Pvt) Ltd.
Senior Manager–Risk, Auditand Compliance
Operations
SE
NK
AD
AG
AL
A F
INA
NC
E P
LC
AN
NU
AL
RE
PO
RT
20
17
/1
8
108
RIS
K M
AN
AG
EM
EN
T Senkadagala Finance believes that a holistic approach to risk
management is vital for a robust control mechanism. Hence
the primary role of risk governance is assumed at the Board
level, the Board holds the ultimate responsibility for risk
management and therefore overall risk strategy is decided
and risk objectives are set at this level. Also the Board
ensures that the corporate strategy and the risk strategy are
aligned to optimise the risk return tradeoff. As such, the first
line of defence on managing risks is the Board of Directors of
the Company.
The Integrated Risk Management Committee (IRMC), a
Subcommittee of the Board assesses the effectiveness of the
overall risk strategy of the Company in the context of changes
in the global and the local environment and recommends
effective risk management policies to safeguard stakeholder
interests. Further, it advises the Board on the course of action
to be taken to counter potential and emerging risks.
Operational Integrated Risk Management Committee,
consisting of the Senior Managers and department heads
gather monthly in conjunction with the IRMC to discuss
the effectiveness of the risk management policies and
procedures, evaluate current business activities in the
context of risk and developments in external and internal
environment to identify emerging risks. It also evaluates
operations in the context of risk. Periodical reports from each
department are submitted to this meeting assessing the risk
indicators against the predetermined risk parameters and
against the prescribed regulatory risk parameters. Reasons
for variances are discussed, while evaluating suggestions to
control such deviations.
The dialogue between the operational and executive level
managers is the ideal setting to identify the effectiveness
of the risk management techniques implemented in the top
down approach. The suggestions from this meeting
are presented at the Board level to further strengthen
the risk management framework of Senkadagala Finance.
This forms the second line of defence, bringing in the
middle line managers and the operations into the risk
management process.
Corporate risk objectives are communicated to the
operational level staff by way of risk policies and the risk
management framework, which define the risk appetite of
the entity and prompts a risk culture in the Organisation.
Controls are regularly streamlined to identify and counter day-
to-day operational risks. The responsibility to manage these
risk criteria within tolerable limits is shared among the risk
assuming managers and the higher level management. This
collective approach enables the Company to manage
risk effectively.
Senkadagala Finance has a continuous internal audit process,
utilising the co-sourced services of Messrs Ernst & Young
Advisory Services (Pvt) Ltd., reporting directly to the Audit
Committee and the Board of Directors. Monthly reports are
submitted, communicating deviations from the standard
operating procedures, misconducts and lapses in the internal
control process, while identifying the severity of impact.
This provides an independent assurance for the internal
control process of the Company. The presence of continuous
monitoring and assurance provides an additional level of
defense in the risk management process of the Company.
Hence this provides the third line of defence with regard to
risk management.
Improved financial performance and the sustainable growth
achieved in the recent past reflect the effectiveness of the
risk management framework of Senkadagala Finance.
Primary risk management objectives of Senkadagala Finance
z Identify, measure and control potential risks that hinder
the profitability of the entity.
z Manage the financial position in order to strike a balance
between assets and liabilities to optimise the value
creation for the entity.
z Ensure that adequate controls are in place to curtail
downside of risk, while maximising returns.
Environmental scanning
Standard risk management approaches are well-honed to
mitigate conventional risks, however the accelerated pace
of change and deepened interconnectivity have added
complexity to risk which requires meticulous environmental
scanning to identify.
Global environment
Despite economic growth picking up in year 2017 there
are many impending risks brewing in the global arena.
Growing global political tension, deteriorating environmental
conditions and increasing cyber dependency are a few such
critical risk factors.
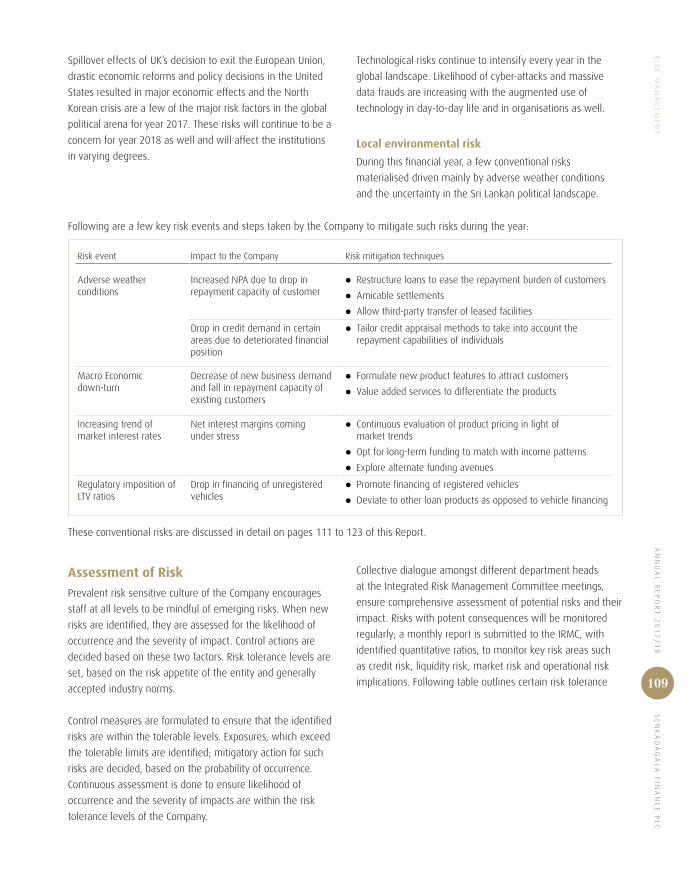
AN
NU
AL
RE
PO
RT
20
17
/1
8 S
EN
KA
DA
GA
LA
FIN
AN
CE
PL
C
109
RIS
K M
AN
AG
EM
EN
T
Spillover effects of UK’s decision to exit the European Union,
drastic economic reforms and policy decisions in the United
States resulted in major economic effects and the North
Korean crisis are a few of the major risk factors in the global
political arena for year 2017. These risks will continue to be a
concern for year 2018 as well and will affect the institutions
in varying degrees.
Technological risks continue to intensify every year in the
global landscape. Likelihood of cyber-attacks and massive
data frauds are increasing with the augmented use of
technology in day-to-day life and in organisations as well.
Local environmental risk
During this financial year, a few conventional risks
materialised driven mainly by adverse weather conditions
and the uncertainty in the Sri Lankan political landscape.
Following are a few key risk events and steps taken by the Company to mitigate such risks during the year:
Risk event Impact to the Company Risk mitigation techniques
Adverse weather conditions
Increased NPA due to drop in repayment capacity of customer
z Restructure loans to ease the repayment burden of customers
z Amicable settlements
z Allow third-party transfer of leased facilities
Drop in credit demand in certain areas due to deteriorated financial position
z Tailor credit appraisal methods to take into account the repayment capabilities of individuals
Macro Economic down-turn
Decrease of new business demand and fall in repayment capacity of existing customers
z Formulate new product features to attract customers
z Value added services to differentiate the products
Increasing trend of market interest rates
Net interest margins coming under stress
z Continuous evaluation of product pricing in light of market trends
z Opt for long-term funding to match with income patterns
z Explore alternate funding avenues
Regulatory imposition of LTV ratios
Drop in financing of unregistered vehicles
z Promote financing of registered vehicles
z Deviate to other loan products as opposed to vehicle financing
These conventional risks are discussed in detail on pages 111 to 123 of this Report.
Assessment of Risk
Prevalent risk sensitive culture of the Company encourages
staff at all levels to be mindful of emerging risks. When new
risks are identified, they are assessed for the likelihood of
occurrence and the severity of impact. Control actions are
decided based on these two factors. Risk tolerance levels are
set, based on the risk appetite of the entity and generally
accepted industry norms.
Control measures are formulated to ensure that the identified
risks are within the tolerable levels. Exposures, which exceed
the tolerable limits are identified; mitigatory action for such
risks are decided, based on the probability of occurrence.
Continuous assessment is done to ensure likelihood of
occurrence and the severity of impacts are within the risk
tolerance levels of the Company.
Collective dialogue amongst different department heads
at the Integrated Risk Management Committee meetings,
ensure comprehensive assessment of potential risks and their
impact. Risks with potent consequences will be monitored
regularly; a monthly report is submitted to the IRMC, with
identified quantitative ratios, to monitor key risk areas such
as credit risk, liquidity risk, market risk and operational risk
implications. Following table outlines certain risk tolerance

SE
NK
AD
AG
AL
A F
INA
NC
E P
LC
AN
NU
AL
RE
PO
RT
20
17
/1
8
110
levels against the reported ratios used to control various risks of the entity:
Risk Criteria Risk indicator Tolerance level Actual ratio
Concentration risk
Vehicle type Percentage exposure to an individual vehicle type
30% Motor cars – 26.3%Commercial vehicles – 20.0% (highest exposures)
Registered Vs unregistered vehicles
Percentage exposure to registered vehicles 70% 85%
Percentage exposure to un-registered vehicles 30% 15.0%
Higher exposure to large borrowers
Facilities over Rs. 10 Mn. Total Portfolio 25% 13.2%
Asset quality
Region-wise Gross NPA ratio in each region 3% Region 9 – 2.42% (Highest reported)
Probable defaults Infection ratio 3% 1.13%
Liquidity risk
High deposit withdrawals Deposit renewal ratio >70% 78%
This process has allowed the Company to maintain a robust
risk management mechanism enabling value creation for
stakeholders at all levels.
Risk Policies and Frameworks
Risk objectives are cascaded down to functional levels by
way of policies, frameworks and internal controls. Procedure
manuals are used to set up the framework for effective risk
management, while communicating the risk tolerance levels
to functional managers and operational staff.
The Management, with its proactive attitude towards
risk management, has created a risk culture within the
Organisation. This has put in place a risk management
framework effective at all levels of the Organisation. The risk
culture helps to improve awareness among employees to
identify, assume and manage risks, while aligning them with
the entity’s risk appetite.
Risk Controls and Review
To optimise the risk return trade-off, it is vital to ensure
the adequacy of the risk management process; therefore
Senkadagala Finance has stringent reviews and control
mechanisms in place.
The Audit Committee, a Subcommittee of the Board, plays a
key role in this. The primary purpose of this Committee is to
assist the Board of Directors with the general oversight of the
financial reporting mechanism; they oversee and advise the
Board on affairs with the External and Internal Auditors. The
Audit Committee is also responsible to ensure adequacy and
efficiency of the internal controls adopted by the Company.
Report of the Audit Committee on page 102 of this
report contains a detailed description of the composition,
functionality and scope of the Audit Committee.
The Integrated Risk Management Committee, another
Subcommittee of the Board, plays a pivotal role in the risk
management process of the Company. The Manager Risk,
Audit and Compliance submits a periodic report assessing
predetermined risk parameters to the Integrated Risk
Management Committee. During this Committee meeting,
there is a dialogue on actual risk indicators against the risk
tolerance levels for various risk areas of the entity and on
adequacy and the efficiency of control measures taken for
risk prone functions. Consequently, a report summarising and
recommending feasible course of action regarding emerging
risk elements and the effectiveness of the existing risk
control mechanisms is submitted to the Board of Directors.
Report of the Integrated Risk Management Committee on
page 103 of this Report, contains a detailed description of
the composition and the functionality of the Integrated Risk
Management Committee.
RIS
K M
AN
AG
EM
EN
T

AN
NU
AL
RE
PO
RT
20
17
/1
8 S
EN
KA
DA
GA
LA
FIN
AN
CE
PL
C
111
Continuous internal audit, employing the co-sourced services
of Messrs Ernst & Young Advisory Services (Pvt) Ltd., is
reporting directly to the Audit Committee and the Board of
Directors. Monthly reports are submitted, communicating
deviations from the standard operating procedures,
misconducts and lapses in the internal control process,
while identifying the severity of impact.
Risk mapping at Senkadagala Finance
1. Credit Risk
1.1. Default risk
1.2. Credit concentration
2. Liquidity Risk
3. Operational Risk
3.1. Internal controls
3.2. Technology-related Risk
3.3. Disasters and contingencies
4. Market Risks
4.1. Interest rate Risk
4.2. Equity Risk
4.3. Foreign exchange Risk
5. Regulatory and Compliance Risk
6. Strategic Risk
7. Reputation Risk
Significant
Consequence
Like
lihoo
d
Low
Hig
h
1.14.1
4.3
1.2
2
6
3.2
5
3.1
4.2
7
3.3
Credit Risk
Credit risk is potential financial losses due to failure of
counterparties to discharge the contractual obligations or
in simple terms losses arising due to defaults. Financial
institutions, engaged in financial intermediation are highly
susceptible to credit risk. Materialisation of such risks
creates high levels of defaults that will have detrimental
effect on the asset quality, profitability and the liquidity
position of the entity.
Credit risk could materialise due to deteriorated
creditworthiness of borrowers as well as due to adverse
fluctuations in the macroeconomic conditions. Credit risk is an
integral part of finance business. Therefore, this risk should
be meticulously managed to optimise the risk
return tradeoff.
10
8
6
4
2
020182015 2016 2017
%
Senkadagala Finance PLC
Industry
Gross NPA ratio
2014
Senkadagala Finance has identified credit risk as a key risk
segment for the Company and strives to maintain the Non-
performing asset ratio within tolerable limits. The Company
has one of the lowest NPA ratios among industry players. In
March 2018 the gross NPA ratio stood at 2.28% compared to
1.64% of March 2017. The industry average NPA ratio of the
LFC/SLC sector was 5.9% for the year 2017.
RIS
K M
AN
AG
EM
EN
T

SE
NK
AD
AG
AL
A F
INA
NC
E P
LC
AN
NU
AL
RE
PO
RT
20
17
/1
8
112
How we manage credit risk
Marketing Staff Recovery Department Legal Department
Customer appraisal
Credit evaluation
Courtesy reminder via SMS
Phone calls
Relationship management
Payment reminders via mail
Site visit by Recovery Officers
Follow-up action
Restructure facility
Letter of Termination
Letter of Demand
Repossession of assets
Mediation Board to recover
the outstandings
Instigate legal action
Credit risk at Senkadagala Finance
Risk Type Likelihood Consequence Objectives for risk mitigation
Course of action
Default risk (failure of counterparties to discharge contractual obligations)
High(an inherent risk for the finance business)
Moderate (The size of exposure is a deciding factor)
Attain a sound loan portfolio
z A dynamic credit evaluation process is in place which comprehensively assesses the customers, rating in accordance with the potential default risk
z Ongoing training for employees engaged in credit evaluation
z Approval hierarchies are set to streamline disbursement of loans with high exposures
z Risk tolerance levels are set for identified key risk parameters and strict adherence to such levels
z Exposure limits are set for economic sector based on the historical loss experience
z Exposure limits are set for asset categories based on historical loss given defaults
z Maintain a low LTV ratio in identified high risk sectors and asset categories
z Exposure to individuals are restricted for tolerable limits z Ensure that the extended finance is in conformity with
the Company’s Environmental & Social Management System
Maintain a low Non-Performing Asset ratio
z Gross NPA ratio targets are set and communicated to employees periodically
Maintain a low infection ratio
z Create a sense of responsibility with the loan officer by which he/she will be an active participant in the recovery process
z Identify potential defaults proactively by maintaining close links with customers and analysing payment patterns
z Centralised Recovery Department oversees the recovery process ensuring that exposure to credit risk is within tolerable limits
z Set performance objectives in line with the Company’s risk objectives
RIS
K M
AN
AG
EM
EN
T

AN
NU
AL
RE
PO
RT
20
17
/1
8 S
EN
KA
DA
GA
LA
FIN
AN
CE
PL
C
113
Risk Type Likelihood Consequence Objectives for risk mitigation
Course of action
Minimise the loss given default
z Comprehensive review of securities undertaken before extending the loan facility
z Obtaining internal as well as external valuation of collaterals to prevent judegemental deviations at loan disbursements
z Strict controls over the loan to value ratio specially in identified high risk asset categories
z Continuous auction sale of seized assets through an online system which enables the Company to dispose repossessed assets for the highest bid
z Loan protection plan in place to prevent losses due to demise of the primary borrower
Control the movement in arrears buckets
z Centralised review of the portfolio to maintain portfolio quality
Credit concentration risk (risks arising due to significant single exposures)
Moderate Significant Function of exposure to individual borrowers
Controlled exposures
z Exposure limits are set for economic sector based on the historical loss experience
z Exposure limits are set for asset category based on the loss given default experience
z Scrutinise the LTV ratio for individual contracts z Exposure to individual customers are restricted to
tolerable limits
Economic sector exposure
Agriculture and Fishing
Tourism
Construction
Financial and Business Services
Pawning
Manufacturing
Transport
Trades
Other Services
Other Customers
5%21%
4%
29%
17%
9%3% 3% 6%
3%
Monitor the movement in arrears buckets
z Strengthen ties with individually significant customers z Recovery responsibility is held with the loan officer/
relationship manager
Manage the loss given default
z Insure the underlying collateral for probable losses
RIS
K M
AN
AG
EM
EN
T
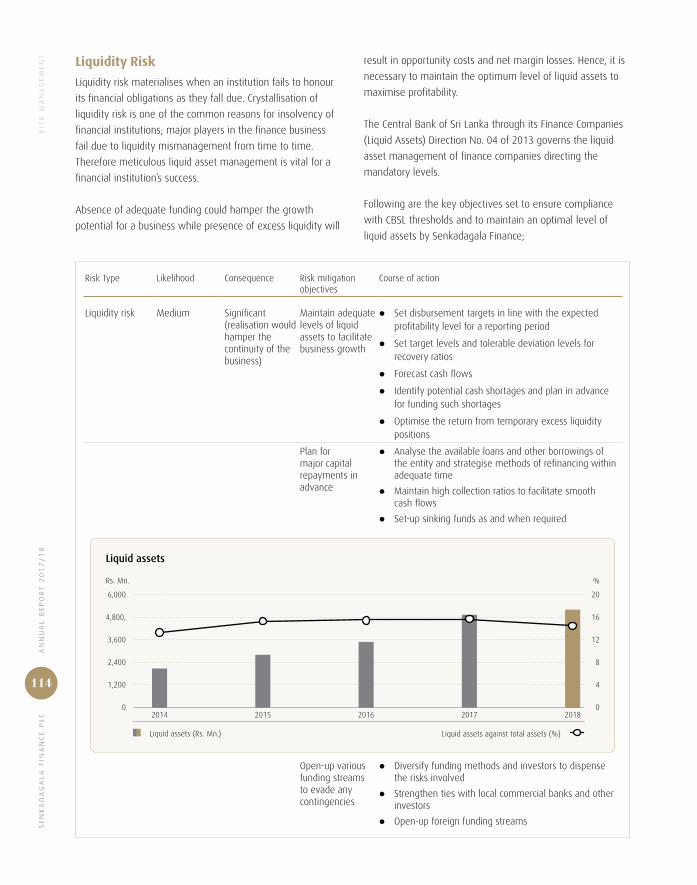
SE
NK
AD
AG
AL
A F
INA
NC
E P
LC
AN
NU
AL
RE
PO
RT
20
17
/1
8
114
Liquidity Risk
Liquidity risk materialises when an institution fails to honour
its financial obligations as they fall due. Crystallisation of
liquidity risk is one of the common reasons for insolvency of
financial institutions; major players in the finance business
fail due to liquidity mismanagement from time to time.
Therefore meticulous liquid asset management is vital for a
financial institution’s success.
Absence of adequate funding could hamper the growth
potential for a business while presence of excess liquidity will
result in opportunity costs and net margin losses. Hence, it is
necessary to maintain the optimum level of liquid assets to
maximise profitability.
The Central Bank of Sri Lanka through its Finance Companies
(Liquid Assets) Direction No. 04 of 2013 governs the liquid
asset management of finance companies directing the
mandatory levels.
Following are the key objectives set to ensure compliance
with CBSL thresholds and to maintain an optimal level of
liquid assets by Senkadagala Finance;
Risk Type Likelihood Consequence Risk mitigation objectives
Course of action
Liquidity risk Medium Significant(realisation would hamper the continuity of the business)
Maintain adequate levels of liquid assets to facilitate business growth
z Set disbursement targets in line with the expected profitability level for a reporting period
z Set target levels and tolerable deviation levels for recovery ratios
z Forecast cash flows
z Identify potential cash shortages and plan in advance for funding such shortages
z Optimise the return from temporary excess liquidity positions
Plan for major capital repayments in advance
z Analyse the available loans and other borrowings of the entity and strategise methods of refinancing within adequate time
z Maintain high collection ratios to facilitate smooth cash flows
z Set-up sinking funds as and when required
Liquid assets against total assets (%)
Liquid assets
Rs. Mn. %
Liquid assets (Rs. Mn.)
20182014 2015 20172016
6,000
4,800,
3,600
2,400
1,200
0
20
16
12
8
4
0
Open-up various funding streams to evade any contingencies
z Diversify funding methods and investors to dispense the risks involved
z Strengthen ties with local commercial banks and other investors
z Open-up foreign funding streams
RIS
K M
AN
AG
EM
EN
T
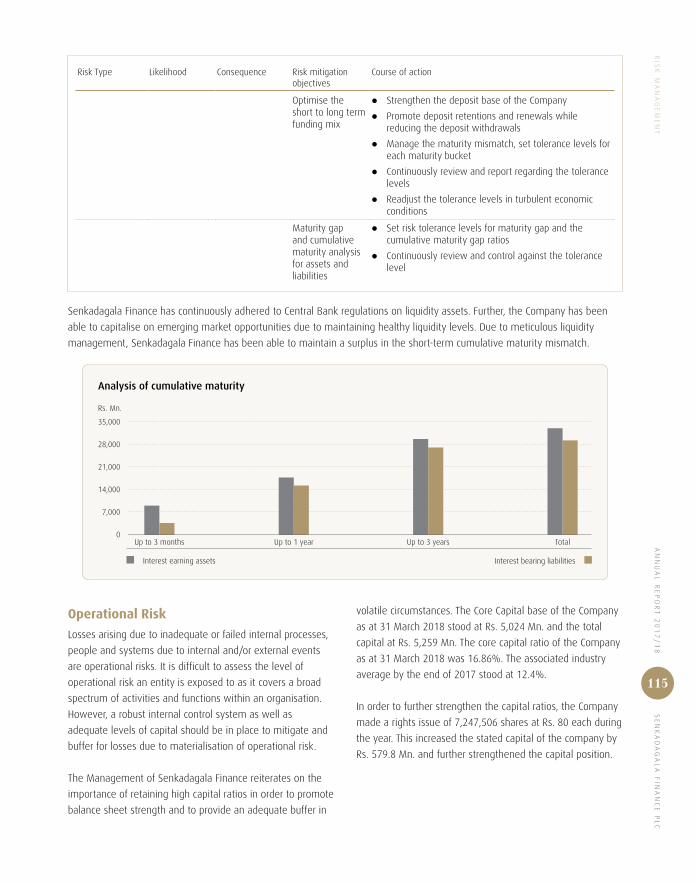
AN
NU
AL
RE
PO
RT
20
17
/1
8 S
EN
KA
DA
GA
LA
FIN
AN
CE
PL
C
115
Risk Type Likelihood Consequence Risk mitigation objectives
Course of action
Optimise the short to long term funding mix
z Strengthen the deposit base of the Company
z Promote deposit retentions and renewals while reducing the deposit withdrawals
z Manage the maturity mismatch, set tolerance levels for each maturity bucket
z Continuously review and report regarding the tolerance levels
z Readjust the tolerance levels in turbulent economic conditions
Maturity gap and cumulative maturity analysis for assets and liabilities
z Set risk tolerance levels for maturity gap and the cumulative maturity gap ratios
z Continuously review and control against the tolerance level
Senkadagala Finance has continuously adhered to Central Bank regulations on liquidity assets. Further, the Company has been
able to capitalise on emerging market opportunities due to maintaining healthy liquidity levels. Due to meticulous liquidity
management, Senkadagala Finance has been able to maintain a surplus in the short-term cumulative maturity mismatch.
Interest bearing liabilities
Analysis of cumulative maturity
Rs. Mn.
Interest earning assets
TotalUp to 3 months Up to 1 year Up to 3 years
35,000
28,000
21,000
14,000
7,000
0
volatile circumstances. The Core Capital base of the Company
as at 31 March 2018 stood at Rs. 5,024 Mn. and the total
capital at Rs. 5,259 Mn. The core capital ratio of the Company
as at 31 March 2018 was 16.86%. The associated industry
average by the end of 2017 stood at 12.4%.
In order to further strengthen the capital ratios, the Company
made a rights issue of 7,247,506 shares at Rs. 80 each during
the year. This increased the stated capital of the company by
Rs. 579.8 Mn. and further strengthened the capital position.
RIS
K M
AN
AG
EM
EN
T
Operational Risk
Losses arising due to inadequate or failed internal processes,
people and systems due to internal and/or external events
are operational risks. It is difficult to assess the level of
operational risk an entity is exposed to as it covers a broad
spectrum of activities and functions within an organisation.
However, a robust internal control system as well as
adequate levels of capital should be in place to mitigate and
buffer for losses due to materialisation of operational risk.
The Management of Senkadagala Finance reiterates on the
importance of retaining high capital ratios in order to promote
balance sheet strength and to provide an adequate buffer in
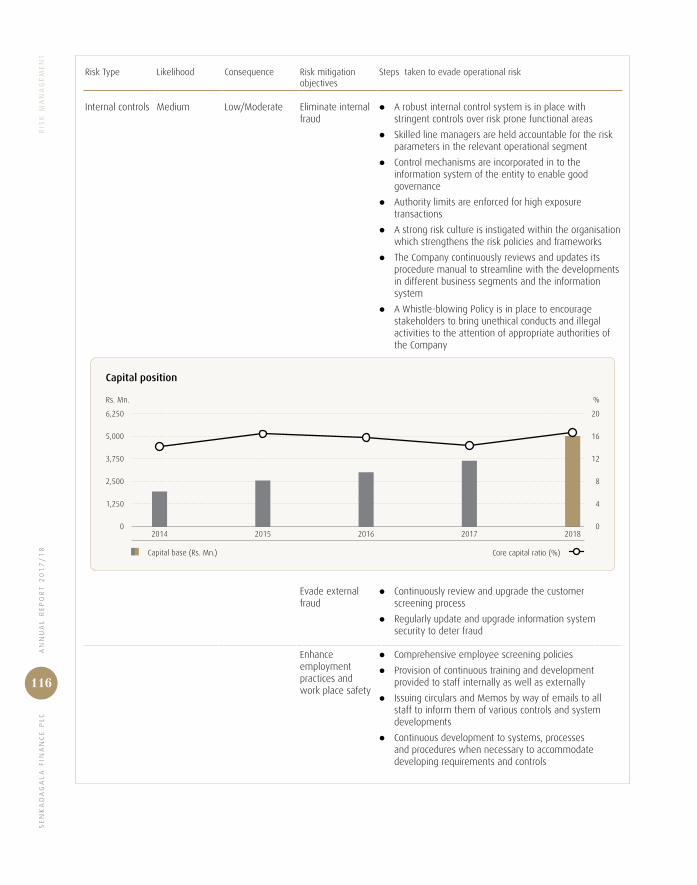
SE
NK
AD
AG
AL
A F
INA
NC
E P
LC
AN
NU
AL
RE
PO
RT
20
17
/1
8
116
Risk Type Likelihood Consequence Risk mitigation objectives
Steps taken to evade operational risk
Internal controls Medium Low/Moderate Eliminate internal fraud
z A robust internal control system is in place with stringent controls over risk prone functional areas
z Skilled line managers are held accountable for the risk parameters in the relevant operational segment
z Control mechanisms are incorporated in to the information system of the entity to enable good governance
z Authority limits are enforced for high exposure transactions
z A strong risk culture is instigated within the organisation which strengthens the risk policies and frameworks
z The Company continuously reviews and updates its procedure manual to streamline with the developments in different business segments and the information system
z A Whistle-blowing Policy is in place to encourage stakeholders to bring unethical conducts and illegal activities to the attention of appropriate authorities of the Company
Core capital ratio (%)
Capital position
Rs. Mn. %
Capital base (Rs. Mn.)
20182014 2015 20172016
20
16
12
8
4
0
6,250
5,000
3,750
2,500
1,250
0
Evade external fraud
z Continuously review and upgrade the customer screening process
z Regularly update and upgrade information system security to deter fraud
Enhance employment practices and work place safety
z Comprehensive employee screening policies
z Provision of continuous training and development provided to staff internally as well as externally
z Issuing circulars and Memos by way of emails to all staff to inform them of various controls and system developments
z Continuous development to systems, processes and procedures when necessary to accommodate developing requirements and controls
RIS
K M
AN
AG
EM
EN
T
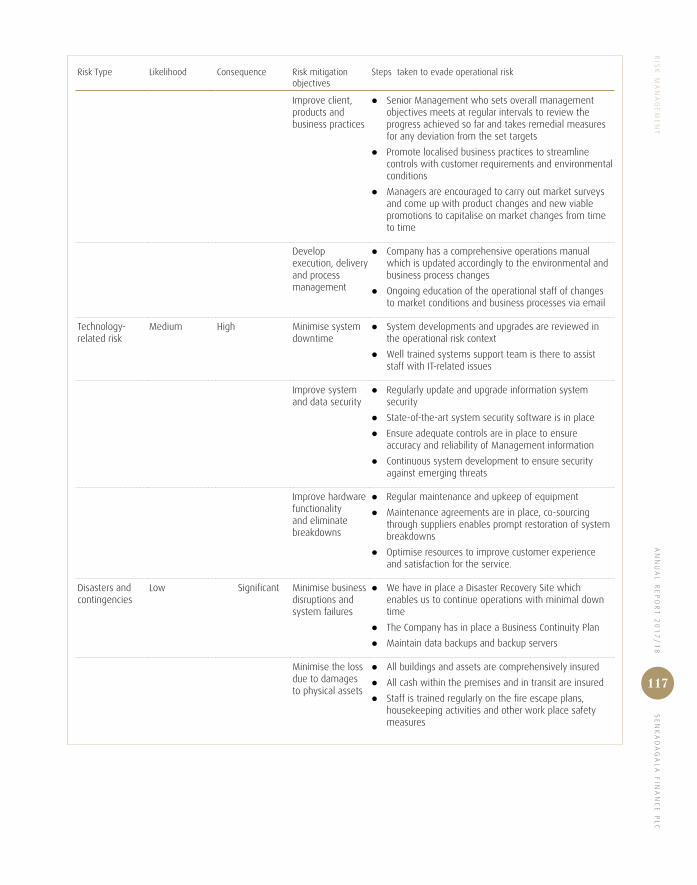
AN
NU
AL
RE
PO
RT
20
17
/1
8 S
EN
KA
DA
GA
LA
FIN
AN
CE
PL
C
117
Risk Type Likelihood Consequence Risk mitigation objectives
Steps taken to evade operational risk
Improve client, products and business practices
z Senior Management who sets overall management objectives meets at regular intervals to review the progress achieved so far and takes remedial measures for any deviation from the set targets
z Promote localised business practices to streamline controls with customer requirements and environmental conditions
z Managers are encouraged to carry out market surveys and come up with product changes and new viable promotions to capitalise on market changes from time to time
Develop execution, delivery and process management
z Company has a comprehensive operations manual which is updated accordingly to the environmental and business process changes
z Ongoing education of the operational staff of changes to market conditions and business processes via email
Technology- related risk
Medium High Minimise system downtime
z System developments and upgrades are reviewed in the operational risk context
z Well trained systems support team is there to assist staff with IT-related issues
Improve system and data security
z Regularly update and upgrade information system security
z State-of-the-art system security software is in place
z Ensure adequate controls are in place to ensure accuracy and reliability of Management information
z Continuous system development to ensure security against emerging threats
Improve hardware functionality and eliminate breakdowns
z Regular maintenance and upkeep of equipment
z Maintenance agreements are in place, co-sourcing through suppliers enables prompt restoration of system breakdowns
z Optimise resources to improve customer experience and satisfaction for the service.
Disasters and contingencies
Low Significant Minimise business disruptions and system failures
z We have in place a Disaster Recovery Site which enables us to continue operations with minimal down time
z The Company has in place a Business Continuity Plan
z Maintain data backups and backup servers
Minimise the loss due to damages to physical assets
z All buildings and assets are comprehensively insured
z All cash within the premises and in transit are insured
z Staff is trained regularly on the fire escape plans, housekeeping activities and other work place safety measures
RIS
K M
AN
AG
EM
EN
T

SE
NK
AD
AG
AL
A F
INA
NC
E P
LC
AN
NU
AL
RE
PO
RT
20
17
/1
8
118
Market Risk Factors
Market risk is losses incurred as a result of unfavourable
movements in market factors such as interest rates, tradable
equity prices, exchange rates and commodity prices. Probable
loss exposures vary with the volatility of the underlying
variable.
Interest rate risk
Interest rate risk is the risk that an investment's value will
change due to changes in the absolute level of interest rates.
Financial institutions act as financial intermediaries, hence are
highly vulnerable to losses arising as a result of interest rate
fluctuations. Interest rate fluctuations are external factors;
hence it is beyond the control of the entity’s management.
Therefore risk objectives are set to manage the impact on
the returns of the entity.
Risk Type Likelihood Consequence Risk mitigation objectives
Steps taken to evade operational risk
Interest Rate Risk
High Moderate Maintain an optimal net interest spread
z Meticulous asset and liability management
z Set risk tolerance level for interest spread and continuously review it in light of prevailing market trends
z Continuous scanning of the changes in the market interest rates, and identifying trends and patterns in market fluctuations which helps in deciding future strategies
z Carrying out yield curve analysis
z Periodical review of the pricing of loans, leases, deposits and other products, based on the market trends and competitor rates
z Identify optimum sources of funding in light of the current market trends, and setting risk parameters and budgetary targets to achieve them
z Reprice assets and liabilities to make use of favourable trends in the market
AWPR AWLR AWDR AWNLR AWFDR AWNDR
Commercial Bank Lending and Deposit Rates
Percent
Dec.2016
Feb.2017
Apr.2017
Jun.2017
Aug.2017
Oct.2017
Dec. 2014
Feb. 2015
Apr. 2015
Jun. 2015
Aug. 2015
Oct. 2015
Dec. 2015
Feb. 2016
Dec. 2017
Apr. 2016
Jun. 2016
Aug. 2016
Oct. 2016
16
14
12
10
8
6
4
Source: Central Bank of Sri Lanka - Annual Report 2017
RIS
K M
AN
AG
EM
EN
T

AN
NU
AL
RE
PO
RT
20
17
/1
8 S
EN
KA
DA
GA
LA
FIN
AN
CE
PL
C
119
Risk Type Likelihood Consequence Risk mitigation objectives
Steps taken to evade operational risk
Strike a balance between floating and fixed rated borrowings
z Floating rated loans enable the entity to re-price its liabilities in accordance with market trends, while fixed rated loans help to be resilient in a rising interest rate environment, hence optimal levels of fixed to floating rated funding is set to improve net interest margins
z Earning assets of Senkadagala Finance PLC, is primarily fixed rated, hence maintaining adequate levels of fixed rated funding is important, an optimal parameter is set for fixed rated funding
z Optimal level of fixed to floating rated borrowings helps to maximise profitability. The set parameters are regularly reviewed.
Maintain an optimal gearing ratio
z Identifying and maintaining the optimum mix of equity and borrowing which gives a lower rate of Weighted Average Cost of Capital (WACC)
Net interest margin (%)
Net interest income
Rs. Mn. %
20182014 2015 20172016
12
11
10
9
8
7
3,750
3,000
2,250
1,500
750
0
Net interest income (Rs. Mn.)
RIS
K M
AN
AG
EM
EN
T
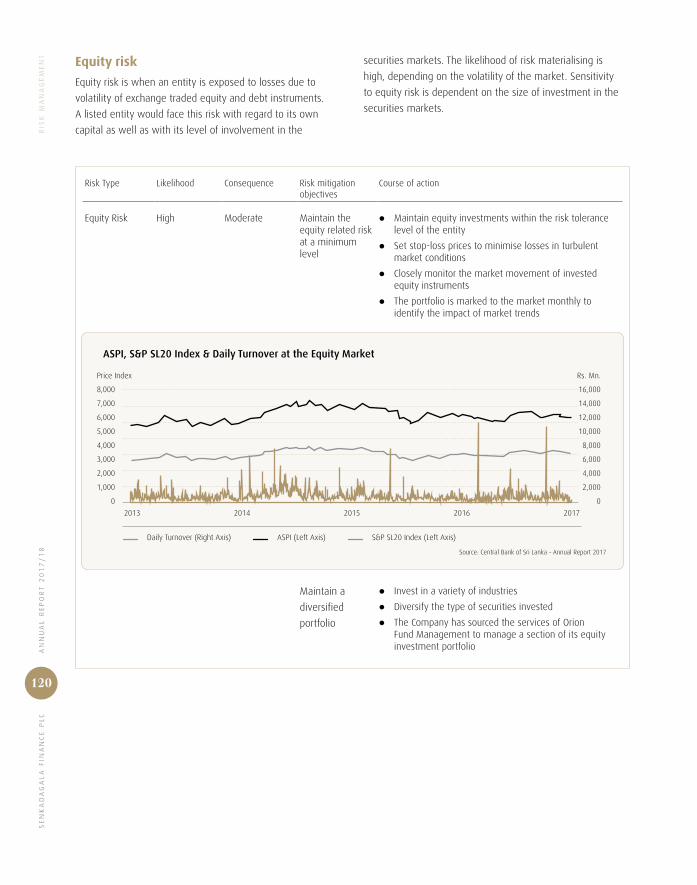
SE
NK
AD
AG
AL
A F
INA
NC
E P
LC
AN
NU
AL
RE
PO
RT
20
17
/1
8
120
Equity risk
Equity risk is when an entity is exposed to losses due to
volatility of exchange traded equity and debt instruments.
A listed entity would face this risk with regard to its own
capital as well as with its level of involvement in the
securities markets. The likelihood of risk materialising is
high, depending on the volatility of the market. Sensitivity
to equity risk is dependent on the size of investment in the
securities markets.
Risk Type Likelihood Consequence Risk mitigation objectives
Course of action
Equity Risk High Moderate Maintain the equity related risk at a minimum level
z Maintain equity investments within the risk tolerance level of the entity
z Set stop-loss prices to minimise losses in turbulent market conditions
z Closely monitor the market movement of invested equity instruments
z The portfolio is marked to the market monthly to identify the impact of market trends
Daily Turnover (Right Axis) ASPI (Left Axis) S&P SL20 Index (Left Axis)
ASPI, S&P SL20 Index & Daily Turnover at the Equity Market
Price Index Rs. Mn.
2014 2015 20162013 2017
8,000
7,000
6,000
5,000
4,000
3,000
2,000
1,000
0
16,000
14,000
12,000
10,000
8,000
6,000
4,000
2,000
0
Source: Central Bank of Sri Lanka – Annual Report 2017
Maintain a
diversified
portfolio
z Invest in a variety of industries
z Diversify the type of securities invested
z The Company has sourced the services of Orion Fund Management to manage a section of its equity investment portfolio
RIS
K M
AN
AG
EM
EN
T

AN
NU
AL
RE
PO
RT
20
17
/1
8 S
EN
KA
DA
GA
LA
FIN
AN
CE
PL
C
121
Foreign exchange risk
Foreign exchange risk is the materialisation of losses due
to adverse movements in the foreign currency exchange
rates. Senkadagala Finance commenced its foreign currency
exchange business in the financial year 2012/13 and until
such time the Company was not exposed to this risk. Since
entering into a loan agreement with International Finance
Corporation (IFC) for a USD borrowing, the exposure to foreign
exchange risk increased. The Company took meticulous
measures to manage foreign exchange risk throughout the
loan period.
In March 2018, the Company obtained a fresh loan from
IFC; however the Company was not exposed to any foreign
exchange risk as the loan was disbursed in Rupees.
Risk Type Likelihood Consequence Risk mitigation objectives
Course of action
Foreign Exchange Risk
High Moderate Minimise transaction losses
z The Company does not hold over-night positions of foreign currency purchased through its branch network daily
z Systems are in place to track and monitor transactions regularly
z Inform operational staff of counterfeit notes circulating in the market to evade external fraud
z Swap cash flows to minimise the exchange risk exposure for major transactions
Exchange rate movement against major currencies
Rs.
USD GBP EURO
Mar.2018
Jan. 2016
Mar. 2016
May 2016
Jul. 2016
Sep. 2016
Nov. 2016
Jan.2017
Mar. 2017
May 2017
Jul. 2017
Sep. 2017
Nov. 2017
Jan. 2018
250
200
050
100
50
0
Source: Central Bank of Sri Lanka – Annual Report 2017
Minimise
translation
losses
z The Company has in place a locally procured hedge to lessen the effects of the foreign currency borrowing
z Regular reviews are in place to ensure the efficiency of the hedge
z New foreign borrowings are thoroughly reviewed to ensure compliance with internal risk tolerance levels
RIS
K M
AN
AG
EM
EN
T

SE
NK
AD
AG
AL
A F
INA
NC
E P
LC
AN
NU
AL
RE
PO
RT
20
17
/1
8
122
Regulatory and Compliance Risk
Regulatory and compliance risk is losses that could arise
due to failure of the Company to comply with applicable
rules, regulations and codes of conduct. The losses due to
materialisation of this risk can be financial, loss of opportunity
or damages to the reputation of the entity.
The likelihood and the consequence vary based on the
nature of regulations, degree and the repercussion of non-
compliance.
Due to its vulnerable nature, the finance business is highly
regulated. Following are the primary supervisory bodies and
the regulations prevailing over the entity:
z The Finance Business Act No. 42 of 2011
z Companies Act No. 07 of 2007
z Department of Supervision of Non-Bank Financial
Institutions of the Central Bank of Sri Lanka
z The Central Bank of Sri Lanka and regulations imposed
thereby
z Continuous Listing Rules of the Colombo Stock Exchange
z Registrar of Companies
z Colombo Stock Exchange
z Securities and Exchange Commission and regulations
imposed thereby
z Directions, Rules, Determinations, Notices and Guidelines
applicable to Licensed Finance Companies
z Rules and regulations imposed by the Department of
Inland Revenue
z Regulations imposed by other local and national
authorities
z Accounting and other reporting standards issued by
The Institute of Chartered Accountants of Sri Lanka
z Covenants imposed by investors and other influential
bodies
z Internal policies and procedures
The Management has taken the following steps to mitigate
regulatory and compliance risks to ensure sound governance:
z Incorporated limits and restrictions (e.g. LTV ratios, capital
adequacies, etc.) enforced by the regulators into system
controls
z Responsibility is assigned to the functional managers and
department heads to maintain relevant ratios within the
stipulated limits
z A compliance function is in place. The compliance officer
who directly reports to the Board closely monitors and
periodically reports of the status of conformity of the
entity against applicable rules and regulations
z A report comprising regulatory ratios is submitted to the
Integrated Risk Management Committee meeting and the
Board meeting to ensure continuous compliance
z A quarterly compliance audit function is in place sourcing
the expertise of Messrs Ernst & Young Advisory Services
(Pvt) Ltd providing external assurance to the compliance
function.
Senkadagala Finance position
Regulatory requirement
Core capital ratio (%) 16.86 5.00
Total capital ratio (%) 17.65 10.00
Minimum core capital (Rs. Bn.) 5.02 1.50
Liquid assets to term deposits and CDs (%) 57.21 10.00
Liquid assets to savings deposits (%) 1,365.62 15.00
Liquid assets to unsecured senior borrowings (%) 124.75 5.00
Government securities to average deposits and borrowings (%) 8.21 7.50
Accommodations granted to an individual borrower as a % of capital funds 3.28 15.00
RIS
K M
AN
AG
EM
EN
T

AN
NU
AL
RE
PO
RT
20
17
/1
8 S
EN
KA
DA
GA
LA
FIN
AN
CE
PL
C
123
During this financial year, the Central Bank issued several
regulatory controls affecting the NBFI sector. The Direction on
the Loan to Value ratio for credit facilities in respect of Motor
Vehicles was amended; the amended direction defined the
vehicle categories for the purpose of the direction. Further
amendments eased the LTV ratio for leases granted for
unregistered electric vehicles. Towards the latter part of the
financial year, a direction was issued outlining the framework
for financial customer protection. In March 2018 a guideline
was issued mandating all LFCs to obtain a Credit Rating,
specifying recognised credit rating agencies for the purpose.
Such directions would have a positive impact on the structure
and the stability of NBFIs.
Strategic Risk
Strategic risk is losses arising due to strategic decisions,
which may occur due to external or internal events. Examples
of Internal events are misguided decisions causing financial
losses, improper implementation of business decisions,
etc. The external events such as unfavourable changes in
underlying economic conditions, or unexpected moves of
competitors could also lead to financial losses.
Systematic analysis of strategic decisions coupled with sound
governance practices has enabled Senkadagala Finance
to minimise the likelihood of materialisation of strategic
risks. However, if materialised, the impact of such losses
could be critical based on level of investment and business
involvement.
Following controls are in place to safeguard the Company
against strategic risk-related losses:
z The Vision statement and the Mission outline the general
strategic direction of the entity. All strategic decisions and
objectives are thoroughly reviewed against these
z Thorough analysis is done before strategic decision
implementation and robust strategic planning and strict
budgets are stipulated before commencement
z Feasibility studies are carried out to identify potential
threats and drawbacks for various strategic initiatives
z A state-of-the-art Management Information System is
in place. The MIS was internally developed tailored to
the requirements of the Management and the business
structure
z Periodic reviews and continuous control actions are
undertaken to ensure the success of strategic decisions
z An overall business strategy including a four-year financial
forecast is in place to govern the future direction of the
Company. In the year 2018, this plan was updated to
accommodate the expected growth trajectory for the
immediate four years
z The entity has in place a continuous environmental
scanning system, which maintains a watchful eye over
changes in the macroeconomic conditions, potential
trends and competitor behaviour
z Through regular meetings, the Board of Directors and the
corporate management team monitor the progress of
significant strategic initiatives
Reputation Risk
Reputation risk is the loss of earning, profitability, capital or
brand image due to negative publicity. Tarnished reputation
due to lapses in internal controls, failure to deliver up to
customer expectations, system failures, non-compliance with
regulatory requirements, unethical business practices, labour
unrest, etc. leading to financial losses.
Systematic risk identification and effective management of
risks have enabled Senkadagala Finance to mitigate potential
reputation risk.
RIS
K M
AN
AG
EM
EN
T
SE
NK
AD
AG
AL
A F
INA
NC
E P
LC
AN
NU
AL
RE
PO
RT
20
17
/1
8
124
Financial Reports
126 133 134 139 140Annual Report
of the Board of Directors of
Senkadagala Finance PLC
Directors’ Statement on
Internal Control over Financial
Reporting
Independent Auditors’
Report
Income Statement
Statement of Other
Comprehensive Income

AN
NU
AL
RE
PO
RT
20
17
/1
8 S
EN
KA
DA
GA
LA
FIN
AN
CE
PL
CN
OT
ES
TO
TH
E F
INA
NC
IAL
ST
AT
EM
EN
TS
125
AN
NU
AL
RE
PO
RT
20
16
/1
7 S
EN
KA
DA
GA
LA
FIN
AN
CE
PL
C
125
141 143 145 147Statement
of Financial Position
Statement of Changes in
Equity
Statement of Cash Flows
Notes to the Financial
Statements

SE
NK
AD
AG
AL
A F
INA
NC
E P
LC
AN
NU
AL
RE
PO
RT
20
17
/1
8
126
Annual Report of the Board of Directors of Senkadagala Finance PLCThe Board of Directors of Senkadagala Finance PLC has
pleasure in presenting the annual report together with the
audited financial statements of the Company and the audited
consolidated Financial Statements for the year ended
31 March 2018 to the shareholders, which was approved
by the Board of Directors on 31 May 2018.
The details set out here provide information required by the
Companies Act No. 07 of 2007, Finance Business Act No. 42
of 2011 and the Listing Rules of the Colombo Stock Exchange
and recommendations of best accounting practices.
Domicile and Legal form of the Company
Senkadagala Finance PLC is a public limited liability Company
domiciled in Sri Lanka, incorporated under the Companies
Act No. 51 of 1938 on 29 December 1968 bearing
Registration No. PB 238 PQ and registered under the Finance
Companies Act No. 78 of 1988 which was replaced by the
Finance Business Act No. 42 of 2011. The Company was
re–registered under the Companies Act No. 07 of 2007. The
Company is listed in the Diri Savi Board of the Colombo Stock
Exchange with effect from 22 March 2011.
The registered office of the Company is situated at 2nd Floor,
267, Galle Road, Colombo 03.
Vision and Mission
The Company’s vision and mission are stated in page 4 of
this Report.
Principal Activities and Nature of Operations
The principal lines of business of the Company include
providing financial accommodation in the form of finance
leases, hire purchase, commercial loans and personal loans.
Additional lines of business include pawn brokcring, foreign
exchange transactions, bill discounting, investment in money
market instruments and the acceptance of term deposits,
certificates of deposit and savings deposits.
The principal line of business of the subsidiary, Senkadagala
Insurance Brokers (Pvt) Ltd. is insurance brokering activities.
On 25 August 2014 Senkadagala Finance acquired 100%
ownership of Newest Capital Limited, a Specialised
Leasing Company registered under the Finance Business
Act No. 42 of 2011. Newest Capital Limited engages in
investment activities.
There have been no significant changes in the principal
activities of the Company and of the group during the
financial year under review.
Management and Financial Review of Business
A detailed description and analysis of the operations of
the Company for the year under review is contained in the
Chairman’s message (on pages 12 to 13), the Managing
Director/CEO’s review (on pages 16 to 17) and the Value
Creation and Capital Formation (on pages 38 to 79) section.
These reports together with the audited financial statements
provide an overall assessment of the Company’s performance
during the financial year.
Branch Expansion and Future Developments
Senkadagala Finance PLC now has 54 branches and 41
service centres island wide. In light of the business growth
in the recent past, the Company continued with its branch
expansion, opening doors in five new locations, namely
Bandaragama, Deniyaya, Mathugama, Wattegama and
Welimada during the year.
The management is planning to open five more branches to
reach 100 branch/centre target to coincide with the 50th year
celebrations falling in December 2018.
Directors’ Responsibility for Financial Reporting
The Financial Statements of the Company and the group duly
approved by two directors are given on pages 139 to 221.
The directors are responsible for the preparation of Financial
Statements, the maintaining of proper accounting records and
disclosures regarding accounting policies and principles of the
Company and the Group.

AN
NU
AL
RE
PO
RT
20
17
/1
8 S
EN
KA
DA
GA
LA
FIN
AN
CE
PL
C
127
The directors are of the view that the Financial Statements
presented give a true and fair view of the affairs of the
Company as at 31 March 2018 and the profit of the year
then ended and have been prepared in conformity with
the requirements of the Sri Lanka Accounting Standards
(LKASs and SLFRSs) as issued by the Institute of Chartered
Accountants of Sri Lanka and the requirements of the
Companies Act No. 7 of 2007, Finance Companies Act,
No. 78 of 1988 which is replaced by the new Finance
Business Act No. 42 of 2011 and the amendments to these
acts and provide appropriate disclosures as required by the
Central Bank of Sri Lanka and Listing Rules of the Colombo
Stock Exchange.
Auditor’s Report
The Auditors of the Company Messrs. KPMG performed
the audit on the separate and the consolidated Financial
Statements for the year ended 31 March 2018. The
Auditor’s Report issued thereon is given on pages 134 to138
of this annual Report.
Accounting Policies
The accounting policies adopted in preparing and presenting
of these Financial Statements are given on page 147 to 164
of this annual Report.
The Company and the group prepared the Financial
Statements for all periods up to and including the year ended
31 March 2018 in accordance with the Sri Lanka Accounting
Standards (LKASs and SLFRSs) as issued by the Institute of
Chartered Accountants of Sri Lanka, which has materially
converged with the International Financial Reporting
Standards (IFRS) issued by the International Accounting
Standards Board.
Directors Interests
As required by the Section 192 (1) and (2) of the Companies
Act all Directors have made declarations of the interests with
the Company. The share ownership of Directors is disclosed
on page 130 of this Report.
Remuneration and other benefits of Directors
Directors’ remunerations in respect of the Company and the
group for the financial year under review is Rs. 22,958,565
(2017 – Rs. 20,536,250).
Related Party Transactions
There were no related party transactions which exceeded the
threshold limits stipulated in the Listing Rules of the Colombo
Stock Exchange (CSE) on Related Party Transactions. However,
the Directors have disclosed the transactions that could be
classified as related party transactions in the presentation of
Financial Statements and accordingly given in Note 45 on
page 197 of this annual Report.
Donations
A sum of Rs. 3,746,000 (2017 – Rs. 4,293,982) was paid out
by way of donations during the financial year under review.
Income
The income generated by the Company during the financial
year comprises of the following:
Company Group
2018 Rs.
2017 Rs.
2018 Rs.
2017 Rs.
Interest income 6,472,114,532 4,825,712,446 6,474,164,965 4,827,546,479
Fee and commission income 100,249,664 138,664,254 244,229,108 258,611,679
Other operating income 197,965,525 173,759,290 114,987,525 112,003,682
Total 6,770,329,721 5,138,135,990 6,833,381,598 5,198,161,840
Further analysis of income is given in Note 4, 6 and 8 to 10 of
the Financial Statements on pages 165 and 166 of this Report.
AN
NU
AL
RE
PO
RT
OF
TH
E B
OA
RD
OF
DIR
EC
TO
RS
OF
SE
NK
AD
AG
AL
A F
INA
NC
E P
LC
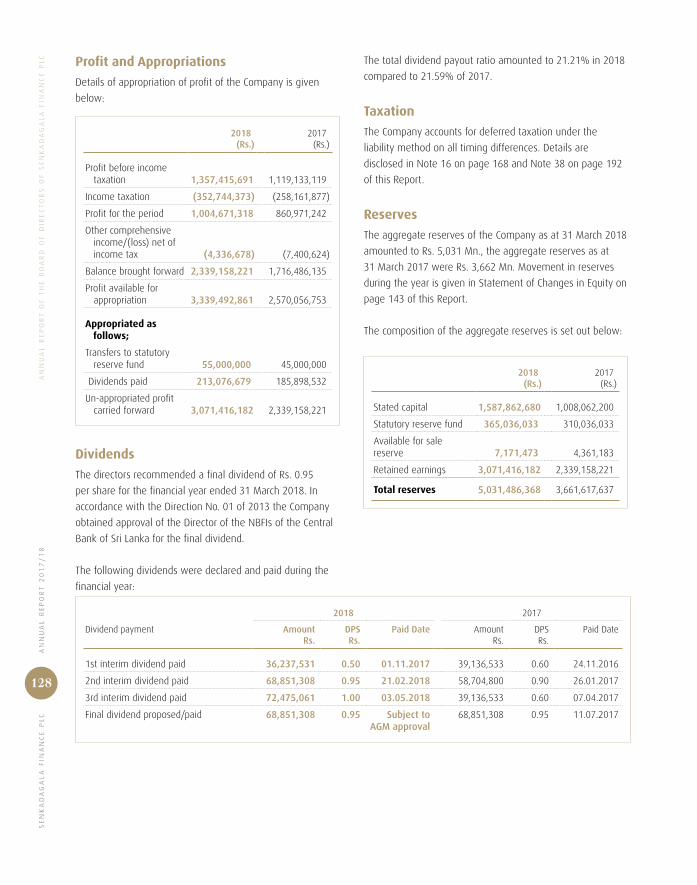
SE
NK
AD
AG
AL
A F
INA
NC
E P
LC
AN
NU
AL
RE
PO
RT
20
17
/1
8
128
Profit and Appropriations
Details of appropriation of profit of the Company is given
below:
2018 (Rs.)
2017 (Rs.)
Profit before income taxation 1,357,415,691 1,119,133,119
Income taxation (352,744,373) (258,161,877)
Profit for the period 1,004,671,318 860,971,242
Other comprehensive income/(loss) net of income tax (4,336,678) (7,400,624)
Balance brought forward 2,339,158,221 1,716,486,135
Profit available for appropriation 3,339,492,861 2,570,056,753
Appropriated as follows;
Transfers to statutory reserve fund 55,000,000 45,000,000
Dividends paid 213,076,679 185,898,532
Un-appropriated profit carried forward 3,071,416,182 2,339,158,221
Dividends
The directors recommended a final dividend of Rs. 0.95
per share for the financial year ended 31 March 2018. In
accordance with the Direction No. 01 of 2013 the Company
obtained approval of the Director of the NBFIs of the Central
Bank of Sri Lanka for the final dividend.
The following dividends were declared and paid during the
financial year:
2018 2017
Dividend payment Amount Rs.
DPS Rs.
Paid Date Amount Rs.
DPS Rs.
Paid Date
1st interim dividend paid 36,237,531 0.50 01.11.2017 39,136,533 0.60 24.11.2016
2nd interim dividend paid 68,851,308 0.95 21.02.2018 58,704,800 0.90 26.01.2017
3rd interim dividend paid 72,475,061 1.00 03.05.2018 39,136,533 0.60 07.04.2017
Final dividend proposed/paid 68,851,308 0.95 Subject toAGM approval
68,851,308 0.95 11.07.2017
The total dividend payout ratio amounted to 21.21% in 2018
compared to 21.59% of 2017.
Taxation
The Company accounts for deferred taxation under the
liability method on all timing differences. Details are
disclosed in Note 16 on page 168 and Note 38 on page 192
of this Report.
Reserves
The aggregate reserves of the Company as at 31 March 2018
amounted to Rs. 5,031 Mn., the aggregate reserves as at
31 March 2017 were Rs. 3,662 Mn. Movement in reserves
during the year is given in Statement of Changes in Equity on
page 143 of this Report.
The composition of the aggregate reserves is set out below:
2018 (Rs.)
2017 (Rs.)
Stated capital 1,587,862,680 1,008,062,200
Statutory reserve fund 365,036,033 310,036,033
Available for sale reserve 7,171,473 4,361,183
Retained earnings 3,071,416,182 2,339,158,221
Total reserves 5,031,486,368 3,661,617,637
AN
NU
AL
RE
PO
RT
OF
TH
E B
OA
RD
OF
DIR
EC
TO
RS
OF
SE
NK
AD
AG
AL
A F
INA
NC
E P
LC

AN
NU
AL
RE
PO
RT
20
17
/1
8 S
EN
KA
DA
GA
LA
FIN
AN
CE
PL
C
129
Capital Expenditure
The total capital expenditure for the year amounted to
Rs. 359.1 Mn. (2016/17 – Rs. 640.9 Mn.).
Details of property, plant and equipment are available on
pages 180 to 186 of this Report. Details relating to the
depreciation charge for the year are also available on page
183 and 184.
Market Value of Free Hold Assets
The values of the free hold properties of the Company
have been obtained from the reports issued by an external
independent property valuer Mr K M U Dissanayake and
Mr H N M Herath dated 31 March 2018 and 31 March 2017
respectively. The valuers have appropriate recognised
professional qualifications and recent experience in the
location and category of the property being valued. The
valuation has been carried out based on open market value of
similar properties. These values have not been incorporated in
the Financial Statements. Details of free hold property owned
by the Company are given in note 28.2 and note 29.6 of the
Financial Statement on pages 181 and 185 to this Report.
Issue of Shares and Debentures
Stated capital
Senkadagala Finance PLC has in issue 72,475,061
ordinary shares to the book value of Rs. 1,587.9 Mn. as
at 31 March 2018.
During the year 7,247,506 new voting shares were issued at
an issue price of Rs. 80/- per share by way of a rights issue.
Subsequent to the proposal by the Board of Directors, the
resolution pertaining to the issue was duly adopted by the
shareholders at the EGM held on 30 March 2017. The rights
were fully subscribed, 7,247,506 voting shares were listed in
the Colombo Stock Exchange on 2nd May 2017.
The Company does not have any other category of shares
in issue.
Details of the stated capital are given in Note 42 of the
Financial Statements on page 196 of this report.
Debentures
Details of the debentures in issue as at 31 March 2018
are given in detail in Note 36 and Note 37 of the financial
statements on pages 191 and 192 respectively. Further
information on the listed debentures is given on page 74 of
this Report.
Share Information
Information relating to earnings per share, dividends per
share, net assets per share, market price per share and the
distribution of shareholding is indicated on page 73, under
shareholder information. The twenty largest shareholders
as at 31 March 2018 together with an analysis of the
shareholding are also indicated therein.
Equitable Treatment to Shareholders
The Company has taken all possible steps to ensure equitable
treatment to all its shareholders.
Directors
The Board of Directors of Senkadagala Finance PLC consists
of directors with financial and commercial experience. The
qualifications and experience of the directors are detailed on
page 82 of this Report.
The following were Directors of the Company during the year
z Mr W M R S Dias
z Dr P Ramanujam
z Mr L Balasuriya
z Dr A Balasuriya
z Mrs L Fernando
z Dr M Balasuriya
z Mr W A T Fernando
z Mr S D Bandaranayake
z Mr D T P Collure
z Mr Senanayakege R Pushpakumara
AN
NU
AL
RE
PO
RT
OF
TH
E B
OA
RD
OF
DIR
EC
TO
RS
OF
SE
NK
AD
AG
AL
A F
INA
NC
E P
LC

SE
NK
AD
AG
AL
A F
INA
NC
E P
LC
AN
NU
AL
RE
PO
RT
20
17
/1
8
130
The following were Directors of the Subsidiary, Senkadagala
Insurance Brokers (Pvt) Ltd. during the year:
z Mr L Balasuriya
z Dr A Balasuriya
z Mrs L Fernando
z Dr M Balasuriya
z Mr W A T Fernando
z Mr S D Bandaranayake
The following were Directors of the Subsidiary, Newest
Capital Limited during the year:
z Mr L Balasuriya
z Dr A Balasuriya
z Mrs L Fernando
z Dr P Ramanujam
z Mr S D Bandaranayake
Board and Committee Meetings
A number of Board meetings, Audit Committee meetings,
Remuneration Committee meetings and Integrated Risk
Committee meetings were held during the year at the
Registered Office of the Company. Members of each of these
committees have attended the meetings on a regular basis.
Details of the members and their attendance is given in
pages 82 and 101 of this Report.
Recommended for Re-election
In accordance with the Finance Companies (Corporate
Governance) Direction of No.03 of 2008, none of the Directors
of the Company are coming up for re-election.
Directors and Shareholdings
The directors of the Company at the date of the report are shown below together with their respective shareholdings:
2018 2017
Number of shares
% of holding
Number of shares
% of holding
Dr A Balasuriya - 0.00 3,747,127 5.74
Dr A Balasuriya & Mr D Balasuriya 2,086,023 3.20 3,858 0.01
Dr A Balasuriya & Mr S Balasuriya 2,086,022 3.20 3,857 0.01
Dr M Balasuriya 4,172,046 6.40 3,754,842 5.76
Mrs L Fernando - 0.00 3,141,113 4.82
Mrs L Fernando & Ms S A Fernando 1,166,232 1.79 2,572 0.00
Mrs L Fernando & Mr A R Fernando 1,166,231 1.79 2,571 0.00
Mrs L Fernando & Mr A L Fernando 1,166,231 1.79 2,571 0.00
Mr L Balasuriya & Mr S K Balasuriya 2,086,023 3.20 1,877,421 2.88
Mr L Balasuriya & Ms A S Balasuriya 2,086,022 3.20 1,877,420 2.88
Mr L Balasuriya – The Trustee of the Capitalisation Issue 15 0.00 15 0.00
Mr W A T Fernando - 0.00 – 0.00
Dr P Ramanujam - 0.00 – 0.00
Mr S D Bandaranayake - 0.00 – 0.00
Mr D T P Collure - 0.00 – 0.00
Mr W M R S Dias - 0.00 – 0.00
Mr Senanayakege R Pushpakumara - 0.00 – 0.00
AN
NU
AL
RE
PO
RT
OF
TH
E B
OA
RD
OF
DIR
EC
TO
RS
OF
SE
NK
AD
AG
AL
A F
INA
NC
E P
LC

AN
NU
AL
RE
PO
RT
20
17
/1
8 S
EN
KA
DA
GA
LA
FIN
AN
CE
PL
C
131
Directors’ Interests in Debentures
Details of Debentures held by the Directors of the Company are mentioned below:
As at 31 March 2018 2017
Number of Debentures
% of holding
Number of Debentures
% of holding
Mr. S D Bandaranayake 125,000 1 225,000 1
Auditor’s Remuneration, Other Fees and Payables
The Auditors, Messrs. KPMG was paid audit fees of
Rs. 1,200,000 (2016/17 – Rs. 1,090,000) for the Company
and Rs. 431,986 (2016/17 – Rs. 419,631) for the subsidiary
companies for the period under review. In addition they
were paid Rs. 1,470,876 (2016/17 – Rs. 2,592,222 ),
for permitted non-audit related services. This information
is disclosed as required by the Section 168 (1) of the
Companies Act No. 7 of 2007.
Amounts pertaining to the audit fee of Rs. 1,200,000 of the
Company and Rs. 431,986 of the subsidiaries was payable as
at the year end.
As far as the Directors are aware, the auditors do not have any
other relationship or interest in contract with the Company.
Risk Management
Specific steps taken by the Company in managing risks are
detailed on pages 107 to 125 of this report.
Corporate Governance
The Board places great emphasis on maintaining effective
corporate governance practices, policies and systems are
structured accordingly and reviewed from time to time
to enhance transparency and accountability. The report
on corporate governance is given on pages 82 to 105 of
the annual Report.
Internal Control
The Directors of the Company are responsible for setting
out the policy regarding internal control. The set of internal
control procedures laid down seeks to manage against
material errors or omissions, losses, fraudulent practices
and to safeguard assets and secure as far as is possible the
accuracy and reliability of the records.
Environment
The Directors are of the belief that the Company does not
engage in any form of activity that is detrimental to the
environment. Compliance with all environmental regulations
has been adhered to during the year.
Statutory Payments
The Directors are of the view that all statutory payments in
relation to government agencies and employees have been
made up to date.
Post Balance Sheet Events
The Board of Directors has declared and paid an interim
dividend of Rs. 1.00 per share for the nine-month period
ended 31 December 2017, on 3 May 2018. Further a
final dividend of Rs. 0.95 per share for the year ended
31 March 2018, is recommended by the Board of Directors
subject to the approval by the shareholders at the Annual
General Meeting for the financial year ended 2017/18. In
accordance with the LKAS 10 on “Events After the Reporting
Period”, the proposed dividends are not recognised as a
liability in the Financial Statements as at year end.
Except as mentioned above there were no material events
occurring after the reporting period that require adjustment
to or disclose in the financial statements.
Appointment of Auditors
The Financial Statements of the year under review have
been audited by Messrs. KPMG, Chartered Accountants, who
offer themselves for re-appointment. A resolution will be
proposed at the Annual General Meeting to re-appoint them
as auditors and authorising the directors to resolve their
remuneration.
AN
NU
AL
RE
PO
RT
OF
TH
E B
OA
RD
OF
DIR
EC
TO
RS
OF
SE
NK
AD
AG
AL
A F
INA
NC
E P
LC
SE
NK
AD
AG
AL
A F
INA
NC
E P
LC
AN
NU
AL
RE
PO
RT
20
17
/1
8
132
Employment Policies
The Company is an equal opportunity employer. In its goals
and objectives, it seeks to achieve excellence and market
orientation in its service. Continuous training and social
participation amongst employees are encouraged.
A holistic approach prevails in the Company’s strategic
outlook where a participatory management style ensures
that employees are involved in the decision-making process.
Incentive schemes which are related to employee performance
are one of the ways in which the Company ensures that
rewards are directly related to performance. A Remuneration
Committee ensures that a balance is struck between
performance and related employee rewards structures.
The Company has also set up an in-house training facility
in order to ensure that all employees meet certain standard
requirements before job placement and also to enhance the
existing skills of its staff. The Company had 745 employees
as at 31 March 2018 (2017 – 690).
Going Concern
The Directors are satisfied that the Company has at its
disposal adequate resources to continue in business in the
foreseeable future; and hence the going concern concept is
adopted in the preparation of the financial statements.
Compliance with Laws and Regulations
The Directors are of the belief that the Company has not
engaged in any activities contravening the law and has
complied with all applicable regulations.
By order of the Board of
SENKADAGALA FINANCE PLC
Sgd.
Managers and Secretaries (Private) Limited
Secretaries
Colombo
31 May 2018
AN
NU
AL
RE
PO
RT
OF
TH
E B
OA
RD
OF
DIR
EC
TO
RS
OF
SE
NK
AD
AG
AL
A F
INA
NC
E P
LC
AN
NU
AL
RE
PO
RT
20
17
/1
8 S
EN
KA
DA
GA
LA
FIN
AN
CE
PL
C
133
Directors’ Statement on Internal Control over Financial Reporting
Responsibility
In line with Section 10 (2) (b) of the Finance Companies
Corporate Governance Direction No. 03 of 2008 as
amended by the Direction No. 06 of 2013, the Board of
Directors presents this Report on Internal Control over
Financial Reporting.
The Board of Directors (“Board”) is responsible for
the adequacy and effectiveness of the internal control
mechanism in place at Senkadagala Finance PLC (“Company”).
The Board has established an ongoing process for identifying,
evaluating and managing the significant risks faced by the
Company and this process includes the system of Internal
Control over Financial Reporting. The process is regularly
reviewed by the Board. The Board is of the view that the
system of Internal Control over Financial Reporting in place,
is adequate to provide reasonable assurance regarding the
reliability of financial reporting, and that the preparation of
Financial Statements for external purposes is in accordance
with relevant accounting principles and regulatory
requirements.
The Management assists the Board in the implementation
of the Board’s policies and procedures pertaining to Internal
Control over Financial Reporting. The Management is
continuously in the process of enhancing the documentation
of the systems of Internal Control over Financial Reporting.
In assessing the Internal Control System over Financial
Reporting, identified officers of the Company collated all
procedures and controls that are connected with significant
accounts and disclosures of the Financial Statements of the
Company. These in turn are being observed and checked by
the Internal Audit Department of the Company for suitability
of design and effectiveness on an ongoing basis.
Confirmation
Based on the above processes, the Board confirms that
the Financial Reporting System of the Company has been
designed to provide reasonable assurance regarding the
reliability of Financial Reporting and the preparation of
Financial Statements for external purposes and has been
done in accordance with Sri Lanka Accounting Standards and
regulatory requirements of the Central Bank of Sri Lanka.
External Auditors Certification
The External Auditors have submitted a certification on the
process adopted by the Directors on the System of Internal
Controls over Financial Reporting. The matters addressed by
the External Auditors will be considered and appropriate steps
would be taken to rectify them in the future.
By order of the Board,
S D Bandaranayake
Director/Additional CEO
W M R S Dias
Chairman
W A T Fernando
Director/Chairman of the Board Audit Committee
Colombo
31 May 2018
SE
NK
AD
AG
AL
A F
INA
NC
E P
LC
AN
NU
AL
RE
PO
RT
20
17
/1
8
134
Independent Auditors’ Report
To the Shareholders of Senkadagala Finance PLC
Report on the Audit of the Financial Statements
Opinion
We have audited the Financial Statements of Senkadagala
Finance PLC (‘the Company”) and the Consolidated
Financial Statements of the Company and its subsidiaries
(“the Group”), which comprise the Statement of Financial
Position as at 31 March 2018, and the Statements of Income,
Other Comprehensive Income, Changes in Equity and Cash
Flows for the year then ended, notes to the Financial
Statements, including, a summary of significant accounting
policies and other explanatory information as set out on
pages 147 to 164.
In our opinion, the accompanying Financial Statements of
the Company and the Group give a true and fair view of
the financial position of the Company and the Group as at
31 March 2018 and their financial performance and cash
flows for the year then ended in accordance with Sri Lanka
Accounting Standards.
Basis for opinion
We conducted our audit in accordance with Sri Lankan
Auditing Standards (“SLAuSs”). Our responsibilities under
those standards are further described in the Auditors’
responsibilities for the audit of the Financial Statements
section of our report. We are independent of the Group in
accordance with the Code of Ethics issued by CA Sri Lanka
(“Code of Ethics”) and we believe that the audit evidence we
have obtained is sufficient and appropriate to provide a basis
for our opinion.
Key audit matters
Key audit matters are those matters that, in our professional
judgment, were of most significance in our audit of the
Company Financial Statements and the Consolidated
Financial Statements of the current period. These matters
were addressed in the context of our audit of the Company
Financial Statements and the Consolidated Financial
Statements as a whole, and in forming our opinion thereon,
and we do not provide a separate opinion on these matters.
M.R. Mihular FCA P.Y.S. Perera FCA C.P. Jayatilake FCAT.J.S. Rajakarier FCA W.W.J.C. Perera FCA Ms. S. Joseph FCAMs. S.M.B. Jayasekara ACA W.K.D.C Abeyrathne FCA S.T.D.L. Perera FCAG.A.U. Karunaratne FCA R.M.D.B. Rajapakse FCA Ms. B.K.D.T.N. Rodrigo FCAR.H. Rajan ACA
Principals - S.R.I. Perera FCMA(UK), LLB, Attorney-at-Law, H.S. Goonewardene ACA Ms. C.T.K.N. Perera ACA
KPMG, a Sri Lankan partnership and a member firm
of the KPMG network of independent member firms
affi l iated with KPMG International Cooperative
(“KPMG International”), a Swiss entity.
KPMG Tel : +94 - 11 542 6426(Chartered Accountants) Fax : +94 - 11 244 587232A, Sir Mohamed Macan Markar Mawatha, : +94 - 11 244 6058P. O. Box 186, : +94 - 11 254 1249Colombo 00300, Sri Lanka. Internet : www.kpmg.com/lk

AN
NU
AL
RE
PO
RT
20
17
/1
8 S
EN
KA
DA
GA
LA
FIN
AN
CE
PL
C
135
IND
EP
EN
DE
NT
AU
DIT
OR
S’ R
EP
OR
T
Key audit matters (continued)
Impairment for finance lease, hire purchase and other loans and receivables
Refer “Note 2.7 and 3.6 (Accounting policies) and “Notes 22 to 24. (Notes to the financial statements).
The key audit matter Our responses
As at 31 March 2018, the Company reported net amounts
of lease, hire purchases and other loans and advances
(loans and advances) of Rs. 24,076,785,200, Rs. 204,689,531
and Rs. 3,968,818,838 respectively with a provision of
Rs. 448,508,132 as impairment.
For a loan or advance that is individually significant, the
Company assesses it individually for impairment and for
a loan or advance that is not individually significant, the
Company assesses it collectively for impairment and includes
it in a group of loans or advances with similar credit risk
characteristics and collectively assesses them for impairment.
If the Company determines that no objective evidence of
impairment exists for an individually assessed financial asset
(whether significant or not), it includes the asset in a group
of financial assets with similar credit risk characteristics and
collectively reassesses them for impairment.
The impairment loss for a loan and advance that is individually
assessed is the difference between estimated discounted
future cash flows and book value of the loan and advance.
Such estimated cash flows include available remedies for
recovery, the financial situation of the borrower, collateral
valuation, the seniority of the claim and the existence and
cooperativeness of other creditors. Whilst the Company
appoints external valuers for the valuation of certain property
and other illiquid collateral, enforceability, timing and means
of realisation also affect the ultimate collectability and thereby
the amount of impairment allowances as at the reporting date.
We identified assessing impairment of loans and advances to customers as a key audit matter because loans and advances to customers accounted for 77% of the Company’s total assets and the assessment of impairment loss involved significant estimates and judgements.
Our audit procedures included:
z Evaluating and validating the design, implementation
and operating effectiveness of key controls over timely
identification of individual impaired loans and advances,
estimates of future cash flows and valuation of collaterals
for impaired loans and advances which are assessed on an
individual basis, and selection of models and determination
of key assumptions, parameters and risk adjustments for
collective assessment;
z Performing credit assessment of a sample of loans and
advances not being identified by management as impaired,
challenging management’s assessment by examining the
underlying loan information and external evidence available;
z Reviewing the key assumption in the models such as
forecasts, calculation and assumptions of future cash flows
prepared by management by examining the underlying
supporting evidence including external market data;
z Challenging the validity of the models used and
assumptions adopted by the Company for the calculation of
collective impairment allowances;
z Considering, as part of the procedures above, the nature
of and reasons for any revisions to the key assumptions
and input parameters in the models, the consistency of
judgement applied in the use of economic factors, the loss
emergence period and the observation period for historical
losses and assessing key internal controls over the input
of underlying data into the models. We compared the
economic factors used in the models to market information
to assess whether they were aligned with market and
economic development. We also assessed the emergence
period by tracing the life cycle of overdue accounts from
the specific credit event to downgrading the account to a
non-performing contracts;
SE
NK
AD
AG
AL
A F
INA
NC
E P
LC
AN
NU
AL
RE
PO
RT
20
17
/1
8
136
IND
EP
EN
DE
NT
AU
DIT
OR
S’
RE
PO
RT
Key audit matters (continued)
Impairment for finance lease, hire purchase and other loans and receivables
The key audit matter Our responses
Our audit procedures included:
z Assessing the impairment allowances for individually
impaired loans and advances by selecting a risk-based
sample for credit review. We analysed the loan portfolio
by industry sector to select samples in industries vulnerable
to the current economic slowdown. We also focused on
loans with perceived higher risk and selected samples
from non-performing loans, overdue but performing loans
and borrowers with negative warning signs or adverse
press coverage;
z Re-performing credit assessments for the selected
individually impaired loans and advances by assessing the
forecast of recoverable cash flows through inquiry, applying
judgement and our own research. We evaluated the timing
and means of realisation of collateral and considered other
sources of repayment asserted by management. We also
evaluated the consistency of management’s application of
key assumptions and compared them with our own data
sources. Where available, we made use of post-reporting
date information to evaluate credit quality with hindsight;
z Evaluating the experience, independence, competence and
integrity of the external valuers engaged by the Company to
value certain property and illiquid collateral. Where possible,
we compared the valuations with externally derived data
such as commodity prices and real estate valuations;
z Re-calculating the amount of collective impairment
allowances to assess the application of the Company’s
methodology;
z Assessing the adequacy of disclosures in the consolidated
financial statements in relation to impairment and credit risk.
AN
NU
AL
RE
PO
RT
20
17
/1
8 S
EN
KA
DA
GA
LA
FIN
AN
CE
PL
C
137
IND
EP
EN
DE
NT
AU
DIT
OR
S’ R
EP
OR
T
Key audit matters (continued)
IT systems and controls over financial reporting
The key audit matter Our responses
The Company operates a large and the most complex IT systems for its day-to-day operation.
Automated accounting procedures and IT environment controls, which include IT governance, controls over programmes development and changes, access to programmes and data and IT operations, are required to be designed and to operate effectively to ensure accurate financial reporting.
In particular importance are system calculations, logic regarding significant accounts, including interest calculations, interfaces between business management systems and accounting systems and data migration to new systems.
We identified IT systems and controls over financial reporting as a key audit matter because the Company is heavily dependent on IT systems for the processing and recording of significant volumes of transaction.
Our audit procedures included:
z assessing the design, implementation and operating effectiveness of general IT controls over the continued integrity of all major IT systems;
z examining the framework of governance over the Company’s IT organisation and the controls over programme development and changes, access to programmes and data and IT operations, including compensating controls where required;
z evaluating the design, implementation and operating effectiveness of the significant accounts-related IT process controls by assessing the operating effectiveness of IT Application Controls, assessing the operating effectiveness of certain automated controls and system calculations which are relevant to the Company’s compliance activities and assessing the consistency of data transmission and data migration;
z Assessing the availability and stability of key operating systems, taking into consideration the rapid development of businesses types and transactions volumes as well as IT projects that have a significant impact on business continuity;
z Testing the appropriateness of the access rights given to staff and segregation of duties between users within particular systems.
Other Information
Management is responsible for the other information. The other information comprises all the information included in the Annual Report, but does not include the Financial Statements and our Auditors’ Report thereon.
Our opinion on the Financial Statements does not cover the other information and we do not express any form of assurance conclusion thereon.
In connection with our audit of the Financial Statements, our responsibility is to read the other information and, in doing so, consider whether the other information is materially inconsistent with the Financial Statements or our knowledge obtained in the audit or otherwise appears to be materially misstated.
Responsibilities of Management and Those Charged with Governance for the Financial Statements
Management is responsible for the preparation of Financial Statements that give a true and fair view in accordance with Sri Lanka Accounting Standards, and for such internal control as management determines is necessary to enable the preparation of Financial Statements that are free from material misstatement, whether due to fraud or error In preparing the financial statements, management is responsible for assessing the Group’s ability to continue as a going concern, disclosing, as applicable, matters related to going concern and using the going concern basis of accounting unless management either intends to liquidate the Group or to cease operations, or has no realistic alternative but to do so.
Those charged with governance are responsible for overseeing the Company’s and the Group’s financial reporting process.
SE
NK
AD
AG
AL
A F
INA
NC
E P
LC
AN
NU
AL
RE
PO
RT
20
17
/1
8
138
IND
EP
EN
DE
NT
AU
DIT
OR
S’
RE
PO
RT
Auditors’ responsibilities for the Audit of the Financial Statements
Our objectives are to obtain reasonable assurance about whether the Financial Statements as a whole are free from material misstatement, whether due to fraud or error, and to issue an Auditors’ Report that includes our opinion. Reasonable assurance is a high level of assurance, but is not a guarantee that an audit conducted in accordance with SLAuSs will always detect a material misstatement when it exists. Misstatements can arise from fraud or error and are considered material if, individually or in the aggregate, they could reasonably be expected to influence the economic decisions of users taken on the basis of these Financial Statements.
As part of an audit in accordance with SLAuSs, we exercise professional judgement and maintain professional skepticism throughout the audit. We also:
z Identify and assess the risks of material misstatement of the Financial Statements, whether due to fraud or error, design and perform audit procedures responsive to those risks and obtain audit evidence that is sufficient and appropriate to provide a basis for our opinion. The risk of not detecting a material misstatement resulting from fraud is higher than for one resulting from error, as fraud may involve collusion, forgery, intentional omissions, misrepresentations or the override of internal control.
z Obtain an understanding of internal control relevant to the audit in order to design audit procedures that are appropriate in the circumstances, but not for the purpose of expressing an opinion on the effectiveness of the Company and the Group’s internal control.
z Evaluate the appropriateness of accounting policies used and the reasonableness of accounting estimates and related disclosures made by management.
z Conclude on the appropriateness of management’s use of the going concern basis of accounting and, based on the audit evidence obtained, whether a material uncertainty exists related to events or conditions that may cast significant doubt on the Group's ability to continue as a going concern. If we conclude that a material uncertainty exists, we are required to draw attention in our Auditors’ Report to the related disclosures in the financial statements or, if such disclosures are inadequate, to modify our opinion. Our conclusions are based on the audit evidence obtained up-to-the-date of our Auditors’ Report. However, future events or conditions may cause the Group to cease to continue as a going concern.
z Evaluate the overall presentation, structure and content of the Financial Statements, including the disclosures, and whether the Financial Statements represent the underlying transactions and events in a manner that achieves fair presentation.
z Obtain sufficient appropriate audit evidence regarding the financial information of the entities or business activities within the Group to express an opinion on the Financial Statements. We are responsible for the direction, supervision and performance of the Group audit. We remain solely responsible for our audit opinion.
We communicate with those charged with governance regarding, among other matters, the planned scope and timing of the audit and significant audit findings, including any significant deficiencies in internal control that we identify during our audit.
We also provide those charged with governance with a statement that we have complied with ethical requirements in accordance with the Code of Ethics regarding independence, and to communicate with them all relationships and other matters that may reasonably be thought to bear on our independence and, where applicable, related safeguards.
From the matters communicated with those charge with governance, we determine those matters that were of most significance in the audit of the Financial Statements of the current period and are therefore the key audit matters. We describe these matters in our Auditors’ Report unless law or regulation precludes public disclosure about the matter or when, in extremely rare circumstances, we determine that a matter should not be communicated in our report because the adverse consequences of doing so would reasonably be expected to outweigh the public interest benefits of such communication.
Report on Other Legal and Regulatory Requirements
As required by Section 163 (2) of the Companies Act No. 07 of 2007, we have obtained all the information and explanations that were required for the audit and, as far as appears from our examination, proper accounting records have been kept by the Company.
CA Sri Lanka membership number of the engagement partner responsible for signing this Independent Auditors’ Report is 3707.
Chartered AccountantsKandy,Sri Lanka
31 May 2018
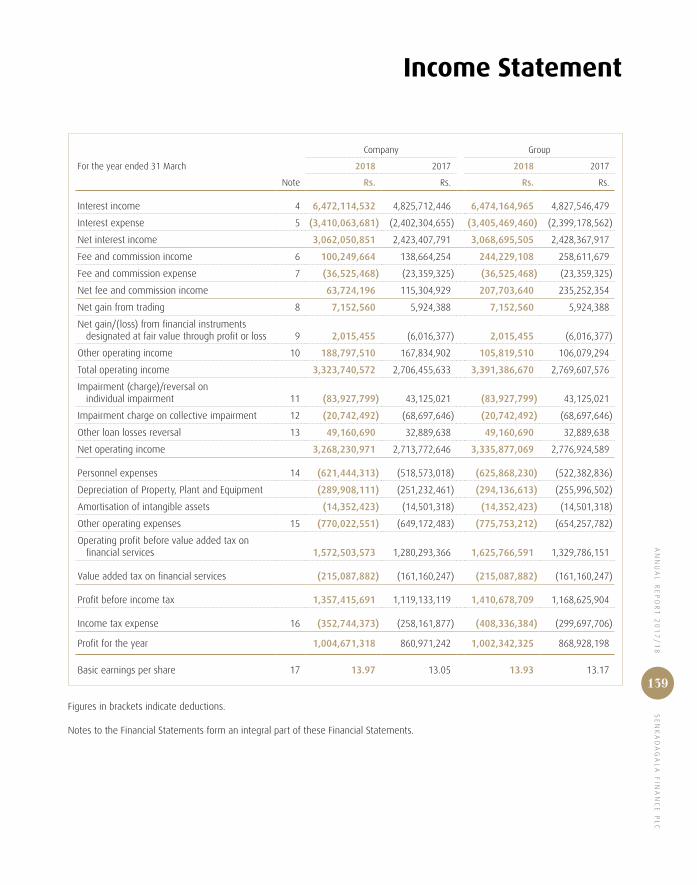
AN
NU
AL
RE
PO
RT
20
17
/1
8 S
EN
KA
DA
GA
LA
FIN
AN
CE
PL
C
139
Income Statement
Company Group
For the year ended 31 March 2018 2017 2018 2017
Note Rs. Rs. Rs. Rs.
Interest income 4 6,472,114,532 4,825,712,446 6,474,164,965 4,827,546,479
Interest expense 5 (3,410,063,681) (2,402,304,655) (3,405,469,460) (2,399,178,562)
Net interest income 3,062,050,851 2,423,407,791 3,068,695,505 2,428,367,917
Fee and commission income 6 100,249,664 138,664,254 244,229,108 258,611,679
Fee and commission expense 7 (36,525,468) (23,359,325) (36,525,468) (23,359,325)
Net fee and commission income 63,724,196 115,304,929 207,703,640 235,252,354
Net gain from trading 8 7,152,560 5,924,388 7,152,560 5,924,388
Net gain/(loss) from financial instruments designated at fair value through profit or loss 9 2,015,455 (6,016,377) 2,015,455 (6,016,377)
Other operating income 10 188,797,510 167,834,902 105,819,510 106,079,294
Total operating income 3,323,740,572 2,706,455,633 3,391,386,670 2,769,607,576
Impairment (charge)/reversal on individual impairment 11 (83,927,799) 43,125,021 (83,927,799) 43,125,021
Impairment charge on collective impairment 12 (20,742,492) (68,697,646) (20,742,492) (68,697,646)
Other loan losses reversal 13 49,160,690 32,889,638 49,160,690 32,889,638
Net operating income 3,268,230,971 2,713,772,646 3,335,877,069 2,776,924,589
Personnel expenses 14 (621,444,313) (518,573,018) (625,868,230) (522,382,836)
Depreciation of Property, Plant and Equipment (289,908,111) (251,232,461) (294,136,613) (255,996,502)
Amortisation of intangible assets (14,352,423) (14,501,318) (14,352,423) (14,501,318)
Other operating expenses 15 (770,022,551) (649,172,483) (775,753,212) (654,257,782)
Operating profit before value added tax on financial services 1,572,503,573 1,280,293,366 1,625,766,591 1,329,786,151
Value added tax on financial services (215,087,882) (161,160,247) (215,087,882) (161,160,247)
Profit before income tax 1,357,415,691 1,119,133,119 1,410,678,709 1,168,625,904
Income tax expense 16 (352,744,373) (258,161,877) (408,336,384) (299,697,706)
Profit for the year 1,004,671,318 860,971,242 1,002,342,325 868,928,198
Basic earnings per share 17 13.97 13.05 13.93 13.17
Figures in brackets indicate deductions.
Notes to the Financial Statements form an integral part of these Financial Statements.
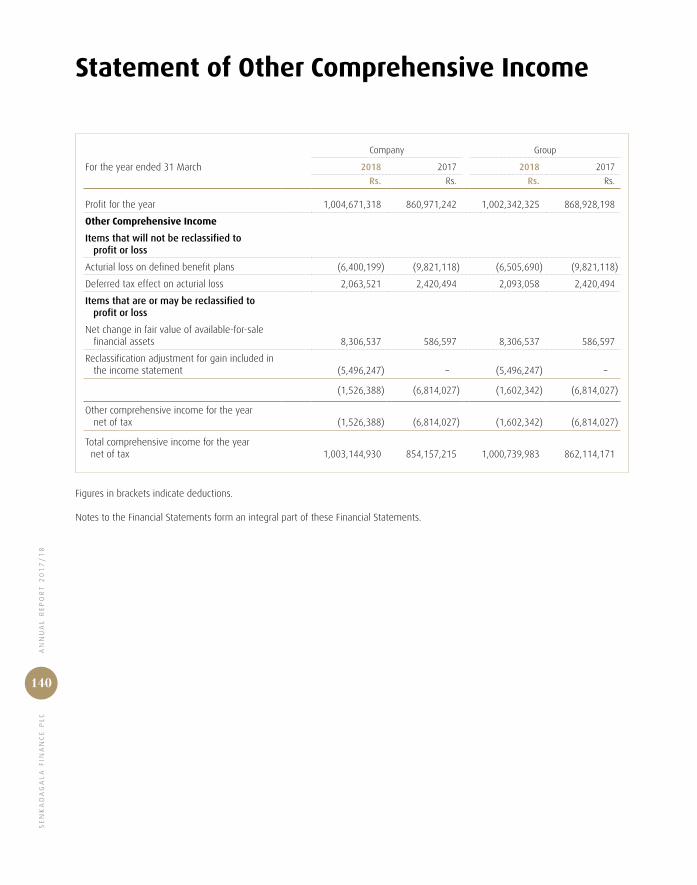
SE
NK
AD
AG
AL
A F
INA
NC
E P
LC
AN
NU
AL
RE
PO
RT
20
17
/1
8
140
Statement of Other Comprehensive Income
Company Group
For the year ended 31 March 2018 2017 2018 2017
Rs. Rs. Rs. Rs.
Profit for the year 1,004,671,318 860,971,242 1,002,342,325 868,928,198
Other Comprehensive Income
Items that will not be reclassified to profit or loss
Acturial loss on defined benefit plans (6,400,199) (9,821,118) (6,505,690) (9,821,118)
Deferred tax effect on acturial loss 2,063,521 2,420,494 2,093,058 2,420,494
Items that are or may be reclassified to profit or loss
Net change in fair value of available-for-sale financial assets 8,306,537 586,597 8,306,537 586,597
Reclassification adjustment for gain included in the income statement (5,496,247) – (5,496,247) –
(1,526,388) (6,814,027) (1,602,342) (6,814,027)
Other comprehensive income for the year net of tax (1,526,388) (6,814,027) (1,602,342) (6,814,027)
Total comprehensive income for the year net of tax 1,003,144,930 854,157,215 1,000,739,983 862,114,171
Figures in brackets indicate deductions.
Notes to the Financial Statements form an integral part of these Financial Statements.
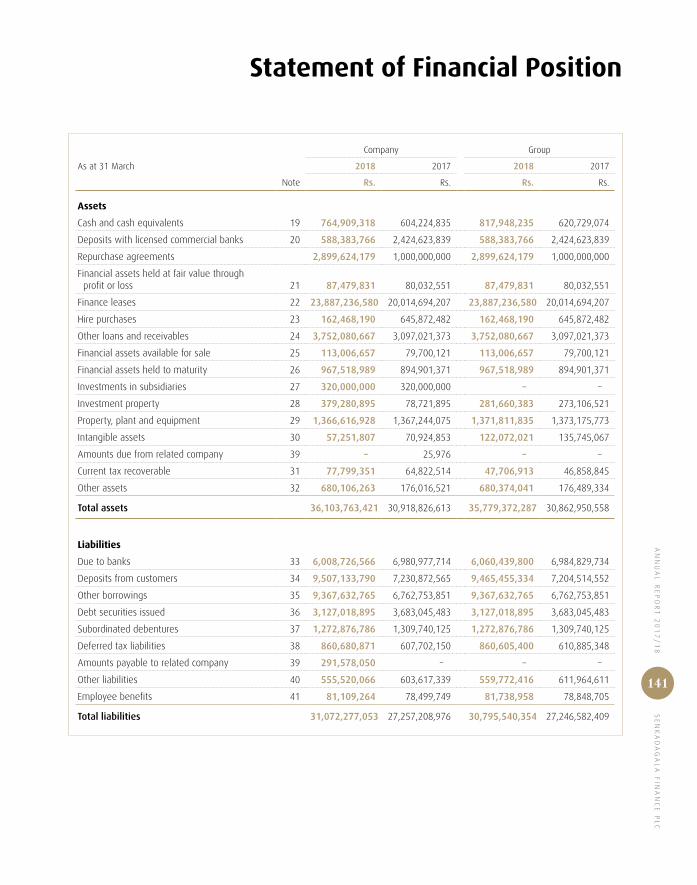
AN
NU
AL
RE
PO
RT
20
17
/1
8 S
EN
KA
DA
GA
LA
FIN
AN
CE
PL
C
141
Statement of Financial Position
Company Group
As at 31 March 2018 2017 2018 2017
Note Rs. Rs. Rs. Rs.
Assets
Cash and cash equivalents 19 764,909,318 604,224,835 817,948,235 620,729,074
Deposits with licensed commercial banks 20 588,383,766 2,424,623,839 588,383,766 2,424,623,839
Repurchase agreements 2,899,624,179 1,000,000,000 2,899,624,179 1,000,000,000
Financial assets held at fair value through profit or loss 21 87,479,831 80,032,551 87,479,831 80,032,551
Finance leases 22 23,887,236,580 20,014,694,207 23,887,236,580 20,014,694,207
Hire purchases 23 162,468,190 645,872,482 162,468,190 645,872,482
Other loans and receivables 24 3,752,080,667 3,097,021,373 3,752,080,667 3,097,021,373
Financial assets available for sale 25 113,006,657 79,700,121 113,006,657 79,700,121
Financial assets held to maturity 26 967,518,989 894,901,371 967,518,989 894,901,371
Investments in subsidiaries 27 320,000,000 320,000,000 – –
Investment property 28 379,280,895 78,721,895 281,660,383 273,106,521
Property, plant and equipment 29 1,366,616,928 1,367,244,075 1,371,811,835 1,373,175,773
Intangible assets 30 57,251,807 70,924,853 122,072,021 135,745,067
Amounts due from related company 39 – 25,976 – –
Current tax recoverable 31 77,799,351 64,822,514 47,706,913 46,858,845
Other assets 32 680,106,263 176,016,521 680,374,041 176,489,334
Total assets 36,103,763,421 30,918,826,613 35,779,372,287 30,862,950,558
Liabilities
Due to banks 33 6,008,726,566 6,980,977,714 6,060,439,800 6,984,829,734
Deposits from customers 34 9,507,133,790 7,230,872,565 9,465,455,334 7,204,514,552
Other borrowings 35 9,367,632,765 6,762,753,851 9,367,632,765 6,762,753,851
Debt securities issued 36 3,127,018,895 3,683,045,483 3,127,018,895 3,683,045,483
Subordinated debentures 37 1,272,876,786 1,309,740,125 1,272,876,786 1,309,740,125
Deferred tax liabilities 38 860,680,871 607,702,150 860,605,400 610,885,348
Amounts payable to related company 39 291,578,050 – – –
Other liabilities 40 555,520,066 603,617,339 559,772,416 611,964,611
Employee benefits 41 81,109,264 78,499,749 81,738,958 78,848,705
Total liabilities 31,072,277,053 27,257,208,976 30,795,540,354 27,246,582,409

SE
NK
AD
AG
AL
A F
INA
NC
E P
LC
AN
NU
AL
RE
PO
RT
20
17
/1
8
142
ST
AT
EM
EN
T O
F F
INA
NC
IAL
PO
SIT
ION
Company Group
As at 31st March 2018 2017 2018 2017
Note Rs. Rs. Rs. Rs.
Equity
Stated capital 42 1,587,862,680 1,008,062,200 1,587,862,680 1,008,062,200
Statutory reserve fund 43 365,036,033 310,036,033 369,997,079 310,190,064
Available-for-sale reserve 44 7,171,473 4,361,183 7,171,473 4,361,183
Retained earnings 3,071,416,182 2,339,158,221 3,018,800,701 2,293,754,702
Total equity 5,031,486,368 3,661,617,637 4,983,831,933 3,616,368,149
Total liabilities and equity 36,103,763,421 30,918,826,613 35,779,372,287 30,862,950,558
Figures in brackets indicate deductions.
Notes to the Financial Statements form an integral part of these Financial Statements.
It is certified that the Financial Statements have been prepared in compliance with the requirements of the Companies
Act No. 07 of 2007 and the Finance Business Act No.42 of 2011.
S D Bandaranayake
Additional Chief Executive Officer
The Board of Directors is responsible for the preparation and presentation of these Financial Statements.
Approved and signed for and on behalf of the Board.
W M R S Dias L Balasuriya
Chairman Chief Executive Officer/Managing Director
Colombo,
Sri Lanka
31 May 2018

AN
NU
AL
RE
PO
RT
20
17
/1
8 S
EN
KA
DA
GA
LA
FIN
AN
CE
PL
C
143
Statement of Changes in Equity
Stated capital
Rs.
Statutory reserve fund
Rs.
Available-for-salereserve
Rs.
Retainedearnings
Rs.
Total
Rs.
Company
Balance as at 1 April 2016 1,008,062,200 265,036,033 3,774,586 1,716,486,135 2,993,358,954
Total comprehensive income for the year
Profit for the year – – – 860,971,242 860,971,242
Other comprehensive income, net of tax – – 586,597 (7,400,624) (6,814,027)
Total comprehensive income for the year – – 586,597 853,570,618 854,157,215
Transactions with equity holders recognised directly in equity
Transfers to reserves – 45,000,000 – (45,000,000) –
Dividends paid – – – (185,898,532) (185,898,532)
Balance as at 31 March 2017 1,008,062,200 310,036,033 4,361,183 2,339,158,221 3,661,617,637
Balance as at 1 April 2017 1,008,062,200 310,036,033 4,361,183 2,339,158,221 3,661,617,637
Total comprehensive income
Profit for the year – – – 1,004,671,318 1,004,671,318
Other comprehensive income, net of tax – – 2,810,290 (4,336,678) (1,526,388)
Total comprehensive income for the year – – 2,810,290 1,000,334,640 1,003,144,930
Transactions with equity holders recognised directly in equity
Rights issue of shares 579,800,480 – – – 579,800,480
Transfers to reserves – 55,000,000 – (55,000,000) –
Dividends paid – – – (213,076,679) (213,076,679)
Balance as at 31 March 2018 1,587,862,680 365,036,033 7,171,473 3,071,416,182 5,031,486,368
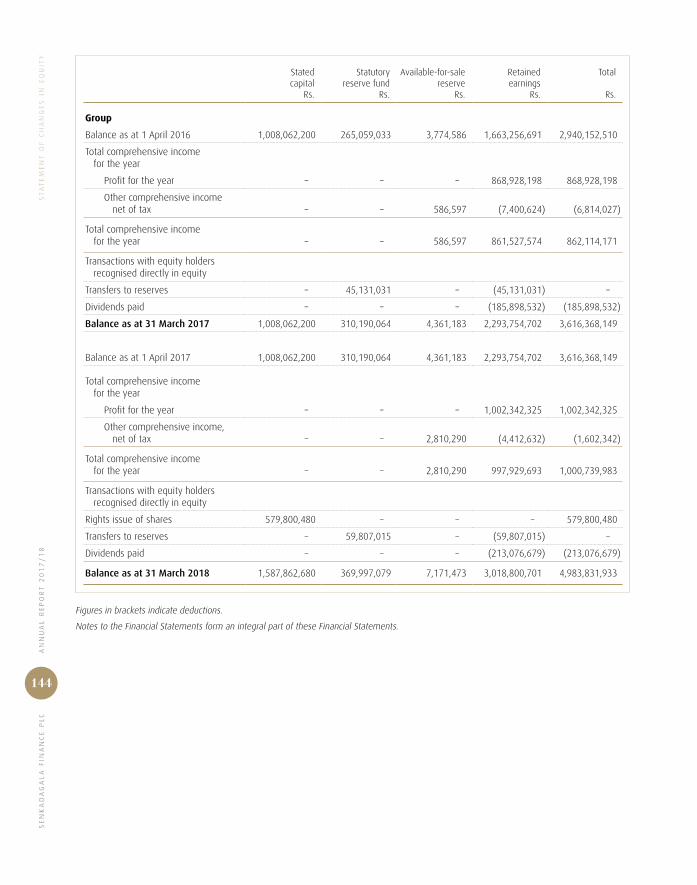
SE
NK
AD
AG
AL
A F
INA
NC
E P
LC
AN
NU
AL
RE
PO
RT
20
17
/1
8
144
ST
AT
EM
EN
T O
F C
HA
NG
ES
IN
EQ
UIT
Y
Stated capital
Rs.
Statutory reserve fund
Rs.
Available-for-salereserve
Rs.
Retainedearnings
Rs.
Total
Rs.
Group
Balance as at 1 April 2016 1,008,062,200 265,059,033 3,774,586 1,663,256,691 2,940,152,510
Total comprehensive income for the year
Profit for the year – – – 868,928,198 868,928,198
Other comprehensive income net of tax – – 586,597 (7,400,624) (6,814,027)
Total comprehensive income for the year – – 586,597 861,527,574 862,114,171
Transactions with equity holders recognised directly in equity
Transfers to reserves – 45,131,031 – (45,131,031) –
Dividends paid – – – (185,898,532) (185,898,532)
Balance as at 31 March 2017 1,008,062,200 310,190,064 4,361,183 2,293,754,702 3,616,368,149
Balance as at 1 April 2017 1,008,062,200 310,190,064 4,361,183 2,293,754,702 3,616,368,149
Total comprehensive income for the year
Profit for the year – – – 1,002,342,325 1,002,342,325
Other comprehensive income, net of tax – – 2,810,290 (4,412,632) (1,602,342)
Total comprehensive income for the year – – 2,810,290 997,929,693 1,000,739,983
Transactions with equity holders recognised directly in equity
Rights issue of shares 579,800,480 – – – 579,800,480
Transfers to reserves – 59,807,015 – (59,807,015) –
Dividends paid – – – (213,076,679) (213,076,679)
Balance as at 31 March 2018 1,587,862,680 369,997,079 7,171,473 3,018,800,701 4,983,831,933
Figures in brackets indicate deductions.
Notes to the Financial Statements form an integral part of these Financial Statements.

AN
NU
AL
RE
PO
RT
20
17
/1
8 S
EN
KA
DA
GA
LA
FIN
AN
CE
PL
C
145
Statement of Cash Flows
Company Group
For the year ended 31 March 2018 2017 2018 2017
Rs. Rs. Rs. Rs.
Cash flows from operating activities
Interest and commission receipts 6,152,584,062 4,922,095,925 6,298,613,939 5,043,877,383
Interest payments (3,371,849,640) (2,203,788,690) (3,367,255,419) (2,200,662,597)
Recoveries of bad debts 59,340,255 82,116,115 59,340,255 82,116,115
Other operating income 27,690,503 33,986,747 36,062,503 41,473,162
Operating expenditure (1,030,947,733) (846,868,448) (1,036,678,394) (851,953,747)
Cash payments to employees (604,931,628) (506,741,244) (609,180,298) (510,421,042)
Operating cash flow before changes in operating assets and liabilities (Note A) 1,231,885,819 1,480,800,405 1,380,902,586 1,604,429,274
Changes in operating assets and liabilities
Net funds advanced to customers (3,729,955,265) (6,868,790,219) (3,729,955,265) (6,868,790,219)
Deposits from customers 2,276,261,225 720,839,459 2,260,940,783 718,503,635
Deposits with licensed commercial banks 1,853,032,972 (1,166,415,508) 1,853,032,972 (1,166,415,508)
Government and other securities (1,972,241,797) (90,245,936) (1,972,241,797) (90,245,936)
Other assets (501,535,902) 56,020,314 (503,884,707) 48,815,111
Other liabilities (35,589,755) 100,712,831 (38,541,933) 99,354,922
(2,110,028,522) (7,247,879,059) (2,130,649,947) (7,258,777,995)
Net cash flow from operating activities before taxation (878,142,703) (5,767,078,654) (749,747,361) (5,654,348,721)
Taxes paid (124,114,988) (146,374,272) (171,950,106) (186,637,229)
Gratuity paid (20,303,369) (2,593,855) (20,303,369) (2,593,855)
Net cash used in operating activities (1,022,561,060) (5,916,046,781) (942,000,836) (5,843,579,805)
Cash flows from investing activities
Net investment in trading securities (3,775,513) (600,963) (3,775,513) (600,963)
Net investment in financial assets available for sale (25,000,000) (60,000,001) (25,000,000) (60,000,001)
Dividends received on investments 94,268,382 73,834,412 2,918,382 2,734,412
Purchase of property, plant and equipment (358,456,807) (623,999,946) (358,993,567) (630,403,716)
Purchase of intangible assets (679,377) (16,867,226) (679,377) (16,867,226)
Proceeds from sale of property, plant and equipment 124,505,757 112,919,850 124,505,757 115,919,852
Net cash used in investing activities (169,137,558) (514,713,874) (261,024,318) (589,217,642)
Cash flows from financing activities
Proceeds from rights issue 579,800,480 – 579,800,480 –
Securitised loans obtained 6,740,000,000 7,800,000,000 6,740,000,000 7,800,000,000
Repayment of loans (5,082,045,291) (2,914,219,680) (5,082,045,291) (2,914,219,680)
Debentures issued – 3,000,000,000 – 3,000,000,000
Redemption of debenture (585,753,500) (1,134,246,500) (585,753,500) (1,134,246,500)
Dividends paid (212,148,177) (185,015,108) (212,148,177) (185,015,108)
Net cash generated from financing activities 1,439,853,512 6,566,518,712 1,439,853,512 6,566,518,712
Figures in brackets indicate deductions.
Notes to the Financial Statements form an integral part of these Financial Statements.
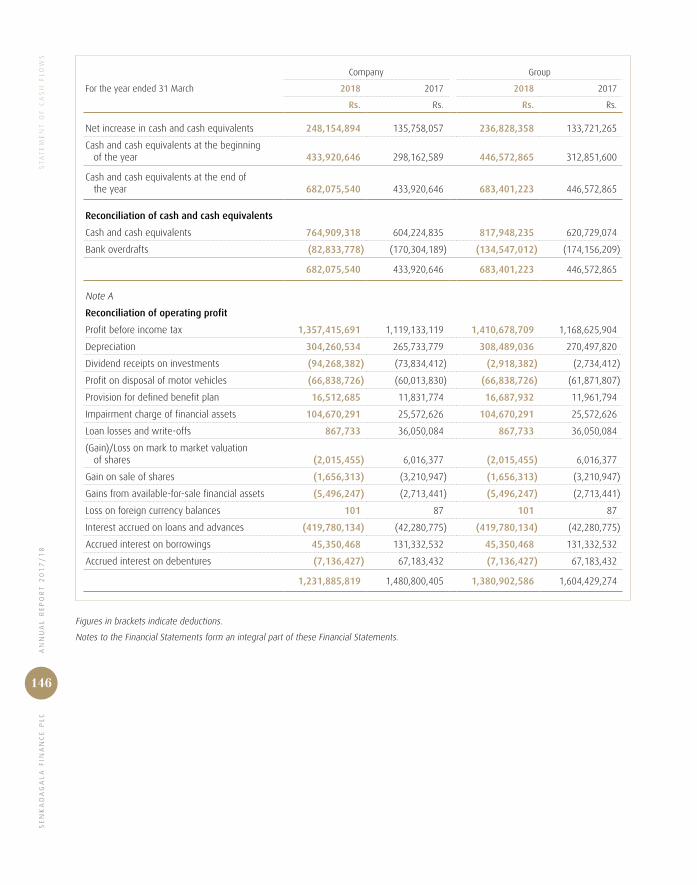
SE
NK
AD
AG
AL
A F
INA
NC
E P
LC
AN
NU
AL
RE
PO
RT
20
17
/1
8
146
ST
AT
EM
EN
T O
F C
AS
H F
LO
WS
Company Group
For the year ended 31 March 2018 2017 2018 2017
Rs. Rs. Rs. Rs.
Net increase in cash and cash equivalents 248,154,894 135,758,057 236,828,358 133,721,265
Cash and cash equivalents at the beginning of the year 433,920,646 298,162,589 446,572,865 312,851,600
Cash and cash equivalents at the end of the year 682,075,540 433,920,646 683,401,223 446,572,865
Reconciliation of cash and cash equivalents
Cash and cash equivalents 764,909,318 604,224,835 817,948,235 620,729,074
Bank overdrafts (82,833,778) (170,304,189) (134,547,012) (174,156,209)
682,075,540 433,920,646 683,401,223 446,572,865
Note A
Reconciliation of operating profit
Profit before income tax 1,357,415,691 1,119,133,119 1,410,678,709 1,168,625,904
Depreciation 304,260,534 265,733,779 308,489,036 270,497,820
Dividend receipts on investments (94,268,382) (73,834,412) (2,918,382) (2,734,412)
Profit on disposal of motor vehicles (66,838,726) (60,013,830) (66,838,726) (61,871,807)
Provision for defined benefit plan 16,512,685 11,831,774 16,687,932 11,961,794
Impairment charge of financial assets 104,670,291 25,572,626 104,670,291 25,572,626
Loan losses and write-offs 867,733 36,050,084 867,733 36,050,084
(Gain)/Loss on mark to market valuation of shares (2,015,455) 6,016,377 (2,015,455) 6,016,377
Gain on sale of shares (1,656,313) (3,210,947) (1,656,313) (3,210,947)
Gains from available-for-sale financial assets (5,496,247) (2,713,441) (5,496,247) (2,713,441)
Loss on foreign currency balances 101 87 101 87
Interest accrued on loans and advances (419,780,134) (42,280,775) (419,780,134) (42,280,775)
Accrued interest on borrowings 45,350,468 131,332,532 45,350,468 131,332,532
Accrued interest on debentures (7,136,427) 67,183,432 (7,136,427) 67,183,432
1,231,885,819 1,480,800,405 1,380,902,586 1,604,429,274
Figures in brackets indicate deductions.
Notes to the Financial Statements form an integral part of these Financial Statements.

AN
NU
AL
RE
PO
RT
20
17
/1
8 S
EN
KA
DA
GA
LA
FIN
AN
CE
PL
C
147
Notes to the Financial Statements
1. Corporate Information
1.1 Domicile and legal form
Senkadagala Finance PLC is a public limited liability Company
domiciled in Sri Lanka, incorporated under the Companies
Act No. 51 of 1938 on 29 December 1968 and registered
under the Finance Company Act No.78 of 1988 which was
replaced by the Finance Business Act No. 42 of 2011. The
Company has re–registered under the Companies Act No. 07
of 2007. The registered office of the Company is situated at
2nd Floor, No. 267, Galle Road, Colombo 03.
As a registered finance company, it is supervised by the
Department of Supervision of Non-Bank Financial Institutions
of the Central Bank of Sri Lanka.
1.2 Number of employees
The number of employees of the Company at the end of the
year was 745 (2017-690).
1.3 Consolidated Financial Statement
The Consolidated Financial Statements of Senkadagala
Finance PLC for the year ended 31 March 2018 comprise
those of the company (parent company) and its subsidiaries
(together referred to as the “Group”).
1.4 Principal activities and nature of operations
Company
The principal lines of business of the Company can be broadly
classified under two categories – fund based and fee based.
The fund based services include leasing, hire purchase
finance, trade loans and pledge loans. The fee based services
include Vehicle valuations etc.
Subsidiaries
The subsidiary companies and their principal line of business
are as follows:
z Senkadagala Insurance Brokers (Pvt) Ltd.
During the year, the principal activity of the Senkadagala
Insurance Brokers (Pvt) Ltd. was providing insurance
brokering services. The Company holds 100% share capital of
Senkadagala Insurance Brokers (Pvt) Ltd.
z Newest Capital Limited
The Company acquired 100% equity stake of Newest Capital
Limited under the consolidation programme implemented
by Central Bank of Sri Lanka. The principal activities of the
Company was Finance Leasing business. However, Newest
Capital Limited had not carried out any finance leasing
business during the year under review.
1.5 Parent enterprise and ultimate parent enterprise
E W Balasuriya and Company Private Limited which is
incorporated and domiciled in Sri Lanka is the immediate and
ultimate parent of Senkadagala Finance PLC.
2. Basis of Preparation
2.1 Statement of compliance
The Financial Statements of the Company and the Group
are prepared in accordance with Sri Lanka Accounting
Standards (LKASs and SLFRSs) as issued by The Institute of
Chartered Accountants of Sri Lanka and the requirements of
the Companies Act No. 7 of 2007, Finance Companies
Act No. 78 of 1988 which is replaced by the new Finance
Business Act No. 42 of 2011 and the amendments to
these acts and provide appropriate disclosures as required
by the Central Bank of Sri Lanka and Listing Rules of Colombo
Stock Exchange.
The formats used in the preparation of the Financial
Statements and the disclosures made therein also comply
with the specified format prescribed by the Central Bank of
Sri Lanka for the preparation, presentation and publication
of Annual Audited Financial Statements of Non-Bank
Financial Institutions.
2.2 Responsibility for Financial Statements
The Board of Directors is responsible for the preparation and
presentation of the Financial Statements of the Group and
Company in accordance with the provisions of the Companies
Act No. 07 of 2007 and Sri Lanka Accounting Standards
(SLFRSs and LKASs).

SE
NK
AD
AG
AL
A F
INA
NC
E P
LC
AN
NU
AL
RE
PO
RT
20
17
/1
8N
OT
ES
TO
TH
E F
INA
NC
IAL
ST
AT
EM
EN
TS
148
The Financial Statements of Senkadagala Finance PLC for
the year ended 31 March 2018 were authorised for issue in
accordance with a resolution of the Board of Directors on
31 May 2018.
These Financial Statements include the following
components:
z An Income Statement providing the information on the
financial performance of the Company and Group for the
year under review.
z A Statement of Other Comprehensive Income providing
the other comprehensive income of the Company and
Group for the Year under review.
z A Statement of Financial Position providing the
information on the financial position of the Company and
Group as at the year end.
z A Statement of Changes in Equity providing the
information on all changes in shareholder’s equity of the
Company and Group during the year under review.
z A Statement of Cash Flows providing the information on
the cash and cash equivalents generating ability of the
Company and the Group and the utilisation of those
cash flows.
z Notes to the Financial Statements comprising accounting
policies used by of the Company and the Group.
2.3 Basis of measurement
The Financial Statements of the Senkadagala Finance PLC
(“The Company”) and consolidated subsidiaries (“Group”)
are prepared in Sri Lankan Rupees on a historical cost
basis except for available-for-sale investments, other
financial assets and liabilities held for trading and financial
assets and liabilities designated at fair value through profit
or loss, defined benefit obligation, all of which have been
measured at fair value. No adjustments have been made for
inflationary factors.
2.4 Functional and presentation currency
Items included in the Financial Statements of the Group and
the Company are measured using the currency of the primary
economic environment in which the Company operates.
Financial Statements are presented in Sri Lankan Rupees,
which is the Company and its Subsidiary‘s functional currency.
There was no change in the Group’s presentation and
functional currency during the year under review.
2.5 Preparation of Financial Statements
The Company and Group presents its Statement of Financial
Position broadly in order of liquidity. An analysis regarding
recovery or settlement based on maturity is presented in
Note 48. No adjustments have been made for inflationary
factors affecting the Financial Statements.
Financial assets and financial liabilities are offset and the
net amount reported in the Statement of Financial Position
only when there is a legally enforceable right to offset the
recognised amounts and there is an intention to settle on
a net basis, or to realise the assets and settle the liability
simultaneously. Income and expenses are not offset in the
Income Statement unless required or permitted by any
accounting standard or interpretation, and as specifically
disclosed in the accounting policies of the Group.
2.6 Materiality and aggregation
Each material class of similar items is presented separately
in the Financial Statements. Items of dissimilar nature or
function are presented separately unless they are immaterial
as permitted by the Sri Lanka Accounting Standard – LKAS 1 –
Presentation of Financial Statements and Amendments to the
LKAS 1 “Disclosures Initiative”.
2.7 Significant accounting judgments, estimates and assumptions
The preparation of the Financial Statements in conformity
with Sri Lanka Accounting Standards (SLFRS/LKAS)
requires management to make judgments, estimates and
assumptions that affect the application of accounting policies
and the reported amounts of assets, liabilities, income and
expense. Actual amount may differ from these estimates.
Estimates and underlying assumptions are reviewed on
an ongoing basis. Revisions to accounting estimates are
recognised in the period in which the estimate is revised and
in any future periods affected.
AN
NU
AL
RE
PO
RT
20
17
/1
8 S
EN
KA
DA
GA
LA
FIN
AN
CE
PL
CN
OT
ES
TO
TH
E F
INA
NC
IAL
ST
AT
EM
EN
TS
149
Information about significant areas of estimation, uncertainty,
critical judgments and assumptions in applying accounting
policies that have the most significant effect on the amounts
recognised in the Financial Statements are described in
Notes below:
2.7.1 Going concern
The Group’s management has made an assessment of its
ability to continue as a going concern and is satisfied that it
has the resources to continue in business for the foreseeable
future. Furthermore, management is not aware of any
material uncertainties that may cast significant doubt upon
the Group’s ability to continue as a going concern. Therefore,
the Financial Statements continue to be prepared on the
going concern basis.
2.7.2 Fair value of financial instruments
A number of the Group’s accounting policies and disclosures
require the measurement of fair values, for both financial and
non-financial assets and liabilities.
The Group has an established control framework with respect
to the measurement of fair values.
This includes a valuation team that has overall responsibility
for overseeing all significant fair value measurements,
including Level 3 fair values, and reports directly to the CFO.
The valuation team regularly reviews significant unobservable
inputs and valuation adjustments. If third party information,
such as broker quotes or pricing services, is used to measure
fair values, then the valuation team assesses the evidence
obtained from the third parties to support the conclusion that
such valuations meet the requirements of SLFRS, including
the level in the fair value hierarchy in which such valuations
should be classified.
When measuring the fair value of an asset or a liability,
the Group uses observable market data as far as possible.
Fair values are categorised into different levels in a fair
value hierarchy based on the inputs used in the valuation
techniques as follows:
z Level 1: quoted prices (unadjusted) in active markets for
identical assets or liabilities.
z Level 2: inputs other than quoted prices included in Level
1 that are observable for the asset or liability, either
directly (i.e. as prices) or indirectly (i.e. derived from
prices).
z Level 3: inputs for the asset or liability that are not based
on observable market data (unobservable inputs).
If the inputs used to measure the fair value of an asset or
a liability fall into different levels of the fair value hierarchy,
then the fair value measurement is categorised in its entirety
in the same level of the fair value hierarchy as the lowest
level input that is significant to the entire measurement.
The Group recognises transfers between levels of the fair
value hierarchy at the end of the reporting period during
which the change has occurred.
Further information about the assumptions made in
measuring fair values is included in the following Notes:
z Note 28.2 – Investment Property
z Note 29.7 – Property, Plant and Equipment
z Note 50 A and B – Financial Instruments
2.7.3 Financial assets and liabilities classification
The Group classifies financial assets and liabilities into
different accounting categories in certain circumstances,
z In classifying financial assets or liabilities at “Fair value
through profit or loss” (FVTPL), the Group has determined
that it has met the criteria for this designation as follows.
Financial assets are classified as held for trading if:
– they are acquired principally for the purpose of selling
or repurchasing in the near term; or
– they hold as a part of a portfolio that is managed
together for short-term profit or position taking; or

SE
NK
AD
AG
AL
A F
INA
NC
E P
LC
AN
NU
AL
RE
PO
RT
20
17
/1
8N
OT
ES
TO
TH
E F
INA
NC
IAL
ST
AT
EM
EN
TS
150
– they form part of derivative financial instruments
entered into by the Group that are not designated as
hedging instruments in hedge relationships as per the
Sri Lanka Accounting Standard – LKAS 39 on “Financial
Instruments: Recognition and Measurement”.
z In classifying financial assets as held-to-maturity, the
Group has determined that it has both the positive
intention and the ability to hold the assets until their
maturity date.
z In classifying financial assets as “available for sale” (AFS),
the Group has determined that all non-derivative financial
assets that are designated as available-for-sale or those
financial assets not classified as loans and receivables.
z In classifying financial assets as “Loans and receivables”,
the Group has determined that all non-derivative financial
assets with fixed or determinable payments that are not
quoted in an active market.
2.7.4 Impairment losses on loans and advances
The Group reviews its individually significant loans and
advances at each reporting date to assess whether
an impairment loss should be recorded in the Income
Statement. In particular, management’s judgment is
required in the estimation of the amount and timing of
future cash flows when determining the impairment loss.
These estimates are based on assumptions about a number
of factors and actual results may differ, resulting in future
changes to the allowance.
Loans and advances have been assessed individually if such
loans and advances are considered individually significant
and all other loans and advances are then assessed
collectively, in groups of assets with similar risk.
Characteristics, to determine whether provision should be
made due to incurred loss events for which there is objective
evidence, but the effects of which are not yet evident. The
collective assessment takes account of data from the loan
portfolio (such as loan types, levels of arrears, type of the
borrowers, industries, etc.), and judgments on the effect of
concentrations of risks and economic data (including levels of
unemployment, prices indices, Inflation etc.). The impairment
of financial assets is disclosed in more detail in Note 3.6.
2.7.5 Impairment of available-for-sale investments
The Group reviews its debt securities classified as available
for-sale-investments at each reporting date to assess
whether they are impaired. This requires similar judgment as
applied to the individual assessment of loans and advances.
The Group also records impairment charges on available-for-
sale equity investments when there has been a significant
or prolonged decline in the fair value below their cost. The
determination of what is “significant” or “prolonged” requires
judgment. In making this judgment, the Group evaluates,
among other factors, historical share price movements and
duration and extent to which the fair value of an investment
is less than its cost.
2.7.6 Defined benefit obligation
The cost of the defined benefit plan is determined using an
actuarial valuation. The actuarial valuation involves making
assumptions about discounting rates, future salary increases
and mortality rates. Due to the long-term nature of these
plans, such estimates are subject to significant uncertainty.
2.7.7 Useful Life of property, plant and equipment
The Group reviews the residual values, useful life and
method of depreciation for property, plant and equipment
at each reporting date. Judgment of the management is
exercised in the estimation of these values, rate methods
and hence subject to uncertainty.
3. Significant Accounting Policies
3.1 Basis of consolidation
The Financial Statements of the Company and Group
comprise the Financial Statements of the Company and
its subsidiaries for the year ended 31 March 2018. The
Financial Statements of the Company’s subsidiaries for
the purpose of consolidation are prepared for the same
reporting year as that of Senkadagala Finance PLC, using
consistent accounting policies.
All intra–group balances, transactions, income and expenses
are eliminated in full.
AN
NU
AL
RE
PO
RT
20
17
/1
8 S
EN
KA
DA
GA
LA
FIN
AN
CE
PL
CN
OT
ES
TO
TH
E F
INA
NC
IAL
ST
AT
EM
EN
TS
151
Subsidiaries are entities controlled by the Group. The Group
controls an entity when it is exposed to, or has rights to,
variable returns from its involvement with the entity and
has the ability to affect those returns through its power
over the entity. The Financial Statements of subsidiaries are
included in the Consolidated Financial Statements from the
date on which control commences until the date on which
control ceases.
3.1.1 Non-controlling Interests
Non-controlling interests are measured at their proportionate
share of the acquiree’s identifiable net assets at the date of
acquisition.
Changes in the Group’s interest in a subsidiary that do
not result in a loss of control are accounted for as equity
transactions.
3.1.2 Loss of control
When the Group loses control over a subsidiary, it
derecognises the assets and liabilities of the subsidiary,
and any related NCI and other components of equity. Any
resulting gain or loss is recognised in profit or loss. Any
interest retained in the former subsidiary is measured at fair
value when control is lost.
3.1.3 Transactions eliminated on consolidation
Intra-group balances and transactions, and any unrealised
income and expenses arising from intra-group transactions,
are eliminated. Unrealised losses are eliminated in the same
way as unrealised gains, but only to the extent that there is
no evidence of impairment.
3.2 Foreign currency translation
Transactions in foreign currencies are translated into the
respective functional currencies of the operations at the
spot exchange rates at the dates of the transactions. All
differences arising on non-trading activities are taken to
‘Other Operating Income’ in the Income Statement. Monetary
assets and liabilities denominated in foreign currencies at
the reporting date are translated into the functional currency
at the spot exchange rate at that date. Non-monetary assets
and liabilities that are measured in terms of historical cost in
a foreign currency are translated using the exchange rate at
the date of the transaction.
Unrealised gains and losses are dealt under “Other Operating
Income” in the Income Statement.
3.3 Financial instruments – initial recognition and subsequent measurement
(i) Date of recognition
All financial assets and liabilities are initially recognised
on the trade date, i.e., the date that the Group becomes a
party to the contractual provisions of the instrument. This
includes ’regular way trades’: purchases or sales of financial
assets that require delivery of assets within the time frame
generally established by regulation or convention in the
market place.
(ii) Initial measurement of financial instruments
The classification of financial instruments at initial recognition
depends on their purpose and characteristics and the
management’s intention in acquiring them. All financial
instruments are measured initially at their fair value plus
transaction costs, except in the case of financial assets and
financial liabilities recorded at fair value through profit or loss.
(iii) Classification and subsequent measurement of financial assets
At initial recognition financial assets are classified in to one of
the following categories:
z At fair value through profit or loss account
– Held for trading: or
– Designated at fair value through profit or loss.
z Loans and receivables
z Available for sale: or
z Held to maturity
Subsequent measurement depends on the financial
asset category.

SE
NK
AD
AG
AL
A F
INA
NC
E P
LC
AN
NU
AL
RE
PO
RT
20
17
/1
8N
OT
ES
TO
TH
E F
INA
NC
IAL
ST
AT
EM
EN
TS
152
(a) Financial assets held-for-trading
Financial assets held-for-trading are recorded in the
Statement of Financial Position at fair value. Changes in
fair value are recognised in “Net gain/(loss) from financial
instruments designated at fair value through profit or loss”.
Interest and dividend income or expense is recorded in “Other
operating income” according to the terms of the contract,
or when the right to the payment has been established.
Included in this classification are debt securities and equities
that have been acquired principally for the purpose of selling
or repurchasing in the near term.
(b) Financial assets designated at fair value through profit or loss
Financial assets classified in this category are those that have
been designated by management upon initial recognition.
Management may only designate an instrument at fair
value through profit or loss upon initial recognition when the
following criteria are met, and designation is determined on
an instrument by instrument basis:
z The designation eliminates or significantly reduces the
inconsistent treatment that would otherwise arise from
measuring the assets or recognising gains or losses on
them on a different basis.
z The assets are part of a group of financial assets,
financial liabilities or both, which are managed and
their performance evaluated on a fair value basis, in
accordance with a documented risk management or
investment strategy.
z The financial instrument contains one or more embedded
derivatives, which significantly modify the cash flows that
would otherwise be required by the contract.
z Financial assets at fair value through profit or loss are
recorded in the Statement of Financial Position at fair
value. Changes in fair value are recorded in ‘Net gain/
(loss) on financial instruments designated at fair value
through profit or loss. Interest earned, dividend income on
these assets are recorded in “Other operating income”.
(c) Loans and receivables
Loans and receivables include non-derivative financial assets
with fixed or determinable payments that are not quoted in
an active market, other than –
z Those that the Group intends to sell immediately or in the
near term and those that the Group at initial recognition
designates as at fair value through profit or loss.
z Those that the Group upon initial recognition, designates
as available-for-sale.
z Those for which the Group may not recover substantially
all of its initial investment, other than because of credit
deterioration.
When the Group is the lessor in a lease agreement that
transfers substantially all the risks and rewards incidental
to ownership of the asset to the lessee, the arrangement
is classified as a finance lease. Amount receivable under
finance leases net of initial rentals received, unearned
lease income and provision for impairment are classified as
lease receivable and presented under “Finance lease” in the
Statement of Financial Position.
A lease that does not transfer substantially all the risk and
rewards incidental to ownership is classified as operating
lease. Group does not have any operating leases as at the
reporting date.
Subsequent to the initial measurement, Lease, Hire purchases
and other loans and advances are subsequently measured at
amortised cost using the EIR, less provision for impairment
except when the Group recognises loans and receivable at
fair value through profit or loss. Amortised cost is calculated
by taking into account any discounts or premium on
acquisition and fees and costs that are integral part of the
EIR. The amortisation is included in Interest Income in the
Income Statement. The losses arising from impairment are
recognised in the Income Statement.
Loans whose original terms have been modified including
those subject to forbearance strategies are considered
rescheduled loans. If the renegotiations are on terms that are
not consistent with those readily available on the market,
this provides objective evidence of impairment and the loan
is assessed accordingly.
AN
NU
AL
RE
PO
RT
20
17
/1
8 S
EN
KA
DA
GA
LA
FIN
AN
CE
PL
CN
OT
ES
TO
TH
E F
INA
NC
IAL
ST
AT
EM
EN
TS
153
(d) Available-for-sale financial investments
Available-for-sale investments include equity and debt
securities. Equity investments classified as available-for-sale
are those which are neither classified as held-for-trading nor
designated at fair value through profit or loss. Debt securities
in this category are intended to be held for an indefinite
period of time and may be sold in response to needs for
liquidity or in response to changes in the market conditions.
Insignificant investments in security that do not have a
quoted market price in an active market and whose fair value
cannot be reliably measured are stated at cost.
Interest earned whilst holding available-for-sale financial
investments is reported as interest income using the EIR.
Dividends earned whilst holding available-for-sale financial
investments are recognised in the Income Statement as
“Other operating income” when the right to receive has been
established. The losses arising from impairment of such
investments are recognised in the Income Statement.
(e) Held-to-maturity financial investments
Held-to-maturity financial investments are non–derivative
financial assets with fixed or determinable payments and
fixed maturities, which the Group has the intention and
ability to hold to maturity. After initial measurement, held-to-
maturity financial investments are subsequently measured
at amortised cost using the EIR, less impairment. Amortised
cost is calculated by taking into account any discount or
premium on acquisition and fees that are an integral part of
the EIR. The amortisation is included in “Interest income” in
the Income Statement. The losses arising from impairment of
such investments are recognised in the Income Statement. If
the Group were to sell or reclassify more than an insignificant
amount of held to maturity investments before maturity
(other than in certain specific circumstances), the entire
category would be tainted and would have to be reclassified
as available for sale. Furthermore, the Group would be
prohibited from classifying any financial asset as held-to-
maturity during the following two years.
(iv) Classification and subsequent measurement of financial liabilities
At initial recognition financial liabilities are classified into one
of the following categories:
z At fair value through profit or loss
– Held-for-trading: or
– Designated at fair value through profit or loss.
z At amortised cost
Subsequent measurement depends on the financial liability
category.
(a) Financial liabilities at fair value through profit or loss
Financial liabilities acquired principally for the purpose of
selling or repurchasing in the near term or held as a part of
a portfolio that is managed for short-term profit or position
taking are classified as financial liabilities at fair value through
profit or loss.
Gains or losses on liabilities held at fair value through profit
or loss are recognised in the Income Statement.
The Group has not designated any financial liabilities upon
initial recognition as at fair value through profit or loss.
(b) Financial liabilities at amortised cost
Financial instruments issued by the Group that are not
designated at fair value through profit or loss, are classified
as liabilities under “due to banks”, “Other borrowings”,
“debt securities issued” and “subordinated debentures”
as appropriate, where the substance of the contractual
arrangement results in the Group having an obligation either
to deliver cash or another financial asset to the holder.
After initial recognition, debt issued and other borrowings
are subsequently measured at amortised cost using the
EIR. Amortised cost is calculated by taking into account any
discount or premium on the issue and costs that are an
integral part of the EIR.
SE
NK
AD
AG
AL
A F
INA
NC
E P
LC
AN
NU
AL
RE
PO
RT
20
17
/1
8N
OT
ES
TO
TH
E F
INA
NC
IAL
ST
AT
EM
EN
TS
154
(v) Reclassification of financial assets
Reclassifications are recorded at fair value at the date of
reclassification, which becomes the new amortised cost.
For a financial asset reclassified out of the “available-for-
sale” category, any previous gain or loss on that asset that
has been recognised in equity is amortised to profit or loss
over the remaining life of the investment using the EIR.
Any difference between the new amortised cost and the
expected cash flows is also amortised over the remaining
life of the asset using the EIR. If the asset is subsequently
determined to be impaired, then the amount recorded in
equity is recycled to the Income Statement.
The Group may reclassify a non–derivative trading asset out
of the “held-for-trading” category and into the “loans and
receivables” category if it meets the definition of loans and
receivables and the Group has the intention and ability to
hold the financial asset for the foreseeable future or until
maturity. If a financial asset is reclassified, and if the Group
subsequently increases its estimates of future cash receipts
as a result of increased recoverability of those cash receipts,
the effect of that increase is recognised as an adjustment to
the EIR from the date of the change in estimate.
Reclassification is at the election of management, and is
determined on an instrument by instrument basis. The Group
does not reclassify any financial instrument into the fair value
through profit or loss category after initial recognition.
3.4 Derecognition of financial assets and financial liabilities
(i) Financial assets
A financial asset (or, where applicable a part of a financial
asset or part of a group of similar financial assets) is
derecognised when:
z The rights to receive cash flows from the asset have
expired .
z The Group has transferred its rights to receive cash flows
from the asset or has assumed an obligation to pay
the received cash flows in full without material delay
to a third party under a “pass–through” arrangement;
and either:
z The Group has transferred substantially all the risks and
rewards of the asset; or
z The Group has neither transferred nor retained
substantially all the risks and rewards of the asset, but
has transferred control of the asset
(ii) Financial liabilities
A financial liability is derecognised when the obligation under
the liability is discharged or cancelled or expires.
Where an existing financial liability is replaced by another
from the same lender on substantially different terms, or the
terms of an existing liability are substantially modified, such
an exchange or modification is treated as a derecognition of
the original liability and the recognition of a new liability.
The difference between the carrying value of the original
financial liability and the consideration paid is recognised in
profit or loss.
3.5 Repurchase agreements
Securities purchased under agreements to resell at a
specified future date are not recognised in the Statement
of Financial Position. The consideration paid, including
accrued interest, is recorded in the Statement of Financial
Position, within “repurchase agreements”, reflecting the
transaction’s economic substance as a loan by the Group.
The difference between the purchase and resale prices is
recorded in “Interest income” and is accrued over the life of
the agreement using the EIR.
3.6 Impairment of financial assets
The Group assesses at each reporting date, whether there
is any objective evidence that a financial asset or a group of
financial assets is impaired. A financial asset or a group of
financial assets is deemed to be impaired if, and only if, there
is objective evidence of impairment as a result of one or
more events that have occurred after the initial recognition of
the asset (an “Incurred loss event”) and that loss event
(or events) has an impact on the estimated future cash flows
of the financial asset or the Group of financial assets that can
be reliably estimated.
AN
NU
AL
RE
PO
RT
20
17
/1
8 S
EN
KA
DA
GA
LA
FIN
AN
CE
PL
CN
OT
ES
TO
TH
E F
INA
NC
IAL
ST
AT
EM
EN
TS
155
(i) Loans and advances carried at amortised cost
Losses for impaired loans are recognised promptly when
there is objective evidence that impairment of a loan or
portfolio of loans has occurred. Impairment allowances are
calculated on individual loans and for groups of loans, this is
done collectively. Impairment losses are recorded as charges
to the Income Statement. The carrying amount of impaired
loans on the reporting date is reduced through the use of
impairment allowance accounts. Losses expected from future
events are not recognised.
Individually assessed lease, hire purchase, loans and advances
For all lease, hire purchase, loans and advances that are
considered individually significant, the Group assesses on a
case-by-case basis at each reporting date whether there is
any objective evidence that a loan is impaired. The criteria
used to determine that there is such objective evidence
include:
z known cash flow difficulties experienced by the borrower;
z past due contractual payments of either principal or
interest;
z breach of loan covenants or conditions;
z the probability that the borrower will enter bankruptcy or
other financial realisation; and or
z a significant downgrading in credit rating by an external
credit rating agency.
For those lease, hire purchases, loans and advances where
objective evidence of impairment exists, impairment losses
are determined considering the following factors:
z Group’s aggregate exposure to the customer;
z the viability of the customer’s business model and their
capacity to trade successfully out of financial difficulties
and generate sufficient cash flow to service debt
obligations;
z the amount and timing of expected receipts and
recoveries;
z the complexity of determining the aggregate amount and
ranking of all creditor claims and the extent to which legal
and insurance uncertainties are evident;
z the realisable value of security and likelihood of
successful repossession; and
z the likely deduction of any costs involved in recovery of
amounts outstanding.
Impairment losses are calculated by discounting the
expected future cash flows of a loan at its original effective
interest rate and comparing the resultant present value
with the loan’s current carrying amount. The impairment
allowances on individually significant accounts are reviewed
more regularly when circumstances require. This normally
encompasses reassessment of the enforceability of any
collateral held and the timing and amount of actual and
anticipated receipts. Individually assessed impairment
allowances are only released when there is reasonable
and objective evidence of a reduction in the established
loss estimate.
Collectively assessed lease, hire purchase, loans and advances
Impairment is assessed on a collective basis in two
circumstances:
z known cash flow difficulties experienced by the borrower;
to cover losses which have been incurred but have not
yet been identified on lease, hire purchase, loans and
advances subject to individual assessment; and
z For homogeneous groups of lease, hire purchase, loans
and advances that are not considered individually
significant.
Incurred but not yet identified impairment
Individually assessed lease, hire purchase, loans and
advances for which no evidence of loss has been specifically
identified on an individual basis are grouped together
according to their credit risk characteristics for the purpose
of calculating an estimated collective loss. This reflects
impairment losses that the Group has incurred as a result
of events occurring before the reporting date, which the
Group is not able to identify on an individual loan basis, and
that can be reliably estimated. These losses will only be
individually identified in the future.

SE
NK
AD
AG
AL
A F
INA
NC
E P
LC
AN
NU
AL
RE
PO
RT
20
17
/1
8N
OT
ES
TO
TH
E F
INA
NC
IAL
ST
AT
EM
EN
TS
156
As soon as information becomes available which identifies
losses on individual loans within the Group, those loans are
removed from the Group and assessed on an individual basis
for impairment.
The collective impairment allowance is determined after
taking into account:
z Historical loss experience in portfolios of similar credit
risk; and
z Management’s experienced judgment as to whether
current economic and credit conditions are such that
the actual level of inherent losses at the balance sheet
date is likely to be greater or less than that suggested by
historical experience.
Homogeneous groups of lease, hire purchase, loans and advances
Statistical methods are used to determine impairment losses
on a collective basis for homogeneous groups of loans.
Losses in these groups of loans are recorded on an individual
basis when individual loans are written off, at which point
they are removed from the Group.
Write-off of loans and advances
Loans (and the related impairment allowance accounts) are
normally written off, either partially or in full, when there is
no realistic prospect of recovery. Where loans are secured,
this is generally after receipt of any proceeds from the
realisation of security.
Reversals of impairment
If the amount of an impairment loss decreases in a
subsequent period, and the decrease can be related
objectively to an event occurring after the impairment was
recognised, the excess is written back by reducing the loan
impairment allowance account accordingly. The write-back is
recognised in the Income Statement.
(ii) Available-for-sale financial investments
For available-for-sale financial investments, the Group
assesses at each reporting date whether there is objective
evidence that an investment is impaired.
In the case of debt instruments classified as available-
for-sale, the Group assesses individually whether there is
objective evidence of impairment based on the same criteria
as financial assets carried at amortised cost. However, the
amount recorded for impairment is the cumulative loss
measured as the difference between the amortised cost
and the current fair value, less any impairment loss on that
investment previously recognised in the Income Statement.
Future interest income is based on the reduced carrying
amount and is accrued using the rate of interest used to
discount the future cash flows for the purpose of measuring
the impairment loss.
3.7 Recognition of income and expenses
Revenue is recognised to the extent that it is probable that
the economic benefits will flow to the Group and the revenue
can be reliably measured. The following specific recognition
criteria must also be met before revenue is recognised.
(i) Interest and similar income and expense
For all financial instruments measured at amortised cost,
interest bearing financial assets classified as available-for-sale
and financial instruments designated at fair value through
profit or loss, interest income or expense is recorded using
the EIR. EIR is the rate that exactly discounts estimated future
cash payments or receipts through the expected life of the
financial instrument or a shorter period, where appropriate,
to the net carrying amount of the financial asset or financial
liability. The calculation takes into account all contractual
terms of the financial instrument (for example, prepayment
options) and includes any fees or incremental costs that are
directly attributable to the instrument and are an integral part
of the EIR, but not future credit losses.
The carrying amount of the financial asset or financial liability
is adjusted if the Group revises its estimates of payments or
receipts. The adjusted carrying amount is calculated based
on the original EIR and the change in carrying amount is
recorded as “Interest income” for financial assets and ’Interest
expense’ for financial liabilities.
Once the recorded value of a financial asset or a group
of similar financial assets has been reduced due to an
impairment loss, interest income continues to be recognised

AN
NU
AL
RE
PO
RT
20
17
/1
8 S
EN
KA
DA
GA
LA
FIN
AN
CE
PL
CN
OT
ES
TO
TH
E F
INA
NC
IAL
ST
AT
EM
EN
TS
157
using the rate of interest used to discount the future cash
flows for the purpose of measuring the impairment loss.
(a) Lease
In accordance with Sri Lanka Accounting Standard
LKAS 17 – “Leases”, recognition of finance income on leasing
is accounted based on a pattern reflecting a constant periodic
rate of return on capital outstanding. The excess of aggregate
rentals receivable over the cost of leased assets constitutes
the total unearned interest income at the commencement of
the contract. The Group recognises the interest income from
unearned income on the lease on an accrual basis over the
term of the lease in proportion to the remaining balance of
the lease.
(b) Hire purchase
Recognition of interest income from hire purchase facilities
is similar to that of leases, which recognises interest income
based on a pattern reflecting a constant rate of return on
capital outstanding.
(c) Commercial loans and other loans and advances
Recognition of interest income from loans and advances is
similar to that of leases, which recognises interest income
based on a pattern reflecting a constant rate of return on the
capital outstanding.
(d) Pawning (Gold Loans)
Interest on Pawning (gold loans) are recognised on an accrual
basis over a maximum period of 12 months.
(ii) Fee and commission income
The Group earns fee and commission income from a diverse
range of services it provides to its customers.
Fee income earned from services that are provided over a certain period of time
Fees earned for the provision of services are not integral
part of main source. These incomes are collected from
the customers for reimbursement of expenses. These fees
include commission income and finance charge, legal
fees, valuation and document charges and are recognised
when earned.
(iii) Dividend income
Dividend income is recognised when the Group’s right to
receive the payment is established.
(iv) Net gain from trading
Results arising from trading activities include all gains and
losses from sale of financial assets and financial liabilities
“held-for-trading”.
3.8 Cash and cash equivalents
Cash and cash equivalents as referred to in the Statement
of Cash Flow comprises cash on hand, non–restricted current
accounts and balances on demand with an original maturity
of three months or less.
3.9 Business combinations and goodwill
Business combinations are accounted for using the purchase
method of accounting. This involves recognising identifiable
assets (including previously unrecognised intangible assets)
and liabilities (including contingent liabilities but excluding
future restructuring) of the acquired business at fair value.
Any excess of the cost of acquisition over the fair values of
the identifiable net assets acquired is recognised as goodwill.
If the cost of acquisition is less than the fair values of the
identifiable net assets acquired, the discount on acquisition
is recognised directly in the Income Statement in the year of
acquisition.
Goodwill acquired in a business combination is initially
measured at cost, being the excess of the cost of the
business combination over the Company’s interest in the net
fair value of the identifiable assets, liabilities and contingent
liabilities acquired.
Following initial recognition, goodwill is measured at cost less
any accumulated impairment losses. Goodwill is reviewed
for impairment annually, or more frequently, if events or

SE
NK
AD
AG
AL
A F
INA
NC
E P
LC
AN
NU
AL
RE
PO
RT
20
17
/1
8N
OT
ES
TO
TH
E F
INA
NC
IAL
ST
AT
EM
EN
TS
158
changes in circumstances indicate that the carrying value
may be impaired. For the purpose of impairment testing,
goodwill acquired in a business combination is, from the
acquisition date, allocated to each of the Company’s cash–
generating units (CGUs) or group of CGUs, which are expected
to benefit from the synergies of the combination, irrespective
of whether other assets or liabilities of the acquiree are
assigned to those units. Each unit to which the goodwill is
allocated represents the lowest level within the Company at
which the goodwill is monitored for internal management
purposes, and is not larger than an operating segment in
accordance with Sri Lanka Accounting Standard (SLFRS 8)
Operating Segments.
Where goodwill forms part of a CGU (or group of CGUs)
and part of the operation within that unit is disposed of,
the goodwill associated with the operation disposed of
is included in the carrying amount of the operation when
determining the gain or loss on disposal of the operation.
Goodwill disposed of in this circumstance is measured based
on the relative values of the operation disposed of and the
portion of the CGU retained.
When subsidiaries are sold, the difference between the
selling price and the net assets plus cumulative translation
differences and goodwill is recognised in the Income
Statement.
3.10 Property, plant and equipment
Property and equipment is stated at cost excluding the costs
of day–to–day servicing, less accumulated depreciation and
accumulated impairment in value. Changes in the expected
useful life are accounted for by changing the depreciation
period or method, as appropriate, and treated as changes in
accounting estimates.
Depreciation is calculated using the straight–line method to
write down the cost of property, plant and equipment to their
residual values over their estimated useful lives. Land is not
depreciated.
The depreciation rates and estimated useful lives of the
different types of assets are as follows:
Class of asset % per annum Useful life
Buildings 5 20 years
Office equipment 10 10 years
Computers and other equipment 25 4 years
Furniture, fixtures and fittings 10 10 years
Motor vehicles 16.67 6 years
Generators 12.5 8 years
Property plant and equipment is derecognised on disposal
or when no future economic benefits are expected from its
use. Any gain or loss arising on derecognition of the asset
(calculated as the difference between the net disposal
proceeds and the carrying amount of the asset) is recognised
in “Other operating income” in the Income Statement in the
year the asset is derecognised.
3.11 Intangible assets
The Group’s other intangible assets include the value of
computer software and License. An intangible asset is
recognised only when its cost can be measured reliably and
it is probable that the expected future economic benefits that
are attributable to it will flow to the Group.
Intangible assets acquired separately are measured on initial
recognition at cost. The cost of intangible assets acquired in
a business combination is their fair value as at the date of
acquisition. Following initial recognition, intangible assets are
carried at cost less any accumulated amortisation and any
accumulated impairment losses.
Amortisation is calculated using the straight–line method
to write down the cost of intangible assets to their residual
values over their estimated useful lives as follows:
The Class of intangible assets Useful life Amortisation method
Computer Software 8.34 Years Straight line method
AN
NU
AL
RE
PO
RT
20
17
/1
8 S
EN
KA
DA
GA
LA
FIN
AN
CE
PL
CN
OT
ES
TO
TH
E F
INA
NC
IAL
ST
AT
EM
EN
TS
159
Intangible assets with indefinite useful lives are not
amortised, but are tested for impairment annually,
either individually or at the cash-generating unit level.
The assessment of indefinite life is reviewed annually
to determine whether the indefinite life continues to be
supportable. If not, the change in useful life from indefinite
to finite is made on a prospective basis.
3.12 Investment property
Property held to earn rental income and property held for
capital appreciation have been classified as investment
property. Investment property are initially recognised at
cost. Subsequent to the initial recognition, the investment
properties are accounted using cost model.
Depreciation is calculated using the straight–line method
to write down the cost of property to their residual values
over their estimated useful lives. Land is not depreciated.
Buildings are estimated to have a useful life of 20 years, the
depreciation rate adopted is 5% per annum.
3.13 Impairment of non–financial assets
The Group assesses at each reporting date whether there is
an indication that an asset may be impaired. If any indication
exists, or when annual impairment testing for an asset is
required, the Company estimates the asset’s recoverable
amount. An asset’s recoverable amount is the higher of an
asset’s or CGU’s fair value less costs to sell and its value in
use. Where the carrying amount of an asset or CGU exceeds
its recoverable amount, the asset is considered impaired and
is written down to its recoverable amount. In assessing value
in use, the estimated future cash flows are discounted to
their present value using a pre–tax discount rate that reflects
current market assessments of the time value of money and
the risks specific to the asset. In determining fair value less
costs to sell, an appropriate valuation model is used. These
calculations are corroborated by valuation multiples, quoted
share prices for publicly traded subsidiary or other available
fair value indicators.
For assets excluding goodwill, an assessment is made at
each reporting date as to whether there is any indication
that previously recognised impairment losses may no longer
exist or may have decreased. If such indication exists, the
Group estimates the asset’s or CGU’s recoverable amount.
A previously recognised impairment loss is reversed only
if there has been a change in the assumptions used to
determine the asset’s recoverable amount since the last
impairment loss was recognised. The reversal is limited
so that the carrying amount of the asset does not exceed
its recoverable amount, nor exceeds the carrying amount
that would have been determined, net of depreciation, had
no impairment loss been recognised for the asset in prior
years. Such reversal is recognised in the Income Statement.
Impairment losses relating to goodwill are not reversed in
future periods.
3.14 Employee benefits
(i) Defined benefit plan
The cost of providing benefits under the defined benefit
plan is determined separately using the Projected Unit Credit
method. This method involves estimating the amount of
future benefit that employees have earned in return for
their service in the current and prior periods. That benefit is
discounted to determine its present value.
The past service cost is recognised as an expense on a
straight line basis over the period until the benefits become
vested. If the benefits are already vested following the
introduction of, or changes to, a defined benefit plan, past
service cost is recognised immediately.
The latest actuarial valuation was carried out as at
31 March 2018, by Piyal S. Gunatilleke F.S.A. (USA), a Fellow
of the Society of Actuaries (USA), Member of the American
Academy of Actuaries, Consulting Actuary.
The principal financial assumptions used in the valuation are;
Interest/Discount rate 10.5% p.a.
Basic salary increase for all grades 7.5% p.a.
Retirement age 55 years
The actuarial gain or losses are recognised in the income
statement in the year in which they arise.
SE
NK
AD
AG
AL
A F
INA
NC
E P
LC
AN
NU
AL
RE
PO
RT
20
17
/1
8N
OT
ES
TO
TH
E F
INA
NC
IAL
ST
AT
EM
EN
TS
160
Funding arrangement
The gratuity liabilities are not externally funded.
Gratuity payments are made by the Group according to
the Payment of Gratuity Act No. 12 of 1983. Accordingly
the Group is liable to pay gratuity to employees who have
completed a minimum of five year service in the Group at
the rate of 50% of the last drawn salary for each completed
year of service.
(ii) Defined contribution plan
The Group contributes to the following Schemes:
Employees’ Provident Fund
The Group and employees contribute 12% and 8%
respectively of the employee’s monthly gross salary
(excluding overtime) to the Employees’ Provident Fund
managed by the Central Bank of Sri Lanka.
Employees’ Trust Fund
The Group contributes 3% of the employee’s monthly gross
salary excluding overtime to the Employees’ Trust Fund
maintained by the Employees Trust Fund Board of the Central
Bank of Sri Lanka.
3.15 Provisions
Provisions are recognised when the Group has a present
obligation (legal or constructive) as a result of a past event,
and it is probable that an outflow of resources embodying
economic benefits will be required to settle the obligation
and a reliable estimate can be made of the amount of the
obligation. The expense relating to any provision is presented
in the Income Statement net of any reimbursement.
3.16 Taxes
(i) Current taxation
Current tax assets and liabilities consists of amounts expected
to be recovered from or paid to the Commissioner General
of Inland Revenue in respect of the current as well as prior
years. The tax rates and tax laws used to compute the
amount are those that are enacted or substantially enacted
by the reporting date. Accordingly, provision for taxation is
made on the basis of the profit for the year as adjusted for
taxation purpose in accordance with the provision of the
Inland Revenue Act No. 10 of 2006 and the amendment
thereto, at the rates specified in the Financial Statements.
(ii) Deferred taxation
Deferred tax is provided using the liability method on
temporary differences at the reporting date between the
tax bases of assets and liabilities and their carrying amounts
for financial reporting purpose. Deferred tax liabilities are
recognised for all temporary differences.
Deferred tax assets are recognised for all deductible
differences. Carry forward of unused tax credits and unused
tax losses, to the extent that it is probable that taxable profits
will be available against which the deductible temporary
differences and the carry forward of unused tax credits and
unused tax losses can be utilised.
The carrying amount of a deferred tax asset is reviewed
at each reporting date and reduced to the extent it is no
longer probable that sufficient taxable profit will be available
to allow all or part of the deferred tax asset to be utilised.
Unrecognised deferred tax asset are reassessed at each
reporting date and are recognised to the extent that is
probable that future taxable profit will allow the deferred tax
asset to be recovered.
Deferred tax assets and liabilities are measured at the tax
rate that are expected to apply in the year when the assets
are realised or the liabilities are settled, based on tax rates
and tax laws that have been enacted or substantially enacted
at the reporting date.
(iii) Value added tax on financial services
Company’s total value addition is subject to a 15% Value
Added Tax as per Section 25 A of the Value Added Tax Act
No. 14 of 2002 and amendments thereto.
(iv) Nation building tax on financial services
With effect from 1 January 2014, NBT of 2% was introduced
on supply of financial services via an amendment to the NBT
Act No. 09 of 2009. NBT is chargeable on the same base
used for calculation of VAT on Financial services.
AN
NU
AL
RE
PO
RT
20
17
/1
8 S
EN
KA
DA
GA
LA
FIN
AN
CE
PL
CN
OT
ES
TO
TH
E F
INA
NC
IAL
ST
AT
EM
EN
TS
161
(v) Crop insurance levy
As per the provisions of the Section 14 of the Finance Act
No. 12 of 2013, the Crop Insurance Levy was introduced with
effect from 1st April 2013 and is payable to the National
Insurance Trust Fund. Currently, the Crop Insurance Levy is
payable at 1% of the profit after tax.
(vi) Withholding tax on dividends distributed by the Company
Withholding tax that arises from the distribution of dividends
by the Company is recognised at the time the liability to pay
the related dividend is recognised.
3.17 Deposit Insurance Scheme
As per the Direction No. 01 of 2010, Sri Lanka Deposit
Insurance Scheme, which was effected from 1 October
2010 all licensed finance companies are required to pay
an insurance premium calculated at the rate of 0.15% per
annum payable monthly for all eligible deposits as at the end
of the month. Eligible deposits includes all the time deposits
held by Senkadagala Finance PLC except for;
z Deposit liabilities to member institutions
z Deposit liabilities to the Government of Sri Lanka inclusive
of Ministers, Departments and Local Governments.
z Deposit liabilities to Directors, Key Management
personnel and other related parties as defined by the
Finance Companies (Corporate Governance) Direction
No. 3 of 2008.
z Deposit liabilities held as collateral against any
accommodation granted.
z Deposits falling within the meaning of abandoned
property in terms of the Finance Companies Act, Funds
which have been transferred to the Central Bank of
Sri Lanka in terms of the relevant directions issued by the
Monetary Board.
3.18 Segment reporting
A segment is a distinguishable component of the Group that
is engaged in providing services (Business Segment).
In accordance with Sri Lanka Financial Reporting Standard
SLFRS 8 – Operating Segments, segmental information is
presented in respect of the Group. The segments comprise
of financing and investing segments. Segment results,
assets and liabilities include those items directly attributable
to a segment as well as those that can be allocated on a
reasonable basis. Unallocated items comprises mainly of
head office expenses.
Segment capital expenditure is the total cost incurred during
the period to acquire segment assets that are expected to be
used for more than one accounting period.
3.19 Events after the reporting date
Events after the reporting date are those events, favourable
and unfavourable, that occur between the reporting date
and the date when the financial statements are authorised
for issue.
In this regard, all material and important events that
occurred after the reporting date have been considered
and appropriate disclosures are made in Note 47
where necessary.
3.20 Earnings per share
The Group presents basic earnings per share (EPS) data for its
ordinary shares. Basic EPS is calculated by dividing the profit
attributable to ordinary shareholders of the Company by the
weighted average number of ordinary shares outstanding
during the period. The details of the earnings per share are
given in Note No. 17.
3.21 Maturity analysis
The Company has disclosed an analysis of assets and
liabilities into relevant maturity baskets based on the
remaining period as at the reporting date to the contractual
maturity date.
3.22 Cash Flow Statement
The Cash Flow Statement has been prepared using the “Direct
Method” of preparing Cash Flows in accordance with the
Sri Lanka Accounting Standard (LKAS) – 7 on “Statement of
Cash Flows”. Cash and cash equivalents comprise short-term,
highly liquid investments that are readily convertible to
known amounts of cash and are subject to an insignificant
risk of changes in value.

SE
NK
AD
AG
AL
A F
INA
NC
E P
LC
AN
NU
AL
RE
PO
RT
20
17
/1
8N
OT
ES
TO
TH
E F
INA
NC
IAL
ST
AT
EM
EN
TS
162
The cash and cash equivalent include cash in hand, balances
with banks, placements with banks, money at call and short
notice and money market funds.
3.23 Commitments and Contingencies
Contingent liabilities are possible obligations whose existence
will be confirmed only by uncertain future events or present
obligations where the transfer of economic benefit is
not probable or cannot be reliably measured. Contingent
Liabilities are not recognised in the Statement of Financial
Position but are disclosed unless its occurrence is remote.
All discernible risks are accounted for in determining the
amount of all known liabilities. The Company’s share of any
contingencies and capital commitments of a subsidiary for
which the Company is also liable severally or otherwise are
also included with appropriate disclosures.
3.24 New accounting standards issued but not yet effective
A number of new standards and amendments to standards
which have been issued but not yet effective as at the
reporting date have not been applied in preparing these
consolidated Financial Statements. Accordingly, the following
Accounting Standards have not been applied in preparing
these financial Statements and the Group plans to apply
these standards on the respective effective dates.
Accounting standard Summary of the requirements Possible impact on Consolidated Financial Statements
SLFRS 9 – “Financial
Instruments”
SLFRS 9, issued in 2014 which replaces the
existing guidance in LKAS 39 – “Financial
Instruments: Recognition and Measurement” is
effective for annual reporting periods beginning
on or after January 1, 2018. The key aspects of
SLFRS 9 are;
SLFRS 9 is applicable to the group with effect
from 1 April 2018
The most significant impact on the Finance
Company’s financial statements from the
implementation of SLFRS 9 is expected to
result from the new impairment requirements.
Impairment losses will increase and become more
volatile for financial instruments within the scope
of SLFRS 9.
The Company has started the initial high level
assessment of the potential impact on its Financial
Statements for the year ended 31 March 2018,
resulting from the application of SLFRS 9 with the
assistance of an external consultant. The impact
of the implementation of the standard is yet to be
finalised.
The Group does not expect significant impact on
the Consolidated Financial Statements resulting
from the application of SLFRS 9 on the other
Group entities.
1. Classification – Financial assets
SLFRS 9 contains a new classification and
measurement approach for financial assets that
reflects the business model in which assets are
managed and their cash flow characteristics.
SLFRS 9 includes three principal classification
categories for financial assets – i.e. measured
at amortised cost, fair value through other
comprehensive income (FVOCI) and fair value
through profit or loss (FVTPL). It eliminates the
existing LKAS 39 categories of Held to maturity,
Loans and receivables and Available for sale.
2. Impairment – Financial assets,
loan commitments and financial guarantee
contracts
SLFRS 9 replaces the “Incurred Loss Model” in
LKAS 39 with forward looking “Expected Loss
Model” (ECL). This will require considerable
judgement over how changes in economic
factors affect ECL, which will be determined on a
probability weighted basis.
AN
NU
AL
RE
PO
RT
20
17
/1
8 S
EN
KA
DA
GA
LA
FIN
AN
CE
PL
CN
OT
ES
TO
TH
E F
INA
NC
IAL
ST
AT
EM
EN
TS
163
Accounting standard Summary of the requirements Possible impact on Consolidated Financial Statements
SLFRS 9 requires loan loss to be recognised at an
amount equal to either 12 month ECL or life time
ECL. Lifetime ECLs are the ECLs that result from
possible default events over the expected life
of a financial instrument, whereas 12 months
ECLs are the portion of the ECLs that results
from default events that are possible within 12
months after the Reporting date.
3. Inputs into measurement of ECLs
The key inputs into measurement of ECLs are
likely to be the term structures of the following
variables which will be derived from internally
developed statistical models and other historical
data that leverage regulatory models. They
will be adjusted to reflect forward looking
information.
z Probability of Default (PD) are estimates at a
certain date which will be calculated based
on statistical models and assessed using
rating tools tailored to the various categories
of counterparties and exposures.
z Loss Given Default (LGD) is the magnitude
to the likely loss if there is default. The
Company estimates LGD parameters based
on history of recovery rates of claims against
defaulted counter parties.
z Exposure at Default (EAD) represents the
expected exposure in the event of a default.
The Company will derive the EAD from the
current exposure to the counterparty and
potential chances to the current amount
allowed under the contract.
SLFRS 15 –
“Revenue from
Contracts with
Customers”
SLFRS 15 establishes a comprehensive
framework for determining whether, how much
and when revenue is recognised. Entities will
apply five-step model to determine when to
recognise revenue and at what amount. The
model specified that revenue is recognised
when or as an entity transfers control of goods
and services to a customer at the amount to
which the entity expects to be entitled.
The Group and the Company do not expect
significant impact on its Financial Statements
resulting from the application of SLFRS 15.
SE
NK
AD
AG
AL
A F
INA
NC
E P
LC
AN
NU
AL
RE
PO
RT
20
17
/1
8N
OT
ES
TO
TH
E F
INA
NC
IAL
ST
AT
EM
EN
TS
164
Accounting standard Summary of the requirements Possible impact on Consolidated Financial Statements
SLFRS 15 replaces existing revenue recognition
guidance, including LKAS 18 on “Revenue” and
LKAS 11 on “Construction Contracts” and IFRIC 13
on “Customer Loyalty Programmes”.
SLFRS 15 is effective for annual reporting periods
beginning on or after 1 January 2018.
SLFRS 16 - “Leases” SLFRS 16 eliminates the current dual accounting
model for lessees which distinguishes between
On-Balance sheet finance leases and Off-
Balance Sheet operating leases. Instead there
will be a single On-Balance Sheet accounting
model that is similar to current finance lease
accounting.
SLFRS 16 is effective for annual reporting periods
beginning on or after 1 January 2019
The Group and the Company do not expect
significant impact on its Financial Statements
resulting from the application of SLFRS 16.

AN
NU
AL
RE
PO
RT
20
17
/1
8 S
EN
KA
DA
GA
LA
FIN
AN
CE
PL
CN
OT
ES
TO
TH
E F
INA
NC
IAL
ST
AT
EM
EN
TS
165
Company Group
For the year ended 31 March 2018 2017 2018 2017
Note Rs. Rs. Rs. Rs.
4. Interest Income
Cash and short-term funds 22,702,413 21,582,089 24,752,846 23,416,122
Fixed deposits 136,406,643 119,412,266 136,406,643 119,412,266
Repurchase agreements 4.1 85,313,932 63,068,093 85,313,932 63,068,093
Finance leases 4,320,975,353 3,205,692,967 4,320,975,353 3,205,692,967
Hire purchases 85,437,826 295,474,350 85,437,826 295,474,350
Personal loans 34,253,065 30,802,098 34,253,065 30,802,098
Commercial loans 601,710,389 252,611,261 601,710,389 252,611,261
Pawning advances 176,624,867 76,331,490 176,624,867 76,331,490
Fixed deposit loans 12,619,217 7,833,230 12,619,217 7,833,230
Financial assets – Held-to-maturity 4.1 99,981,236 88,819,320 99,981,236 88,819,320
Interest on delayed insurance premium 97,783,891 65,524,825 97,783,891 65,524,825
Interest on overdue rentals 798,305,700 598,560,457 798,305,700 598,560,457
6,472,114,532 4,825,712,446 6,474,164,965 4,827,546,479
4.1 Notional tax credit for withholding tax on Government Securities on secondary market transactions
Section 137 of the Inland Revenue Act No. 10 of 2006 provides that a company which derives interest income from the
secondary market transactions in Government Securities would be entitled to a notional tax credit (being one-ninth of net
interest income), provided such interest income forms part of the statutory income of the Company for that year of assessment.
Accordingly, the net interest earned by the Company from the secondary market transactions in Government Securities have
been grossed up in the Financial Statements, with the resulting notional tax credit amounting to Rs.18,529,517/-
(2017 – Rs.15,188,741/-).
Company Group
For the year ended 31 March 2018 2017 2018 2017
Rs. Rs. Rs. Rs.
5. Interest Expense
Due to banks 834,712,421 679,690,561 834,712,421 679,690,561
Deposits from customers 1,025,678,889 730,786,636 1,021,084,668 727,660,543
Securitisations 719,264,934 303,723,961 719,264,934 303,723,961
Commercial paper 219,284,279 122,528,969 219,284,279 122,528,969
Debt securities issued 423,757,564 378,190,536 423,757,564 378,190,536
Subordinated liabilities 187,365,594 187,383,992 187,365,594 187,383,992
3,410,063,681 2,402,304,655 3,405,469,460 2,399,178,562
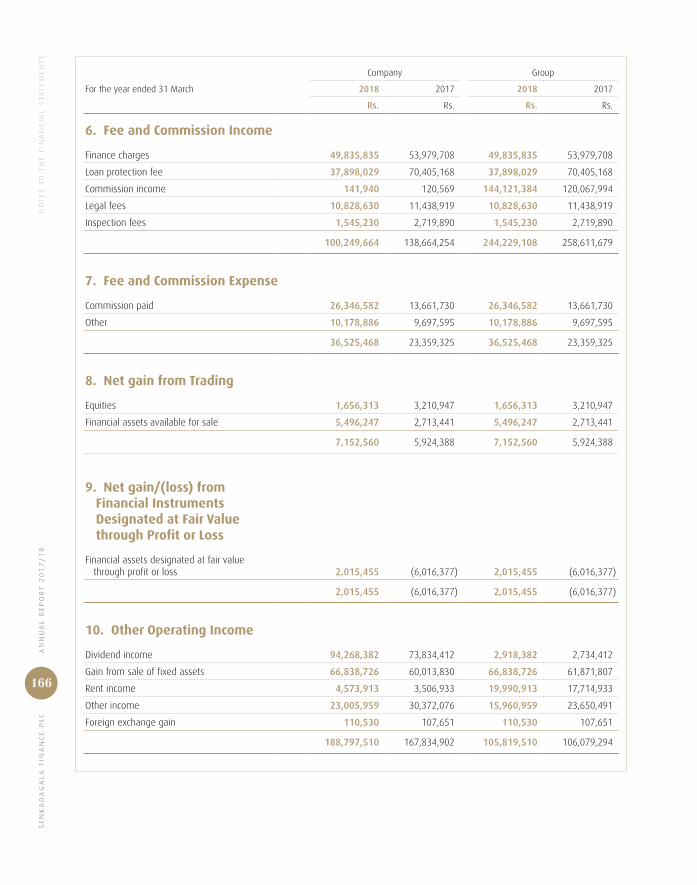
SE
NK
AD
AG
AL
A F
INA
NC
E P
LC
AN
NU
AL
RE
PO
RT
20
17
/1
8N
OT
ES
TO
TH
E F
INA
NC
IAL
ST
AT
EM
EN
TS
166
Company Group
For the year ended 31 March 2018 2017 2018 2017
Rs. Rs. Rs. Rs.
6. Fee and Commission Income
Finance charges 49,835,835 53,979,708 49,835,835 53,979,708
Loan protection fee 37,898,029 70,405,168 37,898,029 70,405,168
Commission income 141,940 120,569 144,121,384 120,067,994
Legal fees 10,828,630 11,438,919 10,828,630 11,438,919
Inspection fees 1,545,230 2,719,890 1,545,230 2,719,890
100,249,664 138,664,254 244,229,108 258,611,679
7. Fee and Commission Expense
Commission paid 26,346,582 13,661,730 26,346,582 13,661,730
Other 10,178,886 9,697,595 10,178,886 9,697,595
36,525,468 23,359,325 36,525,468 23,359,325
8. Net gain from Trading
Equities 1,656,313 3,210,947 1,656,313 3,210,947
Financial assets available for sale 5,496,247 2,713,441 5,496,247 2,713,441
7,152,560 5,924,388 7,152,560 5,924,388
9. Net gain/(loss) from Financial Instruments Designated at Fair Value through Profit or Loss
Financial assets designated at fair value through profit or loss 2,015,455 (6,016,377) 2,015,455 (6,016,377)
2,015,455 (6,016,377) 2,015,455 (6,016,377)
10. Other Operating Income
Dividend income 94,268,382 73,834,412 2,918,382 2,734,412
Gain from sale of fixed assets 66,838,726 60,013,830 66,838,726 61,871,807
Rent income 4,573,913 3,506,933 19,990,913 17,714,933
Other income 23,005,959 30,372,076 15,960,959 23,650,491
Foreign exchange gain 110,530 107,651 110,530 107,651
188,797,510 167,834,902 105,819,510 106,079,294
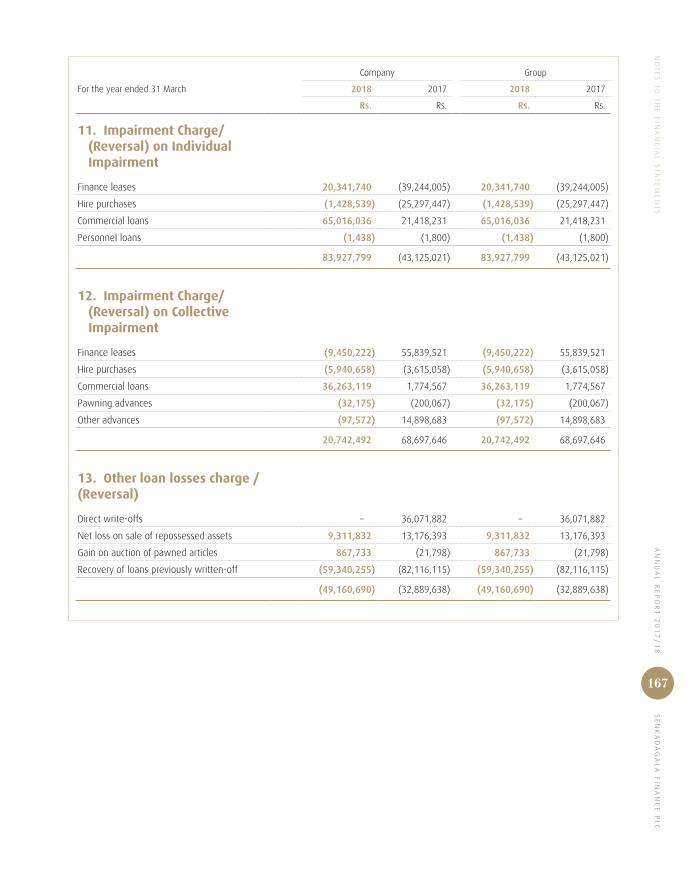
AN
NU
AL
RE
PO
RT
20
17
/1
8 S
EN
KA
DA
GA
LA
FIN
AN
CE
PL
CN
OT
ES
TO
TH
E F
INA
NC
IAL
ST
AT
EM
EN
TS
167
Company Group
For the year ended 31 March 2018 2017 2018 2017
Rs. Rs. Rs. Rs.
11. Impairment Charge/ (Reversal) on Individual Impairment
Finance leases 20,341,740 (39,244,005) 20,341,740 (39,244,005)
Hire purchases (1,428,539) (25,297,447) (1,428,539) (25,297,447)
Commercial loans 65,016,036 21,418,231 65,016,036 21,418,231
Personnel loans (1,438) (1,800) (1,438) (1,800)
83,927,799 (43,125,021) 83,927,799 (43,125,021)
12. Impairment Charge/ (Reversal) on Collective Impairment
Finance leases (9,450,222) 55,839,521 (9,450,222) 55,839,521
Hire purchases (5,940,658) (3,615,058) (5,940,658) (3,615,058)
Commercial loans 36,263,119 1,774,567 36,263,119 1,774,567
Pawning advances (32,175) (200,067) (32,175) (200,067)
Other advances (97,572) 14,898,683 (97,572) 14,898,683
20,742,492 68,697,646 20,742,492 68,697,646
13. Other loan losses charge / (Reversal)
Direct write-offs – 36,071,882 – 36,071,882
Net loss on sale of repossessed assets 9,311,832 13,176,393 9,311,832 13,176,393
Gain on auction of pawned articles 867,733 (21,798) 867,733 (21,798)
Recovery of loans previously written-off (59,340,255) (82,116,115) (59,340,255) (82,116,115)
(49,160,690) (32,889,638) (49,160,690) (32,889,638)
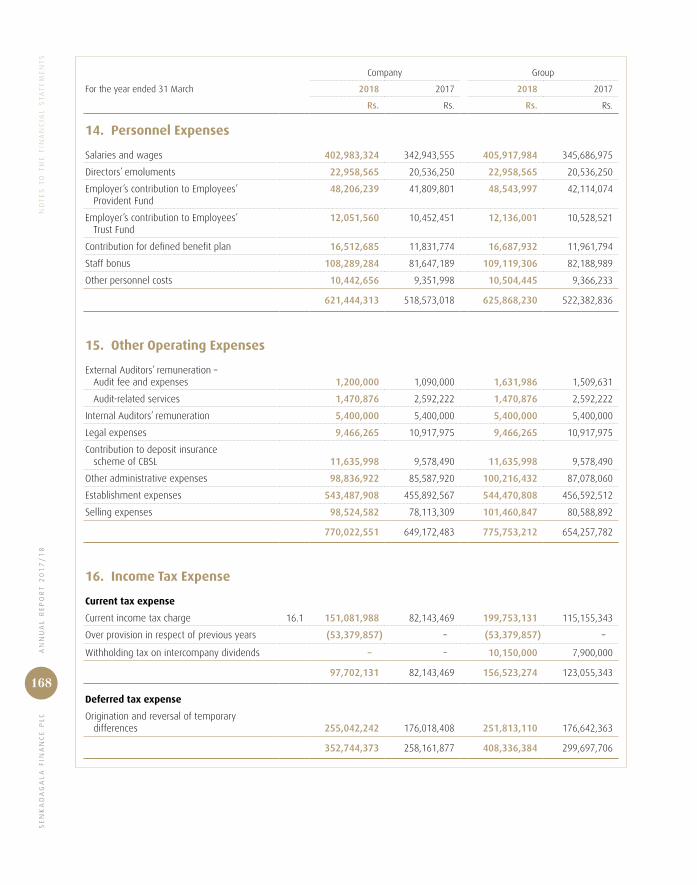
SE
NK
AD
AG
AL
A F
INA
NC
E P
LC
AN
NU
AL
RE
PO
RT
20
17
/1
8N
OT
ES
TO
TH
E F
INA
NC
IAL
ST
AT
EM
EN
TS
168
Company Group
For the year ended 31 March 2018 2017 2018 2017
Rs. Rs. Rs. Rs.
14. Personnel Expenses
Salaries and wages 402,983,324 342,943,555 405,917,984 345,686,975
Directors’ emoluments 22,958,565 20,536,250 22,958,565 20,536,250
Employer’s contribution to Employees’ Provident Fund
48,206,239 41,809,801 48,543,997 42,114,074
Employer’s contribution to Employees’ Trust Fund
12,051,560 10,452,451 12,136,001 10,528,521
Contribution for defined benefit plan 16,512,685 11,831,774 16,687,932 11,961,794
Staff bonus 108,289,284 81,647,189 109,119,306 82,188,989
Other personnel costs 10,442,656 9,351,998 10,504,445 9,366,233
621,444,313 518,573,018 625,868,230 522,382,836
15. Other Operating Expenses
External Auditors’ remuneration – Audit fee and expenses 1,200,000 1,090,000 1,631,986 1,509,631
Audit-related services 1,470,876 2,592,222 1,470,876 2,592,222
Internal Auditors’ remuneration 5,400,000 5,400,000 5,400,000 5,400,000
Legal expenses 9,466,265 10,917,975 9,466,265 10,917,975
Contribution to deposit insurance scheme of CBSL 11,635,998 9,578,490 11,635,998 9,578,490
Other administrative expenses 98,836,922 85,587,920 100,216,432 87,078,060
Establishment expenses 543,487,908 455,892,567 544,470,808 456,592,512
Selling expenses 98,524,582 78,113,309 101,460,847 80,588,892
770,022,551 649,172,483 775,753,212 654,257,782
16. Income Tax Expense
Current tax expense
Current income tax charge 16.1 151,081,988 82,143,469 199,753,131 115,155,343
Over provision in respect of previous years (53,379,857) – (53,379,857) –
Withholding tax on intercompany dividends – – 10,150,000 7,900,000
97,702,131 82,143,469 156,523,274 123,055,343
Deferred tax expense
Origination and reversal of temporary differences 255,042,242 176,018,408 251,813,110 176,642,363
352,744,373 258,161,877 408,336,384 299,697,706
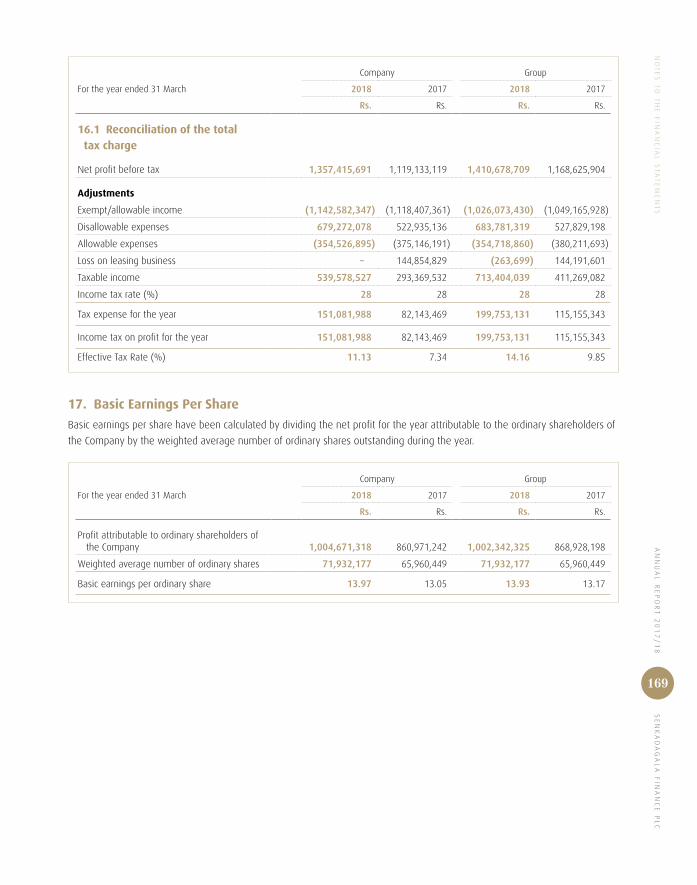
AN
NU
AL
RE
PO
RT
20
17
/1
8 S
EN
KA
DA
GA
LA
FIN
AN
CE
PL
CN
OT
ES
TO
TH
E F
INA
NC
IAL
ST
AT
EM
EN
TS
169
Company Group
For the year ended 31 March 2018 2017 2018 2017
Rs. Rs. Rs. Rs.
16.1 Reconciliation of the total tax charge
Net profit before tax 1,357,415,691 1,119,133,119 1,410,678,709 1,168,625,904
Adjustments
Exempt/allowable income (1,142,582,347) (1,118,407,361) (1,026,073,430) (1,049,165,928)
Disallowable expenses 679,272,078 522,935,136 683,781,319 527,829,198
Allowable expenses (354,526,895) (375,146,191) (354,718,860) (380,211,693)
Loss on leasing business – 144,854,829 (263,699) 144,191,601
Taxable income 539,578,527 293,369,532 713,404,039 411,269,082
Income tax rate (%) 28 28 28 28
Tax expense for the year 151,081,988 82,143,469 199,753,131 115,155,343
Income tax on profit for the year 151,081,988 82,143,469 199,753,131 115,155,343
Effective Tax Rate (%) 11.13 7.34 14.16 9.85
17. Basic Earnings Per Share
Basic earnings per share have been calculated by dividing the net profit for the year attributable to the ordinary shareholders of
the Company by the weighted average number of ordinary shares outstanding during the year.
Company Group
For the year ended 31 March 2018 2017 2018 2017
Rs. Rs. Rs. Rs.
Profit attributable to ordinary shareholders of the Company 1,004,671,318 860,971,242 1,002,342,325 868,928,198
Weighted average number of ordinary shares 71,932,177 65,960,449 71,932,177 65,960,449
Basic earnings per ordinary share 13.97 13.05 13.93 13.17
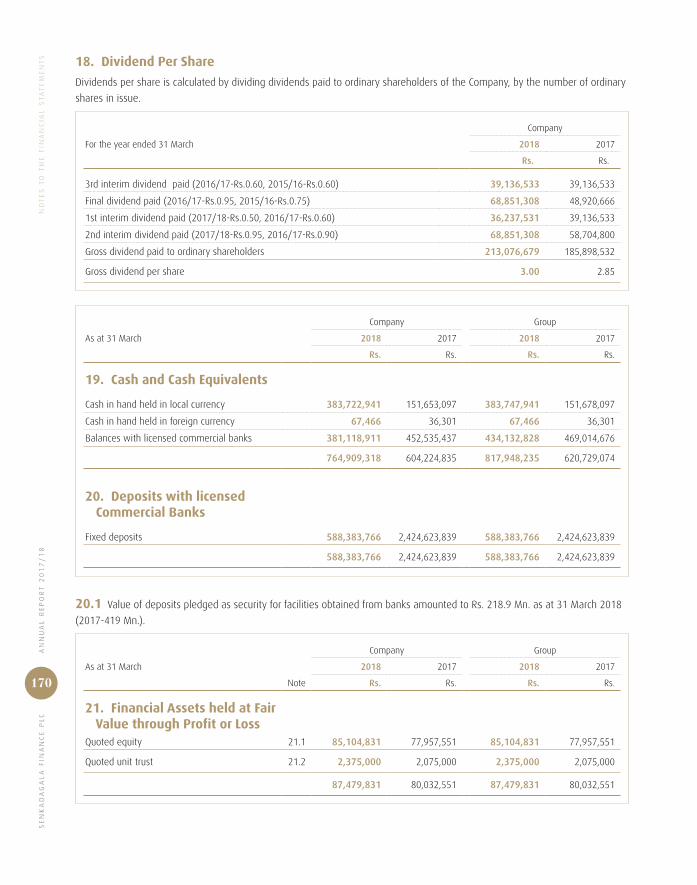
SE
NK
AD
AG
AL
A F
INA
NC
E P
LC
AN
NU
AL
RE
PO
RT
20
17
/1
8N
OT
ES
TO
TH
E F
INA
NC
IAL
ST
AT
EM
EN
TS
170
18. Dividend Per Share
Dividends per share is calculated by dividing dividends paid to ordinary shareholders of the Company, by the number of ordinary
shares in issue.
Company
For the year ended 31 March 2018 2017
Rs. Rs.
3rd interim dividend paid (2016/17-Rs.0.60, 2015/16-Rs.0.60) 39,136,533 39,136,533
Final dividend paid (2016/17-Rs.0.95, 2015/16-Rs.0.75) 68,851,308 48,920,666
1st interim dividend paid (2017/18-Rs.0.50, 2016/17-Rs.0.60) 36,237,531 39,136,533
2nd interim dividend paid (2017/18-Rs.0.95, 2016/17-Rs.0.90) 68,851,308 58,704,800
Gross dividend paid to ordinary shareholders 213,076,679 185,898,532
Gross dividend per share 3.00 2.85
Company Group
As at 31 March 2018 2017 2018 2017
Rs. Rs. Rs. Rs.
19. Cash and Cash Equivalents
Cash in hand held in local currency 383,722,941 151,653,097 383,747,941 151,678,097
Cash in hand held in foreign currency 67,466 36,301 67,466 36,301
Balances with licensed commercial banks 381,118,911 452,535,437 434,132,828 469,014,676
764,909,318 604,224,835 817,948,235 620,729,074
20. Deposits with licensed Commercial Banks
Fixed deposits 588,383,766 2,424,623,839 588,383,766 2,424,623,839
588,383,766 2,424,623,839 588,383,766 2,424,623,839
20.1 Value of deposits pledged as security for facilities obtained from banks amounted to Rs. 218.9 Mn. as at 31 March 2018
(2017-419 Mn.).
Company Group
As at 31 March 2018 2017 2018 2017
Note Rs. Rs. Rs. Rs.
21. Financial Assets held at Fair Value through Profit or LossQuoted equity 21.1 85,104,831 77,957,551 85,104,831 77,957,551
Quoted unit trust 21.2 2,375,000 2,075,000 2,375,000 2,075,000
87,479,831 80,032,551 87,479,831 80,032,551

AN
NU
AL
RE
PO
RT
20
17
/1
8 S
EN
KA
DA
GA
LA
FIN
AN
CE
PL
CN
OT
ES
TO
TH
E F
INA
NC
IAL
ST
AT
EM
EN
TS
171
Company Group
As at 31 March 2018 2017 2018 2017
NoteNo. of shares
CostRs.
Market value
Rs.
No. ofshares
CostRs.
Market value
Rs.
No. ofshares
CostRs.
Market value
Rs.
No. ofshares
CostRs.
Market value
Rs.
21.1 Quoted equityBank, Finance and Insurance
Central Finance Company PLC 46,266 243,207 4,621,973 46,266 243,207 3,988,129 46,266 243,207 4,621,973 46,266 243,207 3,988,129
National Development Bank PLC 693 4,390 92,238 668 500 93,253 693 4,390 92,238 668 500 93,253
Commercial Bank of Ceylon PLC 4,725 469,342 491,400 2,875 258,096 374,900 4,725 469,342 491,400 2,875 258,096 374,900
Beverage, Food and Tobacco
Ceylon Tobacco PLC 3,100 142,017 3,224,000 3,100 142,017 2,699,790 3,100 142,017 3,224,000 3,100 142,017 2,699,790
Hotels and Travels
Aitken Spence PLC 495 3,355 25,047 495 3,355 27,819 495 3,355 25,047 495 3,355 27,819
Manufacturing
Royal Ceramics Lanka PLC 20 273 2,108 20 273 2,380 20 273 2,108 20 273 2,380
Diversified Holdings
John Keells Holdings PLC 4,462 164,976 712,135 4,462 164,976 615,310 4,462 164,976 712,135 4,462 164,976 615,310
Hayleys PLC 113 7,175 22,679 113 7,175 29,945 113 7,175 22,679 113 7,175 29,945
Trading
Lanka Indian Oil Corporation PLC 5,500 148,500 165,550 5,500 148,500 159,500 5,500 148,500 165,550 5,500 148,500 159,500
Portfolio Investment 21.1.1 68,818,704 75,747,700 63,602,015 69,966,525 68,818,704 75,747,700 63,602,015 69,966,525
70,001,939 85,104,831 64,570,114 77,957,551 70,001,939 85,104,831 64,570,114 77,957,551

SE
NK
AD
AG
AL
A F
INA
NC
E P
LC
AN
NU
AL
RE
PO
RT
20
17
/1
8N
OT
ES
TO
TH
E F
INA
NC
IAL
ST
AT
EM
EN
TS
172
Company Group
As at 31 March 2018 2017 2018 2017
No. of shares CostRs.
Market value Rs.
No. of shares Cost Rs.
Market value Rs.
No. of shares CostRs.
Market value Rs.
No. of shares CostRs.
Market value Rs.
21.1.1 Portfolio investment
Bank Finance and Insurance
Ceylinco Insurance PLC (Non-voting) 10,000 1,560,322 10,000,000 10,000 1,560,322 8,200,000 10,000 1,560,322 10,000,000 10,000 1,560,322 8,200,000 Commercial Bank of Ceylon PLC 69 4,722 9,370 69 4,722 – 69 4,722 9,370 69 4,722 – Lanka Ventures PLC 61,800 2,552,579 2,991,120 61,800 2,552,579 2,595,600 61,800 2,552,579 2,991,120 61,800 2,552,579 2,595,600 Seylan Bank PLC (Non-voting) 31,040 1,820,160 1,710,304 30,000 1,820,160 1,641,000 31,040 1,820,160 1,710,304 30,000 1,820,160 1,641,000 Hatton National Bank PLC (Non-voting) 29,279 5,348,333 5,457,606 24,708 4,553,753 4,570,980 29,279 5,348,333 5,457,606 24,708 4,553,753 4,570,980 People’s Insurance Ltd 100,000 1,508,032 2,150,000 100,000 1,508,032 1,830,000 100,000 1,508,032 2,150,000 100,000 1,508,032 1,830,000
Beverage, Food and Tobacco
Lanka Milk Foods (CWE) PLC 72,888 7,308,216 11,523,593 72,888 7,308,216 8,527,896 72,888 7,308,216 11,523,593 72,888 7,308,216 8,527,896
Chemicals and Pharmaceuticals
CIC Holdings PLC (Non-voting) 90,000 3,823,735 3,645,000 90,000 3,823,735 5,616,000 90,000 3,823,735 3,645,000 90,000 3,823,735 5,616,000 Haycarb PLC 18,300 3,010,621 2,196,000 18,300 3,010,621 2,763,300 18,300 3,010,621 2,196,000 18,300 3,010,621 2,763,300
Plantation
Kotagala Plantation PLC 10,000 556,151 118,500 10,000 556,151 101,000 10,000 556,151 118,500 10,000 556,151 101,000
Healthcare
Ceylon Hospitals PLC (Non-voting) 43,838 1,609,492 3,178,255 43,838 1,609,492 3,151,952 43,838 1,609,492 3,178,255 43,838 1,609,492 3,151,952
Hotels and Travels
Taj Lanka Hotels PLC 114,432 3,478,514 1,933,901 114,432 3,478,514 2,403,072 114,432 3,478,514 1,933,901 114,432 3,478,514 2,403,072 John Keells Hotels PLC 251,000 3,197,111 2,334,300 251,000 3,197,111 2,510,000 251,000 3,197,111 2,334,300 251,000 3,197,111 2,510,000
Investment Trusts
Renuka Holdings PLC (Non-voting) 183,274 4,031,493 2,932,384 183,274 4,031,493 2,675,801 183,274 4,031,493 2,932,384 183,274 4,031,493 2,675,801
Land and Property
C T Land Development PLC 5,000 111,570 259,156 5,000 111,570 220,000 5,000 111,570 259,156 5,000 111,570 220,000 Overseas Realty (Ceylon) PLC 160,000 3,683,802 2,896,000 160,000 3,683,802 3,232,000 160,000 3,683,802 2,896,000 160,000 3,683,802 3,232,000
Manufacturing
ACL Cables PLC 40,000 2,496,906 1,640,000 20,000 1,243,018 1,090,000 40,000 2,496,906 1,640,000 20,000 1,243,018 1,090,000 Dipped Products PLC 47,500 5,868,703 4,061,250 47,500 5,868,703 3,610,000 47,500 5,868,703 4,061,250 47,500 5,868,703 3,610,000 Pelwatte Sugar Industries PLC 31,000 1,064,794 3,100 31,000 1,064,794 3,100 31,000 1,064,794 3,100 31,000 1,064,794 3,100 Ceylon Grain Evevators PLC 52,000 3,579,544 3,718,000 – – – 52,000 3,579,544 3,718,000 – – –
Power and Energy
Resus Energy PLC 58,437 1,102,728 1,162,896 58,437 1,102,728 1,110,303 58,437 1,102,728 1,162,896 58,437 1,102,728 1,110,303 Lanka IOC PLC 219,949 5,130,291 6,620,465 219,949 5,130,291 6,378,521 219,949 5,130,291 6,620,465 219,949 5,130,291 6,378,521
Diversified Holdings
Expolanka Holdings PLC 500,000 3,286,400 2,450,000 500,000 3,286,400 3,000,000 500,000 3,286,400 2,450,000 500,000 3,286,400 3,000,000 Melstacorp Limited – – – 80,000 3,095,808 4,736,000 – – – 80,000 3,095,808 4,736,000 C T Holdings PLC 5,000 909,829 962,500 – – – 5,000 909,829 962,500 – – –
Telecommunications
Dialog Axiata PLC 130,000 1,774,656 1,794,000 – – – 130,000 1,774,656 1,794,000 – – –
68,818,704 75,747,700 63,602,015 69,966,525 68,818,704 75,747,700 63,602,015 69,966,525
21.2 Quoted unit trustNamal Acuity Value Fund 25,000 1,250,000 2,375,000 25,000 1,250,000 2,075,000 25,000 1,250,000 2,375,000 25,000 1,250,000 2,075,000
1,250,000 2,375,000 1,250,000 2,075,000 1,250,000 2,375,000 1,250,000 2,075,000
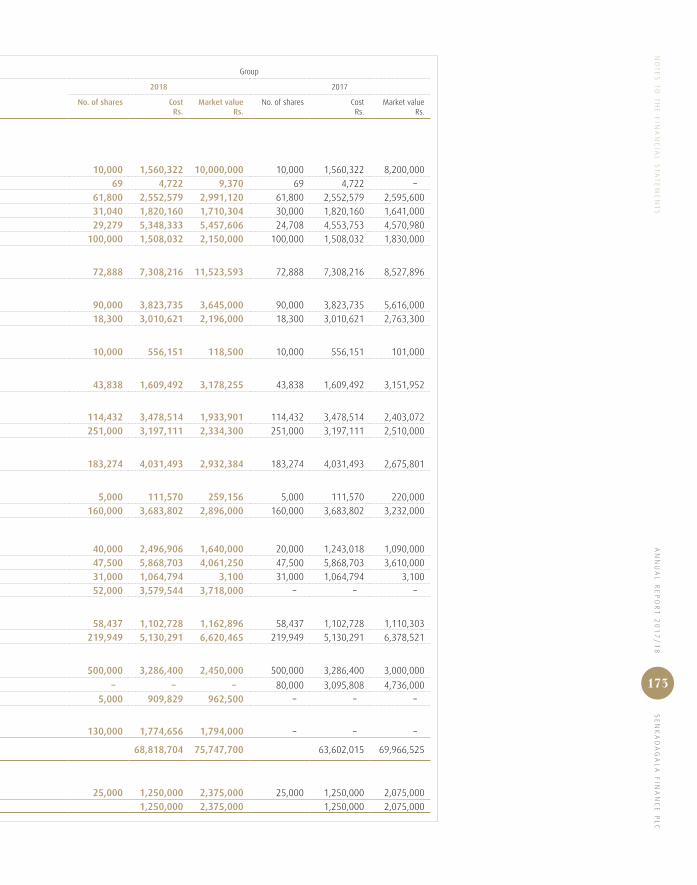
AN
NU
AL
RE
PO
RT
20
17
/1
8 S
EN
KA
DA
GA
LA
FIN
AN
CE
PL
CN
OT
ES
TO
TH
E F
INA
NC
IAL
ST
AT
EM
EN
TS
173
Company Group
As at 31 March 2018 2017 2018 2017
No. of shares CostRs.
Market value Rs.
No. of shares Cost Rs.
Market value Rs.
No. of shares CostRs.
Market value Rs.
No. of shares CostRs.
Market value Rs.
21.1.1 Portfolio investment
Bank Finance and Insurance
Ceylinco Insurance PLC (Non-voting) 10,000 1,560,322 10,000,000 10,000 1,560,322 8,200,000 10,000 1,560,322 10,000,000 10,000 1,560,322 8,200,000 Commercial Bank of Ceylon PLC 69 4,722 9,370 69 4,722 – 69 4,722 9,370 69 4,722 – Lanka Ventures PLC 61,800 2,552,579 2,991,120 61,800 2,552,579 2,595,600 61,800 2,552,579 2,991,120 61,800 2,552,579 2,595,600 Seylan Bank PLC (Non-voting) 31,040 1,820,160 1,710,304 30,000 1,820,160 1,641,000 31,040 1,820,160 1,710,304 30,000 1,820,160 1,641,000 Hatton National Bank PLC (Non-voting) 29,279 5,348,333 5,457,606 24,708 4,553,753 4,570,980 29,279 5,348,333 5,457,606 24,708 4,553,753 4,570,980 People’s Insurance Ltd 100,000 1,508,032 2,150,000 100,000 1,508,032 1,830,000 100,000 1,508,032 2,150,000 100,000 1,508,032 1,830,000
Beverage, Food and Tobacco
Lanka Milk Foods (CWE) PLC 72,888 7,308,216 11,523,593 72,888 7,308,216 8,527,896 72,888 7,308,216 11,523,593 72,888 7,308,216 8,527,896
Chemicals and Pharmaceuticals
CIC Holdings PLC (Non-voting) 90,000 3,823,735 3,645,000 90,000 3,823,735 5,616,000 90,000 3,823,735 3,645,000 90,000 3,823,735 5,616,000 Haycarb PLC 18,300 3,010,621 2,196,000 18,300 3,010,621 2,763,300 18,300 3,010,621 2,196,000 18,300 3,010,621 2,763,300
Plantation
Kotagala Plantation PLC 10,000 556,151 118,500 10,000 556,151 101,000 10,000 556,151 118,500 10,000 556,151 101,000
Healthcare
Ceylon Hospitals PLC (Non-voting) 43,838 1,609,492 3,178,255 43,838 1,609,492 3,151,952 43,838 1,609,492 3,178,255 43,838 1,609,492 3,151,952
Hotels and Travels
Taj Lanka Hotels PLC 114,432 3,478,514 1,933,901 114,432 3,478,514 2,403,072 114,432 3,478,514 1,933,901 114,432 3,478,514 2,403,072 John Keells Hotels PLC 251,000 3,197,111 2,334,300 251,000 3,197,111 2,510,000 251,000 3,197,111 2,334,300 251,000 3,197,111 2,510,000
Investment Trusts
Renuka Holdings PLC (Non-voting) 183,274 4,031,493 2,932,384 183,274 4,031,493 2,675,801 183,274 4,031,493 2,932,384 183,274 4,031,493 2,675,801
Land and Property
C T Land Development PLC 5,000 111,570 259,156 5,000 111,570 220,000 5,000 111,570 259,156 5,000 111,570 220,000 Overseas Realty (Ceylon) PLC 160,000 3,683,802 2,896,000 160,000 3,683,802 3,232,000 160,000 3,683,802 2,896,000 160,000 3,683,802 3,232,000
Manufacturing
ACL Cables PLC 40,000 2,496,906 1,640,000 20,000 1,243,018 1,090,000 40,000 2,496,906 1,640,000 20,000 1,243,018 1,090,000 Dipped Products PLC 47,500 5,868,703 4,061,250 47,500 5,868,703 3,610,000 47,500 5,868,703 4,061,250 47,500 5,868,703 3,610,000 Pelwatte Sugar Industries PLC 31,000 1,064,794 3,100 31,000 1,064,794 3,100 31,000 1,064,794 3,100 31,000 1,064,794 3,100 Ceylon Grain Evevators PLC 52,000 3,579,544 3,718,000 – – – 52,000 3,579,544 3,718,000 – – –
Power and Energy
Resus Energy PLC 58,437 1,102,728 1,162,896 58,437 1,102,728 1,110,303 58,437 1,102,728 1,162,896 58,437 1,102,728 1,110,303 Lanka IOC PLC 219,949 5,130,291 6,620,465 219,949 5,130,291 6,378,521 219,949 5,130,291 6,620,465 219,949 5,130,291 6,378,521
Diversified Holdings
Expolanka Holdings PLC 500,000 3,286,400 2,450,000 500,000 3,286,400 3,000,000 500,000 3,286,400 2,450,000 500,000 3,286,400 3,000,000 Melstacorp Limited – – – 80,000 3,095,808 4,736,000 – – – 80,000 3,095,808 4,736,000 C T Holdings PLC 5,000 909,829 962,500 – – – 5,000 909,829 962,500 – – –
Telecommunications
Dialog Axiata PLC 130,000 1,774,656 1,794,000 – – – 130,000 1,774,656 1,794,000 – – –
68,818,704 75,747,700 63,602,015 69,966,525 68,818,704 75,747,700 63,602,015 69,966,525
21.2 Quoted unit trustNamal Acuity Value Fund 25,000 1,250,000 2,375,000 25,000 1,250,000 2,075,000 25,000 1,250,000 2,375,000 25,000 1,250,000 2,075,000
1,250,000 2,375,000 1,250,000 2,075,000 1,250,000 2,375,000 1,250,000 2,075,000

SE
NK
AD
AG
AL
A F
INA
NC
E P
LC
AN
NU
AL
RE
PO
RT
20
17
/1
8N
OT
ES
TO
TH
E F
INA
NC
IAL
ST
AT
EM
EN
TS
174
Company Group
As at 31 March 2018 2017 2018 2017
Note Rs. Rs. Rs. Rs.
22. Finance Leases
Gross investment in leases receivable within one year 11,002,229,122 9,114,156,521 11,002,229,122 9,114,156,521
Gross investment in leases receivable between one and five years 20,141,305,194 17,070,311,975 20,141,305,194 17,070,311,975
Gross investment in leases receivable in respect of non-performing leases 186,253,009 153,647,815 186,253,009 153,647,815
Repossessed lease receivable 141,321,392 72,218,665 141,321,392 72,218,665
Leases receivable in arrears 833,599,487 581,368,969 833,599,487 581,368,969
32,304,708,204 26,991,703,945 32,304,708,204 26,991,703,945
Unearned lease income (8,131,013,588) (6,697,537,330) (8,131,013,588) (6,697,537,330)
Initial lease rental (5,745,696) (8,074,096) (5,745,696) (8,074,096)
Prepaid lease rentals (91,163,720) (92,741,210) (91,163,720) (92,741,210)
Net investment in finance leases 24,076,785,200 20,193,351,309 24,076,785,200 20,193,351,309
Impairment losses
Provision for individual impairment 22.1 (74,596,916) (54,255,176) (74,596,916) (54,255,176)
Provision for collective impairment 22.2 (114,951,704) (124,401,926) (114,951,704) (124,401,926)
Net investment in finance leases after impairment 23,887,236,580 20,014,694,207 23,887,236,580 20,014,694,207
22.1 Movement in allowance for individual impairment
Balance at the beginning of the year 54,255,176 93,499,181 54,255,176 93,499,181
Charge/(Reversal) for the year 11 20,341,740 (39,244,005) 20,341,740 (39,244,005)
Balance at the end of the year 74,596,916 54,255,176 74,596,916 54,255,176
Gross amount of loans individually determined to be impaired 142,106,498 111,468,493 142,106,498 111,468,493
22.2 Movement in allowance for collective impairment
Balance at the beginning of the year 124,401,926 68,562,405 124,401,926 68,562,405
Charge/(Reversal) for the year 12 (9,450,222) 55,839,521 (9,450,222) 55,839,521
Balance at the end of the year 114,951,704 124,401,926 114,951,704 124,401,926
Total of individual and collective impairment 189,548,620 178,657,102 189,548,620 178,657,102
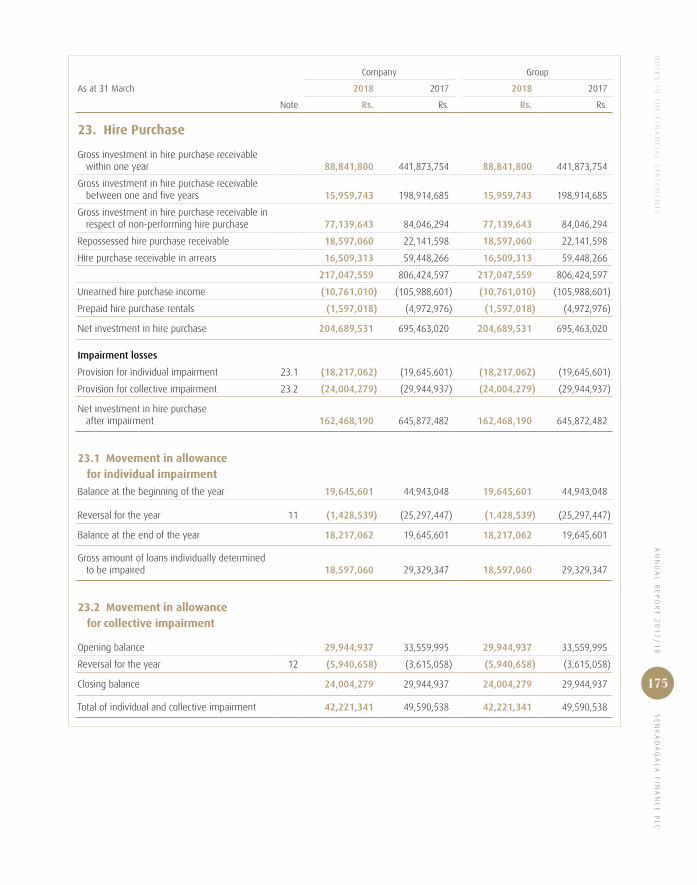
AN
NU
AL
RE
PO
RT
20
17
/1
8 S
EN
KA
DA
GA
LA
FIN
AN
CE
PL
CN
OT
ES
TO
TH
E F
INA
NC
IAL
ST
AT
EM
EN
TS
175
Company Group
As at 31 March 2018 2017 2018 2017
Note Rs. Rs. Rs. Rs.
23. Hire Purchase
Gross investment in hire purchase receivable within one year 88,841,800 441,873,754 88,841,800 441,873,754
Gross investment in hire purchase receivable between one and five years 15,959,743 198,914,685 15,959,743 198,914,685
Gross investment in hire purchase receivable in respect of non-performing hire purchase 77,139,643 84,046,294 77,139,643 84,046,294
Repossessed hire purchase receivable 18,597,060 22,141,598 18,597,060 22,141,598
Hire purchase receivable in arrears 16,509,313 59,448,266 16,509,313 59,448,266
217,047,559 806,424,597 217,047,559 806,424,597
Unearned hire purchase income (10,761,010) (105,988,601) (10,761,010) (105,988,601)
Prepaid hire purchase rentals (1,597,018) (4,972,976) (1,597,018) (4,972,976)
Net investment in hire purchase 204,689,531 695,463,020 204,689,531 695,463,020
Impairment losses
Provision for individual impairment 23.1 (18,217,062) (19,645,601) (18,217,062) (19,645,601)
Provision for collective impairment 23.2 (24,004,279) (29,944,937) (24,004,279) (29,944,937)
Net investment in hire purchase after impairment 162,468,190 645,872,482 162,468,190 645,872,482
23.1 Movement in allowance for individual impairment
Balance at the beginning of the year 19,645,601 44,943,048 19,645,601 44,943,048
Reversal for the year 11 (1,428,539) (25,297,447) (1,428,539) (25,297,447)
Balance at the end of the year 18,217,062 19,645,601 18,217,062 19,645,601
Gross amount of loans individually determined to be impaired 18,597,060 29,329,347 18,597,060 29,329,347
23.2 Movement in allowance for collective impairment
Opening balance 29,944,937 33,559,995 29,944,937 33,559,995
Reversal for the year 12 (5,940,658) (3,615,058) (5,940,658) (3,615,058)
Closing balance 24,004,279 29,944,937 24,004,279 29,944,937
Total of individual and collective impairment 42,221,341 49,590,538 42,221,341 49,590,538

SE
NK
AD
AG
AL
A F
INA
NC
E P
LC
AN
NU
AL
RE
PO
RT
20
17
/1
8N
OT
ES
TO
TH
E F
INA
NC
IAL
ST
AT
EM
EN
TS
176
Company Group
As at 31 March 2018 2017 2018 2017
Note Rs. Rs. Rs. Rs.
24. Other Loans and ReceivablesCommercial loans 24.1 2,145,243,113 2,059,387,619 2,145,243,113 2,059,387,619
Personal loans 24.2 113,333,306 98,907,380 113,333,306 98,907,380
Pawning advances 24.3 993,680,335 548,402,600 993,680,335 548,402,600
Other advances 24.4 499,823,913 390,323,774 499,823,913 390,323,774
3,752,080,667 3,097,021,373 3,752,080,667 3,097,021,373
24.1 Commercial loans
Gross investment in commercial loans receivable within one year 1,357,835,882 1,691,263,087 1,357,835,882 1,691,263,087
Gross investment in commercial loans receivable between one and five years 1,051,613,984 877,175,221 1,051,613,984 877,175,221
Gross investment in commercial loans receivable in respect of non-performing loans 172,783,674 11,494,846 172,783,674 11,494,846
Commercial loans receivable in arrears 252,886,103 42,365,815 252,886,103 42,365,815
2,835,119,643 2,622,298,969 2,835,119,643 2,622,298,969
Unearned commercial loan income (545,515,097) (523,662,887) (545,515,097) (523,662,887)
Prepaid commercial loan rentals (10,890,949) (7,057,134) (10,890,949) (7,057,134)
Net investment in commercial loans 2,278,713,597 2,091,578,948 2,278,713,597 2,091,578,948
Impairment losses
Provision for individual impairment 24.1.1 (92,117,334) (27,101,298) (92,117,334) (27,101,298)
Provision for collective impairment 24.1.2 (41,353,150) (5,090,031) (41,353,150) (5,090,031)
Net investment in commercial loans after impairment 2,145,243,113 2,059,387,619 2,145,243,113 2,059,387,619
24.1.1 Movement in allowance for individual impairment
Balance at the beginning of the year 27,101,298 5,683,067 27,101,298 5,683,067
Charge for the year 11 65,016,036 21,418,231 65,016,036 21,418,231
Balance at the end of the year 92,117,334 27,101,298 92,117,334 27,101,298
Gross amount of loans individually determined to be impaired 106,821,903 47,409,316 106,821,903 47,409,316

AN
NU
AL
RE
PO
RT
20
17
/1
8 S
EN
KA
DA
GA
LA
FIN
AN
CE
PL
CN
OT
ES
TO
TH
E F
INA
NC
IAL
ST
AT
EM
EN
TS
177
Company Group
As at 31 March 2018 2017 2018 2017
Note Rs. Rs. Rs. Rs.
24.1.2 Movement in allowance for collective impairment
Balance at the beginning of the year 5,090,031 3,315,464 5,090,031 3,315,464
Charge for the year 12 36,263,119 1,774,567 36,263,119 1,774,567
Balance at the end of the year 41,353,150 5,090,031 41,353,150 5,090,031
24.2 Personal loan
Gross investment in personal loan receivable within one year 67,437,758 57,082,783 67,437,758 57,082,783
Gross investment in personal loan receivable between one and five years 130,640,286 118,687,726 130,640,286 118,687,726
Gross investment in personal loans receivable in respect of non-performing loans 55,317 – 55,317 –
Personal loan receivable in arrears 146,165 181,093 146,165 181,093
198,279,526 175,951,602 198,279,526 175,951,602
Unearned personal loan income (78,487,967) (71,700,955) (78,487,967) (71,700,955)
Prepaid personal loan rentals (6,458,253) (5,341,829) (6,458,253) (5,341,829)
Net investment in personal loan 113,333,306 98,908,818 113,333,306 98,908,818
Impairment losses
Provision for individual impairment 24.2.1 – (1,438) – (1,438)
Net investment in commercial loans after impairment 113,333,306 98,907,380 113,333,306 98,907,380
24.2.1 Movement in allowance for individual impairment
Balance at the beginning of the year 1,438 3,238 1,438 3,238
Reversal for the year 11 (1,438) (1,800) (1,438) (1,800)
Balance at the end of the year – 1,438 – 1,438
Gross amount of loans individually determined to be impaired – 5,440 – 5,440

SE
NK
AD
AG
AL
A F
INA
NC
E P
LC
AN
NU
AL
RE
PO
RT
20
17
/1
8N
OT
ES
TO
TH
E F
INA
NC
IAL
ST
AT
EM
EN
TS
178
Company Group
As at 31st March 2018 2017 2018 2017
Note Rs. Rs. Rs. Rs.
24.3 Pawning advances
Gross investment in pawning advances 926,538,387 515,216,509 926,538,387 515,216,509
Interest receivable from pawning advances 67,142,984 33,219,302 67,142,984 33,219,302
Net investment in pawning advances 993,681,371 548,435,811 993,681,371 548,435,811
Impairment losses
Provision for collective impairment 24.3.1 (1,036) (33,211) (1,036) (33,211)
Net investment in pawning advances after impairment 993,680,335 548,402,600 993,680,335 548,402,600
24.3.1 Movement in allowance for collective impairment
Balance at the beginning of the year 33,211 233,278 33,211 233,278
Reversal of the year 12 (32,175) (200,067) (32,175) (200,067)
Balance at the end of the year 1,036 33,211 1,036 33,211
24.4 Other advances
Loans against fixed deposits 90,300,456 66,394,502 90,300,456 66,394,502
Discounting of cheques 490,000 490,000 490,000 490,000
Insurance 469,656,669 384,691,167 469,656,669 384,691,167
Staff debtors 19,370,628 17,180,175 19,370,628 17,180,175
Sundry debtors 3,272,811 4,932,153 3,272,811 4,932,153
583,090,564 473,687,997 583,090,564 473,687,997
Impairment losses
Provision for individual impairment 24.4.1 (1,906,394) (1,906,394) (1,906,394) (1,906,394)
Provision for collective impairment 24.4.2 (81,360,257) (81,457,829) (81,360,257) (81,457,829)
Net investment in other advances after impairment 499,823,913 390,323,774 499,823,913 390,323,774
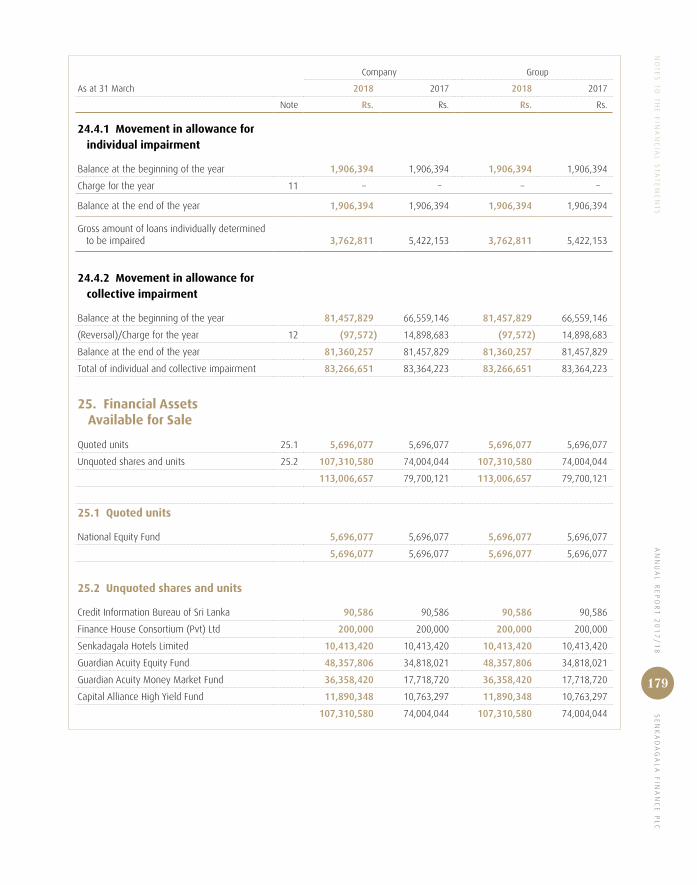
AN
NU
AL
RE
PO
RT
20
17
/1
8 S
EN
KA
DA
GA
LA
FIN
AN
CE
PL
CN
OT
ES
TO
TH
E F
INA
NC
IAL
ST
AT
EM
EN
TS
179
Company Group
As at 31 March 2018 2017 2018 2017
Note Rs. Rs. Rs. Rs.
24.4.1 Movement in allowance for individual impairment
Balance at the beginning of the year 1,906,394 1,906,394 1,906,394 1,906,394
Charge for the year 11 – – – –
Balance at the end of the year 1,906,394 1,906,394 1,906,394 1,906,394
Gross amount of loans individually determined to be impaired 3,762,811 5,422,153 3,762,811 5,422,153
24.4.2 Movement in allowance for collective impairment
Balance at the beginning of the year 81,457,829 66,559,146 81,457,829 66,559,146
(Reversal)/Charge for the year 12 (97,572) 14,898,683 (97,572) 14,898,683
Balance at the end of the year 81,360,257 81,457,829 81,360,257 81,457,829
Total of individual and collective impairment 83,266,651 83,364,223 83,266,651 83,364,223
25. Financial Assets Available for Sale
Quoted units 25.1 5,696,077 5,696,077 5,696,077 5,696,077
Unquoted shares and units 25.2 107,310,580 74,004,044 107,310,580 74,004,044
113,006,657 79,700,121 113,006,657 79,700,121
25.1 Quoted units
National Equity Fund 5,696,077 5,696,077 5,696,077 5,696,077
5,696,077 5,696,077 5,696,077 5,696,077
25.2 Unquoted shares and units
Credit Information Bureau of Sri Lanka 90,586 90,586 90,586 90,586
Finance House Consortium (Pvt) Ltd 200,000 200,000 200,000 200,000
Senkadagala Hotels Limited 10,413,420 10,413,420 10,413,420 10,413,420
Guardian Acuity Equity Fund 48,357,806 34,818,021 48,357,806 34,818,021
Guardian Acuity Money Market Fund 36,358,420 17,718,720 36,358,420 17,718,720
Capital Alliance High Yield Fund 11,890,348 10,763,297 11,890,348 10,763,297
107,310,580 74,004,044 107,310,580 74,004,044

SE
NK
AD
AG
AL
A F
INA
NC
E P
LC
AN
NU
AL
RE
PO
RT
20
17
/1
8N
OT
ES
TO
TH
E F
INA
NC
IAL
ST
AT
EM
EN
TS
180
Company Group
As at 31 March 2018 2017 2018 2017
Rs. Rs. Rs. Rs.
26. Financial Assets Held to Maturity
Treasury bills 782,432,811 712,795,529 782,432,811 712,795,529
Treasury bonds 185,086,178 182,105,842 185,086,178 182,105,842
967,518,989 894,901,371 967,518,989 894,901,371
27. Investments in Subsidiaries
Unquoted
Senkadagala Insurance Brokers (Pvt) Ltd
(2,000,000 Ordinary shares)
Holding (%) 100 100
Place of business No. 437B,1st Floor, Katugastota Road, Kandy
Cost 20,000,000 20,000,000
Newest Capital Limited
(150,000,000 Ordinary shares)
Holding (%) 100 100
Place of business No. 267, Galle Road, Colombo 3
Cost 300,000,000 300,000,000
320,000,000 320,000,000
28. Investment Property
Cost or valuation
Balance at the beginning of the year 87,782,655 87,782,655 287,885,424 287,885,424
Additions and transfer during the year 300,559,000 – 11,559,000 –
Balance at the end of the year 388,341,655 87,782,655 299,444,424 287,885,424
Accumulated depreciation
Balance at the beginning of the year 9,060,760 8,757,722 14,778,903 11,470,727
Charge for the year – 303,038 3,005,138 3,308,176
Balance at the end of the year 9,060,760 9,060,760 17,784,041 14,778,903
Carrying amount at the end of the year 379,280,895 78,721,895 281,660,383 273,106,521

AN
NU
AL
RE
PO
RT
20
17
/1
8 S
EN
KA
DA
GA
LA
FIN
AN
CE
PL
CN
OT
ES
TO
TH
E F
INA
NC
IAL
ST
AT
EM
EN
TS
181
28.1 Fully-depreciated investment propertyThe cost of fully depreciated Investment property of the Company which are still in use as at the Statement of Financial Position date is as follows:
As at 31 March 2018 2017
Rs. Rs.
Buildings 9,060,760 9,060,760
28.2 Information of freehold investment property of the Group
Location Extent of land Valuer Date of valuation
Valuation Cost Cost
2018 2017
Rs. Rs. Rs.
Land and building
98, Dean’s Road, Colombo 10 6.000 P K M U Dissanayake 16.04.2017 60,600,000 3,500,000 3,500,000
12, Kotugodella Veediya, Kandy Lot 1 9.875 P K M U Dissanayake 15.04.2017 86,500,000 7,542,068 7,542,068
12, Kotugodella Veediya, Kandy Lot 2 18.000 P K M U Dissanayake 15.04.2017 76,700,000 70,679,827 70,679,827
98, Yatinuwara Veediya, Kandy 7.000 P K M U Dissanayake 15.04.2017 55,700,000 6,060,760 6,060,760
30, Kynsey Road, Colombo 07 20.10 P H M N Herath 18.03.2018 289,000,000 211,661,769 200,102,769
568,500,000 299,444,424 287,885,424
Rental income from investment properties amounted to Rs. 15,717,000/- during the year (2017 – Rs. 14,508,000/-)
28.3 Measurement of fair value
(i) Fair value hierarchy
The fair value of properties set out above was determined by a report from an external independent property valuers,
Mr K M U Dissanayake and Mr H N M Herath who valued the properties as at 31 March 2017 and 31 March 2018 respectively.
The valuer has appropriate recognised professional qualifications and recent experience in the location and category of the
property being valued.
These values have not been incorporated in the Financial Statements.
The fair value measurement for the above of Rs. 568,500,000/- has been categorised as a Level 3 fair value based on the inputs
to the valuation technique used.

SE
NK
AD
AG
AL
A F
INA
NC
E P
LC
AN
NU
AL
RE
PO
RT
20
17
/1
8N
OT
ES
TO
TH
E F
INA
NC
IAL
ST
AT
EM
EN
TS
182
(ii) Valuation technique and significant unobservable inputsThe following table shows the valuation technique used in measuring the fair value of the freehold properties mentioned above,
as well as the significant unobservable inputs used.
Valuation technique Significant unobservable inputs Inter-relationship between significant unobservable inputs and fair value measurement
Market Comparable Method: This method considers the selling
price of a similar property within a reasonably recent period of
time in determining the fair value of the property being revalued.
This involves evaluation of recent active market prices of similar
assets, making appropriate adjustments for differences in size,
nature, location, condition of specific property in this process outlier
transactions, indicative of particularly motivated buyers or sellers
are too compensated for since the price may not adequately reflect
the fair market value.
Price per perch for Land.
Price per square foot for building depreciation rate.
Estimated fair value would
increase (decrease) if;
Price per perch increases
(decreases).
Price per square foot
increases (decreases).
Depreciation rate for
building (decreases)/
increases.
Investment Method: This method involves capitalisation of
the expected rental income at an appropriate rate of years
purchase currently characterised by the real estate market.
Gross Monthly Rental Years
Purchase (Present value of 1
unit per period Void Period)
Estimated fair value
would increase
(decrease) if;
Gross Annual Rental
increases (decreases).
Years Purchase increases
(decreases).
Void Period (decrease)/
increases.
29. Property, Plant and Equipment
29.1 Company
As at 01.04.2017
Additions Transfer Disposals As at 31.03.2018
Rs. Rs. Rs. Rs. Rs.
Cost
Land 110,371,865 – – – 110,371,865
Buildings 35,949,773 – – – 35,949,773
Furniture, fittings and fixtures 444,934,653 34,651,999 – (1,967,121) 477,619,531
Office equipment 348,643,984 14,613,073 – – 363,257,057
Air conditioner 66,340,958 2,507,370 (158,190) (414,357) 68,275,781
Computer and accessories 381,790,612 28,687,030 – – 410,477,642
Facsimile machine 2,196,998 88,000 – – 2,284,998
Generator 46,298,729 9,273,117 – – 55,571,846
Motor vehicles 848,401,379 253,204,190 208,376 (142,228,050) 959,585,895
Photostat machine 12,364,026 94,860 – – 12,458,886
Printers 38,671,651 3,778,168 – – 42,449,819
2,335,964,628 346,897,807 50,186 (144,609,528) 2,538,303,093

AN
NU
AL
RE
PO
RT
20
17
/1
8 S
EN
KA
DA
GA
LA
FIN
AN
CE
PL
CN
OT
ES
TO
TH
E F
INA
NC
IAL
ST
AT
EM
EN
TS
183
As at 01.04.2017
Charge for the year
Transfer Charge on disposals
As at 31.03.2018
Rs. Rs. Rs. Rs. Rs.
Accumulated depreciation
Buildings 7,665,690 1,984,538 – – 9,650,228
Furniture, fittings and fixtures 238,439,974 32,411,708 – (601,789) 270,249,893
Office equipment 137,740,435 32,611,455 – – 170,351,890
Air conditioner 51,672,165 7,335,810 – (414,357) 58,593,618
Computer and accessories 238,524,763 57,567,762 – – 296,092,525
Facsimile machine 1,208,739 167,470 – – 1,376,209
Generator 37,945,694 2,430,180 – – 40,375,874
Motor vehicles 214,563,548 150,646,069 – (85,926,365) 279,283,252
Photostat machine 10,037,791 1,010,929 – – 11,048,720
Printers 30,921,754 3,742,202 – – 34,663,956
968,720,553 289,908,123 – (86,942,511) 1,171,686,165
Net book value 1,367,244,075 1,366,616,928
29.2 Group
As at 01.04.2017
Additions Transfer Disposals As at 31.03.2018
Rs. Rs. Rs. Rs. Rs.
Cost
Land 110,371,865 – – – 110,371,865
Buildings 35,949,773 – – – 35,949,773
Furniture, fittings and fixtures 445,476,628 34,651,999 – (1,967,121) 478,161,506
Office equipment 348,801,484 14,613,073 – – 363,414,557
Air conditioner 66,440,228 2,507,370 (257,460) (414,357) 68,275,781
Computer and accessories 382,360,512 28,687,030 – – 411,047,542
Facsimile machine 2,251,878 88,000 – – 2,339,878
Generator 46,298,729 9,273,117 – – 55,571,846
Motor vehicles 854,705,879 253,740,950 208,376 (142,228,050) 966,427,155
Photostat machine 12,495,066 94,860 – – 12,589,926
Printers 38,765,652 3,778,168 – – 42,543,820
2,343,917,694 347,434,567 (49,084) (144,609,528) 2,546,693,649

SE
NK
AD
AG
AL
A F
INA
NC
E P
LC
AN
NU
AL
RE
PO
RT
20
17
/1
8N
OT
ES
TO
TH
E F
INA
NC
IAL
ST
AT
EM
EN
TS
184
As at 01.04.2017
Charge for the year
Transfer Charge on Disposals
As at 31.03.2018
Rs. Rs. Rs. Rs. Rs.
Accumulated depreciation
Buildings 7,665,690 1,984,538 – – 9,650,228
Furniture, fittings and fixtures 238,777,147 32,499,344 – (601,789) 270,674,702
Office equipment 137,798,553 32,627,211 – – 170,425,764
Air conditioner 51,696,431 7,360,628 (49,084) (414,357) 58,593,618
Computer and accessories 239,085,941 57,576,484 – – 296,662,425
Facsimile machine 1,230,220 172,954 – – 1,403,174
Generator 37,945,694 2,430,180 – – 40,375,874
Motor vehicles 215,439,348 151,711,942 – (85,926,365) 281,224,925
Photostat machine 10,089,115 1,024,033 – – 11,113,148
Printers 31,013,782 3,744,174 – – 34,757,956
970,741,921 291,131,488 (49,084) (86,942,511) 1,174,881,814
Net book value 1,373,175,773 1,371,811,835
29.3 Property, plant and equipment retired from active useFollowing fully-depreciated property, plant and equipment of the Company were retired from active use as at the Statement of Financial Position date.
As at 31 March 2018 2017
Rs. Rs.
Furniture, fittings and fixtures 139,480 3,604,685
Office equipment – 73,300
Air conditioner 414,357 –
Computer and accessories – –
Facsimile machine – –
Photostat machine – 149,000
Motor vehicles – 3,304,167
Printers – –
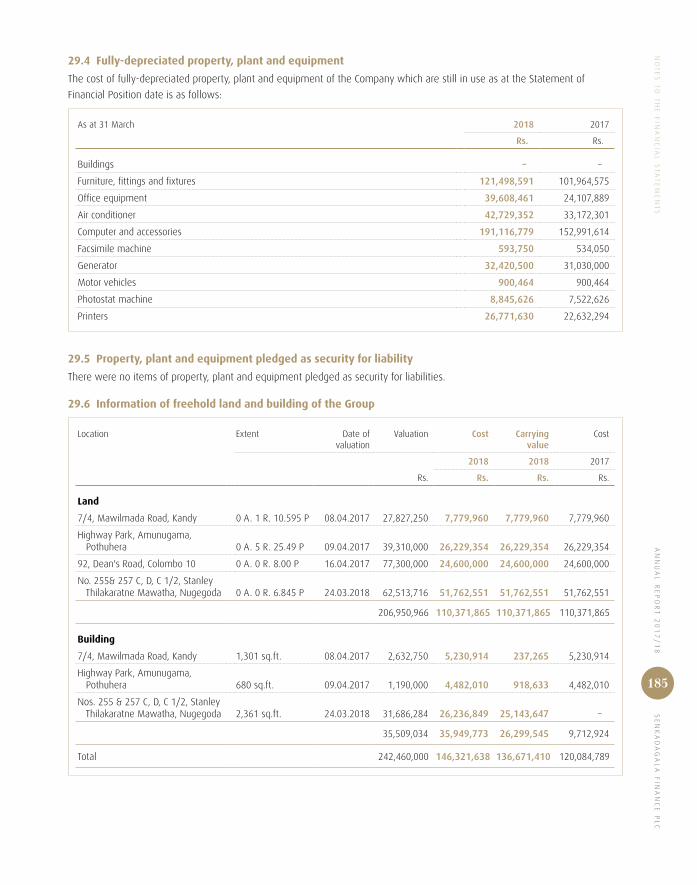
AN
NU
AL
RE
PO
RT
20
17
/1
8 S
EN
KA
DA
GA
LA
FIN
AN
CE
PL
CN
OT
ES
TO
TH
E F
INA
NC
IAL
ST
AT
EM
EN
TS
185
29.4 Fully-depreciated property, plant and equipment
The cost of fully-depreciated property, plant and equipment of the Company which are still in use as at the Statement of
Financial Position date is as follows:
As at 31 March 2018 2017
Rs. Rs.
Buildings – –
Furniture, fittings and fixtures 121,498,591 101,964,575
Office equipment 39,608,461 24,107,889
Air conditioner 42,729,352 33,172,301
Computer and accessories 191,116,779 152,991,614
Facsimile machine 593,750 534,050
Generator 32,420,500 31,030,000
Motor vehicles 900,464 900,464
Photostat machine 8,845,626 7,522,626
Printers 26,771,630 22,632,294
29.5 Property, plant and equipment pledged as security for liability
There were no items of property, plant and equipment pledged as security for liabilities.
29.6 Information of freehold land and building of the Group
Location Extent Date of valuation
Valuation Cost Carrying value
Cost
2018 2018 2017
Rs. Rs. Rs. Rs.
Land
7/4, Mawilmada Road, Kandy 0 A. 1 R. 10.595 P 08.04.2017 27,827,250 7,779,960 7,779,960 7,779,960
Highway Park, Amunugama, Pothuhera 0 A. 5 R. 25.49 P 09.04.2017 39,310,000 26,229,354 26,229,354 26,229,354
92, Dean's Road, Colombo 10 0 A. 0 R. 8.00 P 16.04.2017 77,300,000 24,600,000 24,600,000 24,600,000
No. 255& 257 C, D, C 1/2, Stanley Thilakaratne Mawatha, Nugegoda 0 A. 0 R. 6.845 P 24.03.2018 62,513,716 51,762,551 51,762,551 51,762,551
206,950,966 110,371,865 110,371,865 110,371,865
Building
7/4, Mawilmada Road, Kandy 1,301 sq.ft. 08.04.2017 2,632,750 5,230,914 237,265 5,230,914
Highway Park, Amunugama, Pothuhera 680 sq.ft. 09.04.2017 1,190,000 4,482,010 918,633 4,482,010
Nos. 255 & 257 C, D, C 1/2, Stanley Thilakaratne Mawatha, Nugegoda 2,361 sq.ft. 24.03.2018 31,686,284 26,236,849 25,143,647 –
35,509,034 35,949,773 26,299,545 9,712,924
Total 242,460,000 146,321,638 136,671,410 120,084,789

SE
NK
AD
AG
AL
A F
INA
NC
E P
LC
AN
NU
AL
RE
PO
RT
20
17
/1
8N
OT
ES
TO
TH
E F
INA
NC
IAL
ST
AT
EM
EN
TS
186
29.7 Measurement of fair value
(i) Fair value hierarchy
The fair value of properties set out above was determined by a report from an external independent property valuer,
Mr K M U Dissanayake who valued the properties as at 31 March 2018. The valuer has appropriate recognised professional
qualifications and recent experience in the location and category of the property being valued.
These values have not been incorporated in the Financial Statements.
The fair value measurement for the above of Rs. 242,460,000/- has been categorised as a Level 3 fair value based on the inputs
to the valuation technique used.
(ii) Valuation technique and significant unobservable inputsThe following table shows the valuation technique used in measuring the fair value of the freehold properties mentioned above,
as well as the significant unobservable inputs used:
Valuation technique Significant unobservable inputs Inter-relationship between significant unobservable inputs and fair value measurement
Market Comparable Method: This method
considers the selling price of a similar
property within a reasonably recent period
of time in determining the fair value of
the property being revalued. This involves
evaluation of recent active market prices
of similar assets, making appropriate
adjustments for differences in size, nature,
location, condition of specific property
in this process outlier transactions,
indicative of particularly motivated buyers
or sellers are too compensated for since
the price may not adequately reflect the
fair market value.
Price per perch for Land.
Price per square foot for building
depreciation rate.
Estimated fair value would increase
(decrease) if;
Price per perch increases (decreases).
Price per square foot increases
(decreases).
Depreciation rate for building (decreases)/
increases.

AN
NU
AL
RE
PO
RT
20
17
/1
8 S
EN
KA
DA
GA
LA
FIN
AN
CE
PL
CN
OT
ES
TO
TH
E F
INA
NC
IAL
ST
AT
EM
EN
TS
187
30. Intangible Assets
30.1 Company
Software
As at 31 March 2018 2017
Rs. Rs.
Cost
Balance at the beginning of the year 227,083,863 210,216,637
Additions during the year 679,377 16,867,226
Balance at the end of the year 227,763,240 227,083,863
Accumulated amortisation
Balance at the beginning of the year 156,159,010 141,657,692
Amortisation for the year 14,352,423 14,501,318
Balance at the end of the year 170,511,433 156,159,010
Carrying amount 57,251,807 70,924,853
30.2 Fully-amortised Intangible assets
The cost of fully-amortised Intangible assets of the Company which are still in use as at the statement of financial position date
is as follows:
As at 31 March 2018 2017
Rs. Rs.
Software 121,434,587 102,356,828
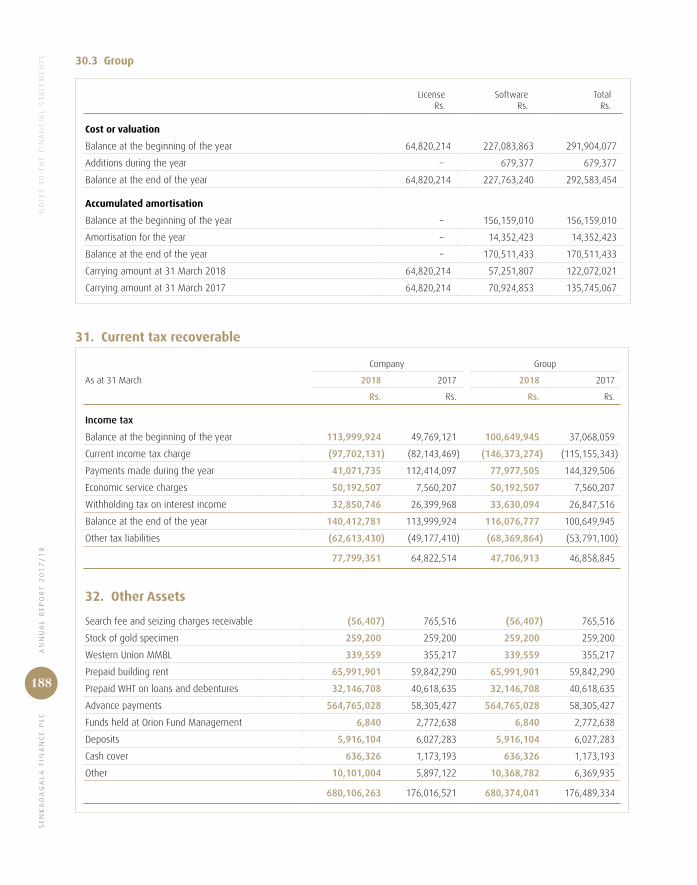
SE
NK
AD
AG
AL
A F
INA
NC
E P
LC
AN
NU
AL
RE
PO
RT
20
17
/1
8N
OT
ES
TO
TH
E F
INA
NC
IAL
ST
AT
EM
EN
TS
188
30.3 Group
License Rs.
Software Rs.
Total Rs.
Cost or valuation
Balance at the beginning of the year 64,820,214 227,083,863 291,904,077
Additions during the year – 679,377 679,377
Balance at the end of the year 64,820,214 227,763,240 292,583,454
Accumulated amortisation
Balance at the beginning of the year – 156,159,010 156,159,010
Amortisation for the year – 14,352,423 14,352,423
Balance at the end of the year – 170,511,433 170,511,433
Carrying amount at 31 March 2018 64,820,214 57,251,807 122,072,021
Carrying amount at 31 March 2017 64,820,214 70,924,853 135,745,067
31. Current tax recoverable
Company Group
As at 31 March 2018 2017 2018 2017
Rs. Rs. Rs. Rs.
Income tax
Balance at the beginning of the year 113,999,924 49,769,121 100,649,945 37,068,059
Current income tax charge (97,702,131) (82,143,469) (146,373,274) (115,155,343)
Payments made during the year 41,071,735 112,414,097 77,977,505 144,329,506
Economic service charges 50,192,507 7,560,207 50,192,507 7,560,207
Withholding tax on interest income 32,850,746 26,399,968 33,630,094 26,847,516
Balance at the end of the year 140,412,781 113,999,924 116,076,777 100,649,945
Other tax liabilities (62,613,430) (49,177,410) (68,369,864) (53,791,100)
77,799,351 64,822,514 47,706,913 46,858,845
32. Other Assets
Search fee and seizing charges receivable (56,407) 765,516 (56,407) 765,516
Stock of gold specimen 259,200 259,200 259,200 259,200
Western Union MMBL 339,559 355,217 339,559 355,217
Prepaid building rent 65,991,901 59,842,290 65,991,901 59,842,290
Prepaid WHT on loans and debentures 32,146,708 40,618,635 32,146,708 40,618,635
Advance payments 564,765,028 58,305,427 564,765,028 58,305,427
Funds held at Orion Fund Management 6,840 2,772,638 6,840 2,772,638
Deposits 5,916,104 6,027,283 5,916,104 6,027,283
Cash cover 636,326 1,173,193 636,326 1,173,193
Other 10,101,004 5,897,122 10,368,782 6,369,935
680,106,263 176,016,521 680,374,041 176,489,334

AN
NU
AL
RE
PO
RT
20
17
/1
8 S
EN
KA
DA
GA
LA
FIN
AN
CE
PL
CN
OT
ES
TO
TH
E F
INA
NC
IAL
ST
AT
EM
EN
TS
189
Company Group
As at 31 March 2018 2017 2018 2017
Rs. Rs. Rs. Rs.
33. Due to BanksBank overdrafts 82,833,778 170,304,189 134,547,012 174,156,209
Asset securitised loans 5,925,892,788 6,810,673,525 5,925,892,788 6,810,673,525
6,008,726,566 6,980,977,714 6,060,439,800 6,984,829,734
Securities pledged
Senkadagala Finance PLC has issued a promissory note amounting to Rs. 400,000,000/- as security for the loan obtained from
DFCC Bank PLC.
Lease and hire purchase aggregate portfolio amounting to Rs. 4,772,542,356/- (2017- Rs. 4,910,042,254/-) have been pledged
as security for the other bank loans.
In the ordinary course of business, the Company enters into transactions that result in the transfer of financial assets to third
parties, The information above sets out the extent of such transfers and retained interest in transferred assets.
The Company has transferred future rental receivable of leases and hire purchases, but has retained substantially all credit
risk associated with the transferred assets. Due to the retention of substantially, all the risk and rewards on these assets, the
Company continues to recognise these assets within lease rental receivable and hire purchase receivable.
Company Group
As at 31 March 2018 2017 2018 2017
Note Rs. Rs. Rs. Rs.
34. Deposits from CustomersSavings deposits 382,277,210 341,771,214 382,277,210 341,771,214
Certificates of deposit 34.1 7,729,774 10,548,068 7,729,774 10,548,068
Fixed deposits 34.2 9,117,126,806 6,878,553,283 9,075,448,350 6,852,195,270
9,507,133,790 7,230,872,565 9,465,455,334 7,204,514,552
34.1 Certificates of deposit
Face value 7,800,000 10,800,000 7,800,000 10,800,000
Interest in suspense (70,226) (251,932) (70,226) (251,932)
7,729,774 10,548,068 7,729,774 10,548,068

SE
NK
AD
AG
AL
A F
INA
NC
E P
LC
AN
NU
AL
RE
PO
RT
20
17
/1
8N
OT
ES
TO
TH
E F
INA
NC
IAL
ST
AT
EM
EN
TS
190
Company Group
As at 31 March 2018 2017 2018 2017
Note Rs. Rs. Rs. Rs.
34.2 Fixed deposits
Fixed deposits 8,834,580,054 6,650,391,472 8,793,650,731 6,625,833,092
Amortised interest payable 282,546,752 228,161,811 281,797,619 226,362,178
9,117,126,806 6,878,553,283 9,075,448,350 6,852,195,270
35. Other Borrowings
Commercial paper 35.1 1,057,693,978 1,917,447,375 1,057,693,978 1,917,447,375
Asset securitised loans 35.2 8,309,938,787 4,845,306,476 8,309,938,787 4,845,306,476
9,367,632,765 6,762,753,851 9,367,632,765 6,762,753,851
35.1 Commercial paper
Commercial paper capital outstanding 1,000,000,000 1,840,000,000 1,000,000,000 1,840,000,000
Amortised interest payable 57,693,978 77,447,375 57,693,978 77,447,375
1,057,693,978 1,917,447,375 1,057,693,978 1,917,447,375
35.2 Asset securitised loans
Assets securitisation loans capital outstanding 5,562,510,000 4,226,864,920 5,562,510,000 4,226,864,920
Borrowings from International Finance Corporation (IFC) 2,558,960,000 419,027,000 2,558,960,000 419,027,000
Amortised interest payable 188,468,787 199,414,556 188,468,787 199,414,556
8,309,938,787 4,845,306,476 8,309,938,787 4,845,306,476
Securities pledged
Lease and hire purchase aggregate portfolio amounting to Rs. 6,938,770,694/- (2017 – Rs. 4,769,729,417/–) have been pledged
as security for the above loans.
In the ordinary course of business the Company enters into transactions that result in the transfer of financial assets to third
parties, The information above sets out the extent of such transfers and retained interest in transferred assets.
The Company has transferred future rental receivable of leases and hire purchases, but has retained substantially, all of the
credit risk associated with the transferred assets. Due to the retention of substantially all the risk and rewards on these assets,
the Company continues to recognise these assets within lease rental receivable and hire purchase receivable.
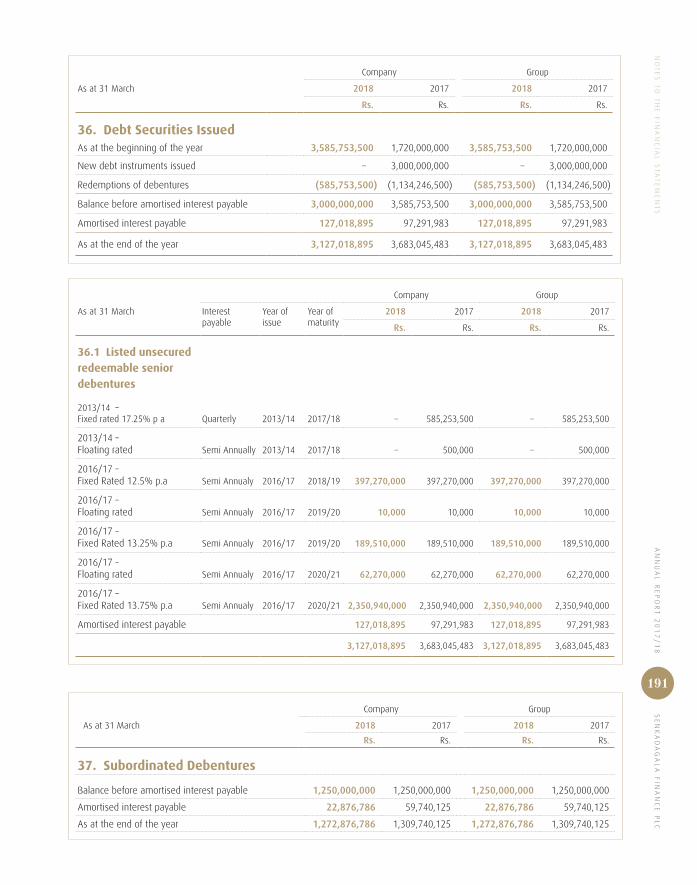
AN
NU
AL
RE
PO
RT
20
17
/1
8 S
EN
KA
DA
GA
LA
FIN
AN
CE
PL
CN
OT
ES
TO
TH
E F
INA
NC
IAL
ST
AT
EM
EN
TS
191
Company Group
As at 31 March 2018 2017 2018 2017
Rs. Rs. Rs. Rs.
36. Debt Securities IssuedAs at the beginning of the year 3,585,753,500 1,720,000,000 3,585,753,500 1,720,000,000
New debt instruments issued – 3,000,000,000 – 3,000,000,000
Redemptions of debentures (585,753,500) (1,134,246,500) (585,753,500) (1,134,246,500)
Balance before amortised interest payable 3,000,000,000 3,585,753,500 3,000,000,000 3,585,753,500
Amortised interest payable 127,018,895 97,291,983 127,018,895 97,291,983
As at the end of the year 3,127,018,895 3,683,045,483 3,127,018,895 3,683,045,483
Company Group
As at 31 March Interestpayable
Year ofissue
Year ofmaturity
2018 2017 2018 2017
Rs. Rs. Rs. Rs.
36.1 Listed unsecured redeemable senior debentures
2013/14 – Fixed rated 17.25% p a Quarterly 2013/14 2017/18 – 585,253,500 – 585,253,500
2013/14 – Floating rated Semi Annually 2013/14 2017/18 – 500,000 – 500,000
2016/17 – Fixed Rated 12.5% p.a Semi Annualy 2016/17 2018/19 397,270,000 397,270,000 397,270,000 397,270,000
2016/17 – Floating rated Semi Annualy 2016/17 2019/20 10,000 10,000 10,000 10,000
2016/17 – Fixed Rated 13.25% p.a Semi Annualy 2016/17 2019/20 189,510,000 189,510,000 189,510,000 189,510,000
2016/17 – Floating rated Semi Annualy 2016/17 2020/21 62,270,000 62,270,000 62,270,000 62,270,000
2016/17 – Fixed Rated 13.75% p.a Semi Annualy 2016/17 2020/21 2,350,940,000 2,350,940,000 2,350,940,000 2,350,940,000
Amortised interest payable 127,018,895 97,291,983 127,018,895 97,291,983
3,127,018,895 3,683,045,483 3,127,018,895 3,683,045,483
Company Group
As at 31 March 2018 2017 2018 2017
Rs. Rs. Rs. Rs.
37. Subordinated Debentures
Balance before amortised interest payable 1,250,000,000 1,250,000,000 1,250,000,000 1,250,000,000
Amortised interest payable 22,876,786 59,740,125 22,876,786 59,740,125
As at the end of the year 1,272,876,786 1,309,740,125 1,272,876,786 1,309,740,125
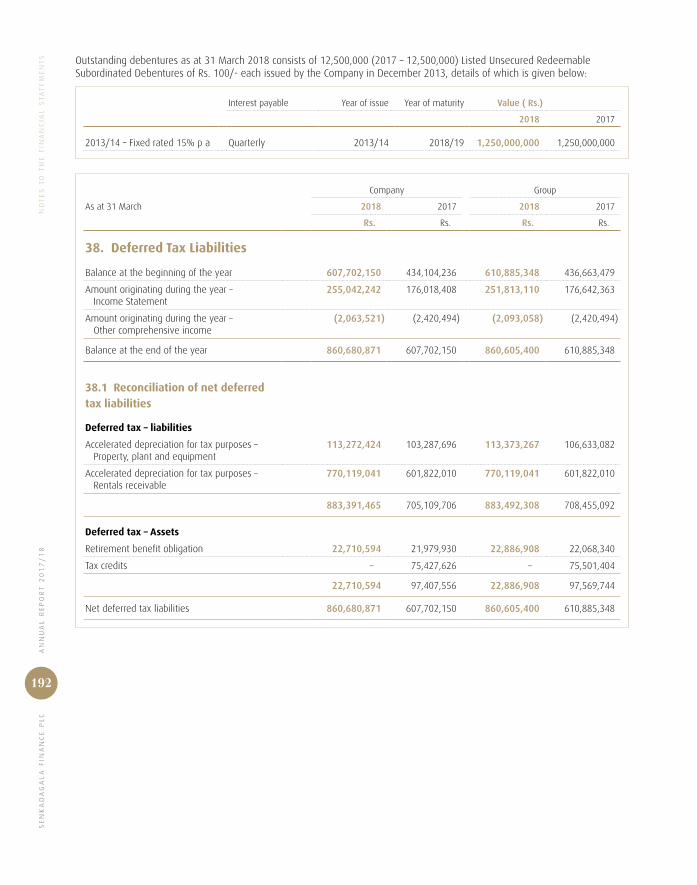
SE
NK
AD
AG
AL
A F
INA
NC
E P
LC
AN
NU
AL
RE
PO
RT
20
17
/1
8N
OT
ES
TO
TH
E F
INA
NC
IAL
ST
AT
EM
EN
TS
192
Outstanding debentures as at 31 March 2018 consists of 12,500,000 (2017 – 12,500,000) Listed Unsecured Redeemable Subordinated Debentures of Rs. 100/- each issued by the Company in December 2013, details of which is given below:
Interest payable Year of issue Year of maturity Value ( Rs.)
2018 2017
2013/14 – Fixed rated 15% p a Quarterly 2013/14 2018/19 1,250,000,000 1,250,000,000
Company Group
As at 31 March 2018 2017 2018 2017
Rs. Rs. Rs. Rs.
38. Deferred Tax Liabilities
Balance at the beginning of the year 607,702,150 434,104,236 610,885,348 436,663,479
Amount originating during the year – Income Statement
255,042,242 176,018,408 251,813,110 176,642,363
Amount originating during the year – Other comprehensive income
(2,063,521) (2,420,494) (2,093,058) (2,420,494)
Balance at the end of the year 860,680,871 607,702,150 860,605,400 610,885,348
38.1 Reconciliation of net deferred tax liabilities
Deferred tax – liabilities
Accelerated depreciation for tax purposes – Property, plant and equipment
113,272,424 103,287,696 113,373,267 106,633,082
Accelerated depreciation for tax purposes – Rentals receivable
770,119,041 601,822,010 770,119,041 601,822,010
883,391,465 705,109,706 883,492,308 708,455,092
Deferred tax – Assets
Retirement benefit obligation 22,710,594 21,979,930 22,886,908 22,068,340
Tax credits – 75,427,626 – 75,501,404
22,710,594 97,407,556 22,886,908 97,569,744
Net deferred tax liabilities 860,680,871 607,702,150 860,605,400 610,885,348
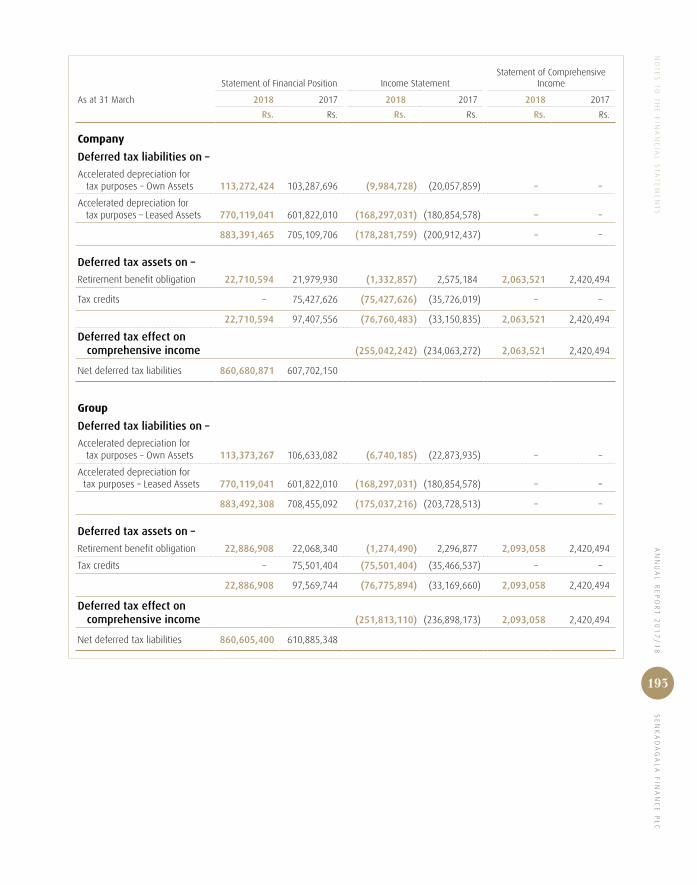
AN
NU
AL
RE
PO
RT
20
17
/1
8 S
EN
KA
DA
GA
LA
FIN
AN
CE
PL
CN
OT
ES
TO
TH
E F
INA
NC
IAL
ST
AT
EM
EN
TS
193
Statement of Financial Position Income StatementStatement of Comprehensive
Income
As at 31 March 2018 2017 2018 2017 2018 2017
Rs. Rs. Rs. Rs. Rs. Rs.
Company
Deferred tax liabilities on –
Accelerated depreciation for tax purposes – Own Assets 113,272,424 103,287,696 (9,984,728) (20,057,859) – –
Accelerated depreciation for tax purposes – Leased Assets 770,119,041 601,822,010 (168,297,031) (180,854,578) – –
883,391,465 705,109,706 (178,281,759) (200,912,437) – –
Deferred tax assets on –
Retirement benefit obligation 22,710,594 21,979,930 (1,332,857) 2,575,184 2,063,521 2,420,494
Tax credits – 75,427,626 (75,427,626) (35,726,019) – –
22,710,594 97,407,556 (76,760,483) (33,150,835) 2,063,521 2,420,494
Deferred tax effect on comprehensive income (255,042,242) (234,063,272) 2,063,521 2,420,494
Net deferred tax liabilities 860,680,871 607,702,150
Group
Deferred tax liabilities on –
Accelerated depreciation for tax purposes – Own Assets 113,373,267 106,633,082 (6,740,185) (22,873,935) – –
Accelerated depreciation for tax purposes – Leased Assets 770,119,041 601,822,010 (168,297,031) (180,854,578) – –
883,492,308 708,455,092 (175,037,216) (203,728,513) – –
Deferred tax assets on –
Retirement benefit obligation 22,886,908 22,068,340 (1,274,490) 2,296,877 2,093,058 2,420,494
Tax credits – 75,501,404 (75,501,404) (35,466,537) – –
22,886,908 97,569,744 (76,775,894) (33,169,660) 2,093,058 2,420,494
Deferred tax effect on comprehensive income (251,813,110) (236,898,173) 2,093,058 2,420,494
Net deferred tax liabilities 860,605,400 610,885,348

SE
NK
AD
AG
AL
A F
INA
NC
E P
LC
AN
NU
AL
RE
PO
RT
20
17
/1
8N
OT
ES
TO
TH
E F
INA
NC
IAL
ST
AT
EM
EN
TS
194
Company Group
As at 31 March 2018 2017 2018 2017
Rs. Rs. Rs. Rs.
39. Amount due to/(from) related company
Newest Capital Limited 291,578,050 (25,976) – –
291,578,050 (25,976) – –
Company Group
As at 31 March 2018 2017 2018 2017
Rs. Rs. Rs. Rs.
40. Other LiabilitiesAccured expenditure – Non-interest 8,766,000 1,540,000 9,123,898 1,864,834
Payable to suppliers 495,312,605 561,491,990 495,312,605 561,491,990
Dividend payable 6,265,873 5,337,371 6,265,873 5,337,371
Value added tax payable 1,682,363 10,005,605 5,352,565 12,967,793
Deposit insurance premium 1,100,000 833,087 1,100,000 833,087
Other liabilities 42,393,225 24,409,286 42,617,475 29,469,536
555,520,066 603,617,339 559,772,416 611,964,611
Company Group
As at 31 March Note 2018 2017 2018 2017
Rs. Rs. Rs. Rs.
41. Employee BenefitsBalance at the beginning of the year 78,499,749 59,440,712 78,848,705 59,659,648
Retirement benefit expense recognised in the Income Statement 41.1 16,512,685 11,831,774 16,687,932 11,961,794
Retirement benefit expense recognised in the Statement of Comprehensive Income 41.2 6,400,199 9,821,118 (6,505,690) 9,821,118
Benefits paid during the year (20,303,369) (2,593,855) (20,303,369) (2,593,855)
Balance at the end of the year 81,109,264 78,499,749 81,738,958 78,848,705

AN
NU
AL
RE
PO
RT
20
17
/1
8 S
EN
KA
DA
GA
LA
FIN
AN
CE
PL
CN
OT
ES
TO
TH
E F
INA
NC
IAL
ST
AT
EM
EN
TS
195
Company Group
As at 31 March 2018 2017 2018 2017
Rs. Rs. Rs. Rs.
41.1 Retirement benefit expense recognised in the Income Statement
Current service cost 7,877,713 6,978,068 8,017,018 7,119,504
Interest cost 8,634,972 6,069,149 8,670,914 6,069,149
Total 16,512,685 13,047,217 16,687,932 13,188,653
41.2 Retirement benefit expense recognised in the Statement of Comprehensive Income
Actuarial loss at the end of the year 6,400,199 9,821,118 6,505,690 9,821,118
6,400,199 9,821,118 6,505,690 9,821,118
Mr Piyal S Goonathilake FSA(USA), a member of the American Academy of Actuaries has carried out an independent actuarial
valuation of the defined benefit obligation as at 31 March 2018. The valuation was carried out using the Projected Unit Credit
Acturial Cost Method, the method recommended by Sri Lanka Accounting Standard – LKAS 19 – Defined benefit obligations.
2018 2017
Discount rate 10.5% 11%
Salary scale 7.5% 7.5%
Retirement age 55 Years 55 Years
The following table demonstrates the sensitivity to a reasonably possible change in the key assumptions employed with all
other variables held constant in the employment benefit liability measurement.
The sensitivity of the Income Statement and Statement of Financial Position is the effect of the assumed changes in discount
rate and salary increment rate on the Income Statement and employment benefit obligation for the year.
Increase/(Decrease) in discount rate
Increase/(Decrease) in salary increment rate
Sensitivity effect on incomestatement increase/(Reduction)
in results for the year Rs.’000
Sensitivity effect on employmentbenefit obligation increase
(Reduction) in the liability Rs.’000
+1% – 3,921 (3,921)
-1% – (4,457) 4,457
– +1% (4,385) 4,385
– -1% 3,926 (3,926)

SE
NK
AD
AG
AL
A F
INA
NC
E P
LC
AN
NU
AL
RE
PO
RT
20
17
/1
8N
OT
ES
TO
TH
E F
INA
NC
IAL
ST
AT
EM
EN
TS
196
As at 31 March 2018 2017
No. of shares Value (Rs.) No. of shares Value (Rs.)
42. Stated Capital
Issued and fully paid shares
At the beginning of the year 65,227,555 1,008,062,200 65,227,555 1,008,062,200
Rights issue 7,247,506 579,800,480 – –
At the end of the year 72,475,061 1,587,862,680 65,227,555 1,008,062,200
In accordance with Companies Act No. 07 of 2007 the above shares do not have a par value.
Company Group
As at 31 March 2018 2017 2018 2017
Rs. Rs. Rs. Rs.
43. Statutory Reserve Fund
Balance at the beginning of the year 310,036,033 265,036,033 310,190,064 265,059,033
Transfers during the year 55,000,000 45,000,000 59,807,015 45,131,031
Balance at the end of the year 365,036,033 310,036,033 369,997,079 310,190,064
The Reserve Fund is maintained in compliance with Direction No. 1 of 2003 Central Bank of Sri Lanka (Capital Funds) issued to
finance companies.
As per the said Direction, every Licensed Finance Company shall maintain a Reserve Fund and transfer to such reserve fund out
of the net profits of each year, after due provisions has been made for taxation and bad and doubtful debts on following basis:
Capital funds to deposit liabilities % of transfer to reserve fund
Not less than 25% 5
Less than 25% and not less than 10% 20
Less than 10% 50
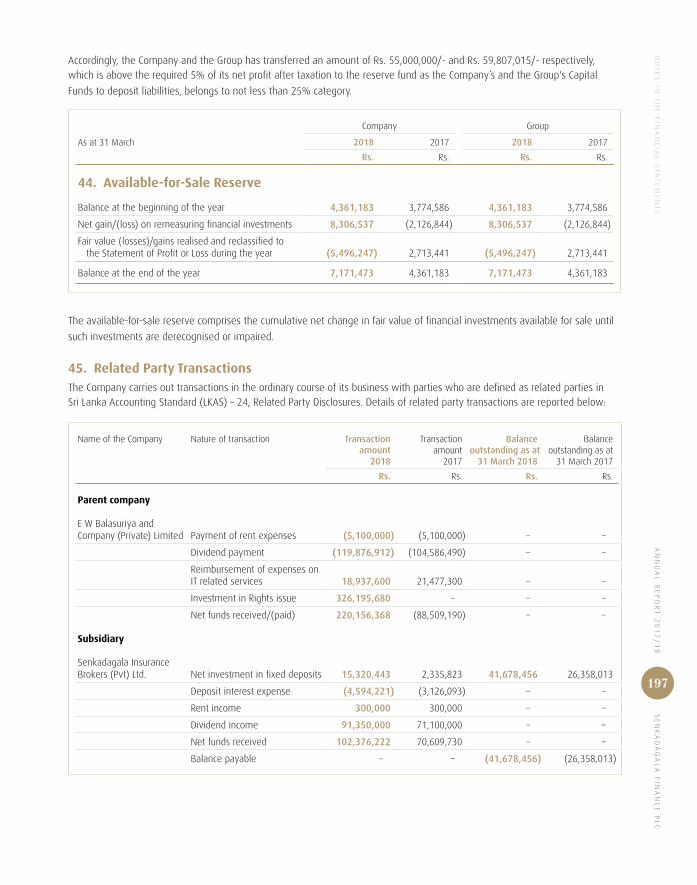
AN
NU
AL
RE
PO
RT
20
17
/1
8 S
EN
KA
DA
GA
LA
FIN
AN
CE
PL
CN
OT
ES
TO
TH
E F
INA
NC
IAL
ST
AT
EM
EN
TS
197
Accordingly, the Company and the Group has transferred an amount of Rs. 55,000,000/- and Rs. 59,807,015/- respectively, which is above the required 5% of its net profit after taxation to the reserve fund as the Company’s and the Group's Capital
Funds to deposit liabilities, belongs to not less than 25% category.
Company Group
As at 31 March 2018 2017 2018 2017
Rs. Rs. Rs. Rs.
44. Available-for-Sale Reserve
Balance at the beginning of the year 4,361,183 3,774,586 4,361,183 3,774,586
Net gain/(loss) on remeasuring financial investments 8,306,537 (2,126,844) 8,306,537 (2,126,844)
Fair value (losses)/gains realised and reclassified to the Statement of Profit or Loss during the year (5,496,247) 2,713,441 (5,496,247) 2,713,441
Balance at the end of the year 7,171,473 4,361,183 7,171,473 4,361,183
The available-for-sale reserve comprises the cumulative net change in fair value of financial investments available for sale until
such investments are derecognised or impaired.
45. Related Party TransactionsThe Company carries out transactions in the ordinary course of its business with parties who are defined as related parties in Sri Lanka Accounting Standard (LKAS) – 24, Related Party Disclosures. Details of related party transactions are reported below:
Name of the Company Nature of transaction Transaction amount
2018
Transaction amount
2017
Balance outstanding as at
31 March 2018
Balance outstanding as at
31 March 2017
Rs. Rs. Rs. Rs.
Parent company
E W Balasuriya and Company (Private) Limited Payment of rent expenses (5,100,000) (5,100,000) – –
Dividend payment (119,876,912) (104,586,490) – –
Reimbursement of expenses on IT related services 18,937,600 21,477,300 – –
Investment in Rights issue 326,195,680 – – –
Net funds received/(paid) 220,156,368 (88,509,190) – –
Subsidiary
Senkadagala Insurance Brokers (Pvt) Ltd. Net investment in fixed deposits 15,320,443 2,335,823 41,678,456 26,358,013
Deposit interest expense (4,594,221) (3,126,093) – –
Rent income 300,000 300,000 – –
Dividend income 91,350,000 71,100,000 – –
Net funds received 102,376,222 70,609,730 – –
Balance payable – – (41,678,456) (26,358,013)

SE
NK
AD
AG
AL
A F
INA
NC
E P
LC
AN
NU
AL
RE
PO
RT
20
17
/1
8N
OT
ES
TO
TH
E F
INA
NC
IAL
ST
AT
EM
EN
TS
198
Name of the Company Nature of transaction Transaction amount
2018
Transaction amount
2017
Balance outstanding as at
31 March 2018
Balance outstanding as at
31 March 2017
Rs. Rs. Rs. Rs.
Subsidiary
Newest Capital Limited Funds collected on behalf of Newest Capital Limited (14,508,000) (15,717,000)
Payment made on behalf of Newest Capital Limited 1,577,186 1,707,180
Reimbursement of expenses to Senkadagala Finance PLC 7,045,000 7,045,000
Net funds received (5,885,814) (6,964,820) –
Transfer of Investment property (289,000,000) –
Transfer of property, plant and Equipment (50,187) –
Transfer of Advanced received 3,627,000 –
Transfer of Insurance premium (295,026) –
Net balance of transfer payable (285,718,213) –
Balance Receivable/(Payable) – – (291,578,050) 25,976
Company under common control
Senkadagala Hotels Limited Payment of rent expense (803,719) (668,439) – –
Net funds paid (803,719) (668,439) – –
45.1 Transactions with Key Management Personnel (KMP) of the Company
According to Sri Lanka Accounting Standard – LKAS 24 Related Party Disclosures, Key Management Personnel, are those having
authority and responsibility for planning, directing and controlling the activities of the entity. Accordingly Senior Management
Team, Deputy CEO, CEO and the other members of the Board of Directors of the Company (including Executive and Non-Executive
Directors) and of the Ultimate Parent Company have been classified as Key Management Personnel of the Company.
For the year ended 31 March 2018 2017
Rs. Rs.
45.1.1 Compensation of key Management Personnel
Short-term Employee Benefits
Board of Directors 22,958,565 20,536,250
Other Key Management Personnel 71,131,450 62,802,080
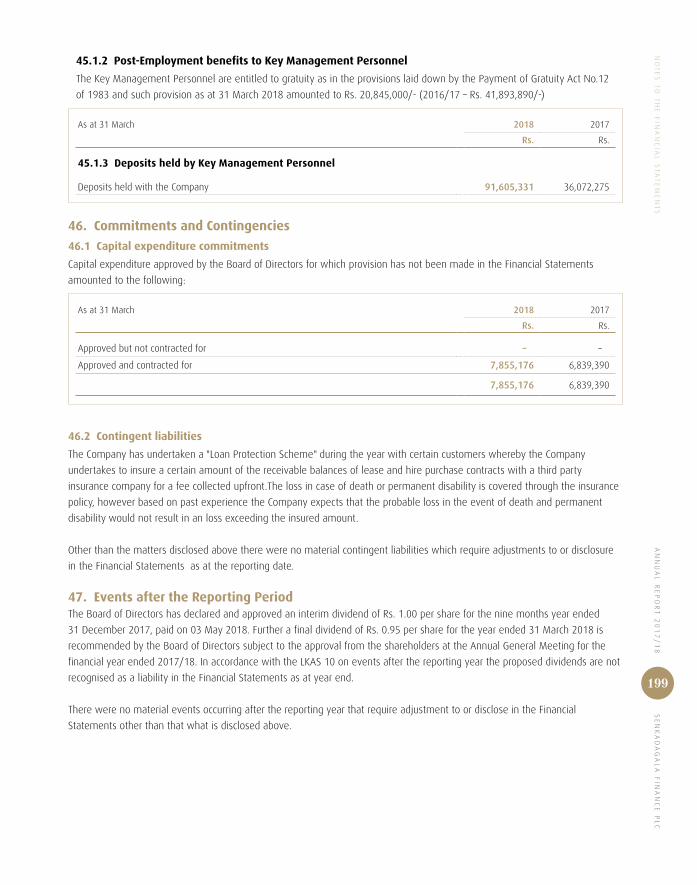
AN
NU
AL
RE
PO
RT
20
17
/1
8 S
EN
KA
DA
GA
LA
FIN
AN
CE
PL
CN
OT
ES
TO
TH
E F
INA
NC
IAL
ST
AT
EM
EN
TS
199
45.1.2 Post-Employment benefits to Key Management Personnel
The Key Management Personnel are entitled to gratuity as in the provisions laid down by the Payment of Gratuity Act No.12
of 1983 and such provision as at 31 March 2018 amounted to Rs. 20,845,000/- (2016/17 – Rs. 41,893,890/-)
As at 31 March 2018 2017
Rs. Rs.
45.1.3 Deposits held by Key Management Personnel
Deposits held with the Company 91,605,331 36,072,275
46. Commitments and Contingencies
46.1 Capital expenditure commitments
Capital expenditure approved by the Board of Directors for which provision has not been made in the Financial Statements
amounted to the following:
As at 31 March 2018 2017
Rs. Rs.
Approved but not contracted for – –
Approved and contracted for 7,855,176 6,839,390
7,855,176 6,839,390
46.2 Contingent liabilities
The Company has undertaken a "Loan Protection Scheme" during the year with certain customers whereby the Company
undertakes to insure a certain amount of the receivable balances of lease and hire purchase contracts with a third party
insurance company for a fee collected upfront.The loss in case of death or permanent disability is covered through the insurance
policy, however based on past experience the Company expects that the probable loss in the event of death and permanent
disability would not result in an loss exceeding the insured amount.
Other than the matters disclosed above there were no material contingent liabilities which require adjustments to or disclosure
in the Financial Statements as at the reporting date.
47. Events after the Reporting PeriodThe Board of Directors has declared and approved an interim dividend of Rs. 1.00 per share for the nine months year ended
31 December 2017, paid on 03 May 2018. Further a final dividend of Rs. 0.95 per share for the year ended 31 March 2018 is
recommended by the Board of Directors subject to the approval from the shareholders at the Annual General Meeting for the
financial year ended 2017/18. In accordance with the LKAS 10 on events after the reporting year the proposed dividends are not
recognised as a liability in the Financial Statements as at year end.
There were no material events occurring after the reporting year that require adjustment to or disclose in the Financial
Statements other than that what is disclosed above.
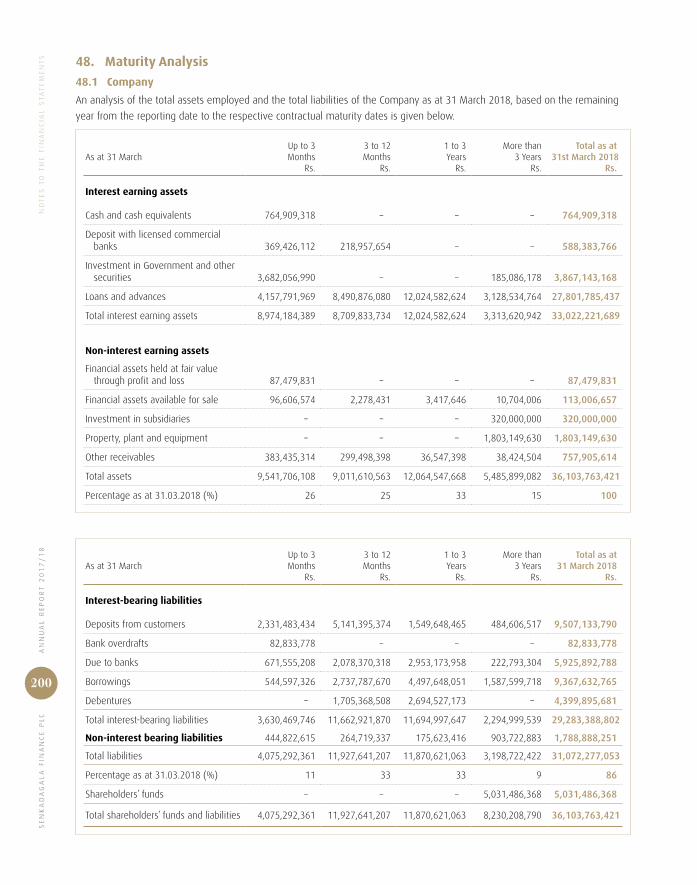
SE
NK
AD
AG
AL
A F
INA
NC
E P
LC
AN
NU
AL
RE
PO
RT
20
17
/1
8N
OT
ES
TO
TH
E F
INA
NC
IAL
ST
AT
EM
EN
TS
200
48. Maturity Analysis
48.1 Company
An analysis of the total assets employed and the total liabilities of the Company as at 31 March 2018, based on the remaining
year from the reporting date to the respective contractual maturity dates is given below.
As at 31 March Up to 3 Months
Rs.
3 to 12 Months
Rs.
1 to 3 Years
Rs.
More than 3 Years
Rs.
Total as at 31st March 2018
Rs.
Interest earning assets
Cash and cash equivalents 764,909,318 – – – 764,909,318
Deposit with licensed commercial banks 369,426,112 218,957,654 – – 588,383,766
Investment in Government and other securities 3,682,056,990 – – 185,086,178 3,867,143,168
Loans and advances 4,157,791,969 8,490,876,080 12,024,582,624 3,128,534,764 27,801,785,437
Total interest earning assets 8,974,184,389 8,709,833,734 12,024,582,624 3,313,620,942 33,022,221,689
Non-interest earning assets
Financial assets held at fair value through profit and loss 87,479,831 – – – 87,479,831
Financial assets available for sale 96,606,574 2,278,431 3,417,646 10,704,006 113,006,657
Investment in subsidiaries – – – 320,000,000 320,000,000
Property, plant and equipment – – – 1,803,149,630 1,803,149,630
Other receivables 383,435,314 299,498,398 36,547,398 38,424,504 757,905,614
Total assets 9,541,706,108 9,011,610,563 12,064,547,668 5,485,899,082 36,103,763,421
Percentage as at 31.03.2018 (%) 26 25 33 15 100
As at 31 March Up to 3 Months
Rs.
3 to 12 Months
Rs.
1 to 3 Years
Rs.
More than 3 Years
Rs.
Total as at 31 March 2018
Rs.
Interest-bearing liabilities
Deposits from customers 2,331,483,434 5,141,395,374 1,549,648,465 484,606,517 9,507,133,790
Bank overdrafts 82,833,778 – – – 82,833,778
Due to banks 671,555,208 2,078,370,318 2,953,173,958 222,793,304 5,925,892,788
Borrowings 544,597,326 2,737,787,670 4,497,648,051 1,587,599,718 9,367,632,765
Debentures – 1,705,368,508 2,694,527,173 – 4,399,895,681
Total interest-bearing liabilities 3,630,469,746 11,662,921,870 11,694,997,647 2,294,999,539 29,283,388,802
Non-interest bearing liabilities 444,822,615 264,719,337 175,623,416 903,722,883 1,788,888,251
Total liabilities 4,075,292,361 11,927,641,207 11,870,621,063 3,198,722,422 31,072,277,053
Percentage as at 31.03.2018 (%) 11 33 33 9 86
Shareholders’ funds – – – 5,031,486,368 5,031,486,368
Total shareholders’ funds and liabilities 4,075,292,361 11,927,641,207 11,870,621,063 8,230,208,790 36,103,763,421
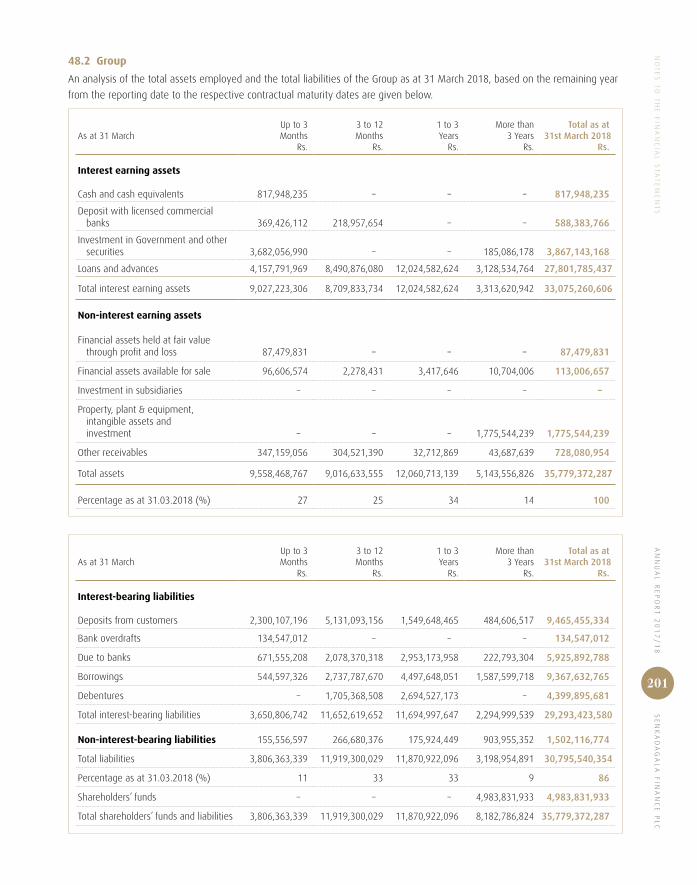
AN
NU
AL
RE
PO
RT
20
17
/1
8 S
EN
KA
DA
GA
LA
FIN
AN
CE
PL
CN
OT
ES
TO
TH
E F
INA
NC
IAL
ST
AT
EM
EN
TS
201
48.2 Group
An analysis of the total assets employed and the total liabilities of the Group as at 31 March 2018, based on the remaining year
from the reporting date to the respective contractual maturity dates are given below.
As at 31 March Up to 3 Months
Rs.
3 to 12 Months
Rs.
1 to 3 Years
Rs.
More than 3 Years
Rs.
Total as at 31st March 2018
Rs.
Interest earning assets
Cash and cash equivalents 817,948,235 – – – 817,948,235
Deposit with licensed commercial banks 369,426,112 218,957,654 – – 588,383,766
Investment in Government and other securities 3,682,056,990 – – 185,086,178 3,867,143,168
Loans and advances 4,157,791,969 8,490,876,080 12,024,582,624 3,128,534,764 27,801,785,437
Total interest earning assets 9,027,223,306 8,709,833,734 12,024,582,624 3,313,620,942 33,075,260,606
Non-interest earning assets
Financial assets held at fair value through profit and loss 87,479,831 – – – 87,479,831
Financial assets available for sale 96,606,574 2,278,431 3,417,646 10,704,006 113,006,657
Investment in subsidiaries – – – – –
Property, plant & equipment, intangible assets and investment – – – 1,775,544,239 1,775,544,239
Other receivables 347,159,056 304,521,390 32,712,869 43,687,639 728,080,954
Total assets 9,558,468,767 9,016,633,555 12,060,713,139 5,143,556,826 35,779,372,287
Percentage as at 31.03.2018 (%) 27 25 34 14 100
As at 31 March Up to 3 Months
Rs.
3 to 12 Months
Rs.
1 to 3 Years
Rs.
More than 3 Years
Rs.
Total as at 31st March 2018
Rs.
Interest-bearing liabilities
Deposits from customers 2,300,107,196 5,131,093,156 1,549,648,465 484,606,517 9,465,455,334
Bank overdrafts 134,547,012 – – – 134,547,012
Due to banks 671,555,208 2,078,370,318 2,953,173,958 222,793,304 5,925,892,788
Borrowings 544,597,326 2,737,787,670 4,497,648,051 1,587,599,718 9,367,632,765
Debentures – 1,705,368,508 2,694,527,173 – 4,399,895,681
Total interest-bearing liabilities 3,650,806,742 11,652,619,652 11,694,997,647 2,294,999,539 29,293,423,580
Non-interest-bearing liabilities 155,556,597 266,680,376 175,924,449 903,955,352 1,502,116,774
Total liabilities 3,806,363,339 11,919,300,029 11,870,922,096 3,198,954,891 30,795,540,354
Percentage as at 31.03.2018 (%) 11 33 33 9 86
Shareholders’ funds – – – 4,983,831,933 4,983,831,933
Total shareholders’ funds and liabilities 3,806,363,339 11,919,300,029 11,870,922,096 8,182,786,824 35,779,372,287

SE
NK
AD
AG
AL
A F
INA
NC
E P
LC
AN
NU
AL
RE
PO
RT
20
17
/1
8N
OT
ES
TO
TH
E F
INA
NC
IAL
ST
AT
EM
EN
TS
202
Leasing Hire purchases Pawning advances Other advances Investments Insurance Brokering Unallocated Total
As at 31 March 2018 2017 2018 2017 2018 2017 2018 2017 2018 2017 2018 2017 2018 2017 2018 2017
Rs. Rs. Rs. Rs. Rs. Rs. Rs. Rs. Rs. Rs. Rs. Rs. Rs. Rs. Rs. Rs.
49. Segment Report
Revenue
External customers
Interest 4,991,364,071 3,679,082,591 154,688,500 406,361,500 176,624,867 76,331,490 805,032,870 371,055,097 346,454,657 294,715,801 – – – – 6,474,164,965 4,827,546,479
Trading – – – – – – – – 9,168,015 (91,989) – – 110,530 107,651 9,278,545 15,662
Commissions – – – – – – – – – – 144,121,384 120,067,994 – – 144,121,384 120,067,994
Rent – – – – – – – – 19,990,913 17,714,933 – – – – 19,990,913 17,714,933
Dividends – – – – – – – – 2,918,382 2,734,412 – – – – 2,918,382 2,734,412
Other income 37,898,029 70,405,168 – – – – – – 66,838,726 61,871,807 – – 78,170,654 91,789,008 182,907,409 224,065,983
Total revenue 5,029,262,100 3,749,487,759 154,688,500 406,361,500 176,624,867 76,331,490 805,032,870 371,055,097 445,370,693 376,944,964 144,121,384 120,067,994 78,281,184 91,896,659 6,833,381,598 5,192,145,463
Profit before tax 1,410,678,709 1,168,625,904
Taxation (408,336,384) (299,697,706)
Profit after tax 1,002,342,325 868,928,198
Segment Assets 23,887,236,580 20,014,694,207 162,468,190 645,872,482 993,680,335 548,402,600 2,758,400,332 2,548,618,773 6,361,542,540 5,996,148,705 58,269,578 22,352,634 1,557,774,732 1,086,861,157 35,779,372,287 30,862,950,558
Segment Liabilities 23,110,865,190 20,130,162,242 710,836,898 2,181,664,120 811,640,636 409,806,719 3,699,351,070 1,992,111,932 2,046,602,829 2,023,733,312 56,405,448 7,627,277 359,838,283 501,476,807 30,795,540,354 27,246,582,409
Information on Cash flows
Operating activities 28,616,191 (2,582,626,854) 293,036,948 334,318,766 (16,280,426) (91,944,715) 5,337,273 (459,164,134) (989,793,575) (2,785,970,591) 67,579,788 61,853,878 (330,497,035) (320,046,155) (942,000,836) (5,843,579,805)
Investing activities – – – – – – – – (25,857,131) (57,866,552) – – 124,505,757 115,919,852 98,648,626 58,053,300
Capital expenditure (240,159,747) (415,905,052) (1,633,438) (13,421,221) (9,990,357) (11,395,798) (27,732,665) (52,960,261) (63,958,275) (124,599,882) (536,760) – (15,661,702) (28,988,728) (359,672,944) (647,270,942)
Financing activities – – – – – – – – – – – – 1,439,853,512 6,566,518,712 1,439,853,512 6,566,518,712
Net cash flow (211,543,556) (2,998,531,906) 291,403,510 320,897,545 (26,270,783) (103,340,513) (22,395,392) (512,124,395) (1,079,608,981) (2,968,437,025) 67,043,028 61,853,878 1,218,200,532 6,333,403,681 236,828,358 133,721,265
Depreciation and amortisation (247,549,463) (213,831,068) (1,683,699) (6,900,310) (10,297,760) (5,858,971) (28,585,999) (27,228,689) – (303,038) (1,198,546) (1,734,639) (19,173,569) (14,641,105) (308,489,036) (270,497,820)
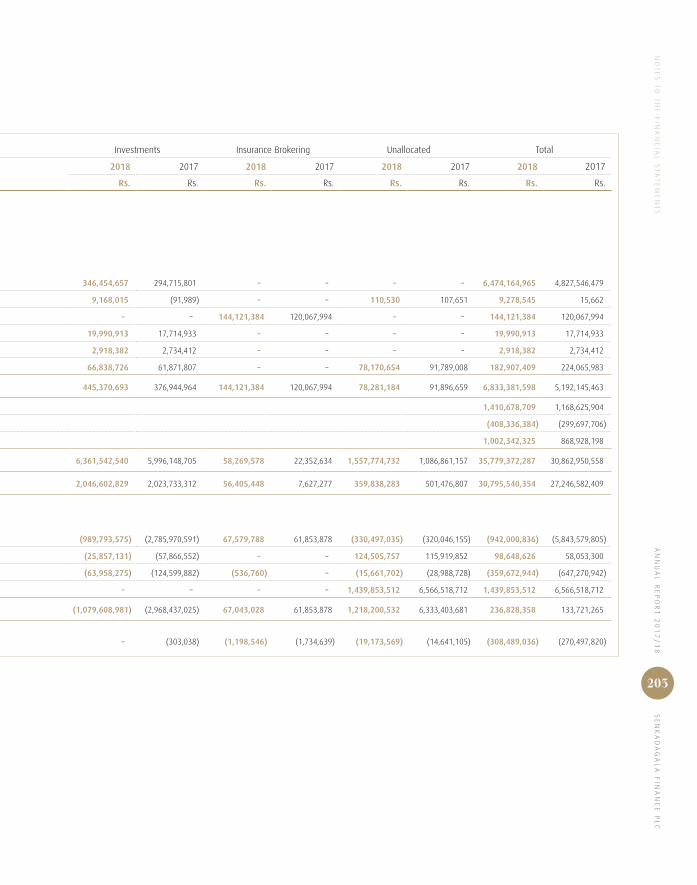
AN
NU
AL
RE
PO
RT
20
17
/1
8 S
EN
KA
DA
GA
LA
FIN
AN
CE
PL
CN
OT
ES
TO
TH
E F
INA
NC
IAL
ST
AT
EM
EN
TS
203
Leasing Hire purchases Pawning advances Other advances Investments Insurance Brokering Unallocated Total
As at 31 March 2018 2017 2018 2017 2018 2017 2018 2017 2018 2017 2018 2017 2018 2017 2018 2017
Rs. Rs. Rs. Rs. Rs. Rs. Rs. Rs. Rs. Rs. Rs. Rs. Rs. Rs. Rs. Rs.
49. Segment Report
Revenue
External customers
Interest 4,991,364,071 3,679,082,591 154,688,500 406,361,500 176,624,867 76,331,490 805,032,870 371,055,097 346,454,657 294,715,801 – – – – 6,474,164,965 4,827,546,479
Trading – – – – – – – – 9,168,015 (91,989) – – 110,530 107,651 9,278,545 15,662
Commissions – – – – – – – – – – 144,121,384 120,067,994 – – 144,121,384 120,067,994
Rent – – – – – – – – 19,990,913 17,714,933 – – – – 19,990,913 17,714,933
Dividends – – – – – – – – 2,918,382 2,734,412 – – – – 2,918,382 2,734,412
Other income 37,898,029 70,405,168 – – – – – – 66,838,726 61,871,807 – – 78,170,654 91,789,008 182,907,409 224,065,983
Total revenue 5,029,262,100 3,749,487,759 154,688,500 406,361,500 176,624,867 76,331,490 805,032,870 371,055,097 445,370,693 376,944,964 144,121,384 120,067,994 78,281,184 91,896,659 6,833,381,598 5,192,145,463
Profit before tax 1,410,678,709 1,168,625,904
Taxation (408,336,384) (299,697,706)
Profit after tax 1,002,342,325 868,928,198
Segment Assets 23,887,236,580 20,014,694,207 162,468,190 645,872,482 993,680,335 548,402,600 2,758,400,332 2,548,618,773 6,361,542,540 5,996,148,705 58,269,578 22,352,634 1,557,774,732 1,086,861,157 35,779,372,287 30,862,950,558
Segment Liabilities 23,110,865,190 20,130,162,242 710,836,898 2,181,664,120 811,640,636 409,806,719 3,699,351,070 1,992,111,932 2,046,602,829 2,023,733,312 56,405,448 7,627,277 359,838,283 501,476,807 30,795,540,354 27,246,582,409
Information on Cash flows
Operating activities 28,616,191 (2,582,626,854) 293,036,948 334,318,766 (16,280,426) (91,944,715) 5,337,273 (459,164,134) (989,793,575) (2,785,970,591) 67,579,788 61,853,878 (330,497,035) (320,046,155) (942,000,836) (5,843,579,805)
Investing activities – – – – – – – – (25,857,131) (57,866,552) – – 124,505,757 115,919,852 98,648,626 58,053,300
Capital expenditure (240,159,747) (415,905,052) (1,633,438) (13,421,221) (9,990,357) (11,395,798) (27,732,665) (52,960,261) (63,958,275) (124,599,882) (536,760) – (15,661,702) (28,988,728) (359,672,944) (647,270,942)
Financing activities – – – – – – – – – – – – 1,439,853,512 6,566,518,712 1,439,853,512 6,566,518,712
Net cash flow (211,543,556) (2,998,531,906) 291,403,510 320,897,545 (26,270,783) (103,340,513) (22,395,392) (512,124,395) (1,079,608,981) (2,968,437,025) 67,043,028 61,853,878 1,218,200,532 6,333,403,681 236,828,358 133,721,265
Depreciation and amortisation (247,549,463) (213,831,068) (1,683,699) (6,900,310) (10,297,760) (5,858,971) (28,585,999) (27,228,689) – (303,038) (1,198,546) (1,734,639) (19,173,569) (14,641,105) (308,489,036) (270,497,820)
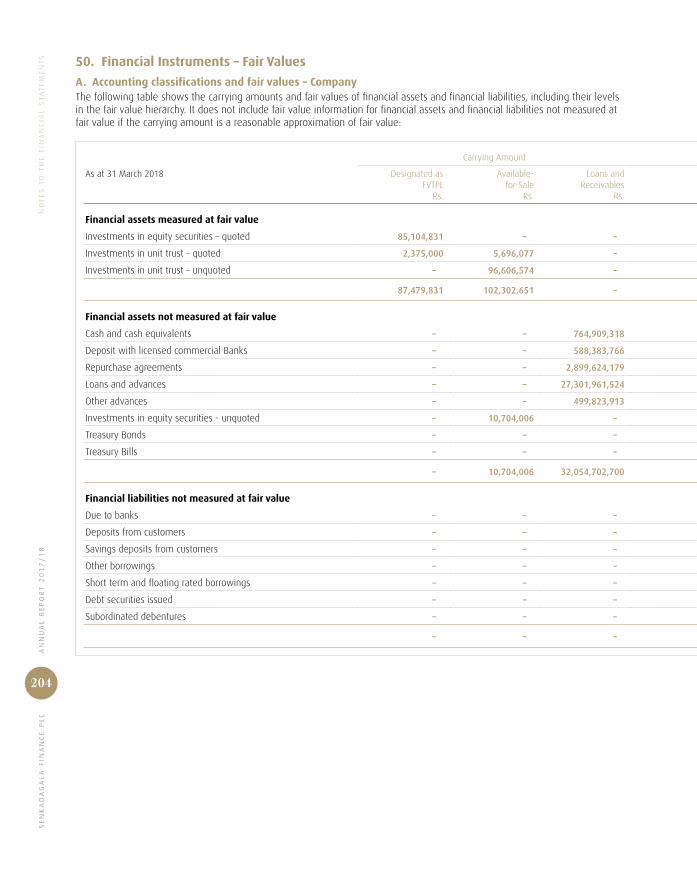
SE
NK
AD
AG
AL
A F
INA
NC
E P
LC
AN
NU
AL
RE
PO
RT
20
17
/1
8N
OT
ES
TO
TH
E F
INA
NC
IAL
ST
AT
EM
EN
TS
204
50. Financial Instruments – Fair Values
A. Accounting classifications and fair values – CompanyThe following table shows the carrying amounts and fair values of financial assets and financial liabilities, including their levels in the fair value hierarchy. It does not include fair value information for financial assets and financial liabilities not measured at fair value if the carrying amount is a reasonable approximation of fair value:
Carrying Amount Carrying Amount Fair Value
As at 31 March 2018 Designated as FVTPL
Rs.
Available-for-Sale
Rs.
Loans and Receivables
Rs.
Held-to-Maturity
Rs.
Other FinancialLiabilities
Rs.
Total
Rs.
Level 1
Rs.
Level 2
Rs.
Level 3
Rs.
Total
Rs.
Financial assets measured at fair value
Investments in equity securities – quoted 85,104,831 – – – – 85,104,831 85,104,831 – – 85,104,831
Investments in unit trust – quoted 2,375,000 5,696,077 – – – 8,071,077 8,071,077 – – 8,071,077
Investments in unit trust – unquoted – 96,606,574 – – – 96,606,574 – – 96,606,574 96,606,574
87,479,831 102,302,651 – – – 189,782,482 93,175,908 – 96,606,574 189,782,482
Financial assets not measured at fair value
Cash and cash equivalents – – 764,909,318 – – 764,909,318 – – – –
Deposit with licensed commercial Banks – – 588,383,766 – – 588,383,766 – – – –
Repurchase agreements – – 2,899,624,179 – – 2,899,624,179 – – – –
Loans and advances – – 27,301,961,524 – – 27,301,961,524 – – – –
Other advances – – 499,823,913 – – 499,823,913 – – – –
Investments in equity securities - unquoted – 10,704,006 – – – 10,704,006 – – – –
Treasury Bonds – – – 185,086,178 – 185,086,178 191,990,964 – – 191,990,964
Treasury Bills – – – 782,432,811 – 782,432,811 781,505,191 – – 781,505,191
– 10,704,006 32,054,702,700 967,518,989 – 33,032,925,695 973,496,155 – – 973,496,155
Financial liabilities not measured at fair value
Due to banks – – – – 6,008,726,566 6,008,726,566 – – – –
Deposits from customers – – – – 9,124,856,580 9,124,856,580 – – 9,341,484,219 9,341,484,219
Savings deposits from customers – – – – 382,277,210 382,277,210 – – – –
Other borrowings – – – – 864,650,046 864,650,046 – – 883,737,065 883,737,065
Short term and floating rated borrowings – – – – 8,502,982,719 8,502,982,719 – – – –
Debt securities issued – – – – 3,127,018,895 3,127,018,895 – – 3,096,319,007 3,096,319,007
Subordinated debentures – – – – 1,272,876,786 1,272,876,786 – – 1,288,858,155 1,288,858,155
– – – – 29,283,388,802 29,283,388,802 – – 14,610,398,446 14,610,398,446
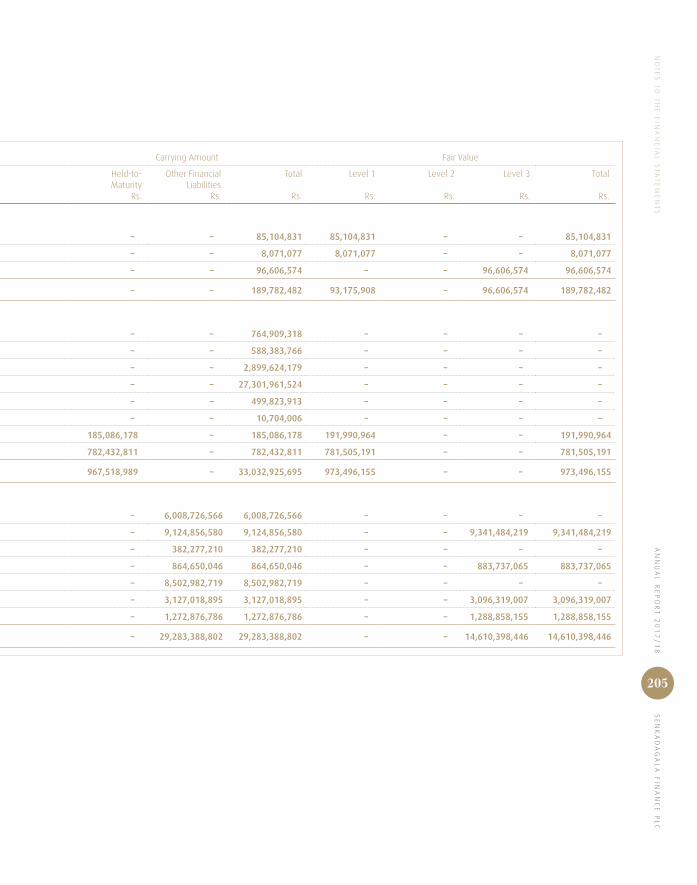
AN
NU
AL
RE
PO
RT
20
17
/1
8 S
EN
KA
DA
GA
LA
FIN
AN
CE
PL
CN
OT
ES
TO
TH
E F
INA
NC
IAL
ST
AT
EM
EN
TS
205
50. Financial Instruments – Fair Values
A. Accounting classifications and fair values – CompanyThe following table shows the carrying amounts and fair values of financial assets and financial liabilities, including their levels in the fair value hierarchy. It does not include fair value information for financial assets and financial liabilities not measured at fair value if the carrying amount is a reasonable approximation of fair value:
Carrying Amount Carrying Amount Fair Value
As at 31 March 2018 Designated as FVTPL
Rs.
Available-for-Sale
Rs.
Loans and Receivables
Rs.
Held-to-Maturity
Rs.
Other FinancialLiabilities
Rs.
Total
Rs.
Level 1
Rs.
Level 2
Rs.
Level 3
Rs.
Total
Rs.
Financial assets measured at fair value
Investments in equity securities – quoted 85,104,831 – – – – 85,104,831 85,104,831 – – 85,104,831
Investments in unit trust – quoted 2,375,000 5,696,077 – – – 8,071,077 8,071,077 – – 8,071,077
Investments in unit trust – unquoted – 96,606,574 – – – 96,606,574 – – 96,606,574 96,606,574
87,479,831 102,302,651 – – – 189,782,482 93,175,908 – 96,606,574 189,782,482
Financial assets not measured at fair value
Cash and cash equivalents – – 764,909,318 – – 764,909,318 – – – –
Deposit with licensed commercial Banks – – 588,383,766 – – 588,383,766 – – – –
Repurchase agreements – – 2,899,624,179 – – 2,899,624,179 – – – –
Loans and advances – – 27,301,961,524 – – 27,301,961,524 – – – –
Other advances – – 499,823,913 – – 499,823,913 – – – –
Investments in equity securities - unquoted – 10,704,006 – – – 10,704,006 – – – –
Treasury Bonds – – – 185,086,178 – 185,086,178 191,990,964 – – 191,990,964
Treasury Bills – – – 782,432,811 – 782,432,811 781,505,191 – – 781,505,191
– 10,704,006 32,054,702,700 967,518,989 – 33,032,925,695 973,496,155 – – 973,496,155
Financial liabilities not measured at fair value
Due to banks – – – – 6,008,726,566 6,008,726,566 – – – –
Deposits from customers – – – – 9,124,856,580 9,124,856,580 – – 9,341,484,219 9,341,484,219
Savings deposits from customers – – – – 382,277,210 382,277,210 – – – –
Other borrowings – – – – 864,650,046 864,650,046 – – 883,737,065 883,737,065
Short term and floating rated borrowings – – – – 8,502,982,719 8,502,982,719 – – – –
Debt securities issued – – – – 3,127,018,895 3,127,018,895 – – 3,096,319,007 3,096,319,007
Subordinated debentures – – – – 1,272,876,786 1,272,876,786 – – 1,288,858,155 1,288,858,155
– – – – 29,283,388,802 29,283,388,802 – – 14,610,398,446 14,610,398,446

SE
NK
AD
AG
AL
A F
INA
NC
E P
LC
AN
NU
AL
RE
PO
RT
20
17
/1
8N
OT
ES
TO
TH
E F
INA
NC
IAL
ST
AT
EM
EN
TS
206
Carrying Amount Carrying Amount Fair Value
As at 31 March 2017 Designated as FVTPL
Rs.
Available-for-Sale
Rs.
Loans and Receivables
Rs.
Held-to-Maturity
Rs.
Other FinancialLiabilities
Rs.
Total
Rs.
Level 1
Rs.
Level 2
Rs.
Level 3
Rs.
Total
Rs.
Financial assets measured at fair value
Investments in equity securities – quoted 77,957,551 – – – – 77,957,551 77,957,551 – – 77,957,551
Investments in unit trust – quoted 2,075,000 5,696,077 – – – 7,771,077 7,771,077 – – 7,771,077
Investments in unit trust – unquoted – 63,300,038 – – – 63,300,038 – – 63,300,038 63,300,038
80,032,551 68,996,115 – – – 149,028,666 85,728,628 – 63,300,038 149,028,666
Financial assets not measured at fair value
Cash and cash equivalents – – 604,224,835 – – 604,224,835 – – – –
Deposit with licensed commercial Banks – – 2,424,623,839 – – 2,424,623,839 – – – –
Repurchase agreements – – 1,000,000,000 – – 1,000,000,000 – – – –
Loans and advances – – 23,367,264,288 – – 23,367,264,288 – – – –
Other advances – – 390,323,774 – – 390,323,774 – – – –
Investments in equity securities - unquoted – 10,704,006 – – – 10,704,006 – – – –
Treasury Bonds – – – 182,105,842 – 182,105,842 176,542,106 – – 176,542,106
Treasury Bills – – – 712,795,529 – 712,795,529 710,393,556 – – 710,393,556
– 10,704,006 27,786,436,736 894,901,371 – 28,692,042,113 886,935,662 – – 886,935,662
Financial liabilities not measured at fair value
Due to banks – – – – 6,980,977,714 6,980,977,714 – – – –
Deposits from customers – – – – 6,889,101,351 6,889,101,351 – – 7,101,917,072 7,101,917,072
Savings deposits from customers – – – – 341,771,214 341,771,214 – – – –
Other borrowings – – – – 1,684,024,010 1,684,024,010 – – 1,608,787,328 1,608,787,328
Short-term and floating rated borrowings – – – – 5,078,729,841 5,078,729,841 – – – –
Debt securities issued – – – – 3,683,045,483 3,683,045,483 – – 3,782,838,523 3,782,838,523
Subordinated debentures – – – – 1,309,740,125 1,309,740,125 – – 1,321,310,888 1,321,310,888
– – – – 25,967,389,738 25,967,389,738 – – 13,814,853,811 13,814,853,811
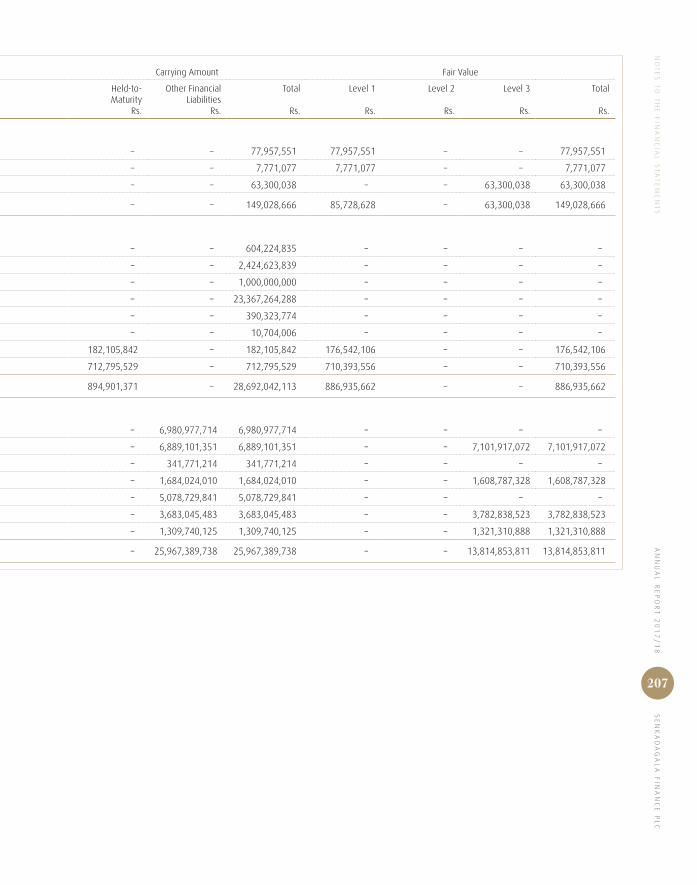
AN
NU
AL
RE
PO
RT
20
17
/1
8 S
EN
KA
DA
GA
LA
FIN
AN
CE
PL
CN
OT
ES
TO
TH
E F
INA
NC
IAL
ST
AT
EM
EN
TS
207
Carrying Amount Carrying Amount Fair Value
As at 31 March 2017 Designated as FVTPL
Rs.
Available-for-Sale
Rs.
Loans and Receivables
Rs.
Held-to-Maturity
Rs.
Other FinancialLiabilities
Rs.
Total
Rs.
Level 1
Rs.
Level 2
Rs.
Level 3
Rs.
Total
Rs.
Financial assets measured at fair value
Investments in equity securities – quoted 77,957,551 – – – – 77,957,551 77,957,551 – – 77,957,551
Investments in unit trust – quoted 2,075,000 5,696,077 – – – 7,771,077 7,771,077 – – 7,771,077
Investments in unit trust – unquoted – 63,300,038 – – – 63,300,038 – – 63,300,038 63,300,038
80,032,551 68,996,115 – – – 149,028,666 85,728,628 – 63,300,038 149,028,666
Financial assets not measured at fair value
Cash and cash equivalents – – 604,224,835 – – 604,224,835 – – – –
Deposit with licensed commercial Banks – – 2,424,623,839 – – 2,424,623,839 – – – –
Repurchase agreements – – 1,000,000,000 – – 1,000,000,000 – – – –
Loans and advances – – 23,367,264,288 – – 23,367,264,288 – – – –
Other advances – – 390,323,774 – – 390,323,774 – – – –
Investments in equity securities - unquoted – 10,704,006 – – – 10,704,006 – – – –
Treasury Bonds – – – 182,105,842 – 182,105,842 176,542,106 – – 176,542,106
Treasury Bills – – – 712,795,529 – 712,795,529 710,393,556 – – 710,393,556
– 10,704,006 27,786,436,736 894,901,371 – 28,692,042,113 886,935,662 – – 886,935,662
Financial liabilities not measured at fair value
Due to banks – – – – 6,980,977,714 6,980,977,714 – – – –
Deposits from customers – – – – 6,889,101,351 6,889,101,351 – – 7,101,917,072 7,101,917,072
Savings deposits from customers – – – – 341,771,214 341,771,214 – – – –
Other borrowings – – – – 1,684,024,010 1,684,024,010 – – 1,608,787,328 1,608,787,328
Short-term and floating rated borrowings – – – – 5,078,729,841 5,078,729,841 – – – –
Debt securities issued – – – – 3,683,045,483 3,683,045,483 – – 3,782,838,523 3,782,838,523
Subordinated debentures – – – – 1,309,740,125 1,309,740,125 – – 1,321,310,888 1,321,310,888
– – – – 25,967,389,738 25,967,389,738 – – 13,814,853,811 13,814,853,811
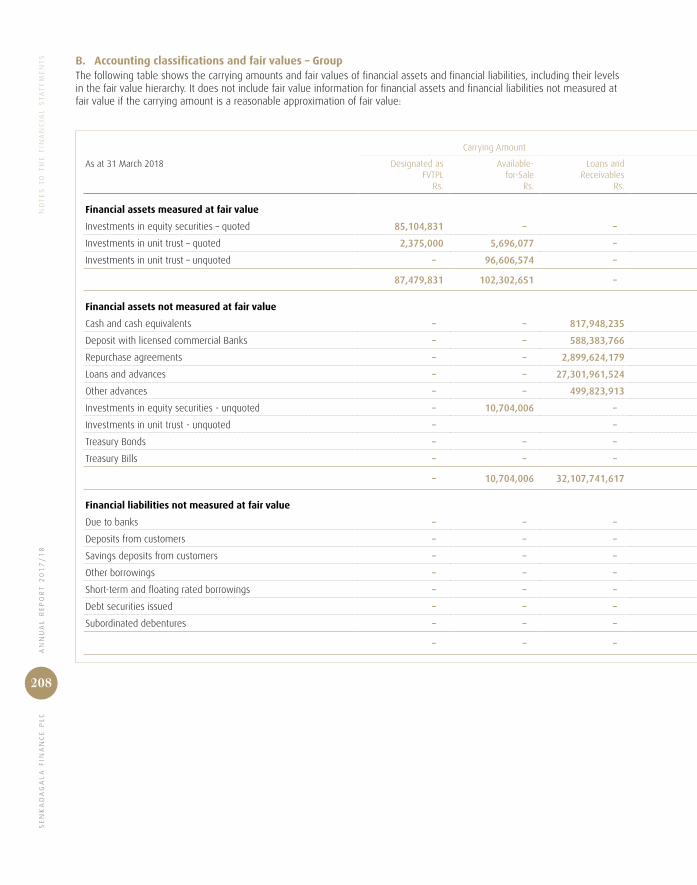
SE
NK
AD
AG
AL
A F
INA
NC
E P
LC
AN
NU
AL
RE
PO
RT
20
17
/1
8N
OT
ES
TO
TH
E F
INA
NC
IAL
ST
AT
EM
EN
TS
208
B. Accounting classifications and fair values – GroupThe following table shows the carrying amounts and fair values of financial assets and financial liabilities, including their levels in the fair value hierarchy. It does not include fair value information for financial assets and financial liabilities not measured at fair value if the carrying amount is a reasonable approximation of fair value:
Carrying Amount Carrying Amount Fair Value
As at 31 March 2018 Designated as FVTPL
Rs.
Available-for-Sale
Rs.
Loans and Receivables
Rs.
Held-to-Maturity
Rs.
Other FinancialLiabilities
Rs.
Total
Rs.
Level 1
Rs.
Level 2
Rs.
Level 3
Rs.
Total
Rs.
Financial assets measured at fair value
Investments in equity securities – quoted 85,104,831 – – – – 85,104,831 85,104,831 – – 85,104,831
Investments in unit trust – quoted 2,375,000 5,696,077 – – – 8,071,077 8,071,077 – – 8,071,077
Investments in unit trust – unquoted – 96,606,574 – – – 96,606,574 – – 96,606,574 96,606,574
87,479,831 102,302,651 – – – 189,782,482 93,175,908 – 96,606,574 189,782,482
Financial assets not measured at fair value
Cash and cash equivalents – – 817,948,235 – – 817,948,235 – – – –
Deposit with licensed commercial Banks – – 588,383,766 – – 588,383,766 – – – –
Repurchase agreements – – 2,899,624,179 – – 2,899,624,179 – – – –
Loans and advances – – 27,301,961,524 – – 27,301,961,524 – – – –
Other advances – – 499,823,913 – – 499,823,913 – – – –
Investments in equity securities - unquoted – 10,704,006 – – – 10,704,006 – – – –
Investments in unit trust - unquoted – – – – – – – –
Treasury Bonds – – – 185,086,178 – 185,086,178 191,990,964 – – 191,990,964
Treasury Bills – – – 782,432,811 – 782,432,811 781,505,191 – – 781,505,191
– 10,704,006 32,107,741,617 967,518,989 – 33,085,964,612 973,496,155 – – 973,496,155
Financial liabilities not measured at fair value
Due to banks – – – – 6,060,439,800 6,060,439,800 – – – –
Deposits from customers – – – – 9,083,178,124 9,083,178,124 – – 9,299,870,885 9,299,870,885
Savings deposits from customers – – – – 382,277,210 382,277,210 – – – –
Other borrowings – – – – 864,650,046 864,650,046 – – 883,737,065 883,737,065
Short-term and floating rated borrowings – – – – 8,502,982,719 8,502,982,719 – – – –
Debt securities issued – – – – 3,127,018,895 3,127,018,895 – – 3,096,319,007 3,096,319,007
Subordinated debentures – – – – 1,272,876,786 1,272,876,786 – – 1,288,858,155 1,288,858,155
– – – – 29,293,423,580 29,293,423,580 – – 14,568,785,112 14,568,785,112
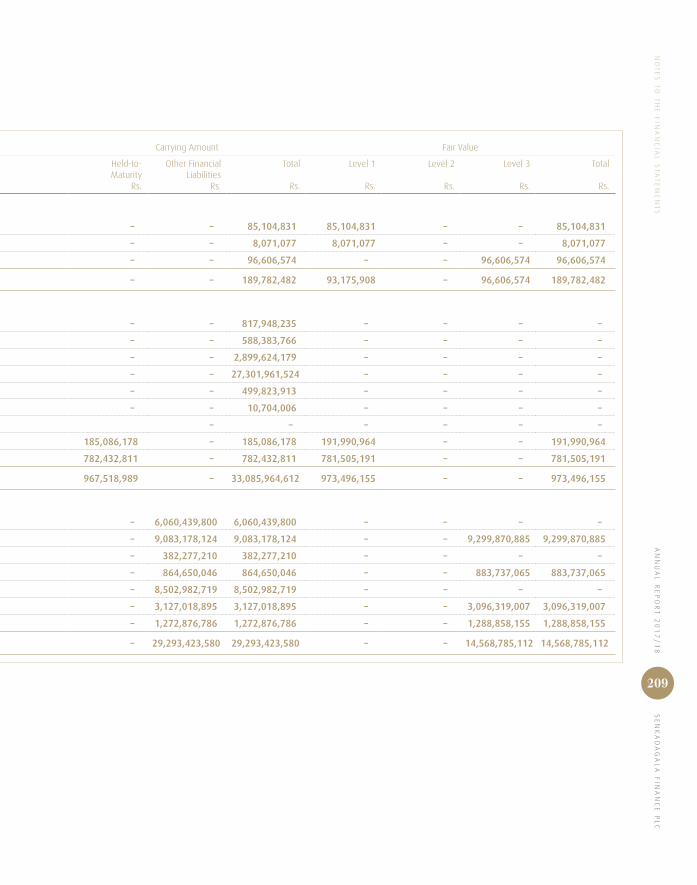
AN
NU
AL
RE
PO
RT
20
17
/1
8 S
EN
KA
DA
GA
LA
FIN
AN
CE
PL
CN
OT
ES
TO
TH
E F
INA
NC
IAL
ST
AT
EM
EN
TS
209
B. Accounting classifications and fair values – GroupThe following table shows the carrying amounts and fair values of financial assets and financial liabilities, including their levels in the fair value hierarchy. It does not include fair value information for financial assets and financial liabilities not measured at fair value if the carrying amount is a reasonable approximation of fair value:
Carrying Amount Carrying Amount Fair Value
As at 31 March 2018 Designated as FVTPL
Rs.
Available-for-Sale
Rs.
Loans and Receivables
Rs.
Held-to-Maturity
Rs.
Other FinancialLiabilities
Rs.
Total
Rs.
Level 1
Rs.
Level 2
Rs.
Level 3
Rs.
Total
Rs.
Financial assets measured at fair value
Investments in equity securities – quoted 85,104,831 – – – – 85,104,831 85,104,831 – – 85,104,831
Investments in unit trust – quoted 2,375,000 5,696,077 – – – 8,071,077 8,071,077 – – 8,071,077
Investments in unit trust – unquoted – 96,606,574 – – – 96,606,574 – – 96,606,574 96,606,574
87,479,831 102,302,651 – – – 189,782,482 93,175,908 – 96,606,574 189,782,482
Financial assets not measured at fair value
Cash and cash equivalents – – 817,948,235 – – 817,948,235 – – – –
Deposit with licensed commercial Banks – – 588,383,766 – – 588,383,766 – – – –
Repurchase agreements – – 2,899,624,179 – – 2,899,624,179 – – – –
Loans and advances – – 27,301,961,524 – – 27,301,961,524 – – – –
Other advances – – 499,823,913 – – 499,823,913 – – – –
Investments in equity securities - unquoted – 10,704,006 – – – 10,704,006 – – – –
Investments in unit trust - unquoted – – – – – – – –
Treasury Bonds – – – 185,086,178 – 185,086,178 191,990,964 – – 191,990,964
Treasury Bills – – – 782,432,811 – 782,432,811 781,505,191 – – 781,505,191
– 10,704,006 32,107,741,617 967,518,989 – 33,085,964,612 973,496,155 – – 973,496,155
Financial liabilities not measured at fair value
Due to banks – – – – 6,060,439,800 6,060,439,800 – – – –
Deposits from customers – – – – 9,083,178,124 9,083,178,124 – – 9,299,870,885 9,299,870,885
Savings deposits from customers – – – – 382,277,210 382,277,210 – – – –
Other borrowings – – – – 864,650,046 864,650,046 – – 883,737,065 883,737,065
Short-term and floating rated borrowings – – – – 8,502,982,719 8,502,982,719 – – – –
Debt securities issued – – – – 3,127,018,895 3,127,018,895 – – 3,096,319,007 3,096,319,007
Subordinated debentures – – – – 1,272,876,786 1,272,876,786 – – 1,288,858,155 1,288,858,155
– – – – 29,293,423,580 29,293,423,580 – – 14,568,785,112 14,568,785,112
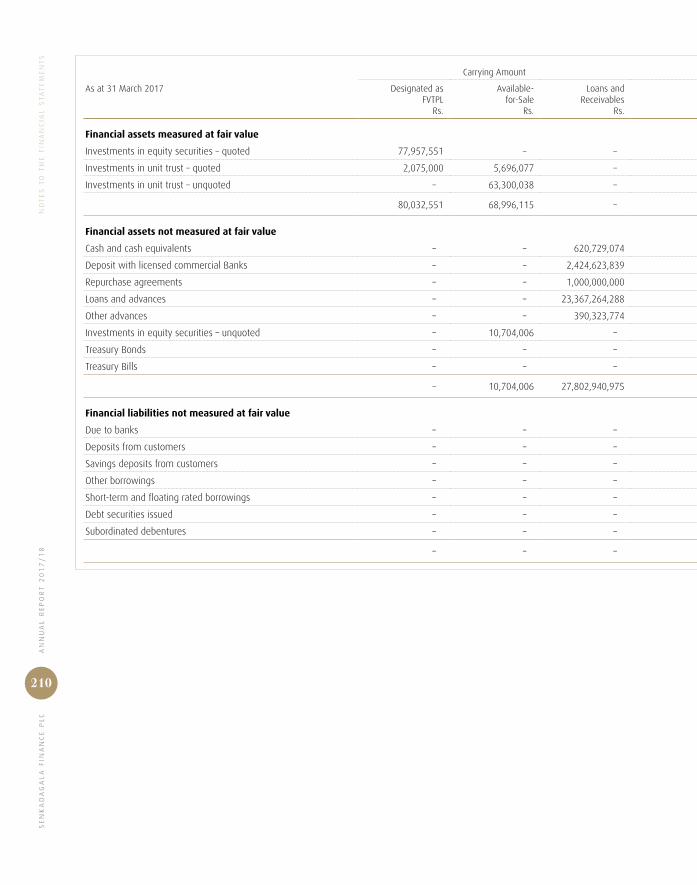
SE
NK
AD
AG
AL
A F
INA
NC
E P
LC
AN
NU
AL
RE
PO
RT
20
17
/1
8N
OT
ES
TO
TH
E F
INA
NC
IAL
ST
AT
EM
EN
TS
210
Carrying Amount Carrying Amount Fair Value
As at 31 March 2017 Designated as FVTPL
Rs.
Available-for-Sale
Rs.
Loans and Receivables
Rs.
Held-to-Maturity
Rs.
Other FinancialLiabilities
Rs.
Total
Rs.
Level 1
Rs.
Level 2
Rs.
Level 3
Rs.
Total
Rs.
Financial assets measured at fair value
Investments in equity securities – quoted 77,957,551 – – – – 77,957,551 77,957,551 – – 77,957,551
Investments in unit trust – quoted 2,075,000 5,696,077 – – – 7,771,077 7,771,077 – – 7,771,077
Investments in unit trust – unquoted – 63,300,038 – – – 63,300,038 – – 63,300,038 63,300,038
80,032,551 68,996,115 – – – 149,028,666 85,728,628 – 63,300,038 149,028,666
Financial assets not measured at fair value
Cash and cash equivalents – – 620,729,074 – – 620,729,074 – – – –
Deposit with licensed commercial Banks – – 2,424,623,839 – – 2,424,623,839 – – – –
Repurchase agreements – – 1,000,000,000 – – 1,000,000,000 – – – –
Loans and advances – – 23,367,264,288 – – 23,367,264,288 – – – –
Other advances – – 390,323,774 – – 390,323,774 – – – –
Investments in equity securities – unquoted – 10,704,006 – – – 10,704,006 – – – –
Treasury Bonds – – – 182,105,842 – 182,105,842 176,542,106 – – 176,542,106
Treasury Bills – – – 712,795,529 – 712,795,529 710,393,556 – – 710,393,556
– 10,704,006 27,802,940,975 894,901,371 – 28,708,546,352 886,935,662 – – 886,935,662
Financial liabilities not measured at fair value
Due to banks – – – – 6,984,829,734 6,984,829,734 – – – –
Deposits from customers – – – – 6,862,743,338 6,862,743,338 – – 7,075,407,762 7,075,407,762
Savings deposits from customers – – – – 341,771,214 341,771,214 – – – –
Other borrowings – – – – 1,684,024,010 1,684,024,010 – – 1,608,787,328 1,608,787,328
Short-term and floating rated borrowings – – – – 5,078,729,841 5,078,729,841 – – – –
Debt securities issued – – – – 3,683,045,483 3,683,045,483 – – 3,782,838,523 3,782,838,523
Subordinated debentures – – – – 1,309,740,125 1,309,740,125 – – 1,321,310,888 1,321,310,888
– – – – 25,944,883,745 25,944,883,745 – – 13,788,344,501 13,788,344,501
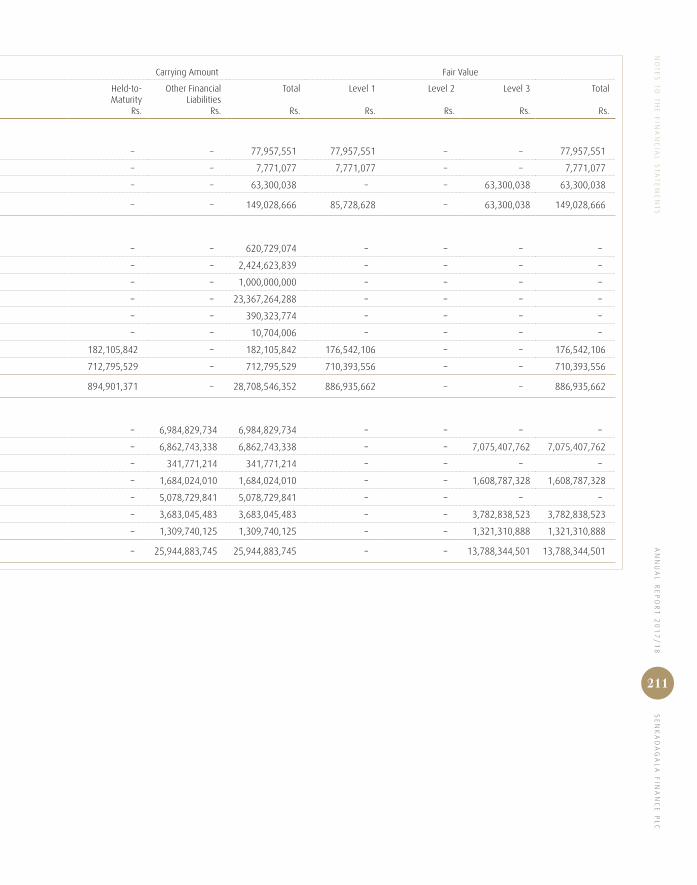
AN
NU
AL
RE
PO
RT
20
17
/1
8 S
EN
KA
DA
GA
LA
FIN
AN
CE
PL
CN
OT
ES
TO
TH
E F
INA
NC
IAL
ST
AT
EM
EN
TS
211
Carrying Amount Carrying Amount Fair Value
As at 31 March 2017 Designated as FVTPL
Rs.
Available-for-Sale
Rs.
Loans and Receivables
Rs.
Held-to-Maturity
Rs.
Other FinancialLiabilities
Rs.
Total
Rs.
Level 1
Rs.
Level 2
Rs.
Level 3
Rs.
Total
Rs.
Financial assets measured at fair value
Investments in equity securities – quoted 77,957,551 – – – – 77,957,551 77,957,551 – – 77,957,551
Investments in unit trust – quoted 2,075,000 5,696,077 – – – 7,771,077 7,771,077 – – 7,771,077
Investments in unit trust – unquoted – 63,300,038 – – – 63,300,038 – – 63,300,038 63,300,038
80,032,551 68,996,115 – – – 149,028,666 85,728,628 – 63,300,038 149,028,666
Financial assets not measured at fair value
Cash and cash equivalents – – 620,729,074 – – 620,729,074 – – – –
Deposit with licensed commercial Banks – – 2,424,623,839 – – 2,424,623,839 – – – –
Repurchase agreements – – 1,000,000,000 – – 1,000,000,000 – – – –
Loans and advances – – 23,367,264,288 – – 23,367,264,288 – – – –
Other advances – – 390,323,774 – – 390,323,774 – – – –
Investments in equity securities – unquoted – 10,704,006 – – – 10,704,006 – – – –
Treasury Bonds – – – 182,105,842 – 182,105,842 176,542,106 – – 176,542,106
Treasury Bills – – – 712,795,529 – 712,795,529 710,393,556 – – 710,393,556
– 10,704,006 27,802,940,975 894,901,371 – 28,708,546,352 886,935,662 – – 886,935,662
Financial liabilities not measured at fair value
Due to banks – – – – 6,984,829,734 6,984,829,734 – – – –
Deposits from customers – – – – 6,862,743,338 6,862,743,338 – – 7,075,407,762 7,075,407,762
Savings deposits from customers – – – – 341,771,214 341,771,214 – – – –
Other borrowings – – – – 1,684,024,010 1,684,024,010 – – 1,608,787,328 1,608,787,328
Short-term and floating rated borrowings – – – – 5,078,729,841 5,078,729,841 – – – –
Debt securities issued – – – – 3,683,045,483 3,683,045,483 – – 3,782,838,523 3,782,838,523
Subordinated debentures – – – – 1,309,740,125 1,309,740,125 – – 1,321,310,888 1,321,310,888
– – – – 25,944,883,745 25,944,883,745 – – 13,788,344,501 13,788,344,501

SE
NK
AD
AG
AL
A F
INA
NC
E P
LC
AN
NU
AL
RE
PO
RT
20
17
/1
8N
OT
ES
TO
TH
E F
INA
NC
IAL
ST
AT
EM
EN
TS
212
C. Measurement of fair values – Company1. Valuation techniques and significant unobservable inputs used for Financial Instruments not measured at fair valueThe following tables show the valuation techniques used in measuring Level 2 fair values, as well as the significant unobservable inputs used:
Type Valuation technique Significant unobservable inputs Inter-relationship between significant unobservable inputs and fair value measurement
Other liabilities ** Discounted cash flows using prevailing current market rates for similar financial instruments.
Average Effective interest rate based on the maturity of deposits liability. Interest rate varied from 10.40% to 16.47%
The estimated fair Value would increase (decrease) if there is any changes in rate of Sri Lanka Government Treasury Bill.
Corporate debtsecurities
Market comparison technique:
The fair values are based on broker quotes. Similar contracts are traded in an active market and the quotes reflect the actual transactions in similar instruments.
N/A N/A
** Other liabilities consists of Due to Banks, Deposits from customers, borrowings and debentures
The following is a list of financial instruments which have not been considered under the fair value measurement hierarchy, because the carrying amount of those financial instruments is a reasonable approximation of fair value since they are short-term in nature or reprice to current market rates frequently.
Assets Liabilities
Cash and cash equivalents Other liabilities
Repurchase agreements Savings deposits from customers
Other advances Short-term and floating rated borrowings
Bank overdrafts
D. Measurement of fair values – Group
1. Valuation techniques and significant unobservable inputs used for Financial Instruments not measured at fair value.
The following tables show the valuation techniques used in measuring Level 2 fair values, as well as the significant
unobservable inputs used:
Type Valuation technique Significant unobservable inputs Inter-relationship between significant unobservable inputs and fair value measurement
Other liabilities ** Discounted cash flows using prevailing current market rates for similar financial instruments.
Average Effective interest rate based on the maturity of deposits liability. Interest rate varied from 10.40% to 16.47%.
The estimated fair Value would increase (decrease) if there is any changes in rate of Sri Lanka Government Treasury Bill.
Corporate debtsecurities
Market comparison technique:
The fair values are based on broker quotes. Similar contracts are traded in an active market and the quotes reflect the actual transactions in similar instruments.
N/A N/A
** Other liabilities consists of Due to Banks, Deposits from customers, borrowings and debentures
AN
NU
AL
RE
PO
RT
20
17
/1
8 S
EN
KA
DA
GA
LA
FIN
AN
CE
PL
CN
OT
ES
TO
TH
E F
INA
NC
IAL
ST
AT
EM
EN
TS
213
The following is a list of financial instruments which have not
been considered under the fair value measurement hierarchy,
because the carrying amount of those financial instruments is
a reasonable approximation of fair value since they are short-
term in nature or reprice to current market rates frequently.
Assets
Cash and cash equivalents
Repurchase agreements
Other advances
Liabilities
Other liabilities
Savings deposits from customers
Short-term and floating rated borrowings
Bank overdrafts
51. Risk Management
51.1 Introduction
The Company’s risk management strategy is based on
a clear understanding of various risks, disciplined risk
assessment and measurement procedures and continuous
monitoring. Risk is an integral component of the business
model of any finance company. Accordingly, the purpose of
risk management is that the institution properly identifies,
measures and handles risk and prepares adequate reports
on all these efforts so that the extent of risks which the
Company has assumed have been compensated with
adequate return.
With this in mind, the Company has established and operates
mechanisms, which ensure the on-going assessment of
relevant risk types on an individual basis and of the overall
risk position of the organisation.
At Senkadagala Finance PLC, the board of directors approves
the integrated Risk Management Policy, which sets the
objectives, principles, processes and responsibilities for risk
management within the Company. The policy sets guidelines
for defining, quantifying, monitoring and reporting financial
risks. The integrated Risk Management committee, which is a
subcommittee of the board, is responsible for reviewing the
effectiveness of risk control policies, procedures and regulations.
More specifically, the committee is responsible for ensuring
z Integrity and adequacy of the risk management function
of the Company
z Adequacy of the Company’s capital
z Risk exposures and risk profiles of the Company
are within acceptable parameters and to make
recommendations to the board of directors on any
action required
z The compliance of the Company’s operations with
relevant laws, regulations and standards
The Company is primarily exposed to credit risk, market risk,
liquidity risk, operational risk and regulatory risk.
51.2 Credit risk
Credit risk is the risk that a borrower is unable to meet its
financial obligations to the lender. In order to manage credit
risk, the Company has established robust policies for credit
appraisal and the staff is regularly trained in evaluating
creditworthiness of prospective clients, Senkadagala Finance
PLC manages high-risk sectors through sector restrictions
that require prior high-level clearance before taking on new
exposures even for small amounts. Once credits facilities are
funded, they are continually monitored to identify changes
in risk profiles. Further, sourcing and approval of clients are
segregated to achieve independence. Recovery and NPA
management are also given greater emphasis and are
aggressively monitored.
The company has undertaken for a fee received from certain
customers that in the event of a death of a lessee the
company will not pursue litigation on the outstanding due
on the next of kin or legal heir of the deceased and release
them from all legal encumberences. The company has
mitigated this risk by obtaining an insurance policy to cover
its exposure on the above.
Impairment assessment
The Company uses Net Flow Rate model for the recognition
of losses on impaired financial assets. The losses can only be
recognised when objective evidence of a specific loss event
has been observed. This includes,
z Significant financial difficulty of the customer
z A breach of contract such as a default of payment
z It becomes probable that the customer will enter
bankruptcy or other financial reorganisation
z Observable data that suggest that there is a decrease in
the estimated future cash flow from the loans
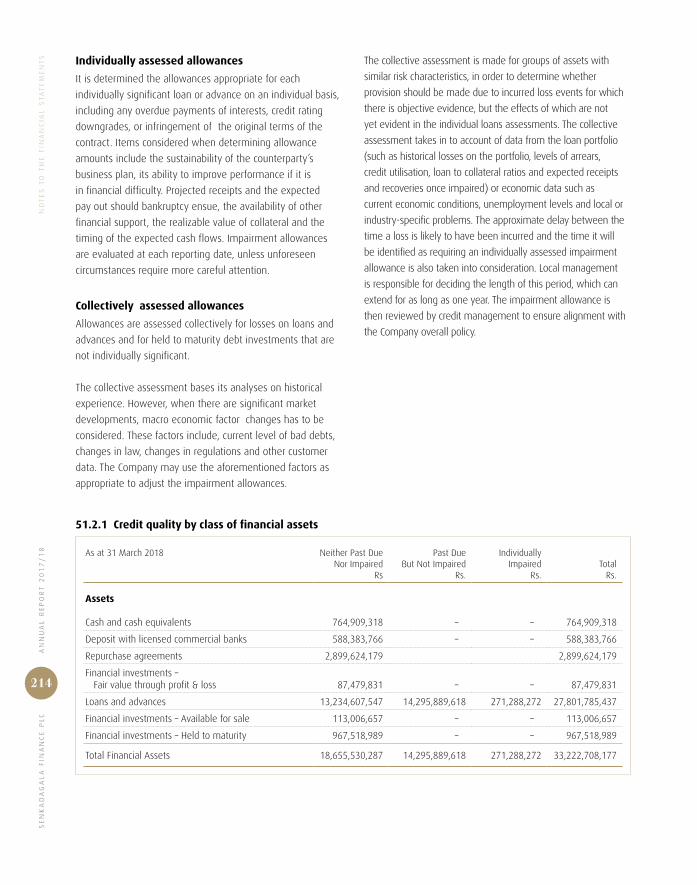
SE
NK
AD
AG
AL
A F
INA
NC
E P
LC
AN
NU
AL
RE
PO
RT
20
17
/1
8N
OT
ES
TO
TH
E F
INA
NC
IAL
ST
AT
EM
EN
TS
214
Individually assessed allowances
It is determined the allowances appropriate for each
individually significant loan or advance on an individual basis,
including any overdue payments of interests, credit rating
downgrades, or infringement of the original terms of the
contract. Items considered when determining allowance
amounts include the sustainability of the counterparty’s
business plan, its ability to improve performance if it is
in financial difficulty. Projected receipts and the expected
pay out should bankruptcy ensue, the availability of other
financial support, the realizable value of collateral and the
timing of the expected cash flows. Impairment allowances
are evaluated at each reporting date, unless unforeseen
circumstances require more careful attention.
Collectively assessed allowances
Allowances are assessed collectively for losses on loans and
advances and for held to maturity debt investments that are
not individually significant.
The collective assessment bases its analyses on historical
experience. However, when there are significant market
developments, macro economic factor changes has to be
considered. These factors include, current level of bad debts,
changes in law, changes in regulations and other customer
data. The Company may use the aforementioned factors as
appropriate to adjust the impairment allowances.
The collective assessment is made for groups of assets with
similar risk characteristics, in order to determine whether
provision should be made due to incurred loss events for which
there is objective evidence, but the effects of which are not
yet evident in the individual loans assessments. The collective
assessment takes in to account of data from the loan portfolio
(such as historical losses on the portfolio, levels of arrears,
credit utilisation, loan to collateral ratios and expected receipts
and recoveries once impaired) or economic data such as
current economic conditions, unemployment levels and local or
industry-specific problems. The approximate delay between the
time a loss is likely to have been incurred and the time it will
be identified as requiring an individually assessed impairment
allowance is also taken into consideration. Local management
is responsible for deciding the length of this period, which can
extend for as long as one year. The impairment allowance is
then reviewed by credit management to ensure alignment with
the Company overall policy.
51.2.1 Credit quality by class of financial assets
As at 31 March 2018 Neither Past DueNor Impaired
Rs
Past Due But Not Impaired
Rs.
IndividuallyImpaired
Rs. Total
Rs.
Assets
Cash and cash equivalents 764,909,318 – – 764,909,318
Deposit with licensed commercial banks 588,383,766 – – 588,383,766
Repurchase agreements 2,899,624,179 2,899,624,179
Financial investments – Fair value through profit & loss 87,479,831 – – 87,479,831
Loans and advances 13,234,607,547 14,295,889,618 271,288,272 27,801,785,437
Financial investments – Available for sale 113,006,657 – – 113,006,657
Financial investments – Held to maturity 967,518,989 – – 967,518,989
Total Financial Assets 18,655,530,287 14,295,889,618 271,288,272 33,222,708,177
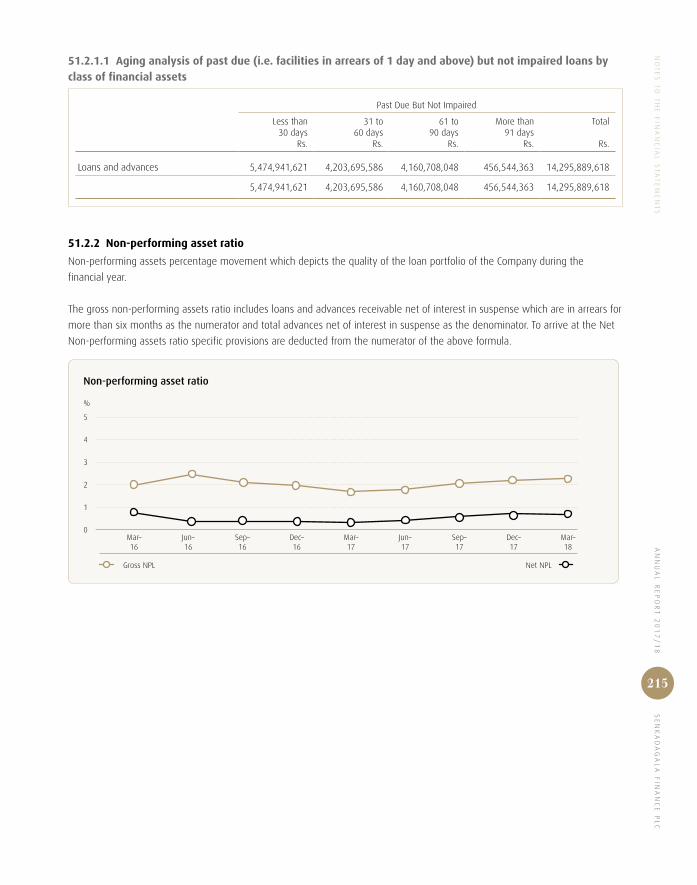
AN
NU
AL
RE
PO
RT
20
17
/1
8 S
EN
KA
DA
GA
LA
FIN
AN
CE
PL
CN
OT
ES
TO
TH
E F
INA
NC
IAL
ST
AT
EM
EN
TS
215
51.2.1.1 Aging analysis of past due (i.e. facilities in arrears of 1 day and above) but not impaired loans by class of financial assets
Past Due But Not Impaired
Less than 30 days
Rs.
31 to 60 days
Rs.
61 to 90 days
Rs.
More than 91 days
Rs.
Total
Rs.
Loans and advances 5,474,941,621 4,203,695,586 4,160,708,048 456,544,363 14,295,889,618
5,474,941,621 4,203,695,586 4,160,708,048 456,544,363 14,295,889,618
51.2.2 Non-performing asset ratio
Non-performing assets percentage movement which depicts the quality of the loan portfolio of the Company during the
financial year.
The gross non-performing assets ratio includes loans and advances receivable net of interest in suspense which are in arrears for
more than six months as the numerator and total advances net of interest in suspense as the denominator. To arrive at the Net
Non-performing assets ratio specific provisions are deducted from the numerator of the above formula.
Gross NPL Net NPL
Non-performing asset ratio
%
Mar–18
Mar–16
Sep–16
Jun–16
Mar–17
Dec–16
Sep–17
Dec–17
Jun–17
5
4
3
2
1
0
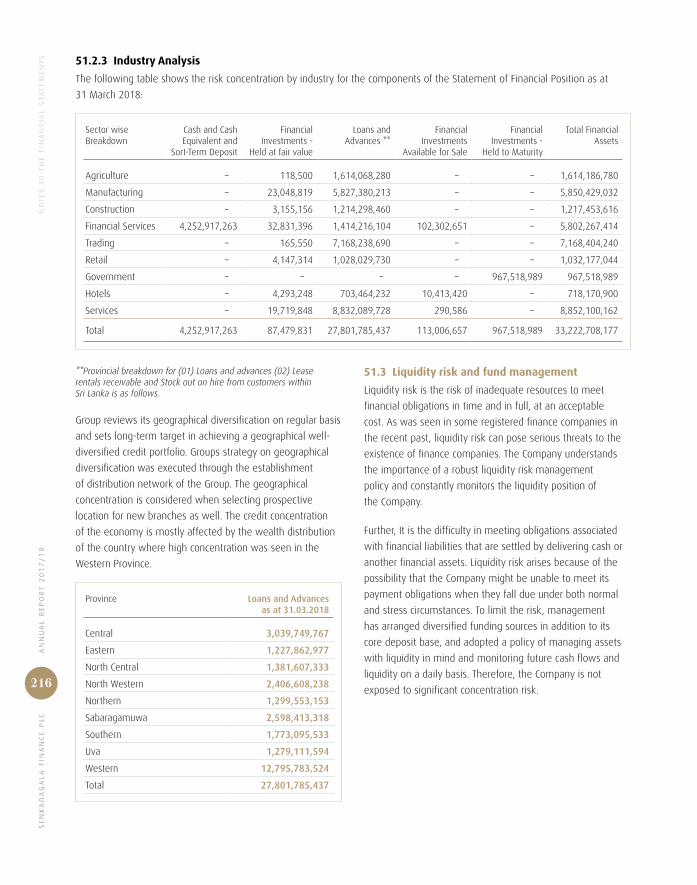
SE
NK
AD
AG
AL
A F
INA
NC
E P
LC
AN
NU
AL
RE
PO
RT
20
17
/1
8N
OT
ES
TO
TH
E F
INA
NC
IAL
ST
AT
EM
EN
TS
216
51.2.3 Industry Analysis
The following table shows the risk concentration by industry for the components of the Statement of Financial Position as at
31 March 2018:
Sector wise Breakdown
Cash and CashEquivalent and
Sort-Term Deposit
FinancialInvestments -
Held at fair value
Loans andAdvances **
FinancialInvestments
Available for Sale
FinancialInvestments -
Held to Maturity
Total FinancialAssets
Agriculture – 118,500 1,614,068,280 – – 1,614,186,780
Manufacturing – 23,048,819 5,827,380,213 – – 5,850,429,032
Construction – 3,155,156 1,214,298,460 – – 1,217,453,616
Financial Services 4,252,917,263 32,831,396 1,414,216,104 102,302,651 – 5,802,267,414
Trading – 165,550 7,168,238,690 – – 7,168,404,240
Retail – 4,147,314 1,028,029,730 – – 1,032,177,044
Government – – – – 967,518,989 967,518,989
Hotels – 4,293,248 703,464,232 10,413,420 – 718,170,900
Services – 19,719,848 8,832,089,728 290,586 – 8,852,100,162
Total 4,252,917,263 87,479,831 27,801,785,437 113,006,657 967,518,989 33,222,708,177
**Provincial breakdown for (01) Loans and advances (02) Lease rentals receivable and Stock out on hire from customers within Sri Lanka is as follows.
Group reviews its geographical diversification on regular basis
and sets long-term target in achieving a geographical well-
diversified credit portfolio. Groups strategy on geographical
diversification was executed through the establishment
of distribution network of the Group. The geographical
concentration is considered when selecting prospective
location for new branches as well. The credit concentration
of the economy is mostly affected by the wealth distribution
of the country where high concentration was seen in the
Western Province.
Province Loans and Advances as at 31.03.2018
Central 3,039,749,767
Eastern 1,227,862,977
North Central 1,381,607,333
North Western 2,406,608,238
Northern 1,299,553,153
Sabaragamuwa 2,598,413,318
Southern 1,773,095,533
Uva 1,279,111,594
Western 12,795,783,524
Total 27,801,785,437
51.3 Liquidity risk and fund management
Liquidity risk is the risk of inadequate resources to meet
financial obligations in time and in full, at an acceptable
cost. As was seen in some registered finance companies in
the recent past, liquidity risk can pose serious threats to the
existence of finance companies. The Company understands
the importance of a robust liquidity risk management
policy and constantly monitors the liquidity position of
the Company.
Further, It is the difficulty in meeting obligations associated
with financial liabilities that are settled by delivering cash or
another financial assets. Liquidity risk arises because of the
possibility that the Company might be unable to meet its
payment obligations when they fall due under both normal
and stress circumstances. To limit the risk, management
has arranged diversified funding sources in addition to its
core deposit base, and adopted a policy of managing assets
with liquidity in mind and monitoring future cash flows and
liquidity on a daily basis. Therefore, the Company is not
exposed to significant concentration risk.

AN
NU
AL
RE
PO
RT
20
17
/1
8 S
EN
KA
DA
GA
LA
FIN
AN
CE
PL
CN
OT
ES
TO
TH
E F
INA
NC
IAL
ST
AT
EM
EN
TS
217
51.3.1 Statutory liquid assets ratio
As per the requirements of Finance Companies (Liquid
Assets) Direction No. 04 of 2013, Company has maintained
minimum liquid assets, not less than 10% of the outstanding
value of time deposits and face value of certificates of
deposits; and 15% of the outstanding value of savings
deposits received by the Company at a given day; and 5%
of total outstanding borrowings excluding borrowings which
are included in the capital funds of the finance company and
borrowings which are secured by mortgage of any asset of
the Company.
Further in accordance with the Finance Companies (Liquid
Assets) Direction No. 04 of 2013 every Finance Company
has to maintain assets in the form of approved securities
equivalent to 7.5% of the average of month end total deposit
liabilities and borrowings of the twelve months of the
proceeding financial year.
As at 31 March 2018, the Company maintained Government
Securities to Average Deposit liabilities and Borrowings ratio
of 8.21% (2017-8.57%).
51.3.2 Analysis of financial assets and liabilities by remaining contractual maturities
The table below summarises the maturity profile of the
undiscounted cash flows of the Company’s financial assets
and liabilities as at 31 March 2018.
Less than 03 Months
Rs.
03-12 Months
Rs.
01-03 Years
Rs.
Over 03 Years
Rs.Total
Rs.
Financial Assets
Cash and cash equivalents 764,909,318 – – – 764,909,318
Deposits with licensed commercial banks 369,426,112 218,957,654 – – 588,383,766
Repurchase agreements 2,899,624,179 – – – 2,899,624,179
Financial investments – Fair value through profit and loss 87,479,831 – – – 87,479,831
Loans and advances 4,157,791,969 8,490,876,080 12,024,582,624 3,128,534,764 27,801,785,437
Financial investments – Available for sale 96,606,574 2,278,431 3,417,646 10,704,006 113,006,657
Financial investments – Held to maturity 782,432,811 – – 185,086,178 967,518,989
Total Financial Assets 9,158,270,794 8,712,112,165 12,028,000,270 3,324,324,948 33,222,708,177
Financial Liabilities
Deposits from Customers 2,331,483,434 5,141,395,374 1,549,648,465 484,606,517 9,507,133,790
Bank overdraft 82,833,778 – – – 82,833,778
Debt instruments issued and other borrowed funds 1,216,152,534 6,521,526,496 10,145,349,182 1,810,393,022 19,693,421,234
Total Financial Liabilities 3,630,469,746 11,662,921,870 11,694,997,647 2,294,999,539 29,283,388,802
Total Net Financial Assets/ (Liabilities) 5,527,801,048 (2,950,809,705) 333,002,623 1,029,325,409 3,939,319,375

SE
NK
AD
AG
AL
A F
INA
NC
E P
LC
AN
NU
AL
RE
PO
RT
20
17
/1
8N
OT
ES
TO
TH
E F
INA
NC
IAL
ST
AT
EM
EN
TS
218
51.3.3 Capital management and capital adequacy
In order to be resilient in volatile economic conditions it’s
important to maintain an adequate capital base. Central
Bank of Sri Lanka has laid down directions to promote the
strengthening of the capital base of NBFIs.
In accordance with the Finance Companies (Capital Funds)
Direction No. 01 of 2003, the Company transferred Rs. 45
million of net profits for the year, to the Statutory Reserve
Fund. Since the capital base of the Company is greater
that 25% of total deposit liabilities, only Rs. 45 Mn. which
is greater than the required 5% of profits for the year was
transferred to this reserve.
Further in accordance with the Finance Companies (Risk
Weighted Capital Adequacy Ratio) Direction No. 02 of 2006,
all the NBFIs are required to maintain, at all times its Capital
at a level not less than 10% of its Risk Weighted Assets and
the Core Capital at a level not less that 5% of Risk Weighted
Assets. The ratios as at 31 March 2018 were 16.86% and
as at 31 March 2017 were 14.19%. Detailed calculation is
given below:
As at 31 March 2018 2017 Risk Weighting 2018 2017
Rs. Rs. % Rs. Rs.
Risk Weighted Assets
On-Balance Sheet-Total Assets 36,103,763,421 30,918,826,613 29,803,689,825 25,766,295,416
Cash and current accounts with banks 764,909,318 604,224,835 0 – –
Deposits with banks 588,383,766 2,424,623,839 20 117,676,753 484,924,768
Sri Lanka government securities 3,867,143,168 1,894,901,371 0 –
Loans and Advances 27,801,785,437 23,757,588,062 26,604,471,340 23,043,882,142
Against deposits with the Company 203,633,762 165,303,320 0 – –
Loans against gold and gold jewelery 993,680,335 548,402,600 0 – –
Other loans and advances 26,604,471,340 23,043,882,142 100 26,604,471,340 23,043,882,142
Fixed assets 1,803,149,630 1,516,890,823 100 1,803,149,630 1,516,890,823
Other assets 1,278,392,102 720,597,683 100 1,278,392,102 720,597,683
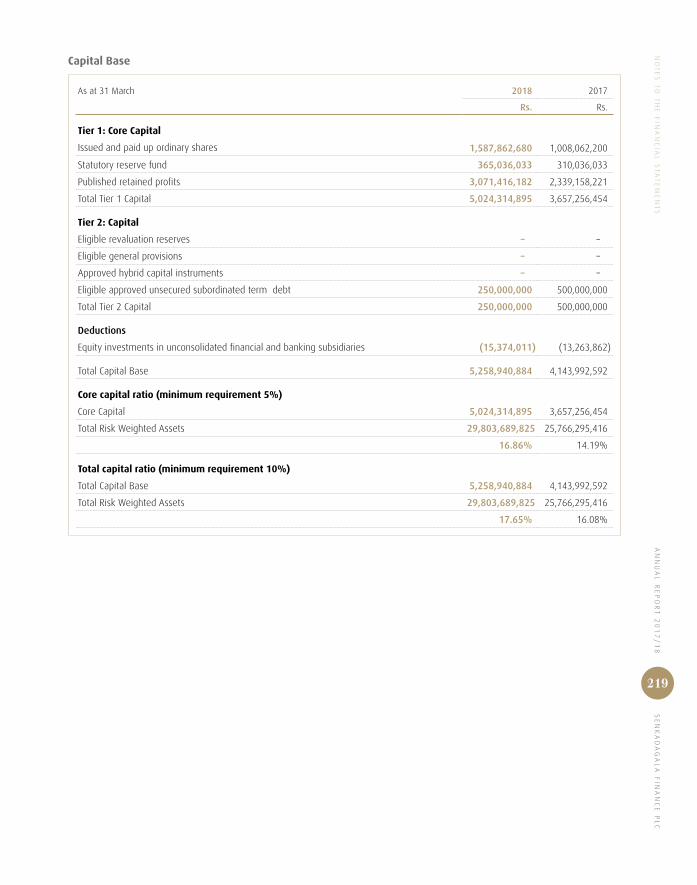
AN
NU
AL
RE
PO
RT
20
17
/1
8 S
EN
KA
DA
GA
LA
FIN
AN
CE
PL
CN
OT
ES
TO
TH
E F
INA
NC
IAL
ST
AT
EM
EN
TS
219
Capital Base
As at 31 March 2018 2017
Rs. Rs.
Tier 1: Core Capital
Issued and paid up ordinary shares 1,587,862,680 1,008,062,200
Statutory reserve fund 365,036,033 310,036,033
Published retained profits 3,071,416,182 2,339,158,221
Total Tier 1 Capital 5,024,314,895 3,657,256,454
Tier 2: Capital
Eligible revaluation reserves – –
Eligible general provisions – –
Approved hybrid capital instruments – –
Eligible approved unsecured subordinated term debt 250,000,000 500,000,000
Total Tier 2 Capital 250,000,000 500,000,000
Deductions
Equity investments in unconsolidated financial and banking subsidiaries (15,374,011) (13,263,862)
Total Capital Base 5,258,940,884 4,143,992,592
Core capital ratio (minimum requirement 5%)
Core Capital 5,024,314,895 3,657,256,454
Total Risk Weighted Assets 29,803,689,825 25,766,295,416
16.86% 14.19%
Total capital ratio (minimum requirement 10%)
Total Capital Base 5,258,940,884 4,143,992,592
Total Risk Weighted Assets 29,803,689,825 25,766,295,416
17.65% 16.08%
SE
NK
AD
AG
AL
A F
INA
NC
E P
LC
AN
NU
AL
RE
PO
RT
20
17
/1
8N
OT
ES
TO
TH
E F
INA
NC
IAL
ST
AT
EM
EN
TS
220
During the 2013/14 financial year the Company Issued a
Subordinated, Unsecured, Listed Debenture for a sum of
Rs. 1,250 million. With the approval of the CBSL this was
included in the capital base of the Company, it was expected
to strengthen the capital base and to strike a balance
between Tier 1 and Tier 2 capital. Accordingly as at 31
March 2018, only 20% of the said debenture, Rs. 250 Mn. is
included under Tier 2 of the Company.
51.4 Market risk
Market risk is the risk of potential losses accruing through
adverse fluctuation in market interest rates, equity prices and
exchange rates. Of these markets risks, the more frequent
and most likely is the risk of adverse fluctuation of interest
rates. The effect of such adverse movements could have an
immediate and direct bearing on the Company. The Company
routinely assesses its assets and liability profile in terms
of interest rate risk and depending on this assessment,
necessary realignments in the assets and liability
structure are undertaken. Overall authority for market risk
management is vested in the Integrated Risk Management
Committee (IRMC) of the Company.
51.4.1 Interest rate risk
Interest rate risk arises from the possibility that changes in
interest rates will affect future cash flows or the fair values
of financial instruments. The board has established limits
on the non-trading interest rate gaps for stipulated periods.
The Company policy is to monitor positions on a daily basis
and hedging strategies are used to ensure position are
maintained within the established limits.
51.4.2 Currency risk
Currency risk is that the value of a financial instrument will
fluctuate due to changes in foreign exchange rates and
arises from financial instruments dominated in a foreign
currency. Intention of managing currency risk is to curtail the
currency losses incurred due to foreign currency transactions.
The Company monitors this on a daily basis however the
company is not exposed to significant currency risk.
51.4.3 Equity price risk
Equity price risk is that the fair value of equities decreases
as the result of changes in the level of equity indices and
individual stocks. The non-trading equity price risk exposure
arises from equity securities classified as available for sale.
51.5 Operational risk
Operational risk is the risk of loss resulting from inadequate
or failed internal processes, people and systems and
from external events. Senkadagala Finance PLC manages
operational risk in a variety of ways. These include
maintaining a comprehensive system of internal controls
including disaster recovery plans and business continuity
plans, using technology to automate processes and reduce
manual errors, Monitoring and analysing risk, events and
trends, employing experienced staff, monitoring business
activities by compliance and audit professionals, requiring
education and training of employees, and emphasising the
importance of management oversight.
The Company has in place a process of continuous internal
audit utilising the services of Messrs. Ernst & Young, Advisory
services.
51.6 Regulatory risk
Regulatory risk is the risk of non-compliance with applicable
legislation, regulation and regulatory directives, Senkadagala
Finance PLC manages day to day regulatory risk primarily
by educating and training employees about regulatory
requirements, establishing and maintaining appropriate
policies and procedures, and monitoring for compliance.
the Company has appointed a Compliance Officer for
communicating regulatory requirements to each business
unit, ensuring that business units have appropriate policies
and procedures in place and that staff are trained to
meet regulatory requirements and for tracking, escalating
and reporting significant issues and finding to senior
management and the Board.
In this latter process, the Compliance Officer is supported and
assisted by the Company’s Internal Auditors, Messrs. Ernst &
Young Advisory Services . who also report on any issues of
non-compliance, with both internal and external regulations.
Compliance with regulatory requirements is also documented
through formal procedure manuals for each business unit.
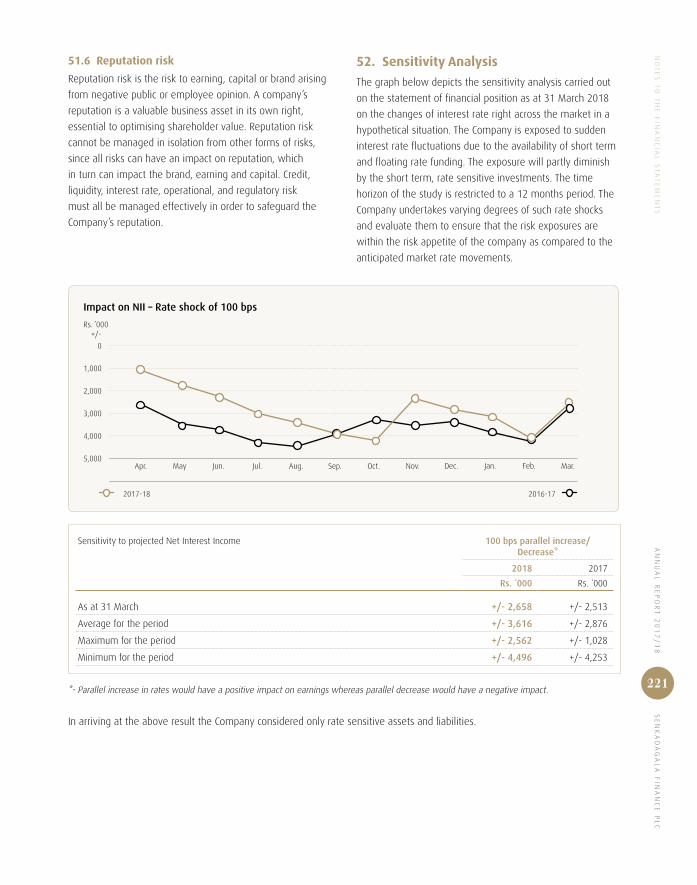
AN
NU
AL
RE
PO
RT
20
17
/1
8 S
EN
KA
DA
GA
LA
FIN
AN
CE
PL
CN
OT
ES
TO
TH
E F
INA
NC
IAL
ST
AT
EM
EN
TS
221
51.6 Reputation risk
Reputation risk is the risk to earning, capital or brand arising
from negative public or employee opinion. A company’s
reputation is a valuable business asset in its own right,
essential to optimising shareholder value. Reputation risk
cannot be managed in isolation from other forms of risks,
since all risks can have an impact on reputation, which
in turn can impact the brand, earning and capital. Credit,
liquidity, interest rate, operational, and regulatory risk
must all be managed effectively in order to safeguard the
Company’s reputation.
52. Sensitivity Analysis
The graph below depicts the sensitivity analysis carried out
on the statement of financial position as at 31 March 2018
on the changes of interest rate right across the market in a
hypothetical situation. The Company is exposed to sudden
interest rate fluctuations due to the availability of short term
and floating rate funding. The exposure will partly diminish
by the short term, rate sensitive investments. The time
horizon of the study is restricted to a 12 months period. The
Company undertakes varying degrees of such rate shocks
and evaluate them to ensure that the risk exposures are
within the risk appetite of the company as compared to the
anticipated market rate movements.
2017-18 2016-17
Impact on NII – Rate shock of 100 bps
Rs. ’000+/-
Mar.Dec. Jan. Feb.Apr. Jun.May Aug.Jul. Oct. Nov.Sep.
0
1,000
2,000
3,000
4,000
5,000
Sensitivity to projected Net Interest Income 100 bps parallel increase/ Decrease*
2018 2017
Rs. ´000 Rs. ´000
As at 31 March +/- 2,658 +/- 2,513
Average for the period +/- 3,616 +/- 2,876
Maximum for the period +/- 2,562 +/- 1,028
Minimum for the period +/- 4,496 +/- 4,253
*- Parallel increase in rates would have a positive impact on earnings whereas parallel decrease would have a negative impact.
In arriving at the above result the Company considered only rate sensitive assets and liabilities.

NO
TE
S T
O T
HE
FIN
AN
CIA
L S
TA
TE
ME
NT
SS
EN
KA
DA
GA
LA
FIN
AN
CE
PL
C
A
NN
UA
L R
EP
OR
T 2
01
7/
18
222
Annexes
224 225 226Ten Year
SummaryKey Ratios
and Indicators
Branch/Service Centre
Network

AN
NU
AL
RE
PO
RT
20
17
/1
8 S
EN
KA
DA
GA
LA
FIN
AN
CE
PL
C
223
228 232 EnclosedGRI
Content Index
Notice of Meeting
Form of Proxy

SE
NK
AD
AG
AL
A F
INA
NC
E P
LC
AN
NU
AL
RE
PO
RT
20
17
/1
8
224
Ten Year Summary
2018Rs. ‘000
2017Rs. ‘000
2016Rs. ‘000
2015Rs. ‘000
2014Rs. ‘000
2013Rs. ‘000
2012Rs. ‘000
2011 Rs. ‘000
2010Rs. ‘000
2009 Rs. ‘000
Operating results
Interest income 6,472,115 4,825,712 3,746,374 3,584,165 3,528,336 2,861,923 1,884,502 1,493,088 1,451,560 1,560,124
Interest expense 3,410,064 2,402,305 1,701,766 1,750,532 1,868,499 1,524,288 841,034 679,358 845,696 931,904
Net interest income 3,062,051 2,423,408 2,044,607 1,833,634 1,659,838 1,337,635 1,043,467 813,730 605,864 628,220
Other operating income 298,215 312,424 218,173 131,220 94,950 113,678 131,523 177,868 100,671 87,309
Profit before taxation and VAT 1,572,504 1,280,293 971,116 697,029 657,054 735,545 692,960 435,584 172,614 132,807
Profit before income taxation 1,357,416 1,119,133 882,550 647,444 622,417 680,482 634,872 349,626 138,485 113,583
Profit for the year 1,004,671 860,971 613,182 539,639 534,942 578,526 476,450 222,400 54,951 61,364
Dividends paid 213,077 185,899 166,330 107,625 214,901 132,886 127,016 63,508 19,212 29,886
Balance sheet
Assets
Cash and near cash items 5,220,436 4,923,750 3,496,397 2,796,849 2,073,101 1,860,837 1,277,793 617,647 659,489 379,798
Investments 200,486 159,733 98,637 103,701 86,912 69,047 61,299 66,126 37,742 32,305
Loans and advances 27,801,785 23,757,588 16,908,140 13,582,928 12,675,542 11,559,936 8,968,566 5,398,168 4,684,291 4,882,142
Investments in subsidiary 320,000 320,000 320,000 320,000 20,000 20,000 – – – –
Property and equipment 1,803,150 1,516,891 1,194,663 1,122,864 857,732 629,823 557,758 429,969 422,658 401,969
Other assets 757,906 240,865 252,107 146,677 156,390 129,935 152,086 107,544 60,948 51,986
Total assets 36,103,763 30,918,827 22,269,945 18,073,018 15,869,676 14,269,579 11,017,502 6,619,454 5,865,128 5,748,200
Liabilities
Deposits from customers 9,507,134 7,230,873 6,510,033 6,541,896 5,624,399 3,412,464 2,732,031 2,386,821 2,094,478 1,398,151
Borrowings 15,376,359 13,743,732 8,691,685 4,787,693 3,423,011 6,136,152 4,805,838 1,528,532 1,428,382 2,401,083
Debentures 4,399,896 4,992,786 3,059,849 3,579,737 4,157,346 2,618,281 1,771,753 1,425,524 1,090,000 840,000
Deferred tax liability 860,681 607,702 434,104 197,116 155,732 199,093 178,788 103,560 70,968 65,240
Dividends payable 6,266 5,337 4,454 6,280 57,295 3,648 2,427 1,684 1,340 1,016
Other liabilities 921,941 676,780 576,461 426,451 350,110 325,894 399,961 439,996 275,061 156,471
Total liabilities 31,072,277 27,257,209 19,276,586 15,539,171 13,767,894 12,695,532 9,890,798 5,886,117 4,960,228 4,861,961
Equity
Stated capital 1,587,863 1,008,062 1,008,062 1,008,062 747,152 533,680 533,680 533,680 213,472 213,472
Statutory reserve fund 365,036 310,036 265,036 230,036 195,036 165,036 130,036 100,036 86,536 83,536
Other reserves 7,171 4,361 3,775 – 170,629 154,760 97,059 16,752 – –
Retained earnings 3,071,416 2,339,158 1,716,486 1,295,749 988,966 720,571 365,928 82,870 604,892 589,231
Total equity 5,031,486 3,661,618 2,993,359 2,533,847 2,101,783 1,574,047 1,126,704 733,337 904,900 886,239
Total liabilities and equity 36,103,763 30,918,827 22,269,945 18,073,018 15,869,676 14,269,579 11,017,502 6,619,454 5,865,128 5,748,200

AN
NU
AL
RE
PO
RT
20
17
/1
8 S
EN
KA
DA
GA
LA
FIN
AN
CE
PL
C
225
Key Ratios and Indicators
2018 2017 2016 2015 2014 2013 2012 2011 2010 2009
Performance indicators
Return on average total assets (%) 3.00 3.24 3.04 3.18 3.55 4.58 5.40 3.56 0.95 1.06Return on average shareholders’ funds (%) 23.11 25.87 22.19 23.28 29.11 42.84 51.23 27.15 6.14 7.04Net interest margin (%) 9.93 9.87 11.12 11.78 11.78 11.30 12.83 14.33 11.43 11.89Growth of Interest Income (%) 34.12 28.81 4.53 1.58 23.29 51.87 26.22 2.86 -6.96 23.83Growth of profit for the year (%) 16.69 40.41 13.63 0.88 -7.53 21.42 114.23 304.73 -10.45 -74.55Growth of loans and advances (%) 17.02 40.51 24.48 7.16 9.65 28.89 66.14 15.24 -4.05 1.94New Advances disbursed Rs. ‘000 17,599,623 17,290,095 11,868,522 8,263,649 6,861,202 7,009,369 7,325,099 4,069,048 2,361,059 2,672,551Net flow of Deposits Rs. ‘000 2,276,261 720,839 (31,863) 917,496 2,211,935 680,433 345,210 298,264 696,327 460,836Borrowings obtained Rs. ‘000 6,740,000 7,800,000 5,499,710 3,382,550 1,860,000 3,703,345 4,568,600 1,020,910 1,005,723 1,251,489Debentures issued Rs. ‘000 – 3,000,000 – – 2,410,000 1,216,000 565,229 300,000 350,000 240,000Capital expenditure incurred Rs. ‘000 359,136 640,867 351,403 473,130 407,514 213,881 243,266 103,066 103,682 116,993Gross Non-performing asset ratio (%)* 2.28 1.64 2.02 4.30 3.48 1.07 1.18 2.30 4.31 3.53Investor information
Earnings per share (Rs.) 13.97 13.20 9.40 8.27 8.63 10.64 8.93 4.17 1.03 1.15Dividends per share (Rs.) 3.00 2.85 2.55 1.65 3.66 2.49 2.38 1.51 0.90 1.40Net assets per share (Rs.) 69.42 56.14 45.89 38.85 35.80 29.49 21.11 13.74 42.39 41.52Interest cover (times) 1.29 1.47 1.52 1.31 1.29 1.38 1.57 1.33 1.06 1.07Dividends cover (times) 4.72 4.63 3.69 5.01 2.49 4.35 3.75 3.50 2.86 2.05Dividend payout ratio (%) 21.21 21.59 27.13 19.94 40.17 22.97 26.66 28.56 34.96 48.70Capital and leverage -0.58Core capital (%) 16.86 14.19 15.98 16.54 14.00 11.41 10.51 12.07 17.56 16.67Total capital (%) 17.65 16.08 19.90 22.97 20.93 11.31 10.51 12.07 17.56 16.67Equity as a % of total assets (%) 13.94 11.84 13.44 14.02 13.24 11.03 10.23 11.08 15.43 15.42Equity as a % of total deposits and borrowings (%) 17.18 14.10 16.39 17.00 15.92 12.94 12.10 13.73 19.62 19.10Growth of total assets (%) 16.77 38.84 23.22 13.88 11.21 29.52 66.44 12.86 2.03 -0.65Growth of net assets (%) 37.41 22.32 18.13 20.56 33.53 39.70 53.64 -18.96 2.11 3.42Earnings retention ratio (%) 78.79 78.41 72.87 80.06 59.83 77.03 73.34 71.44 65.04 51.30Capital to total deposits (%) 52.92 50.64 45.98 38.73 37.37 46.13 41.24 30.72 43.20 63.39Debt to equity ratio (times) 3.93 5.12 3.93 3.30 3.61 5.56 5.84 4.03 2.78 3.66LiquidityLiquid assets as a % of total assets 14.46 15.92 15.70 15.48 13.06 13.04 11.60 9.33 11.24 6.61Liquid assets as a % of total deposit liability 54.91 68.09 53.71 42.75 36.86 54.53 46.77 25.88 31.49 27.16OperationalNumber of branches 54 49 39 39 39 39 30 30 30 30Number of service centres 41 41 41 41 24 13 15 0 0 0Number of pawning centres 26 18 13 11 11 6 1 0 0 0Number of staff 745 690 627 601 492 414 347 235 213 211Staff productivity (Rs. ’000) 1,822 1,622 1,408 1,077 1,265 1,644 1,830 1,488 650 538
* As per CBSL regulations
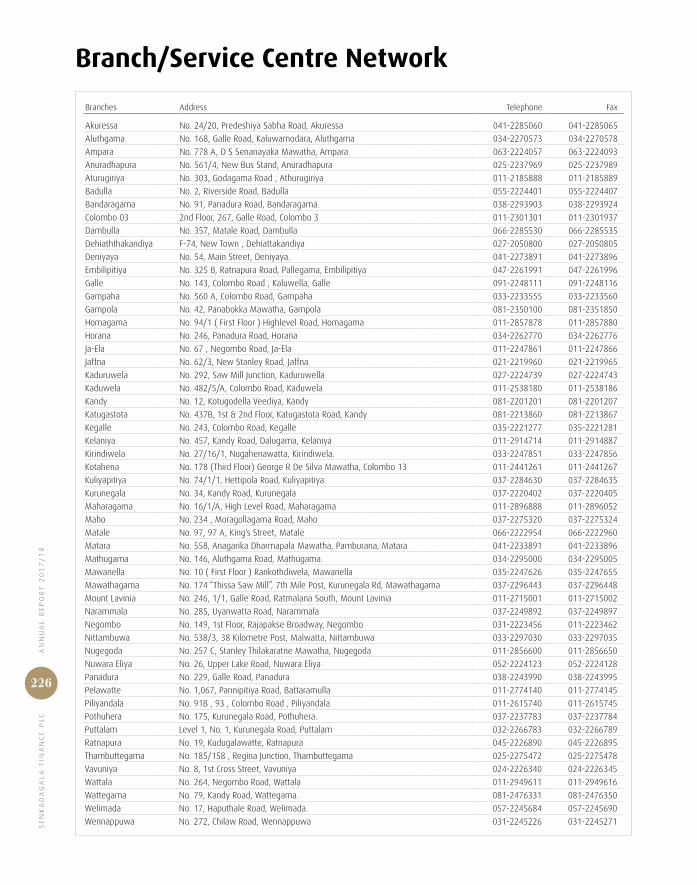
SE
NK
AD
AG
AL
A F
INA
NC
E P
LC
AN
NU
AL
RE
PO
RT
20
17
/1
8
226
Branch/Service Centre Network
Branches Address Telephone Fax
Akuressa No. 24/20, Predeshiya Sabha Road, Akuressa 041-2285060 041-2285065
Aluthgama No. 168, Galle Road, Kaluwamodara, Aluthgama 034-2270573 034-2270578
Ampara No. 778 A, D S Senanayaka Mawatha, Ampara 063-2224057 063-2224093
Anuradhapura No. 561/4, New Bus Stand, Anuradhapura 025-2237969 025-2237989
Aturugiriya No. 303, Godagama Road , Athurugiriya 011-2185888 011-2185889
Badulla No. 2, Riverside Road, Badulla 055-2224401 055-2224407
Bandaragama No. 91, Panadura Road, Bandaragama. 038-2293903 038-2293924
Colombo 03 2nd Floor, 267, Galle Road, Colombo 3 011-2301301 011-2301937
Dambulla No. 357, Matale Road, Dambulla 066-2285530 066-2285535
Dehiaththakandiya F-74, New Town , Dehiattakandiya 027-2050800 027-2050805
Deniyaya No. 54, Main Street, Deniyaya. 041-2273891 041-2273896
Embilipitiya No. 325 B, Ratnapura Road, Pallegama, Embilipitiya 047-2261991 047-2261996
Galle No. 143, Colombo Road , Kaluwella, Galle 091-2248111 091-2248116
Gampaha No. 560 A, Colombo Road, Gampaha 033-2233555 033-2233560
Gampola No. 42, Panabokka Mawatha, Gampola 081-2350100 081-2351850
Homagama No. 94/1 ( First Floor ) Highlevel Road, Homagama 011-2857878 011-2857880
Horana No. 246, Panadura Road, Horana 034-2262770 034-2262776
Ja-Ela No. 67 , Negombo Road, Ja-Ela 011-2247861 011-2247866
Jaffna No. 62/3, New Stanley Road, Jaffna 021-2219960 021-2219965
Kaduruwela No. 292, Saw Mill Junction, Kaduruwella 027-2224739 027-2224743
Kaduwela No. 482/5/A, Colombo Road, Kaduwela 011-2538180 011-2538186
Kandy No. 12, Kotugodella Veediya, Kandy 081-2201201 081-2201207
Katugastota No. 437B, 1st & 2nd Floor, Katugastota Road, Kandy 081-2213860 081-2213867
Kegalle No. 243, Colombo Road, Kegalle 035-2221277 035-2221281
Kelaniya No. 457, Kandy Road, Dalugama, Kelaniya 011-2914714 011-2914887
Kirindiwela No. 27/16/1, Nugahenawatta, Kirindiwela. 033-2247851 033-2247856
Kotahena No. 178 (Third Floor) George R De Silva Mawatha, Colombo 13 011-2441261 011-2441267
Kuliyapitiya No. 74/1/1, Hettipola Road, Kuliyapitiya 037-2284630 037-2284635
Kurunegala No. 34, Kandy Road, Kurunegala 037-2220402 037-2220405
Maharagama No. 16/1/A, High Level Road, Maharagama 011-2896888 011-2896052
Maho No. 234 , Moragollagama Road, Maho 037-2275320 037-2275324
Matale No. 97, 97 A, King‘s Street, Matale 066-2222954 066-2222960
Matara No. 558, Anagarika Dharmapala Mawatha, Pamburana, Matara 041-2233891 041-2233896
Mathugama No. 146, Aluthgama Road, Mathugama. 034-2295000 034-2295005
Mawanella No. 10 ( First Floor ) Rankothdiwela, Mawanella 035-2247626 035-2247655
Mawathagama No. 174 “Thissa Saw Mill”, 7th Mile Post, Kurunegala Rd, Mawathagama 037-2296443 037-2296448
Mount Lavinia No. 246, 1/1, Galle Road, Ratmalana South, Mount Lavinia 011-2715001 011-2715002
Narammala No. 285, Uyanwatta Road, Narammala 037-2249892 037-2249897
Negombo No. 149, 1st Floor, Rajapakse Broadway, Negombo 031-2223456 011-2223462
Nittambuwa No. 538/3, 38 Kilometre Post, Malwatta, Nittambuwa 033-2297030 033-2297035
Nugegoda No. 257 C, Stanley Thilakaratne Mawatha, Nugegoda 011-2856600 011-2856650
Nuwara Eliya No. 26, Upper Lake Road, Nuwara Eliya 052-2224123 052-2224128
Panadura No. 229, Galle Road, Panadura 038-2243990 038-2243995
Pelawatte No. 1,067, Pannipitiya Road, Battaramulla 011-2774140 011-2774145
Piliyandala No. 91B , 93 , Colombo Road , Piliyandala 011-2615740 011-2615745
Pothuhera No. 175, Kurunegala Road, Pothuhera. 037-2237783 037-2237784
Puttalam Level 1, No. 1, Kurunegala Road, Puttalam 032-2266783 032-2266789
Ratnapura No. 19, Kudugalawatte, Ratnapura 045-2226890 045-2226895
Thambuttegama No. 185/158 , Regina Junction, Thambuttegama 025-2275472 025-2275478
Vavuniya No. 8, 1st Cross Street, Vavuniya 024-2226340 024-2226345
Wattala No. 264, Negombo Road, Wattala 011-2949611 011-2949616
Wattegama No. 79, Kandy Road, Wattegama. 081-2476331 081-2476350
Welimada No. 17, Haputhale Road, Welimada. 057-2245684 057-2245690
Wennappuwa No. 272, Chilaw Road, Wennappuwa 031-2245226 031-2245271
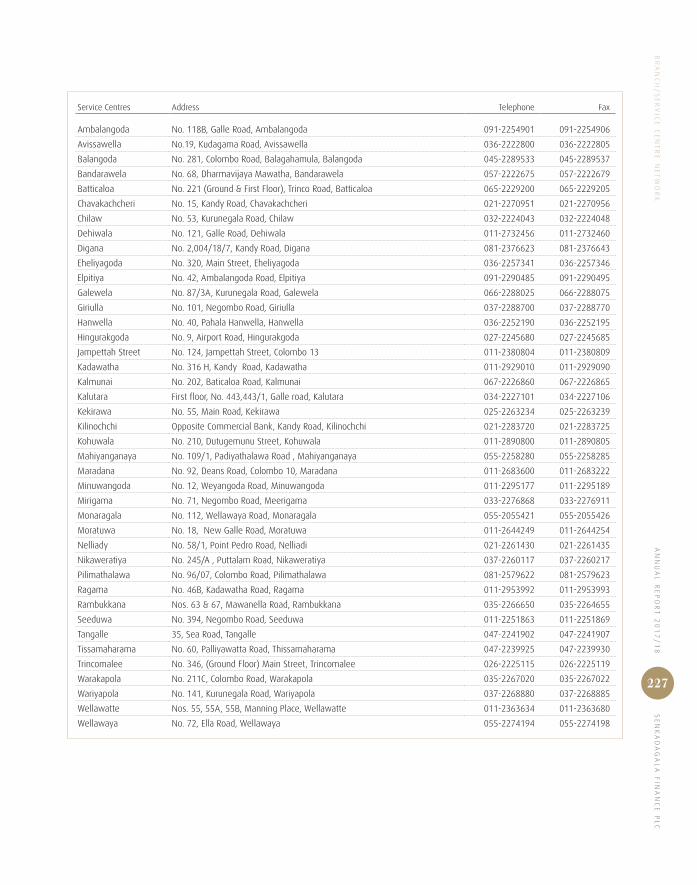
AN
NU
AL
RE
PO
RT
20
17
/1
8 S
EN
KA
DA
GA
LA
FIN
AN
CE
PL
C
227
BR
AN
CH
/S
ER
VIC
E C
EN
TR
E N
ET
WO
RK
Service Centres Address Telephone Fax
Ambalangoda No. 118B, Galle Road, Ambalangoda 091-2254901 091-2254906
Avissawella No.19, Kudagama Road, Avissawella 036-2222800 036-2222805
Balangoda No. 281, Colombo Road, Balagahamula, Balangoda 045-2289533 045-2289537
Bandarawela No. 68, Dharmavijaya Mawatha, Bandarawela 057-2222675 057-2222679
Batticaloa No. 221 (Ground & First Floor), Trinco Road, Batticaloa 065-2229200 065-2229205
Chavakachcheri No. 15, Kandy Road, Chavakachcheri 021-2270951 021-2270956
Chilaw No. 53, Kurunegala Road, Chilaw 032-2224043 032-2224048
Dehiwala No. 121, Galle Road, Dehiwala 011-2732456 011-2732460
Digana No. 2,004/18/7, Kandy Road, Digana 081-2376623 081-2376643
Eheliyagoda No. 320, Main Street, Eheliyagoda 036-2257341 036-2257346
Elpitiya No. 42, Ambalangoda Road, Elpitiya 091-2290485 091-2290495
Galewela No. 87/3A, Kurunegala Road, Galewela 066-2288025 066-2288075
Giriulla No. 101, Negombo Road, Giriulla 037-2288700 037-2288770
Hanwella No. 40, Pahala Hanwella, Hanwella 036-2252190 036-2252195
Hingurakgoda No. 9, Airport Road, Hingurakgoda 027-2245680 027-2245685
Jampettah Street No. 124, Jampettah Street, Colombo 13 011-2380804 011-2380809
Kadawatha No. 316 H, Kandy Road, Kadawatha 011-2929010 011-2929090
Kalmunai No. 202, Baticaloa Road, Kalmunai 067-2226860 067-2226865
Kalutara First floor, No. 443,443/1, Galle road, Kalutara 034-2227101 034-2227106
Kekirawa No. 55, Main Road, Kekirawa 025-2263234 025-2263239
Kilinochchi Opposite Commercial Bank, Kandy Road, Kilinochchi 021-2283720 021-2283725
Kohuwala No. 210, Dutugemunu Street, Kohuwala 011-2890800 011-2890805
Mahiyanganaya No. 109/1, Padiyathalawa Road , Mahiyanganaya 055-2258280 055-2258285
Maradana No. 92, Deans Road, Colombo 10, Maradana 011-2683600 011-2683222
Minuwangoda No. 12, Weyangoda Road, Minuwangoda 011-2295177 011-2295189
Mirigama No. 71, Negombo Road, Meerigama 033-2276868 033-2276911
Monaragala No. 112, Wellawaya Road, Monaragala 055-2055421 055-2055426
Moratuwa No. 18, New Galle Road, Moratuwa 011-2644249 011-2644254
Nelliady No. 58/1, Point Pedro Road, Nelliadi 021-2261430 021-2261435
Nikaweratiya No. 245/A , Puttalam Road, Nikaweratiya 037-2260117 037-2260217
Pilimathalawa No. 96/07, Colombo Road, Pilimathalawa 081-2579622 081-2579623
Ragama No. 46B, Kadawatha Road, Ragama 011-2953992 011-2953993
Rambukkana Nos. 63 & 67, Mawanella Road, Rambukkana 035-2266650 035-2264655
Seeduwa No. 394, Negombo Road, Seeduwa 011-2251863 011-2251869
Tangalle 35, Sea Road, Tangalle 047-2241902 047-2241907
Tissamaharama No. 60, Palliyawatta Road, Thissamaharama 047-2239925 047-2239930
Trincomalee No. 346, (Ground Floor) Main Street, Trincomalee 026-2225115 026-2225119
Warakapola No. 211C, Colombo Road, Warakapola 035-2267020 035-2267022
Wariyapola No. 141, Kurunegala Road, Wariyapola 037-2268880 037-2268885
Wellawatte Nos. 55, 55A, 55B, Manning Place, Wellawatte 011-2363634 011-2363680
Wellawaya No. 72, Ella Road, Wellawaya 055-2274194 055-2274198
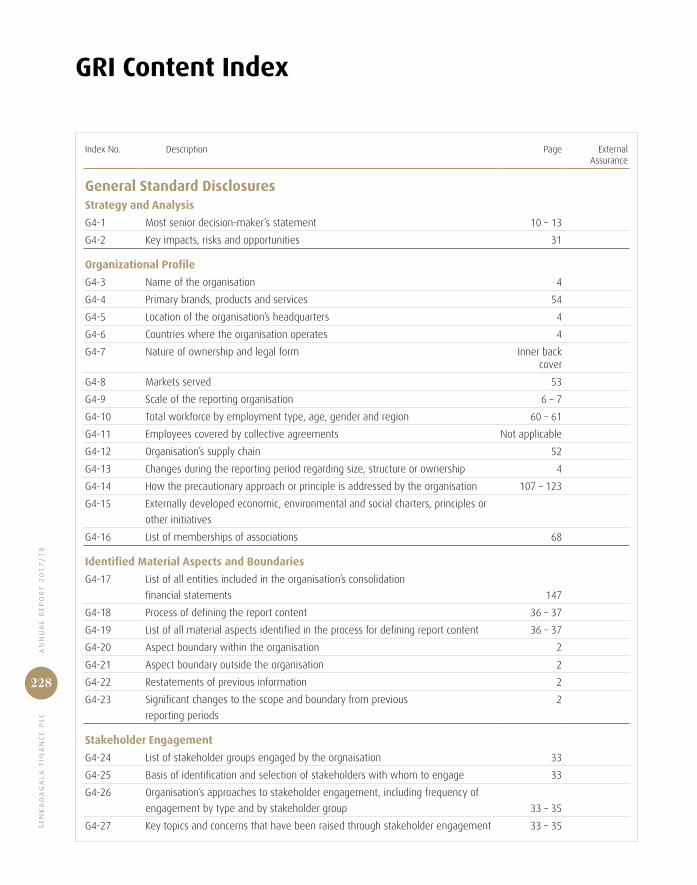
SE
NK
AD
AG
AL
A F
INA
NC
E P
LC
AN
NU
AL
RE
PO
RT
20
17
/1
8
228
Index No. Description Page ExternalAssurance
General Standard DisclosuresStrategy and Analysis
G4-1 Most senior decision-maker’s statement 10 – 13
G4-2 Key impacts, risks and opportunities 31
Organizational Profile
G4-3 Name of the organisation 4
G4-4 Primary brands, products and services 54
G4-5 Location of the organisation’s headquarters 4
G4-6 Countries where the organisation operates 4
G4-7 Nature of ownership and legal form Inner back cover
G4-8 Markets served 53
G4-9 Scale of the reporting organisation 6 – 7
G4-10 Total workforce by employment type, age, gender and region 60 – 61
G4-11 Employees covered by collective agreements Not applicable
G4-12 Organisation’s supply chain 52
G4-13 Changes during the reporting period regarding size, structure or ownership 4
G4-14 How the precautionary approach or principle is addressed by the organisation 107 – 123
G4-15 Externally developed economic, environmental and social charters, principles or
other initiatives
G4-16 List of memberships of associations 68
Identified Material Aspects and Boundaries
G4-17 List of all entities included in the organisation’s consolidation
financial statements 147
G4-18 Process of defining the report content 36 – 37
G4-19 List of all material aspects identified in the process for defining report content 36 – 37
G4-20 Aspect boundary within the organisation 2
G4-21 Aspect boundary outside the organisation 2
G4-22 Restatements of previous information 2
G4-23 Significant changes to the scope and boundary from previous
reporting periods
2
Stakeholder Engagement
G4-24 List of stakeholder groups engaged by the orgnaisation 33
G4-25 Basis of identification and selection of stakeholders with whom to engage 33
G4-26 Organisation’s approaches to stakeholder engagement, including frequency of
engagement by type and by stakeholder group 33 – 35
G4-27 Key topics and concerns that have been raised through stakeholder engagement 33 – 35
GRI Content Index
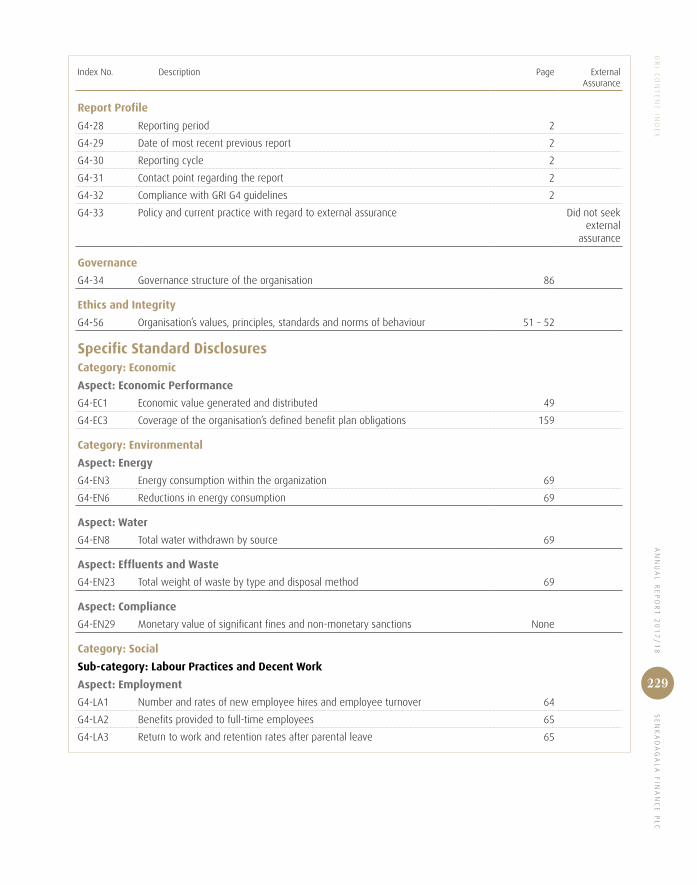
AN
NU
AL
RE
PO
RT
20
17
/1
8 S
EN
KA
DA
GA
LA
FIN
AN
CE
PL
C
229
GR
I CO
NT
EN
T IN
DE
X
Index No. Description Page ExternalAssurance
Report Profile
G4-28 Reporting period 2
G4-29 Date of most recent previous report 2
G4-30 Reporting cycle 2
G4-31 Contact point regarding the report 2
G4-32 Compliance with GRI G4 guidelines 2
G4-33 Policy and current practice with regard to external assurance Did not seek external
assurance
Governance
G4-34 Governance structure of the organisation 86
Ethics and Integrity
G4-56 Organisation’s values, principles, standards and norms of behaviour 51 – 52
Specific Standard DisclosuresCategory: Economic
Aspect: Economic Performance
G4-EC1 Economic value generated and distributed 49
G4-EC3 Coverage of the organisation’s defined benefit plan obligations 159
Category: Environmental
Aspect: Energy
G4-EN3 Energy consumption within the organization 69
G4-EN6 Reductions in energy consumption 69
Aspect: Water
G4-EN8 Total water withdrawn by source 69
Aspect: Effluents and Waste
G4-EN23 Total weight of waste by type and disposal method 69
Aspect: Compliance
G4-EN29 Monetary value of significant fines and non-monetary sanctions None
Category: Social
Sub-category: Labour Practices and Decent Work
Aspect: Employment
G4-LA1 Number and rates of new employee hires and employee turnover 64
G4-LA2 Benefits provided to full-time employees 65
G4-LA3 Return to work and retention rates after parental leave 65
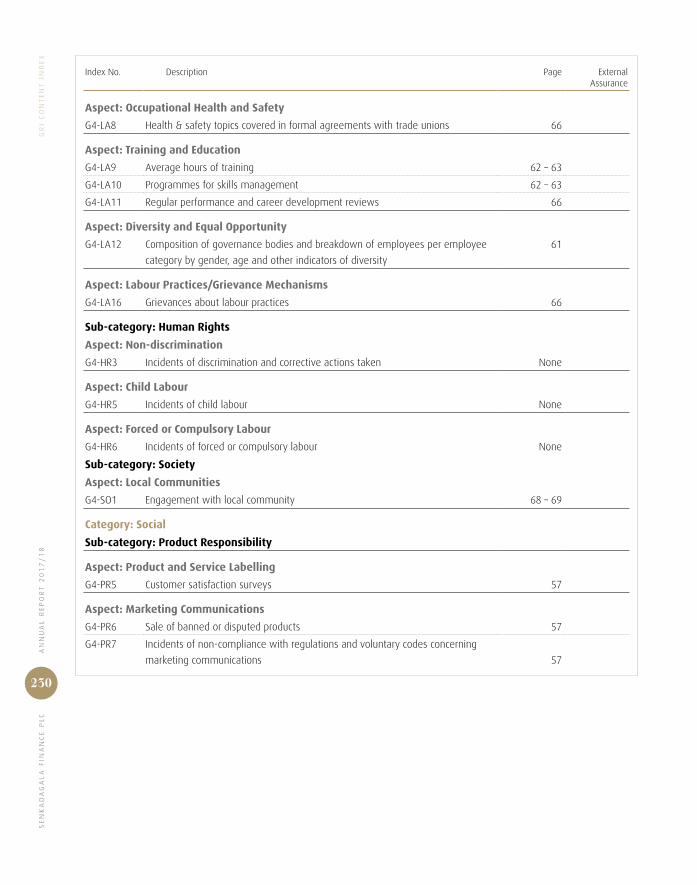
SE
NK
AD
AG
AL
A F
INA
NC
E P
LC
AN
NU
AL
RE
PO
RT
20
17
/1
8
230
GR
I C
ON
TE
NT
IN
DE
X
Index No. Description Page ExternalAssurance
Aspect: Occupational Health and Safety
G4-LA8 Health & safety topics covered in formal agreements with trade unions 66
Aspect: Training and Education
G4-LA9 Average hours of training 62 – 63
G4-LA10 Programmes for skills management 62 – 63
G4-LA11 Regular performance and career development reviews 66
Aspect: Diversity and Equal Opportunity
G4-LA12 Composition of governance bodies and breakdown of employees per employee
category by gender, age and other indicators of diversity
61
Aspect: Labour Practices/Grievance Mechanisms
G4-LA16 Grievances about labour practices 66
Sub-category: Human Rights
Aspect: Non-discrimination
G4-HR3 Incidents of discrimination and corrective actions taken None
Aspect: Child Labour
G4-HR5 Incidents of child labour None
Aspect: Forced or Compulsory Labour
G4-HR6 Incidents of forced or compulsory labour None
Sub-category: Society
Aspect: Local Communities
G4-SO1 Engagement with local community 68 – 69
Category: Social
Sub-category: Product Responsibility
Aspect: Product and Service Labelling
G4-PR5 Customer satisfaction surveys 57
Aspect: Marketing Communications
G4-PR6 Sale of banned or disputed products 57
G4-PR7 Incidents of non-compliance with regulations and voluntary codes concerning
marketing communications 57

AN
NU
AL
RE
PO
RT
20
17
/1
8 S
EN
KA
DA
GA
LA
FIN
AN
CE
PL
C
231
GR
I CO
NT
EN
T IN
DE
X
Index No. Description Page ExternalAssurance
Aspect: Customer Privacy
G4-PR8 Complaints regarding breaches of customer privacy and losses of
customer data
57
Aspect: Compliance
G4-PR9 Monetary value of significant fines for non-compliance with laws and regulations
concerning the provision and use of products and services
None
Financial Sector Disclosures
Product Portfolio
FS2 Assessing and screening environmental and social risks 69
FS5 Interactions with stakeholders regarding environmental and social risks and opportunities 69
FS6 Portfolio for business lines 57
Local Communities
FS13 Access points 53
FS14 Initiatives to improve access to financial services 53
Product and Service Labelling
FS16 Initiatives to enhance financial literacy 68
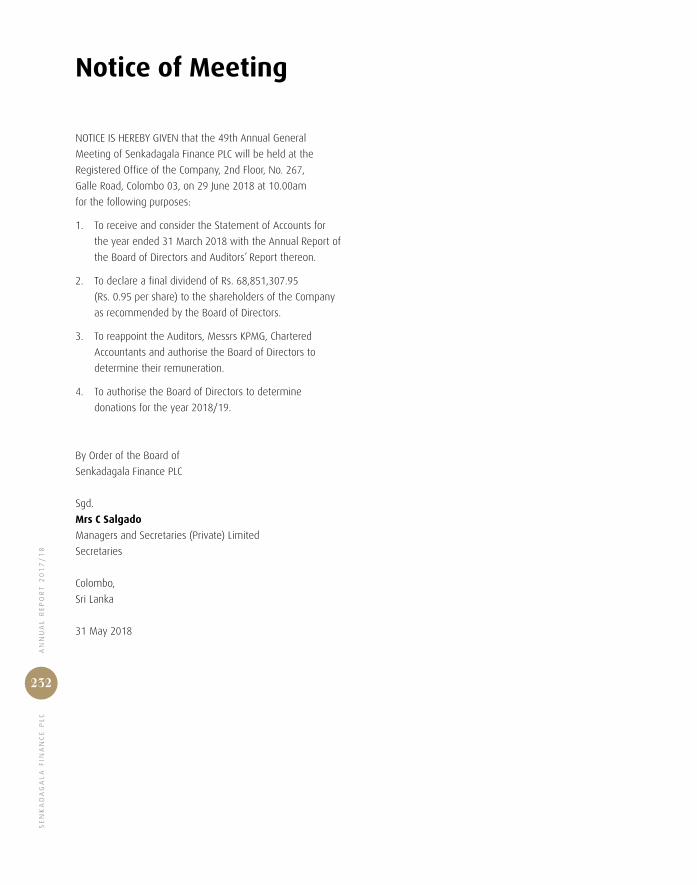
SE
NK
AD
AG
AL
A F
INA
NC
E P
LC
AN
NU
AL
RE
PO
RT
20
17
/1
8
232
Notice of Meeting
NOTICE IS HEREBY GIVEN that the 49th Annual General
Meeting of Senkadagala Finance PLC will be held at the
Registered Office of the Company, 2nd Floor, No. 267,
Galle Road, Colombo 03, on 29 June 2018 at 10.00am
for the following purposes:
1. To receive and consider the Statement of Accounts for
the year ended 31 March 2018 with the Annual Report of
the Board of Directors and Auditors’ Report thereon.
2. To declare a final dividend of Rs. 68,851,307.95
(Rs. 0.95 per share) to the shareholders of the Company
as recommended by the Board of Directors.
3. To reappoint the Auditors, Messrs KPMG, Chartered
Accountants and authorise the Board of Directors to
determine their remuneration.
4. To authorise the Board of Directors to determine
donations for the year 2018/19.
By Order of the Board of
Senkadagala Finance PLC
Sgd.
Mrs C Salgado
Managers and Secretaries (Private) Limited
Secretaries
Colombo,
Sri Lanka
31 May 2018

AN
NU
AL
RE
PO
RT
20
17
/1
8 S
EN
KA
DA
GA
LA
FIN
AN
CE
PL
C
Form of Proxy
I/We, the undersigned............................................…………………………………………....................................................………………………….
of.........................................................……….………………………………………………………………………………..being a member/members* of
Senkadagala Finance PLC hereby appoint –
Mr Lakshman Balasuriya of Colombo or failing him*
Dr Asoka Balasuriya of Kandy or failing him*
Dr Mahendra Balasuriya of Colombo or failing him*
Mrs Lakshmi Fernando of Colombo or failing her*
Mr Widanalage Ajith Terrence Fernando of Colombo or failing him*
Dr Prathap Ramanujam of Colombo or failing him*
Mr Sanath Divale Bandaranayake of Colombo or failing him*
Mr Don Tilak Padmanabha Collure of Colombo or failing him*
Mr Wadugamudalige Marius Ravindra Sirilal Dias of Colombo or failing him*
Mr Senanayakege Raja Pushpakumara of Colombo or failing him*
Mr/Mrs/Dr………………………………………………………………………………………………………………….....……….................................................
of ………………………………………………..................................………………………….............................................……………..…………………..as my/
our* proxy to attend and vote at the 49th Annual General Meeting of the Company to be held at the Registered Office of the
Company, 2nd Floor, No. 267, Galle Road, Colombo 03 on 29 June 2018 at 10.00am and at any adjournment thereof.
For Against
1. To receive and consider the Statement of Accounts for the year ended 31 March 2018 with the
Annual Report of the Board of Directors and Auditors’ Report thereon.
2. To declare a final dividend of Rs. 68,851,307.95 (Rs. 0.95 per share) to the shareholders of the
Company as recommended by the Board of Directors.
3. To reappoint the Auditors, Messrs. KPMG, Chartered Accountants and authorise the Board of
Directors to determine their remuneration.
5. To authorise the Board of Directors to determine donations for the year 2018/19.
Signed on this………................................................................................…………day of…...............…….......................................…………2018.
……………...............……… ……………..........................................………
Signature NIC/PP/Co. Reg. No.
Note
*Please delete the inappropriate words.
Instructions on completing the Form of Proxy are set out on the reverse.
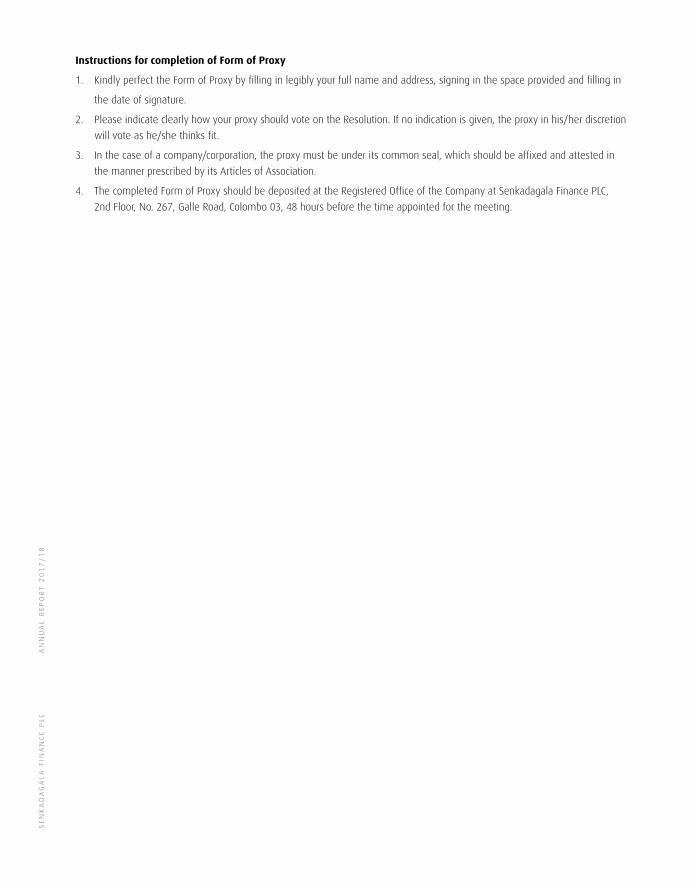
SE
NK
AD
AG
AL
A F
INA
NC
E P
LC
AN
NU
AL
RE
PO
RT
20
17
/1
8
Instructions for completion of Form of Proxy
1. Kindly perfect the Form of Proxy by filling in legibly your full name and address, signing in the space provided and filling in
the date of signature.
2. Please indicate clearly how your proxy should vote on the Resolution. If no indication is given, the proxy in his/her discretion
will vote as he/she thinks fit.
3. In the case of a company/corporation, the proxy must be under its common seal, which should be affixed and attested in
the manner prescribed by its Articles of Association.
4. The completed Form of Proxy should be deposited at the Registered Office of the Company at Senkadagala Finance PLC,
2nd Floor, No. 267, Galle Road, Colombo 03, 48 hours before the time appointed for the meeting.
Corporate Information
Name of CompanySenkadagala Finance PLC
Date of Incorporation29 December 1968
Legal Status z Listed public limited liability company
incorporated on 29 December 1968. The Company re-registered under the Companies Act No. 07 of 2007.
z Approved and registered under the Finance Business Act No. 42 of 2011.
z Approved and registered under the Finance Leasing Act No. 56 of 2000.
Company Registration NumberPB 238 PQ
Taxpayer Identification Number (TIN)104028349
Registered Office2nd Floor, 267, Galle Road,Colombo 03,Sri LankaTel: 011-2301301Fax: 011-2301937SWIFT code: SENFLKLXEmail: [email protected]: www.senfin.com
Stock Exchange Listing z 72,475,061 ordinary shares of the
Company are listed in the “Diri Savi” Board of the Colombo Stock Exchange with effect from 22 March 2011
z 12,500,000 subordinate, unsecured, redeemable debentures of Rs. 100 each – December 2013 to December 2018 with fixed rate interest payments
z 3,972,700 senior, unsecured, listed, redeemable, rated Debenture of Rs. 100 each – November 2016 to November 2018 with fixed rate interest payments
z 1,895,200 senior, unsecured, listed, redeemable, rated Debenture of Rs. 100/- each – November 2016 to November 2019 with fixed and floating rate interest payments
z 24,132,100 senior, unsecured, listed, redeemable, rated Debenture of Rs. 100/- each – November 2016 to November 2020 with fixed and floating rate interest payments are listed in the Main Board of the Colombo Stock Exchange
Credit RatingFitch Ratings Lanka Ltd. affirmed BBB+ (lka) with a stable outlook, in 2017
Board of Directors Mr W M R S DiasFCIBC (Lon), LL.BHubert H Humphrey FellowChairman
Dr P RamanujamBSc (Hons), MSc. PhD in EconomicsIndependent Non-Executive Director
Mr L BalasuriyaBSc (Lon), MSc (Lancaster)Managing Director/CEO
Dr A BalasuriyaBSc (Lon), PhD (Lon)Executive Director – Operations
Dr M BalasuriyaBVScExecutive Director – Planning
Ms L FernandoBSc (Hons)Executive Director – Human Resources
Mr W A T FernandoFCMA (UK), MA (Colombo)Independent Non-Executive Director
Mr S D BandaranayakeBSc (University of Sri Lanka)Executive Director – Additional CEO
Mr T CollureBSc (Colombo), MPA (USJ)Independent Non-Executive Director
Mr Senanayakege R Pushpakumara
FCA, B Com (Special) (USJ), PG Dip. (B Mgt.) Independent Non-Executive Director
Secretaries Managers and Secretaries (Pvt) Ltd.8, Tickell Road, Colombo 08
AuditorsKPMGChartered Accountants32A, Sir Mohamed Macan Markar Mawatha,Colombo 03
Legal ConsultantsFJ & G de SaramAttorneys-at-Law216, De Saram Place,Colombo 10
Internal AuditorsErnst & Young Advisory Services (Pvt) Ltd.839/2, Peradeniya Road, Kandy
BankersCommercial Bank of Ceylon PLCHatton National Bank PLCSampath Bank PLCNational Development Bank PLC


2nd Floor, No. 267, Galle Road, Colombo 3, Sri LankaTel: +94 11 2301301 | Fax: +94 11 2301937 Email: [email protected]
SENKADAGALA FINANCE PLC