years of chl a meris products in the wadden sea
TRANSCRIPT

10 years of Chl‐a MERIS products in the Wadden Sea
M.S. Salama
University of Twente, Faculty of Geo‐Information Science and Earth Observation (ITC), Department of Water Resources, P.O. Box 217, 7500 AE Enschede, The Netherlands

Phytoplankton blooms & variability
Phytoplankton populations often fluctuate over a recurrent annual cycle, with shorter and longer term variability superimposed
Many processes affect bloom dynamics in the Wadden Sea…… interface with land, underlying sediment, mudflats… exasperated by human modifications across the linked terrestrial and aquatic landscapes
Impact…… aquatic ecosystem food webs… biogeochemical cycling… water quality…

Methodological framework: Temporal scales of variability
Long termDisturbance related to major environmental change
AnnualYearly variation
SeasonalMonthly variation, seasonality
Event‐scaleResidual; related to magnitude and timing of bloom events

Applied to 84 coastal andestuarine sites, using monthlypoint in situ data (Cloern &Jassby, 2010).
High variability in the relativeimportance of the differentsources of temporal variability.
Underlying ecological driverswere proposed.
Methodological framework: Temporal scales of variability

cij = C*yi*mj*εij (Cloern & Jassby, 2010)
C: Long‐term mean of the time seriesYi: Annual mean in ith yearMij: Seasonal (monthly) mean in month j and year iyi: Annual effect in ith year (= Yi / C)mj: Seasonal (monthly) effect in month j (= (Mij/Yi))εij: Residual (= cij/(C*yi*mj) )
Methodological framework: Time series decomposition

The current hypothesis is (1) that MERIS satellite imagery can be used to similarly uncoverand decompose the temporal variability of phytoplankton dynamics.
It is also proposed (2) that sites across the western Dutch Wadden Sea and IJsselmeerdisplay different variability regimes.
Hypothesis
(1) MERIS chlorophyll‐a retrieval algorithm calibration‐validation
(2) Application of time series decomposition to resulting MERIS products
(3) Interpretation as a function of potential environmental drivers
Objectives

IJsselmeerLarge (1190 km2), shallow (average 4.4 m; max. 9 m) lakeEutrophic – hypertrophicSummer blooms (chl‐a > 150 mg m‐3), cyanobacteria dominanceHigh turbidity (secchi depth typically > 1.5 m); inorganic suspended matter (TSM 3 ‐ > 100 g m‐3)North‐south gradient in optical properties related to inflow
western Dutch Wadden SeaHighly variable (spatially & temporally) chl‐a (<1 ‐ >100 mg m‐3), TSM, (<1 ‐ >1000 g m‐3)Tidal cycle; North Sea flushing; terrestrial runoffComplex hydromorphic features: tidal channels, mudflats
Study sites

Data
In situ chl‐a(1) Archive measurements from the Rijkswaterstaat online database (live.waterbase.nl)
(2) Measurements made during punctual campaigns by Simis et al. (2004‐2005)
Satellite imageFull‐resolution MERIS images spanning the complete (2002‐2012) archive, from ESA
Environmental driversFrom the Royal Netherlands Meteorological Institute (KNMI)
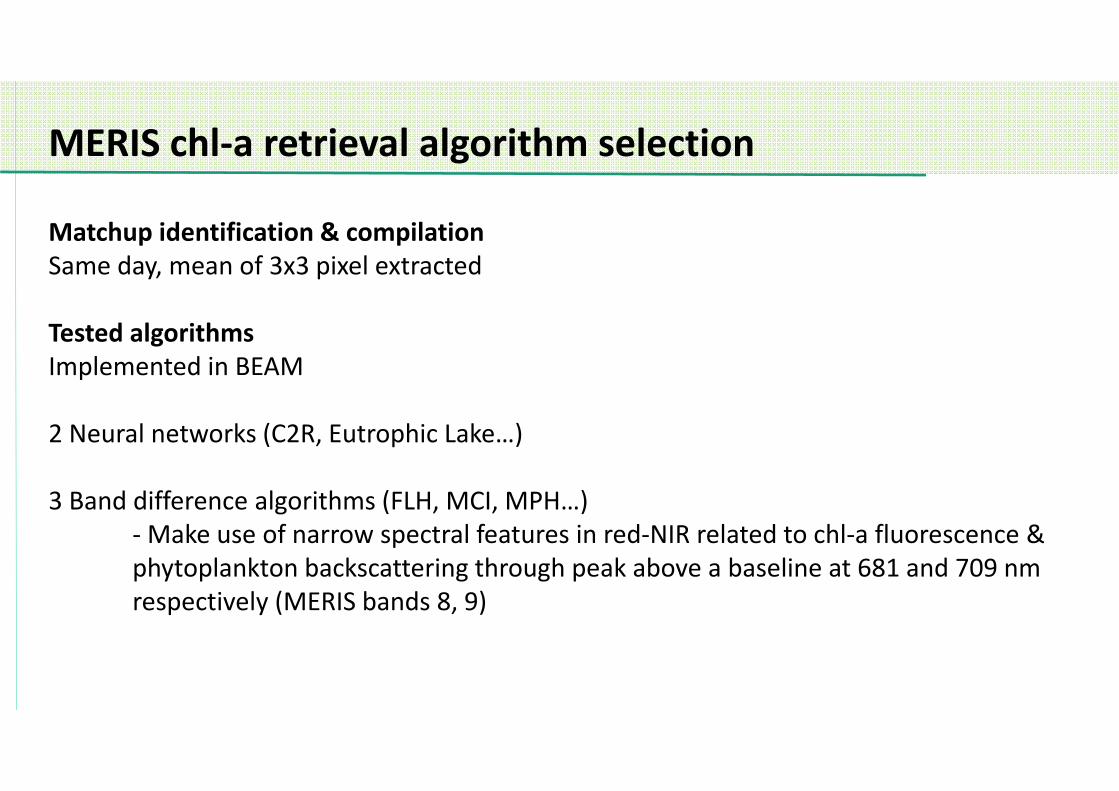
MERIS chl‐a retrieval algorithm selection
Matchup identification & compilationSame day, mean of 3x3 pixel extracted
Tested algorithmsImplemented in BEAM
2 Neural networks (C2R, Eutrophic Lake…)
3 Band difference algorithms (FLH, MCI, MPH…)‐Make use of narrow spectral features in red‐NIR related to chl‐a fluorescence & phytoplankton backscattering through peak above a baseline at 681 and 709 nm respectively (MERIS bands 8, 9)

MPH
FLH MCI

Results: MERIS chl‐a retrieval algorithm selection
R2 = 0.29R2 = 0.41
R2 = 0.02R2 = 0.39
R2 = 0.32R2 = 0.32
R2 = 0.45R2 = 0.53
R2 = 0.65R2 = 0.53

Results: Local MPH calibration/validationIJsselmeerwestern Dutch Wadden Sea
Chl‐a = (MPH + 0.0009) / 0.0002 Chl‐a = (MPH + 0.002) / 0.0002

Results: Local MPH calibration/validation
MPH + local coefficients Daily images 10 days mean bins Monthly mean bins
R2 = 0.45R2 = 0.51

Chl-a (mg m-3)
Results: Long‐term climatologycij = C*yi*mj*εij
Hydromorphic features in the western Wadden SeaTidal channels, Mudflats
Consistent artifact in NE IJsselmeer
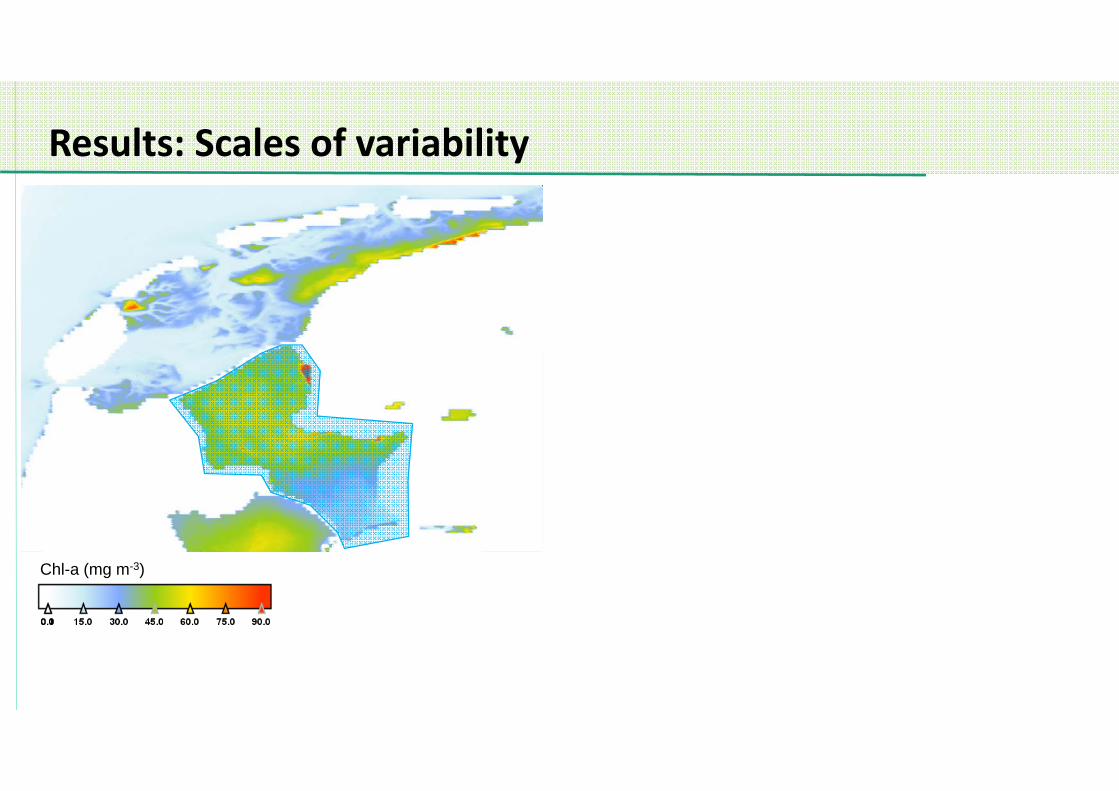
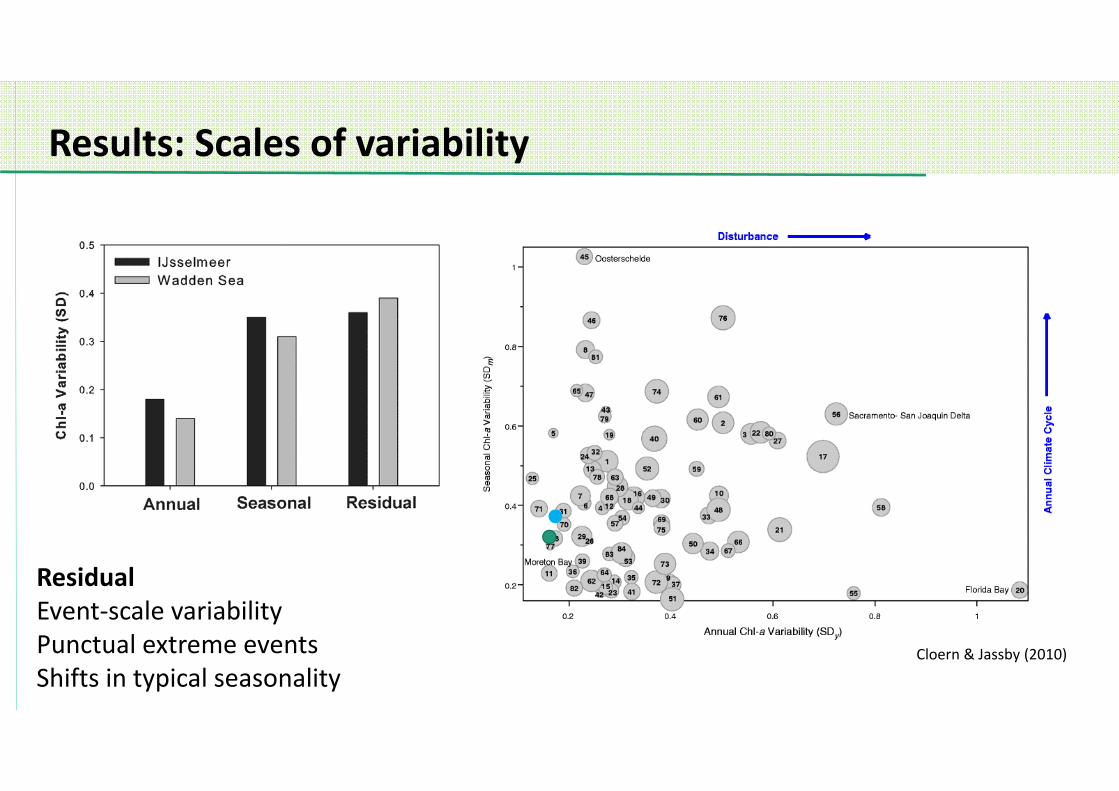
Results: Scales of variability
Chl-a (mg m-3)

Results: Annual climatology2004 2005
2006 2007 2008
2009 2010 2011
Chl-a (mg m-3)

Results: Scales of variability
2010
2007
Annual = Yi/C Chl‐a anomaly (mg m‐3)
1 1.50.5
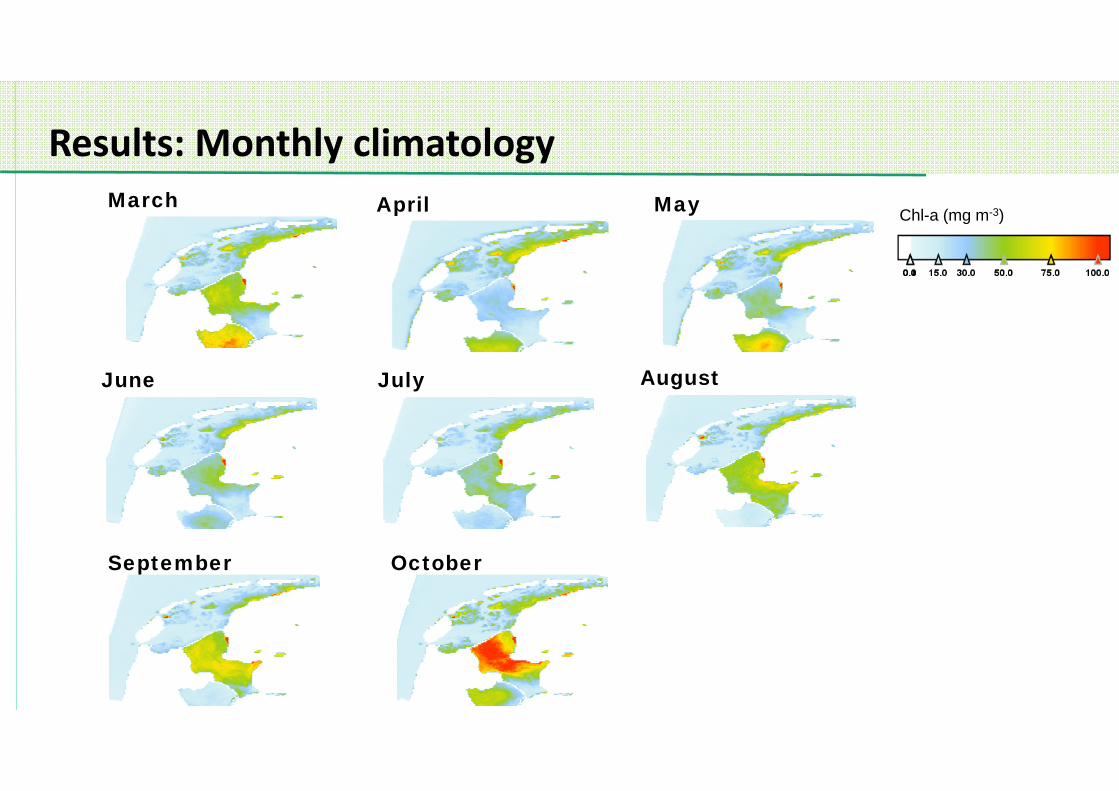
Results: Monthly climatologyMarch May
June July
September October
April
August
Chl-a (mg m-3)

Results: Scales of variability
April
August
Seasonal = ( / ) Chl‐a anomaly (mg m‐3)
1 1.50.5
Chl‐a anomaly (mg m‐3)
1 1.50.5
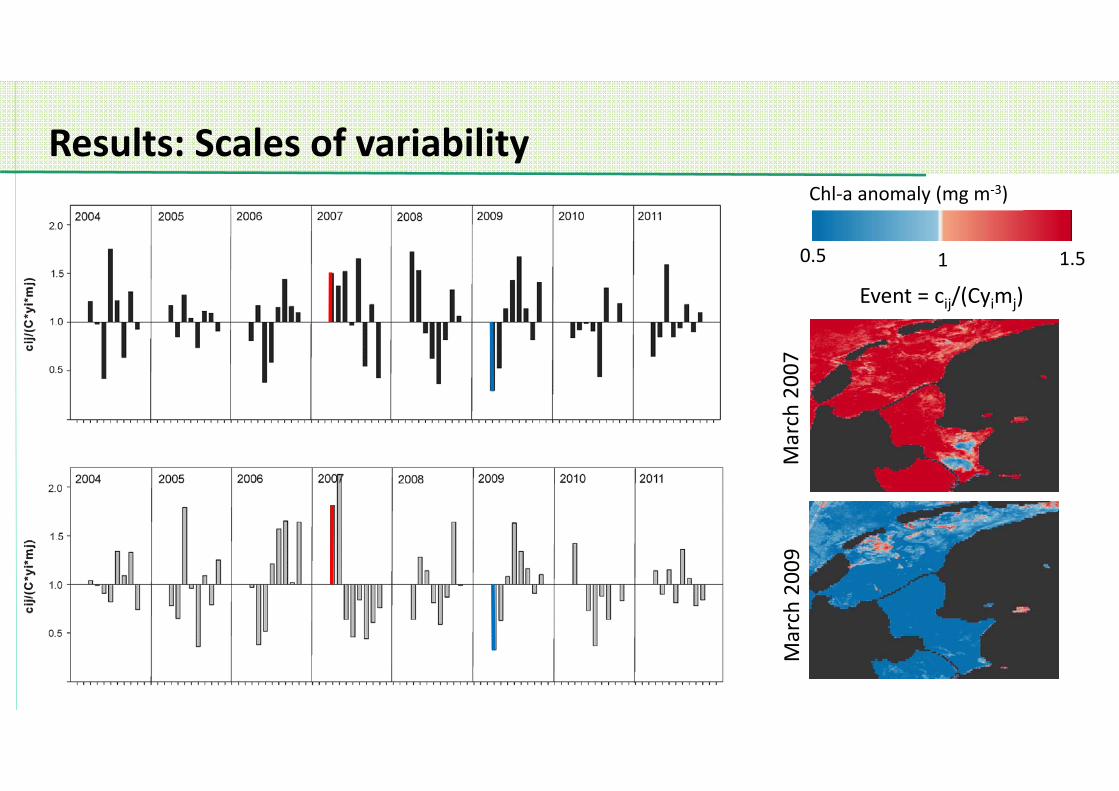
Results: Scales of variability
Event = cij/(Cyimj)
March 200
7March 200
9
Results: Scales of variability
Cloern & Jassby (2010)
Residual Event‐scale variabilityPunctual extreme eventsShifts in typical seasonality

Environmental drivers?

Summary
Maximum Peak Height algorithm, locally tuned for the western Wadden Sea and IJsselmeer, found to retrieve chl‐a within an acceptable degree of accuracy.
Chl‐a retrievals are not validated for mudflats.
IJsselmeer and western Wadden Sea ROI display high seasonal and residual variability relative to the annual variability; low variability overall relative to estuarine sites internationally.
Preliminary results indicate high correlation between residual variability and environmental drivers, temperature and precipitation.

Discussion
Mudflats are problem in RS:1‐ Low tide, adjacency effects2‐ High tide, bottom effects
Both are not well treated in the current RS Chl‐a models:
In preparation to Sentinel‐3 OLCI can we improve on Chl‐a retrievals for WS? Atmospheric corrections, which one?… Analytical radiative transfer models that include bottom effect?… or empirical FLH like?
Mudflats have a fine scale, should/can we integrate Sentinel‐1, 2 and 3 data to map mudflats and correct for their effects on water? Static map of mudflats with respect to tidal cycle, this can be regularly updated (LIDAR, SAR!)…

Thank you!
Funding from ESA Dragon‐3 Young Scientist program
MERIS data from ESA
In situ data from S. Simis, Rijkswaterstaat, KNMI