year one results from the multisite randomized … · rr on students’ iowa tests of basic skills...
TRANSCRIPT

Year One Results From theMultisite Randomized Evaluation ofthe i3 Scale-Up of Reading Recovery
Henry MayUniversity of Delaware
Abigail GrayPhilip Sirinides
Heather GoldsworthyMichael Armijo
Cecile SamJessica N. GillespieNamrata Tognatta
University of Pennsylvania
Reading Recovery (RR) is a short-term, one-to-one intervention designed tohelp the lowest achieving readers in first grade. This article presents first-year results from the multisite randomized controlled trial (RCT) and imple-mentation study under the $55 million Investing in Innovation (i3) Scale-UpProject. For the 2011–2012 school year, the estimated standardized effect ofRR on students’ Iowa Tests of Basic Skills (ITBS) Total Reading Scores was .69standard deviations relative to the population of struggling readers eligiblefor RR under the i3 scale-up and .47 standard deviations relative to thenationwide population of all first graders. School-level implementation ofRR was, in most respects, faithful to the RR Standards and Guidelines, andthe intensive training provided to new RR teachers was viewed as criticalto successful implementation.
KEYWORDS: early literacy, randomized experiment, program evaluation
Instructional initiatives that are able to identify students at greatest risk andhelp them achieve grade-level proficiency are essential to addressing the
epidemic of low literacy in the early elementary grades. Several studieshave shown that most students who leave first grade reading below gradelevel never catch up (Juel, 1988; Lyon et al., 2001; Shaywitz et al., 1999).Others suggest that literacy interventions are most effective if they areinstructionally rigorous and focused on the early years of schooling(Johnston, Allington, & Afflerback, 1985; Morrow, 1993; National Research
American Educational Research Journal
June 2015, Vol. 52, No. 3, pp. 547–581
DOI: 10.3102/0002831214565788
� 2015 AERA. http://aerj.aera.net

Council, 1998; Pikulski, 1994; Strickland, 2002). However, schools often lackthe structures or expertise to implement an intervention with the intensityrequired to overcome low literacy. Reading Recovery was designed in directresponse to such challenges. Developed in the 1970s by educator and psy-chologist Marie Clay, Reading Recovery is one of the oldest and most widelyimplemented literacy interventions in the world.
As part of the 2010 economic stimulus, Reading Recovery was awardeda $45 million ‘‘Investing in Innovation’’ (i3) grant from the U.S. Departmentof Education, along with an additional $10.1 million from private sources, tofund the scale-up of Reading Recovery across the nation. This five-year grantis intended to expand Reading Recovery in more than 1,400 schools and pro-vide targeted literacy assistance to over 88,000 students. This article presents
HENRY MAY, PhD, is director of the Center for Research in Education and Social Policy(CRESP), University of Delaware, 201 Willard Hall Education Building, Newark, DE19716, USA; e-mail: [email protected]. He specializes in the application of modern sta-tistical methods and mixed methods in randomized experiments and quasi-experi-ments studying the implementation and impacts of educational and social interven-tions and policies.
ABIGAIL GRAY, PhD, is a senior researcher at the Consortium for Policy Research inEducation (CPRE) at the University of Pennsylvania. She is a mixed-methodsresearcher whose work focuses primarily on implementation research in the contextof experimental studies, and on exploring the relationship between program imple-mentation and impacts.
PHILIP SIRINIDES, PhD, is a senior researcher at the Consortium for Policy Research inEducation (CPRE) at the University of Pennsylvania. He specializes in the applicationof quantitative research methods and the development and use of integrated data sys-tems for public-sector planning and evaluation.
HEATHER GOLDSWORTHY, PhD, is a research specialist at the Consortium for PolicyResearch in Education (CPRE) at the University of Pennsylvania. She specializes inqualitative research, particularly as a method for exploring the structures and impactsof programs and policies.
MICHAEL ARMIJO, PhD, is an assistant research scientist at the College Board and a recentdoctoral graduate from the University of Pennsylvania. His research interests includeevaluation design, implementation fidelity, and impact analysis using randomizedcontrolled trials and quasi-experimental designs.
CECILE SAM, PhD, is a research specialist at the Consortium for Policy Research inEducation (CPRE) at the University of Pennsylvania. She designs and conducts stud-ies on academic community and faculty work in a larger K-20 setting, as well as dis-trict reform evaluation.
JESSICA N. GILLESPIE, MS, is an impact analyst at the United Way of Greater Philadelphia& Southern New Jersey and was previously a research specialist at the Consortium forPolicy Research in Education (CPRE) at the University of Pennsylvania.
NAMRATA TOGNATTA, PhD, is an education consultant for the World Bank and a recentdoctoral graduate from the University of Pennsylvania. She specializes in quantitativemethods for program evaluation, with a focus on education and social policy issuesin developing countries.
May et al.
548

first-year results from the external evaluation of the Reading Recovery i3Scale-Up, providing the first evidence as to whether this massive endeavoris producing programs that reflect faithful implementation of the interven-tion and meaningful improvements in students’ reading skills.
Reading Recovery’s Theory of Action
Reading Recovery is an intensive intervention targeting the lowestachieving 15% to 20% of first-grade readers. It takes as its underlying princi-ple the idea that individualized, short-term, highly responsive instructiondelivered by an expert can disrupt the trajectory of low literacy achievement,produce accelerated gains, and enable students to catch up to their peersand sustain achievement at grade level into the future. Reading Recovery les-sons attend to phonemic awareness, phonics, vocabulary, fluency, and com-prehension—the critical elements of literacy and reading instruction identi-fied by the National Reading Panel (2000). At its core, Reading Recovery isintended to help students develop a set of self-regulated strategies forproblem-solving words, self-monitoring, and self-correcting that they canapply to the interpretation of text. These strategies focus on enabling stu-dents to use meaning, structure, letter-sound relationships, and visual cuesin their reading and writing (Clay, 1991, 2005).
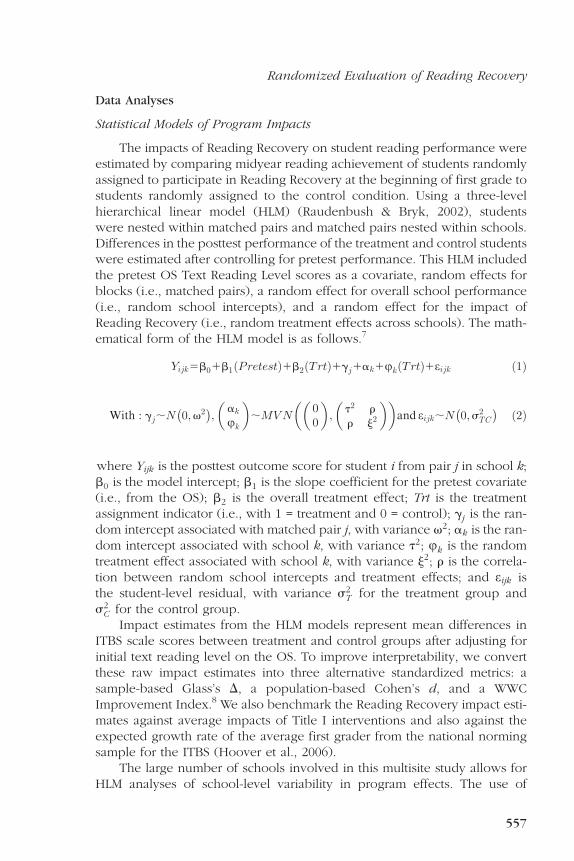
According to the program model of Reading Recovery (RR), highlytrained teachers provide daily instruction to students during 30-minute,one-to-one teaching sessions. Teachers tailor their lessons to a student’s indi-vidual strengths and needs based on their own observations. According toClay (2005), RR teachers ‘‘must be able to design a superbly sequenced seriesof lessons determined by the particular children’s competencies, and makehighly skilled decisions [at each] moment during the lesson’’ (p. 23). A pri-mary assumption of the Reading Recovery model is that high-quality instruc-tion is key to accelerated progress in literacy learning. Ensuring instructionalquality is therefore considered essential to the success of the intervention,and the RR model’s multilevel structure, visualized in Figure 1, emphasizesinstructional quality at each level. At the top level of the RR model, facultyat University Training Centers (UTC) train RR teacher leaders through anin-residence, postgraduate program of study. Through this training, as wellas through mentorship experiences with faculty and experienced teacherleaders, new RR teacher leaders are expected to become expert literacycoaches with a deep understanding of how children learn and become liter-ate and why some children have great difficulty learning to read and write.Teacher leaders also become expert teachers of both children and adultlearners; through ongoing work with students and mentoring by universitytrainers, RR teacher leaders are taught how to design and deliver literacy les-sons to individual students with a focus on those students who are makingparticularly slow progress and also how to deliver training and support to RR
Randomized Evaluation of Reading Recovery
549

teachers. Developing these core understandings about learning and instruc-tion prepares RR teacher leaders for their role in the Reading Recovery mod-el’s second level of instruction. At this level, RR teacher leaders providea year-long academic program of training and support to the school-basedRR teachers who are simultaneously working directly with students. First,all new RR teachers in training complete a week-long summer introductionfocused on the administration, scoring, and interpretation of the ObservationSurvey of Early Literacy Achievement (OS). Second, they complete a year-long academic course taught by a teacher leader, for which they receivea grade and 8 to 10 university credits. This coursework uses as its primarytext Marie Clay’s (2005) Literacy Lessons Designed for Individuals, Parts Iand II and incorporates regular opportunities to observe instruction through‘‘behind-the-glass’’ lessons in which they observe each other’s one-to-onelessons through a one-way mirror. As they complete this course, RR teachersin training provide daily one-to-one lessons to four RR students each; theyalso attend weekly three-hour training sessions conducted by their teacherleader. Finally, both trained RR teachers and those in training receiveschool-based visits from their teacher leader, who observes them inReading Recovery lessons and provides immediate feedback and sugges-tions. This intensive training and support emphasizes the skills that are crit-ical for individualized, highly responsive instruction, including theory of lit-eracy acquisition, assessment, systematic observation, instruction, analysis,and reflection. As they continue past their first year, RR teachers receiveongoing professional development and supervision from their RR teacherleader to ensure continual learning and growth. At the final level of instruc-tion in the RR model, trained RR teachers design and deliver individualizedlessons to students identified to receive RR services. These lessons are struc-tured yet unscripted, relying heavily on the teacher’s ability, developedthrough intensive training, to recognize and implement the most effectiveinstructional strategies in immediate response to a student’s reading perfor-mance during each lesson. Each lesson begins with re-reading familiarbooks and a running record, then word or letter work on the wallboard,story composition, assembling a cut-up sentence, and finally previewingand reading a new book. These activities are essential elements in theinstructional experience of RR students and are expected to occur in everyone-to-one RR lesson.
Within the Response to Intervention (RtI) framework, some have labeledReading Recovery as a ‘‘problem-solving’’ (PS) approach because it reliesheavily on teachers’ expertise and ability to enact instruction that is respon-sive to continuous formative data about a student’s performance (e.g.,Johnston, 2011). While this reliance on instructional expertise is certainlytrue, the RR intervention is actually structured and delivered in a very con-sistent manner from one student to the next. This aspect of RR makes ita much more stable and replicable intervention across students and
May et al.
550

contexts—a feature that many would not associate with PS models. Likewise,many feel that the primary alternative approach to RtI, the standard treat-ment protocol (STP), involves scripted instruction (Johnston, 2011).However, in Fuchs and Fuchs’s (2006) description of STP, they imply thatthere should be considerable flexibility in the intervention as appropriateto each student’s needs. In the example cited by Fuchs and Fuchs (2006,p. 95) as an exemplar of the STP approach (i.e., Vellutino et al., 1996),Vellutino and colleagues describe an intervention that is ‘‘tailored to thechild’s individual needs’’ and whose structure is remarkably similar to thatof a Reading Recovery lesson (Vellutino et al., 1996, p. 610). In fact,Vellutino (2010) describes Reading Recovery as ‘‘clearly the prototype forRtI approaches to identifying children at risk for long-term reading difficul-ties’’ (p. 22). As such, we see Reading Recovery as having features that alignvery well with Fuchs and Fuchs’s original definition of the STP approach toRtI, but with a heavy reliance on the adaptive instruction and teacher
UniversityTraining Center (UTC)
TeacherLeader
TeacherLeader
TeacherLeader
TeacherLeader
TeacherLeader
RR Teachers RR Teachers RR Teachers RR Teachers RR Teachers
UTCs provide teacher leaders with in-residence, post-graduate study/trainingin early literacy, instruc�onal coaching, mentoring, and adult learning.
Teacher leaders provide 8-12 RR teachers with year-long training through graduatecoursework on early literacy, individualized instruc�on, assess ment, systema�c observa�on,
analysis, responsive instruc�on, reflec�on, and planning.
RR teachers provide 4 students at a �me with 12-20 weeks of one-to-one literacy instruc�onfocused on phonemic awareness, phonics, vocabulary, fluency, comprehension, wri�ng,
and development of self-regulated reading strategies.
RRStudents
RRStudents
RRStudents
RRStudentsRR
StudentsRR
StudentsRR
StudentsRR
Students
RRStudents
RRStudents
RRRRRRStudents ssRR
StudentsRR
StudentsRR
StudentsRR
StudentsRR
Students
RRStudents
RRStudents
RRStudents
RRStudentsRR
StudentsRR
StudentsRR
StudentsRR
Students
RRStudents
RRStudents
RRRRStudents sRR
StudentsRR
StudentsRR
StudentsRR
StudentssRR
Students
RRStudents
RRStudents
RRStudents
RRStudentsRR
StudentsRR
StudentsRR
StudentsRR
Students
Figure 1. Theory of action for Reading Recovery (RR) training and intervention.
Randomized Evaluation of Reading Recovery
551

expertise usually associated with PS, and without the scripted instructionthat has come to be associated with STP.
Supporting the consistency of implementation of Reading Recoveryacross sites, lessons, and students, the Standards and Guidelines ofReading Recovery in the United States (Reading Recovery Council of NorthAmerica [RRCNA], 2009) codify Clay’s (2005) perspectives on RR and makeexplicit the practices that constitute faithful implementation. Thus, theStandards and Guidelines (RRCNA, 2009) formalize the processes by whichindividual actors and systems achieve the dimensions of change advocatedby Clay and guide the implementation of Reading Recovery across geo-graphically dispersed sites and diverse contexts.
Prior Research on Reading Recovery
Reading Recovery has been the focus of considerable study over thecourse of its nearly 30-year history. Research has focused on various issues,ranging from the merits and limitations of the intervention’s instructionalapproach (Chapman, Tumner, & Prochnow, 1999; Iversen & Tunmer,1993; Moats, 2007; Pinnell, DeFord, & Lyons, 1994; Tunmer & Chapman,2002) to its cost-effectiveness (Dyer & Binkney, 1995; Gomez-Bellenge,2002; Hiebert, 1994; Rasinksi, 1995). Most relevant to the current study isthe subset of the Reading Recovery research that examines the intervention’sefficacy in terms of its goal of producing accelerated and long-lasting gainsin students’ literacy achievement. The vast majority of these studies haveused quasi-experimental designs that are subject to issues of selection bias(Allington, 2005; Ashdown & Simic, 2000; Briggs & Young, 2003; Brown,Denton, Kelly, & Neal, 1999; Center, Wheldall, Freeman, Outhred, &McNaught, 1995; Elbaum, Vaughn, & Moody, 2000; Hiebert, 1994; Pinnell,1989; Quay, Steele, Johnson, & Hortman, 2001; Rodgers, Gomez-Bellenge,Wang, & Schultz, 2005; Rodgers, Wang, & Gomez-Bellenge, 2004; Rowe,1995; Ruhe & Moore, 2005; Schmitt & Gregory, 2005; Shanahan & Barr,1995; Torgesen, 2000; Tunmer & Chapman, 2002; Wasik & Slavin, 1993).As such, interpretation of results from these studies is inconclusive giventhe variation in findings and the inherent weaknesses of the methodologiesused. In their meta-analysis of Reading Recovery research, D’Agostino andMurphy (2004) posit that Reading Recovery
has proven a very difficult program to evaluate, given its studentselection and attrition policies, the barriers to locating an equivalentcomparison group, the reliance on outcome measures designed forthe program, and the problems inherent with accurately measuringstudents’ achievement levels in first grade. (p. 24)
The What Works Clearinghouse (WWC) report on Reading Recovery(WWC, 2008) excluded the aforementioned quasi-experimental studies
May et al.
552

from its review, focusing instead on just a few studies that were determinedto meet the WWC evidence standards.1 Four of these studies were random-ized controlled trials (i.e., Baenen, Bernhole, Dulaney, & Banks, 1997;Pinnell et al., 1988; Pinnell, Lyons, DeFord, Bryk, & Seltzer, 1994;Schwartz, 2005). In each case, a treatment group of first-grade studentswho received Reading Recovery services was compared with a controlgroup of first graders who did not participate in the intervention.Treatment and control were randomly assigned. A fifth study reviewed(i.e., Iversen & Tunmer, 1993) was quasi-experimental; the treatment andcontrol groups were not assigned randomly. This study was deemed tomeet the WWC standards ‘‘with reservations’’ given that baseline equiva-lence was documented despite the lack of random assignment.
The studies differed from one another in terms of assessment strategyand sample size and dispersion as well as the scope of the research. Onthe basis of the empirical impact analyses included in the five studies thatmet WWC evidence standards, the 2008 WWC report on Reading Recoveryfound positive effects in two of the key literacy indicators assessed: alpha-betics and general reading achievement. The WWC average ImprovementIndices2 were 134 percentile points in alphabetics and 146 percentilepoints in fluency, which correspond to effect sizes of 11.0 and 11.7 stan-dard deviations. In the other two areas, comprehension and overall readingachievement, the WWC identified ‘‘potentially positive effects,’’ with averageImprovement Indices 114 percentile points in comprehension and 132 per-centile points in overall reading achievement, which correspond to effectsizes of 1.35 and 1.90 standard deviations. Furthermore, the sample sizesin the studies that met WWC standards were relatively small (i.e., \100),leading to the conclusion of ‘‘potentially positive effects, with a small extentof evidence.’’
While on the whole very positive, the What Works Clearinghousereport’s findings—coupled with the shortage of studies that met WWC evi-dence standards and no large-sample studies to date—strongly suggest theneed for a large-scale and highly rigorous examination of the impacts ofReading Recovery and variation in impacts across a large sample of schools.
Methods
The overarching goals of this evaluation are to document the implemen-tation of Reading Recovery under the i3 scale-up and produce rigorous esti-mates of the causal impacts of the intervention on student literacy achieve-ment. A multisite randomized controlled trial (RCT) was used to estimateprogram impacts, while a mixed-methods study of program implementationwas conducted using surveys, activity logs, interviews, focus groups, obser-vations, and document analysis. The primary research questions for the eval-uation are:
Randomized Evaluation of Reading Recovery
553

Research Question 1: For first-grade students who begin the school year strugglingto read, what are the impacts of Reading Recovery on reading achievement atthe end of the 12- to 20-week intervention?
Research Question 2: Is training of RR teachers being implemented as intended,and what is the perceived quality of the training?
Research Question 3: Is the Reading Recovery intervention being implemented asintended, and what factors may support or hinder fidelity of implementation?
Sample Selection and Random Assignment
School and Student RCT Sample
Prior to the start of the 2011–2012 school year, 209 schools participatingin the i3 scale-up (out of a total of 627 participating schools) were randomlyselected for inclusion in a randomized controlled trial. Of these, 25 schoolsdropped out of the i3 study before random assignment was conducted. Theremaining 184 schools selected for the RCT were instructed to implement thefollowing protocol.
At each participating school, a subsample of eight low-performing studentseligible for Reading Recovery was identified using the Reading RecoveryObservation Survey of Early Literacy Achievement. The names of these eight eli-gible students, along with their English language learner (ELL) status and pretestText Reading Level scores from the OS, were entered into an online randomassignment tool. The tool then rank-ordered the students by their ELL statusand Text Reading Level, and students were matched into pairs according to pre-test scores and ELL status. One student in each pair was randomly assigned tothe treatment group (i.e., classroom instruction plus RR one-to-one lessons),and the other student in the pair was assigned to the control group (i.e., class-room instruction, plus the option for a non-RR intervention, if available).3,4
Reading Recovery teachers were directed to begin RR Lessons with the treat-ment students right away and to begin RR Lessons with each control studentonly after their treatment counterpart had exited the intervention and only ifthe control student remained in need of RR at that time.5
Qualitative Sample
Our study of the implementation of Reading Recovery during the 2011–2012 school year involved extensive interviews with core RR stakeholderswhose professional responsibilities involved the recruitment of i3 participants,the training of i3 teacher leaders and RR teachers, implementation of RR lessons,and the oversight and support of RR implementation activities. Participants inthe qualitative study components were recruited as follows: Eighteen out of19 UTC directors participated in individual interviews conducted in person orby phone. A total of 49 teacher leaders attending the annual Teacher LeaderInstitute agreed to participate in one of five focus groups. Fifty Reading
May et al.
554

Recovery teachers were randomly sampled from the population of i3 RR teach-ers, and 37 of these agreed to participate in individual phone interviews. Anadditional 9 RR teachers were interviewed in person during school site visits,6
and observations of at least two RR lessons were also done with each of these9 RR teachers. Individual interviews were conducted with 17 school principals,including 9 from the site visit schools and 8 more from a similarly stratified ran-dom sample of schools (see note 6). Recruitment of participants involved a pro-cess of personal email invitations and follow-up phone calls. No monetary com-pensation was provided to participants.
Measures and Data Collection
Student Outcomes
Upon the conclusion of the intervention for each treatment group stu-dent, both students in that matched pair were assessed at approximatelythe same time using the reading section of the Iowa Tests of Basic Skills(ITBS). To address possible test administrator bias, the posttest assessmentswith each student were conducted by someone other than the teacher whoprovided RR lessons to that student (i.e., typically another RR teacher ora teacher leader). Furthermore, the ITBS reading tests are administered ina standardized format that inhibits the potential for test administrators toinfluence results.
Teachers were instructed to administer the ITBS test to any treatmentgroup student who exited Reading Recovery as soon as possible after hisor her exit. Students who did not complete the minimum 12-week interven-tion because they were referred for additional services, dropped due to non-attendance, or exited for any other reason were still expected to take theITBS. Unfortunately, many of these students could not be tested becausethey had moved away from the school. Of the 13,328 RR students in i3schools during the 2011–2012 school year for whom final intervention statuswas recorded in the Reading Recovery International Data Evaluation Center(IDEC), 52.4% of students in Reading Recovery successfully discontinuedbefore the 20th week with no referral for additional intervention. Of theremaining students, 22.4% were referred for additional intervention beforeor after the 20th week, 4.7% changed schools, and 19.7% received lessthan 12 weeks of lessons (i.e., typically due to student absenteeism, theend of the school year, or the RR teacher leaving the school midyear).
IDEC provided existing infrastructure to support large-scale data collec-tion at low cost under this evaluation. Since 1998, IDEC has provided datacollection, management, and analysis support to Reading Recovery pro-grams throughout the nation. IDEC has developed a two-step data entryand review process. First, RR teachers are required to enter data regardingtheir personal characteristics, along with student and school information;teacher leaders are then required to review this data as an additional quality
Randomized Evaluation of Reading Recovery
555

assurance measure. IDEC data are used by UTC directors, teacher leaders, RRteachers, and school administrators for their annual reporting. As part of thescale-up evaluation, we coordinated with IDEC to allow RR teachers to enterpretest OS data and posttest ITBS and OS data for students in the RCT eachyear. The data files extracted from IDEC included test scores along with stu-dent, teacher, and building characteristics. These data were used to: (a) gen-erate sampling frames for the RCT, survey, and qualitative data collectioncomponents of the evaluation; (b) report aggregate statistics regardingReading Recovery’s implementation; and (c) compare outcomes for treat-ment and control students participating in the RCT.
Implementation Surveys
In spring of 2012, we conducted surveys of key RR staff in order togauge fidelity of implementation. Fidelity data were collected via online sur-veys, and questions were worded to minimize bias in responses toward the‘‘right’’ answer. The response rates and sample sizes for site coordinators,teacher leaders, and RR teachers were 64% (n = 105), 89% (n = 169), and78% (n = 799), respectively. These three separate surveys were designedto collect data on implementation efforts in relation to the Standards andGuidelines of Reading Recovery in the United States (RRCNA, 2009), whichprovides detailed specifications for implementation of Reading Recovery.In addition, i3-supported RR teachers were asked to complete daily activitylogs on four randomly selected days from January through April 2012.Seventy-one percent of RR teachers (n = 882) completed at least one log,with the majority completing three or four logs. In total, RR teachers com-pleted 2,623 logs documenting their daily activities from January throughApril 2012. The survey and log data allowed for quantification of implemen-tation fidelity across sites and by subdomain based on the RR Standards andGuidelines (RRCNA, 2009). All surveys and logs were designed and con-structed by the research team and administered online using the Qualtricssurvey suite.
Interview Protocols
Semi-structured protocols were developed for each set of interview andfocus group participants. The interviews explored issues of implementationof the Reading Recovery intervention and how information sharing pro-cesses were used to inform and refine practices designed to document, facil-itate, and support the attainment of scale-up benchmarks. Specific questionsduring the interviews addressed implementation issues directly related to theRR Standards and Guidelines (RRCNA, 2009), including recruitment ofschools and RR teachers; format, frequency, and quality of training classes;conduct of one-to-one RR lessons; and supports and barriers to programimplementation.
May et al.
556
Data Analyses
Statistical Models of Program Impacts
The impacts of Reading Recovery on student reading performance wereestimated by comparing midyear reading achievement of students randomlyassigned to participate in Reading Recovery at the beginning of first grade tostudents randomly assigned to the control condition. Using a three-levelhierarchical linear model (HLM) (Raudenbush & Bryk, 2002), studentswere nested within matched pairs and matched pairs nested within schools.Differences in the posttest performance of the treatment and control studentswere estimated after controlling for pretest performance. This HLM includedthe pretest OS Text Reading Level scores as a covariate, random effects forblocks (i.e., matched pairs), a random effect for overall school performance(i.e., random school intercepts), and a random effect for the impact ofReading Recovery (i.e., random treatment effects across schools). The math-ematical form of the HLM model is as follows.7
Yijk5b01b1 Pretestð Þ1b2 Trtð Þ1gj1ak1jk Trtð Þ1eijk ð1Þ
With : gj;N 0;v2� �
;akjk
� �;MVN
00
� �;
t2 r
r j2
� �� �and eijk;N 0;s2
TC
� �ð2Þ
where Yijk is the posttest outcome score for student i from pair j in school k;b0 is the model intercept; b1 is the slope coefficient for the pretest covariate(i.e., from the OS); b2 is the overall treatment effect; Trt is the treatmentassignment indicator (i.e., with 1 = treatment and 0 = control); gj is the ran-dom intercept associated with matched pair j, with variance v2; ak is the ran-dom intercept associated with school k, with variance t2; jk is the randomtreatment effect associated with school k, with variance j2; r is the correla-tion between random school intercepts and treatment effects; and eijk isthe student-level residual, with variance s2
T for the treatment group ands2
C for the control group.Impact estimates from the HLM models represent mean differences in
ITBS scale scores between treatment and control groups after adjusting forinitial text reading level on the OS. To improve interpretability, we convertthese raw impact estimates into three alternative standardized metrics: asample-based Glass’s D, a population-based Cohen’s d, and a WWCImprovement Index.8 We also benchmark the Reading Recovery impact esti-mates against average impacts of Title I interventions and also against theexpected growth rate of the average first grader from the national normingsample for the ITBS (Hoover et al., 2006).
The large number of schools involved in this multisite study allows forHLM analyses of school-level variability in program effects. The use of
Randomized Evaluation of Reading Recovery
557

random treatment effects for schools in a multilevel modeling frameworkallows estimation of variability in treatment effects across schools and sup-ports estimation of cross-level interactions to explain variability in treatmenteffects. Analyses in this article include estimates of the standard deviation ofprogram effects across the sample of schools, which are based on the ran-dom effects variance estimates from the HLM analyses. We do not includevisualizations of site-specific effects (e.g., histograms) or any analyses involv-ing cross-level interactions in this article given the relatively low precision ofschool-specific estimates and limited sample size; pooling data from this andfuture years will support more reliable estimation of school-level predictorsof impact variation.9
Analyses of Implementation Survey and Interview Data
At least one survey item from one or more respondent groups was usedto evaluate each standard for program implementation, and response datawere used to calculate indices of implementation fidelity, represented as per-centage of standards met. Recordings from all interviews and focus groupswere externally transcribed, and all identifying information was removed.An initial coding scheme was created that aligned with the evaluationresearch questions, the RR Standards and Guidelines (RRCNA, 2009), andRR’s underlying theory of action (see Figure 1). A priori codes were usedto focus on the broad dimensions of RR implementation, such as recruit-ment, training, and lesson instruction; subcodes were also used to explorespecific aspects of these dimensions. A subset of interviews was first codedindividually by multiple trained members of the research team, and theresults were compared to establish interrater reliability. When team membersdisagreed on how a code should be applied, the code definition was reeval-uated and sometimes revised. After the code sets were established, teammembers individually coded transcripts using Dedoose, a cloud-based appli-cation for analyzing qualitative and mixed-methods data that uses strongencryption to ensure data security. Each researcher developed initial analyticmemos during the coding process and shared the memos with team mem-bers in weekly meetings (Corbin & Strauss, 2008; Emerson, Fretz, & Shaw,1995; Lofland, Snow, Anderson, & Lofland, 2006). This process generatedinductive themes from each set of participant interviews. A second roundof analysis examined themes across groups to triangulate perspectives acrossrespondents and data sources (e.g., comparisons to survey results), findcommon threads, and gain a broader perspective of implementation underthe i3 scale-up. Quotes for inclusion in the results were selected as themost clear, concise, and illustrative statements relevant to a given theme,with explicit attention paid to selection of quotes that reflected the variationand/or consistency of perspectives across the full set of respondents.
May et al.
558

Results
This section is organized as follows. We first report results from the RCTexperiment, including study participation rates and final impact estimates.We then present findings from our implementation study in two sectionsthat integrate data and results from the surveys and interviews. The first sec-tion focuses on the implementation and perceived quality of training RRteachers experienced through formal courses run by teacher leaders, whilethe second section focuses on the implementation of the intervention asspecified in the Standards and Guidelines (RRCNA, 2009).
RCT Participation Rates
Of the 184 schools selected to participate in the RCT during the 2011–2012 school year, 158 schools (86%) actually carried out the random assign-ment process. The 26 schools that participated in the i3 study but did notcarry out random assignment were excluded from the RCT. Although severalmodes of direct and indirect communication were used to inform schools oftheir expected participation in the RCT, these 26 schools did not randomize.The communications included direct emails from IDEC to individual teacherleaders and RR teachers, distribution of documents describing the evaluationdesign to UTCs and teacher leaders, and inclusion of a video on the IDECwebsite describing the evaluation design and procedures. The reasonswhy these 26 schools failed to randomize included staffing changes, dataerrors (e.g., duplication of schools in the list of participating schools), andmiscommunication (e.g., undelivered emails). There was only one case inwhich the principal of the school explicitly refused to allow random assign-ment. We found no significant differences between these 26 schools and theother 158 schools in terms of urbanicity or demographics.
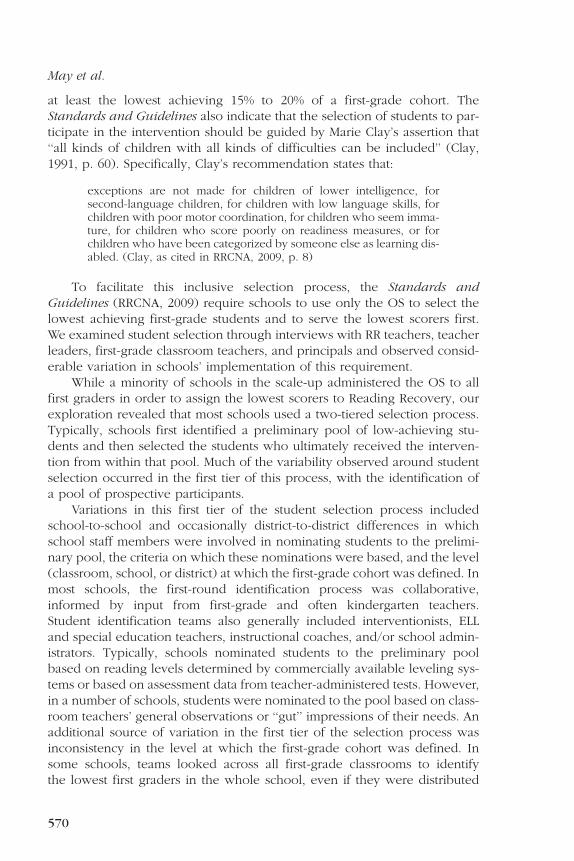
Figure 2 is a flow diagram that illustrates how the final analytic samplefor the RCT was achieved. Within the 158 schools that participated in theRCT, a total of 1,253 students were randomly assigned to treatment (N =628) and control (N = 625) conditions. Of these students, a total of 1,241(622 treatment, 619 control) were successfully matched to data recorded inIDEC. Of these students, a total of 1,002 had ITBS scores recorded inIDEC (530 treatment, 472 control). After linking treatment students to theirmatched controls, a total of 433 matched pairs in 147 schools included a treat-ment and a control student with ITBS data. This sample of 866 students (433matched pairs) represented 69% of the students from matched pairs inschools that carried out the random assignment. The missing data at the stu-dent level resulted primarily from student mobility or other factors that led tothe inability or failure to administer the ITBS tests to both treatment and con-trol students in a pair. Matched pairs without complete data are not includedin the impact analyses presented here. The multisite, matched-pairs designof this random assignment study means that each school and each pair is
Randomized Evaluation of Reading Recovery
559

an independent mini-experiment and that the ability to calculate valid causalimpacts is less likely to be affected by school nonparticipation or missingdata. Although the sample size is reduced and may be less representativeof the full population, there is no possibility of differential attrition giventhat equal numbers of treatment and control students are excluded fromanalyses (see WWC standards for attrition in RCTs; WWC, 2012, p. 11). Ofcourse, the ability to generalize results to the entire population of i3 schoolsand students is a critical goal for this impact study given that the key focus isthe overall impacts of the intervention on the eligible population of studentswhen implemented at scale. As such, we performed statistical tests of differ-ences in student demographics for students included in the impact analysesand those dropped due to incomplete data. Analyses of differences in stu-dent characteristics for those students included and excluded from the ana-lytic sample suggest no significant differences in pretest OS Text Reading
Random Sample of i3 Schools( n = 209 )
Assigned to RCTStudy:
Dropped OutPrior to RCT
( n = 25 )
Included in RCT Study158 Schools
1,253 Students
Failed toRandomize
( n = 26 )Enrollment
Assigned to Treatment:628 Students
Assigned to Control:628 Students
Located in IDEC:622 Students
Located in IDEC:619 Students
ITBS Scores Recorded:530 Students
ITBS Scores Recorded:472 Students
Linked to Matched Pair:433 Students
Excluded from Analysis: None
Linked to Matched Pair:433 Students
Excluded from Analysis: None
Alloca�on
Follow-Up
Analysis
Figure 2. Consort flow diagram through the Reading Recovery Investing in
Innovation (i3) randomized controlled trial, 2011–2012.
May et al.
560

Levels, F(5, 1235) = 1.73, p = .13; gender, F(5, 1216) = 0.01, p = .91; race, F(3,1183) = 0.52, p = .67; or ELL status, F(1, 1207) = 0.42, p = .52.10
Impacts on Student Reading Achievement
Baseline balance tests were performed in order to examine whether thetreatment and control groups were equivalent on observed characteristicsafter random assignment. Table 1 presents results for baseline balance testsfor student demographics and prior reading performance of the final analyticsample of 866 students in 147 schools.
No significant differences were found between treatment and controlgroups on gender, ELL status, race, or prior reading performance. The per-centages in each column match up well between the treatment and controlgroups, suggesting that random assignment produced treatment and controlgroups that were well balanced immediately prior to implementation of RRfor the group of treatment students. This also confirms that the treatment andcontrol groups had initial reading performance that was nearly identicalimmediately prior to implementation of RR.
Table 2 shows simple descriptive statistics for the treatment and controlgroups on raw scores and scale scores from the reading sections of the ITBS.
Table 1
Baseline Balance Tests for Student Demographics
Pretreatment
Variable
Treatment
Group (%)
Control
Group (%)
p Value for
Difference
Gender (n = 862)
Male 61 61 .96
Female 39 39
ELL status (n = 860)
ELL 17 18 .47
Non-ELL 83 81
Race (n = 856)
Black 18 19 .93
Hispanic 22 20
White 57 56
Other 3 5
Text reading level
0 51 52 .87
1 21 19
2 17 20
31 11 10
Note. p values based on x2 test of independence. ELL = English language learner.Source. Reading Recovery International Data Evaluation Center (IDEC) student demo-graphic and test score data.
Randomized Evaluation of Reading Recovery
561

For both sets of scores, the means are over one-half of a standard deviationlarger in the treatment group. Differences in percentile ranks are 116 forReading Words, 120 for Reading Comprehension, and 118 overall.
Results from the main HLM analysis are presented in Table 3. Analyses ofimpacts on ITBS Total Reading scores showed a significant positive effect ofReading Recovery overall. The point estimate for the difference betweentreatment and control students’ expected Total Reading scores on the ITBSwas 4.24 points (p\ .001). Dividing that point estimate by the standard devi-ation of the control group yields a Glass’s D effect size of 0.69 standard devi-ations. This effect estimate reflects the impact of RR relative to the popula-tion of struggling readers eligible for RR in participating schools.Alternatively, dividing the point estimate by the standard deviation fromthe ITBS 2005 national norming sample of first graders (i.e., s = 9.1) yieldsa Cohen’s d effect size of 0.47 standard deviations. This effect estimatereflects the impact of RR relative to the full population of all first gradersacross the nation. The WWC Improvement Index (see note 2) from this anal-ysis is 125 percentiles, which is slightly smaller than the 132 included in theWWC report for Reading Recovery.
Table 2
Descriptive Statistics for Iowa Tests of Basic Skills (ITBS) Scores for Treatment
and Control Groups
Midyear Outcomes
Treatment Group
(n = 433)
Control Group
(n = 433)
t Statistic
and p Value
ITBS Reading Words raw scores
Mean 21.1 18.2 7.89
Standard deviation 5.1 5.2 \.001
ITBS Comprehension raw scores
Mean 9.9 7.8 8.11
Standard deviation 3.9 3.2 \.001
ITBS Reading Words Scale scores
Mean 141.2 136.7 7.73
Standard deviation 9.0 7.6 \.001
Mean percentile ranka 43 27
ITBS Comprehension Scale scores
Mean 140.0 135.5 7.88
Standard deviation 8.9 7.4 \.001
Mean percentile ranka 39 19
ITBS Total Scale scores
Mean 139.2 135.0 8.69
Standard deviation 7.6 6.2 \.001
Mean percentile ranka 36 18
aPercentile ranks based on ITBS Grade 1 midyear norms (Hoover et al., 2006).
May et al.
562

Exploratory analyses of impacts on the ITBS Reading Words and ReadingComprehension subscales showed similar results. The point estimate for the dif-ference between treatment and control students’ expected Reading Wordsscores on the ITBS was 4.52 points (p \ .001) with a corresponding Glass’sD of 0.61 and a Cohen’s d of 0.45 standard deviations. The point estimate forthe difference between treatment and control students’ expected ReadingComprehension scores on the ITBS was 4.56 points (p \ .001) with a corre-sponding Glass’s D of 0.60 and a Cohen’s d of 0.44 standard deviations.
The significant variance components for random effects in the HLM modelsof impacts on ITBS scores suggests that the magnitude of the impact estimatesof RR varies substantially across schools. The results for the overall impactmodel show an average effect of 14.24 points, with a random effect varianceestimate for the school-level impacts of 9.64 points. Taking the square root ofthis variance estimate yields a standard deviation of 3.1 points. Unfortunately,this information cannot be used to make inferences about the relative preva-lence of small/large or positive/negative effects without imposing assumptionsabout normality on the true site-specific impacts (May, 2014). This is an area ofongoing methodological development, and our hope is to use data from thisstudy to attempt to separate the distribution of true impacts from the normallydistributed sampling error that dominates each individual site-specific estimate.
Implementation and Perceived Quality of Training
The next two sections of results describe early results from our study ofimplementation of Reading Recovery under i3. Although sample sizes from
Table 3
Hierarchical Linear Modeling Analysis of Overall Treatment Effects of Reading
Recovery on Iowa Tests of Basic Skills (ITBS) Composite Reading Scores
Dependent Variable: Midyear ITBS
Total Reading Scores Estimate Standard Error p Value
Fixed effects
Intercept (b0) 135.13 0.34 \.001
Pretest (b1) 1.80 0.21 \.001
Treatment effect (b2) 4.24 0.46 \.001
Random effects
Matched pair variance (v2) 3.85 1.99 .026
School intercept variance (t2) 6.04 2.13 .002
School treatment impact variance (j2) 9.33 3.99 .010
School intercept/impact correlation (r) –0.04 0.29 .898
Treatment student-level residual variance (s2T ) 31.55 3.43 \.001
Control student-level residual variance (s2C ) 24.15 2.88 \.001
Randomized Evaluation of Reading Recovery
563

the first year of this study are still too small to explain variation in impactsacross sites, the general findings provide a good picture of whetherReading Recovery under this large and rapid scale-up has been faithful tothe intended program design.
Behind-the-Glass Sessions
Perhaps the most crucial component for successful implementation ofReading Recovery is the intensity and quality of training provided to new RRteachers by their teacher leaders, including the behind-the-glass sessions thatserve as the foundation for building teachers’ instructional skills. Surveyresponses from RR teachers indicated that 87% of RR teachers in training metthe minimum requirement of at least three lessons taught behind the glass.However, there was considerable variability in the number of behind-the-glasssessions observed by RR teachers in training: Only 25% observed more than the30 behind-the-glass sessions required in the Standards and Guidelines (RRCNA,2009), and 35% reported observing 20 or fewer behind-the-glass sessions. Thissuggests that while nearly all teachers taught behind the glass often enough tomeet RR requirements, a majority of the RR teachers training in 2011–2012 fellshort of the required 30 to 36 observations of other teachers’ behind-the-glasssessions. Despite these results, behind-the-glass sessions were perceived asa particularly valuable means of training for work with students for both theRR teacher behind the glass and those teachers observing. Teachers who gobehind the glass receive immediate feedback and suggestions on an actual les-son with a student and are able to make adjustments to their lessons the verynext day. One RR teacher explained how the behind-the-glass sessions are dif-ferent from more typical teacher observations:
When you’re observed, it’s not a contrived, really perfect lesson, butit’s actually what you do every day, and you’re getting really honestfeedback on the things that others see that are working well for thestudent you were working with. And there are things you maywant to try to continue to accelerate their progress. . . . But they’rereally positive experiences. And I think those conversations that wehad as colleagues just were very in-depth in regards to what the stu-dents have as far as skills and what they need to accomplish. So Iappreciated it very much.
For those teachers who are observing, the behind-the-glass sessionoffers an opportunity to provide constructive feedback to the teacher theyobserve while learning new skills or strategies they can use themselves.One RR teacher described how observing a behind-the-glass session helpedgive her new ideas:
Sometimes you do your Reading Recovery lesson, you always assumeyou have to be perfect. So, when you watch someone doing
May et al.
564

[something different], you think ‘‘Oh, I will try this. Oh, what they’retrying is great! I should try it in my next lesson.’’
Teacher Leader Caseload
Survey responses by teacher leaders indicated considerable variability inthe number of RR teachers they supported and monitored during the 2011–2012 school year. The RR Standards and Guidelines (RRCNA, 2009) note thatoperating sites should ‘‘limit the number of teachers supported and moni-tored by the teacher leader to 42, or considerably fewer, depending on factorssuch as distance, the number of teachers per school, and the number of dis-tricts’’ (Standard 2.24). Survey data indicated that 46% of teacher leaders sup-ported 1 to 20 RR teachers, and 28% supported 21 to 42 RR teachers. Nine per-cent of teacher leaders exceeded the recommended caseload. It is importantto note that these survey responses include the total number of RR teachers—-those currently in training as well as those previously trained—being sup-ported by a teacher leader.
Quality of Training and Support
The majority of RR teachers described their teacher leader as an instruc-tional coach who helped develop their individual skills by modeling lessonsand providing immediate feedback following observations—two types ofsupport that allowed teachers to make concrete improvements to theirteaching. Another RR teacher commented:
She’s a lot like a coach, where she kind of coaches us along.Sometimes the Reading Recovery itself is all about having a construc-tivist approach. Which means, you kind of let the learner come to thelearning themselves. You kind of just lead them there. And so withthat in mind, that’s kind of how they approach it with us as well.They want us to discover these things and, you know, lead ourselvesinto understanding.
Several RR teachers mentioned the value of being able to immediatelyapply what they learned in their training class to their RR lessons the sameweek, which allowed them to practice their new skills before the nextweek’s training session. One RR teacher explained: ‘‘We’ll learn somethingor study an article and then we’ll try to implement something within ourteaching strategies for that upcoming week.’’ She, and other RR teachers,commented that the opportunity to learn new content and apply it to theRR lessons each week was important as they tried to hone their skills whilecontinuously working with students.
RR teacher training occurs in a cohort model, with groups of RR teacherstraining together at the same pace. Most RR teachers indicated in interviews
Randomized Evaluation of Reading Recovery
565

that they felt a sense of community and camaraderie develop among their col-leagues during the training process. At school sites where multiple RR teachersworked and trained together, the RR teachers remarked on the benefit of hav-ing opportunities to learn from frequent demonstrations and observations.One RR teacher commented: ‘‘I like the fact that my teaching partner and Iare in the same classroom so we hear each other and that informs our teachingand we ask each other questions.’’ By exchanging feedback, RR teachers at thesame school were able to address their questions and concerns frequently.
Nearly 70% of all RR teachers started working with RR students withintwo weeks of the first day of school. Most expressed that their first fewmonths implementing RR were particularly challenging since they weresimultaneously teaching RR students while learning RR instructional meth-ods. The pace of training meant that sometimes teachers encounteredinstructional tasks or issues that had not yet been covered in class. Oneteacher explained that each component of Reading Recovery was graduallyintroduced to trainees; she learned about the Observation Survey first andlater how to take a running record. Though most of the time the pacingworked, sometimes the training objectives did not necessarily correspondwith her students’ progress:
You now are adding this part and now are adding this part. So itstarted off we were just reading with them. Then we were readingand writing. Then we were reading off the books, writing, and doinga running record. Each couple weeks we’d add a new component,and I think for me, I needed to see all that as a whole before I jumpedinto it. So if we were able to maybe start the class in August versusSeptember, go all through August to learn all that stuff, to see whatit really looks like so that when I get into it, I really have an ideaof what it should be. . . . That’s the kind of learner I am though.
It was not until this teacher saw a behind-the-glass session later in her train-ing that she was able to put everything together and see how the full pro-gram is designed to be implemented:
It was very hard for me until I saw people teaching behind the glass,which obviously didn’t start right away. When I saw that then it allpulled together. I was like, ‘‘Oh ok, I get it now.’’ But I never hadthat model. To see what a full lesson would have looked like. Andit’s different reading it in a book versus really seeing that kind ofinteraction.
While most RR teachers said the simultaneous learning and applying of RRstrategy felt like ‘‘trial by fire,’’ they still conceded it was the best way tocement their understanding of the program. As one teacher commented:
I definitely think, because you are a practicing RR teacher during thetraining year, the first couple of months are a little rough, because
May et al.
566

you’re trying to learn the process as you are simultaneously teaching.However I don’t think there’s another way to do it because you haveto do it while learning it in order for things to cement and for you tolearn them.
Overall, RR teachers described their experience with and perception ofthe training they received in positive terms, and most felt the training washigh quality. A vast majority of RR teachers reported feeling very well pre-pared for their RR responsibilities, such as planning and conducting lessonsand reporting data. One RR teacher explained:
I feel really well prepared. This course is really intense and I wouldsay I learned more in this one class than I have in my entire master’sprogram to become a Reading Specialist. . . . I feel like I’ve learnedmore about the reading and writing process and what kids mightbe doing and what they might not be doing and where they mightbe getting stuck and how I can push their learning forward.
This sentiment was reiterated throughout much of the interview dataand substantiated through the RR teacher survey data. The survey datashowed that RR teachers’ feelings of preparedness after training were gener-ally high but varied by task. For example, 99% of RR teachers reported feel-ing either adequately, well, or very well prepared to administer theObservation Survey at the beginning of the year. Most RR teachers also feltthat their first-year training prepared them to conduct the numerous tasksthat are related to conducting a lesson—over 90% responding that theyfelt adequately, well, or very well prepared for each of the nine elementsincluded in one-to-one RR lessons.
Over the course of their training year, RR teachers felt they gained con-fidence and developed skills through their work with students. Several RRteachers reported having very different experiences with their first and sec-ond cohort of students. ‘‘Now that I’m working with my second-round stu-dents,’’ commented one teacher, ‘‘I feel like I’m doing a better job withthem than I did with my first round just because with the first round you’retrying to learn so much.’’ Another RR teacher saw the second cohort of stu-dents as an opportunity to apply all of the knowledge she gained by work-ing with the first:
So now just looking back, I’m going to do things differently this time.After being in training since September, I know what works better.Now I get a second chance with this other group of kids.
RR teachers reported that with their second group of students, they hada better sense of what the overall program and individual lessons shouldentail. A few RR teachers even expressed an interest in keeping their firstcohort of students for longer than the allotted time, maybe even the whole
Randomized Evaluation of Reading Recovery
567

year, to compensate for the amount of learning they had to do at the begin-ning of their training. This way the first cohort of students is not ‘‘short-changed’’ by a teacher’s developing skill. Another RR teacher suggestedchanging the structure of the training year so that a teacher sees only oneor two students at the beginning of the year, then eases into a full load ofstudents once the teacher is more comfortable.
In summary, RR teachers reported very positive perceptions of theirtraining and preparation, with nearly every teacher reflecting on substantialimprovements in their skills as a literacy teacher and changes in their per-spectives on literacy instruction in general. However, while building teach-ers’ capacity is a major cornerstone of Reading Recovery, there are manyadditional practices, policies, and routines described in the Standards andGuidelines (RRCNA, 2009) that define how the Reading Recovery interven-tion is intended to be implemented.
Intervention Implementation Fidelity
Overall implementation fidelity results based on surveys of RR teachers,teacher leaders, and site coordinators are presented in Table 4. First reportedare numbers of respondents and response rates calculated based on the pop-ulation sizes that we received from IDEC. Response rates for RR teachers,teacher leaders, and site coordinators were 74%, 88%, and 58%, respectively(note that these response rates are slightly lower than the overall surveyresponse rates due to item-level nonresponse). The relatively low responserate for site coordinators is likely due to the fact that their involvement inReading Recovery in much less intense than that of teacher leaders and RRteachers (hence a lower incentive to respond) and that no monetaryresponse incentives were provided to any of these groups. Table 4 alsopresents the percentage of standards that were met by respondents, overalland by subdomain. Results show a high percentage of standards met, sug-gesting that the Reading Recovery model is being implemented with highfidelity by most RR teachers, teacher leaders, and site coordinators. On aver-age, RR teachers met 95% of the standards, while teacher leaders and sitecoordinators met 87% and 88% of the standards, respectively.
The selection of RR teachers and teacher leaders was found to havecomplete fidelity, and near complete fidelity was reported for standardsthat pertain to conducting Reading Recovery lessons, suggesting that, asreported by RR teachers, the one-on-one lessons are being implementedas required. Data from our teacher logs (n = 2,623) confirm that all of thenine structural components of RR lessons were included in virtually everyone-to-one lesson. The activity most likely to be skipped was Assembly ofa Cut-up Story, although it was skipped in only 10% of the lessons.Dozens of observations of the delivery of RR lessons in a sample of ninei3 scale-up schools confirmed this finding; strong fidelity to the standard
May et al.
568

format of lessons was observed, even in schools that struggled with otheraspects of implementation. Across the 10 categories of standards, trainingwas the category for which RR teachers and teacher leaders reported thelowest level of fidelity. Specific issues included training classes that weresmaller than the minimum eight RR teachers and conducting fewer thanthe required 18 training sessions that included two behind-the-glass lessons.In the area of research, results suggest that about one-third of teacher leadersdid not submit an annual site report to their UTC. Site coordinators reportedhigh fidelity to site preparation and maintenance (i.e., fiscal responsibilities,program monitoring, tasks related to training and oversight of personnel,and resource provisioning). The areas with lowest fidelity for site coordina-tors were professional development and communication (i.e., 68% and 79%,respectively), which implies that some site coordinators may not be asinvested in learning about and advocating for Reading Recovery as theStandards and Guidelines (RRCNA, 2009) suggest.
One area of implementation where we observed substantial variationwas in the selection of students for one-to-one intervention. ReadingRecovery strives to serve the students at greatest risk of lifelong low literacy,an aspiration that is operationalized in the Standards and Guidelines(RRCNA, 2009) by the suggestion that schools provide the intervention to
Table 4
Implementation Fidelity of Investing in Innovation (i3)
National Scale-Up of Reading Recovery (RR)
RR Teachers Teacher Leaders Site Coordinators
Number of respondents 742 168 95
Response rate (%) 73 88 58
Percentage standards met
Overall (% of standards met)a 95 87 88
Reading Recovery lessons 98
Selection 100 100
Training 81 73
Data and monitoring 99 100
Leadership 94
Research 68
Professional development 98 68
Background 81
Site preparation and maintenance 96
Communication 79
Source: Surveys of RR teachers, teacher leaders, and site coordinators.aOverall percentages are calculated as unweighted averages across all standards. Giventhat the number of standards in each domain varies, these percentages are not a simpleaverage across domains.
Randomized Evaluation of Reading Recovery
569
at least the lowest achieving 15% to 20% of a first-grade cohort. TheStandards and Guidelines also indicate that the selection of students to par-ticipate in the intervention should be guided by Marie Clay’s assertion that‘‘all kinds of children with all kinds of difficulties can be included’’ (Clay,1991, p. 60). Specifically, Clay’s recommendation states that:
exceptions are not made for children of lower intelligence, forsecond-language children, for children with low language skills, forchildren with poor motor coordination, for children who seem imma-ture, for children who score poorly on readiness measures, or forchildren who have been categorized by someone else as learning dis-abled. (Clay, as cited in RRCNA, 2009, p. 8)
To facilitate this inclusive selection process, the Standards andGuidelines (RRCNA, 2009) require schools to use only the OS to select thelowest achieving first-grade students and to serve the lowest scorers first.We examined student selection through interviews with RR teachers, teacherleaders, first-grade classroom teachers, and principals and observed consid-erable variation in schools’ implementation of this requirement.
While a minority of schools in the scale-up administered the OS to allfirst graders in order to assign the lowest scorers to Reading Recovery, ourexploration revealed that most schools used a two-tiered selection process.Typically, schools first identified a preliminary pool of low-achieving stu-dents and then selected the students who ultimately received the interven-tion from within that pool. Much of the variability observed around studentselection occurred in the first tier of this process, with the identification ofa pool of prospective participants.
Variations in this first tier of the student selection process includedschool-to-school and occasionally district-to-district differences in whichschool staff members were involved in nominating students to the prelimi-nary pool, the criteria on which these nominations were based, and the level(classroom, school, or district) at which the first-grade cohort was defined. Inmost schools, the first-round identification process was collaborative,informed by input from first-grade and often kindergarten teachers.Student identification teams also generally included interventionists, ELLand special education teachers, instructional coaches, and/or school admin-istrators. Typically, schools nominated students to the preliminary poolbased on reading levels determined by commercially available leveling sys-tems or based on assessment data from teacher-administered tests. However,in a number of schools, students were nominated to the pool based on class-room teachers’ general observations or ‘‘gut’’ impressions of their needs. Anadditional source of variation in the first tier of the selection process wasinconsistency in the level at which the first-grade cohort was defined. Insome schools, teams looked across all first-grade classrooms to identifythe lowest first graders in the whole school, even if they were distributed
May et al.
570

unevenly across classrooms. In other cases, each classroom teacher wasasked to nominate a predetermined number of students, regardless ofwhether they were among the lowest first-grade students in the school over-all. In a minority of cases, students were nominated to the preliminary poolat the district level, resulting in some schools having more candidates forReading Recovery lessons than others.
We found more consistency in the second tier of the selection process—theselection of students to receive the intervention from the preliminary pool.Consistent with the Standards and Guidelines (RRCNA, 2009), interview partic-ipants reported that RR teachers were generally responsible for selecting stu-dents from the preliminary pool and that they generally selected those whoscored lowest on the OS. However, some departures from the Standards andGuidelines were observed at this stage as well. For example, in some casesthe OS was not the only indicator of students’ performance used for the finalselection of students. Some RR teachers reported considering other studentdata—from other assessment scores to attendance records—as well, generallyat the insistence of a school or district administrator. There was also variationreported in teacher leaders’ involvement in the selection process: Many RRteachers described consulting with their teacher leaders on the interpretationof OS scores or on choosing between students with similar scores. A minorityof RR teachers reported that the final selection of students rested entirely inthe hands of their teacher leaders.
One important area of variation that emerged through our examinationof student selection was the extent to which schools excluded particulargroups of students from receiving Reading Recovery. For instance, severalschools excluded students with chronic truancy or disruptive behaviors.Decision makers at these schools, respondents reported, preferred to reserveReading Recovery slots for students they regarded as more likely to benefitfrom the intervention. Describing her school’s selection process, one RRteacher noted that first graders who had 10 or more absences in kindergartenwere automatically excluded, resulting in the exclusion of 4 of the school’s12 lowest readers that year from Reading Recovery. Another teacherremarked: ‘‘We have two students who are [first grade] repeaters who reallyneed it, but that’s something we don’t do. They’re like the lowest in thewhole grade now and we can’t serve them.’’
A significant number of teachers reported that their school or district pol-icies, or their own understanding of Reading Recovery policy, required theexclusion of students who had Individualized Education Plans (IEPs) thatincluded a literacy intervention or who were repeating first grade, even ifthey were among the lowest scorers on the OS. One teacher explained:
If a student has an IEP with reading goals on it, they can’t be inReading Recovery. And we have one little girl that was too low toeven fit in an LLI [Leveled Literacy Intervention] group, so she was
Randomized Evaluation of Reading Recovery
571

a prime candidate for Reading Recovery, but . . . she has an IEP andgets reading services so we couldn’t take her, and we wanted to. Andthere was a boy, we had done the second-time-around ObservationSurvey on him and we were getting ready to take the second round[of students for one-to-one lessons]. My teaching partner went to golook in his file for something and found that he had been retained infirst grade. . . . And if someone is a retainee, you know, from firstgrade, they don’t qualify for Reading Recovery.
There may simply be insufficient clarity regarding Reading Recovery’spolicies about the inclusion or exclusion of students with IEPs. TheStandards and Guidelines (RRCNA, 2009) state that all students should beserved regardless of disability; however, other Reading Recovery policydocuments specifically exclude those with IEPs for literacy if (and only if)they are already receiving ‘‘special help in reading’’ (see RRCNA, 2002).RR teachers themselves and other school-level implementers also describedvarying understandings of RR’s policies in this area. For instance, while someRR teachers reported that their teacher leaders instructed them not to selectstudents with IEPs, others reported that their teacher leaders insisted that nostudent be excluded. This variation in perspectives on eligibility for ReadingRecovery is a major focus in this ongoing evaluation. At this point, while it isclear that exclusions are often made, the vast majority of these are becauseexcluded students are already receiving some other literacy intervention.
Discussion
Our discussion of results from Year 1 of this large-scale randomizedevaluation of Reading Recovery under the i3 Scale-Up focuses on thestrength of causal inference supported by this study in relation to WWCstandards and also on two critical components inherent in ReadingRecovery’s theory of action (see Figure 1). The first of these is whetherand how the training provided to Reading Recovery teachers builds teachers’capacity to deliver intensive literacy instruction that is responsive to individ-ual student’s needs. The second is whether the intervention is being deliv-ered as specified in the Reading Recovery Standards and Guidelines(RRCNA, 2009) and when adaptations are made, what are the reasons andjustifications and who influences these decisions?
Causal Effects of Reading Recovery Under i3
The What Works Clearinghouse (2012) standards of evidence require (a)random assignment to treatment and control conditions (preferably withpre-intervention data to confirmation of baseline equivalence) and (b) lowoverall and differential attrition from the study. This study clearly meetsthe random assignment requirement and confirms baseline equivalence onpre-intervention outcomes. The overall student-level attrition from the study
May et al.
572

was 31%, and differential attrition was 0% given the decision to drop incom-plete matched pairs from the analytic sample.11 This is well below theWWC’s limit of 56% overall attrition when differential attrition is zero(WWC, 2012, p. 12). According to WWC, this level of ‘‘attrition is expectedto result in an acceptable level of bias even under conservative assumptions,which yields a rating of Meets Evidence Standards,’’ suggesting that the qual-ity of causal inference from this study is quite strong.
The estimated impact of Reading Recovery on students’ ITBS TotalReading scores was .69 standard deviations relative to the study sample and.47 standard deviations relative to the national population of first graders.Although the effects were slightly smaller than those reported in the WWC2008 review of Reading Recovery, these standardized effect sizes are large rel-ative to typical effect sizes found in educational evaluations. For example, theimpacts of Reading Recovery are up to 5.7 times larger than the average effectsof Title I programs reviewed by Borman and D’Agostino (1996; averageweighted effect size of .11). Gains in percentile rank scores were also large,with treatment students outperforming control students by up to 20 percentilepoints. When compared to typical gains of first graders on the ITBS tests, theadditional gains experienced by Reading Recovery students is analogous to anadditional 1.9 months of learning or a growth rate that is 38% greater than thenational average growth rate for beginning first graders.12
Developing Teachers’ Instructional Skills
A critical element to the faithful implementation of Reading Recovery is theintensive training RR teachers receive during their first year. The goal of thistraining is to enhance teachers’ skills for individualized early literacy instruction,assessment, systematic observation, analysis, responsive instruction, reflection,and planning (see Figure 1). RR teachers interviewed felt that the immediatefeedback and intensive support provided by teacher leaders during the trainingwas very effective in enhancing these skills. RR teachers felt that the one-to-oneinteractions with the teacher leaders, observations and reflections on actual les-sons, and interactions with other RR teachers helped them make concretechanges to their RR teaching. Many RR teachers reported that their RR trainingwas transformative in terms of their own instruction and understanding aboutliteracy. Additional survey data confirmed that nearly all RR teachers felt thattheir training experience and work with their teacher leader prepared themfor RR implementation and teaching RR students.
Fidelity to RR Implementation Standards and Guidelines
Behind-the-Glass Training
The behind-the-glass sessions were reported by RR teachers to be one ofthe most valuable aspects of their training experience. However, not allteachers are getting as much experience with behind-the-glass training as
Randomized Evaluation of Reading Recovery
573

is required by the Standards and Guidelines (RRCNA, 2009). While 87% ofnew RR teachers reported teaching behind the glass at least three times(as required by the RR Standards and Guidelines), the vast majority reportedobserving other teachers teach behind the glass fewer than the 36 requiredtimes. This may have been the result of smaller than usual training classes orthe great distances some RR teachers in training had to travel to attendbehind-the-glass sessions. The implications of this are not yet clear. Wouldthe skills of RR teachers in training have been developed more substantiallyif they had observed more behind-the-glass lessons, or is a lower standardacceptable? Is the requirement to observe at least 30 to 36 sessions duringthe training year (i.e., nearly one per week) unrealistic under this scale-up? These are questions that we hope to answer in subsequent years ofthis study.
Quality and Structure of Lessons
School-level implementation of RR was, in most respects, faithful to theReading Recovery Standards and Guidelines (RRCNA, 2009). Data fromteacher logs and lesson observations confirmed strong fidelity to standardsin the execution of RR lessons. Lessons were conducted with regularity,and the standard format of lessons was followed in the vast majority(.90%) of one-to-one lessons. Lower fidelity was observed related torequirements for program documentation and communication, althoughthe majority of standards in these domains were still met.
When identifying students eligible for RR intervention, schools and dis-tricts varied in their selection processes. While most schools used scores onthe OS to identify low-performing students, the students ultimately selectedto receive RR were not always the lowest performing students in the firstgrade. Where the selection of students with IEPs is concerned, our key find-ing is that while many schools are not adhering to a strict interpretation ofthe Standards and Guidelines (RRCNA, 2009) by including all of the lowestperforming students in Reading Recovery, the vast majority of students whoare excluded from Reading Recovery are deemed ineligible because they arealready receiving other literacy intervention services. In general, mostschools are making a good-faith effort to comply with their understandingof RR policy and with the goal of ensuring that all of the lowest achievingstudents in their schools receive intensive services of one kind or another.While our findings from this first year indicate that variation around studentselection is prevalent and that it affects which students ultimately participatein RR, our findings also highlight a lack of clarity around the goals and pol-icies of the intervention. If students who are already participating in anotherliteracy intervention should not be eligible for Reading Recovery (seeRRCNA, 2002), then why is this not clearly stated in the Standards andGuidelines (RRCNA, 2009)? Nevertheless, the students selected for Reading
May et al.
574

Recovery are, across the board, very low-achieving students. Although theymay not always be the students with the absolute lowest scores, the studentsselected to participate in Reading Recovery are clearly and consistentlyamong the most challenged first-grade readers in their schools.
Study Limitations
There are at least two notable limitations to this study. First, although theRCT in this evaluation provides strong causal inference about the impacts ofReading Recovery for the sample of schools and students that were includedin the final analytic sample, the degree to which these results generalize tothe full population of i3 schools and students or to the greater ReadingRecovery community beyond i3 is not guaranteed. Although we found nosignificant differences in demographics of participating and nonparticipatingschools and students, we cannot conclude that there are no differences onother unobserved variables.
The second notable limitation is that the sample size within each schoolis very small. With only four treatment students and four control students,estimates of site-specific impacts are incredibly noisy. Simulations for posthoc power and precision suggest that within-school sample sizes wouldneed to increase dramatically (e.g., .100) in order to produce site-specificimpact estimates that are reliable enough to differentiate schools with trulylarge or small impacts of Reading Recovery (e.g., r . .60). With our currentsample size of eight students per school, variation in site-specific impacts isdriven primarily by sampling variability. Fortunately, by pooling data acrossyears one through five of the study, we will produce an analytic sample thatincludes more than 1,000 schools and several thousand students who willhave been randomly assigned. This very large school-level sample sizemay be sufficient to detect correlations between site-specific impact esti-mates and implementation measures despite the imprecision in eachschool’s estimate. At this point, we don’t yet have enough linkable data onimpacts and implementation in individual schools to explain variation inimpacts, but this is an essential goal for the final years of this evaluation.
Implications for Policy and Practice
The quality of implementation and large positive effects of ReadingRecovery during the first year of this i3 scale-up suggest that the $55 millioninvestment is paying off. Although more specific cost-effectiveness resultswon’t be available until the final year of the project, these early results arevery encouraging. It is now up to the Reading Recovery community to ensurethat the new RR programs continue to succeed and are sustainable after the endof the i3 project. If the scale-up of Reading Recovery endures, this will providetangible support to the idea that federal investments in interventions that are
Randomized Evaluation of Reading Recovery
575

contingent on rigorous evidence (e.g., the i3 fund) can produce widespreadand significant changes in educational practice and outcomes.
There are two critical implications for the Reading Recovery community.Low fidelity in training due to small training classes and having too fewbehind-the-glass observations may simply reflect standards that are unrealisticor too constraining. Is it acceptable to have a training class with 5 teachersinstead of 8 to 12? Is it reasonable to expect that each teacher observe 30 to36 behind-the-glass sessions, or is 20 to 25 per year sufficient? Lastly and per-haps most importantly, the lack of consistency among RR staff in their under-standing of policies for student selection and exclusion suggests that the RRcommunity should work to make these policies more clear. For example, is itreasonable to exclude students from Reading Recovery if they are already par-ticipating in some other literacy intervention, but not simply because they havean IEP or a history of absenteeism or behavior problems? These issues shouldbe addressed more explicitly in the Standards and Guidelines (RRCNA, 2009).
Notes
Funding Sources: Institute of Education Sciences (Grant/Award Number:#R305B090015); Office of Innovation and Improvement (Grant/Award Number:#U396A100027).
1To meet What Works Clearinghouse (WWC) standards ‘‘without reservations,’’a study must use random assignment to treatment and control conditions and not exceedWWC’s thresholds for differential and overall attrition of study participants. Studies thatmeet WWC standards ‘‘with reservations’’ include (A) random assignment studies withhigh attrition and (B) nonrandomized designs, provided that A and B demonstrate base-line equivalence of the groups in the analytic sample. For more details, see the WhatWorks Clearinghouse Procedures and Standards Handbook, Version 3.0 (What WorksClearinghouse, Institute of Education Sciences, 2014) available from http://ies.ed.gov/ncee/wwc/pdf/reference_resources/wwc_procedures_v3_0_standards_handbook.pdf.
2The WWC Improvement Index ‘‘can be interpreted as the expected change in per-centile rank for an average comparison group student if the student had received the inter-vention’’ (What Works Clearinghouse, Institute of Education Sciences, 2014, p. 23).
3The ‘‘blocking’’ of students in matched pairs was intended to address the variability ofthe length of the intervention cycle for students. Blocking students into pairs ensured thatthe outcome for each treatment student was compared to the outcome for a control studentwho experienced the counterfactual for the same length of time as the treatment. In addi-tion, blocking is a mechanism that increases the likelihood of the baseline equivalence oftreatment and control in regards to pretest scores (i.e., text reading levels) and English lan-guage learner (ELL) status. Lastly, the use of matched pair blocks allows the integrity of therandom assignment design to remain uncompromised (i.e., on observed covariates) bymissing outcome data. By dropping all matched pairs with missing outcome data fromthe analytic sample, there is no risk of differential attrition of students across treatmentand control groups with regard to those variables used to create the blocks (i.e., pretestand ELL status). Furthermore, comparisons of students included and excluded from analyses(see section entitled ‘‘RCT Participation Rates’’) confirm no differential attrition by pretest,gender, race, or ELL status. Imputation methods for missing outcome data are not usedbecause they do not guarantee unbiased causal estimates if the data are not missing at ran-dom. Furthermore, the criteria for the National Evaluation of the Investing in InnovationProgram (NEi3) do not permit imputation of outcome variables (see Abt Associates, 2012).
4Students assigned to the control condition could receive any instructional interven-tion other than Reading Recovery (RR). Although data on control group students’
May et al.
576

participation in other interventions were not collected during Year 1 of the randomizedcontrolled trial (RCT), preliminary analyses of data from Year 2 suggest that over three-quarters of control group students received non-RR supplemental literacy instruction, typ-ically in small group settings.
5This design ensures that (a) the experimental contrast is maintained until the treatmentstudents conclude their RR intervention and posttest outcomes are measured in each pair, (b)control students are not denied the intervention after posttest outcomes are measured, and (c)RR teachers are not required to provide services to students who no longer need them.
6Site visit schools were selected based on a random sample, stratified by region andurbanicity.
7Models were estimated using PROC MIXED in SAS 9.3 via restricted maximum likeli-hood (REML), with model-based standard errors and degrees of freedom based on within-and between-cluster sample sizes.
8The choice to use Glass’s D is based on the expectation that the impact of ReadingRecovery will vary across students and schools, resulting in an increase in not only meanposttest achievement but also an increase in the variance of posttest achievement scores.By using the control group standard deviation, we are better able to benchmark the impactestimate against the counterfactual (i.e., the distribution of potential outcomes in theabsence of the intervention) (Cooper, 1998; Lipsey & Wilson, 2001). In addition to Glass’sD, which represents a standardized effect relative to the distribution of outcomes for onlystudy participants (i.e., the lowest eight students in each school who were selected forthe RCT), we present a population-based standardized effect size. This Cohen’s d effectsize is calculated by dividing the raw impact estimate by the standard deviation of IowaTests of Basic Skills (ITBS) scores for the national norming sample. This allows the impactof Reading Recovery to be benchmarked against the full population of first-grade students,not just the struggling readers in the study sample (see May, Perez-Johnson, Haimson, Sattar,& Gleason, 2009). The Cohen’s d impact estimates should be smaller than the Glass’s D esti-mates because the variance in outcomes for the full population of first graders is larger thanthe variance for struggling readers. Lastly, we calculate the WWC Improvement Index (seenote 2) in order to make direct comparisons to results from the WWC review.
9Raw empirical Bayes estimates of site-specific impacts have two major limitations.First, they suffer from underestimated variance due to over-shrinkage (Bloom,Raudenbush, & Weiss, 2012; Raudenbush & Bryk, 2002, p. 88). Second, empirical Bayesestimates can be highly imprecise when within-site sample sizes are small (as is thecase in this study), and the distribution of these effects can be biased toward normalitydue to measurement error. While it is possible to calculate adjusted site-specific estimates(see Bloom et al., 2012), this does not address the issue of imprecision and non-normalityof true effects. As such, we do not include histograms or other visualizations of site-specific impacts in this article.
10Comparisons of students included and excluded from analyses are based on modelssimilar to those used for the impact analyses (i.e., generalized linear mixed models withrandom effects for schools and matched pairs estimated via GLIMMIX in SAS 9.3).
11Even if potentially participating students from the schools that failed to randomizeare included in the overall attrition, the rate is still only 41% overall.
12From the start of first grade through the fifth month (i.e., the period during which thetreatment students received RR instruction), ITBS Reading Total scale scores are expected toincrease from 133 to 144 for the average student in the United States (Hoover et al., 2006).This increase of 11 points over a 5-month period suggests that the additional gains of 4.2points experienced by Reading Recovery students is equivalent to an additional 1.9 monthsof learning. Alternatively, the additional 4.2 points translates to a growth rate that is 38%greater than the national average growth rate for beginning first graders.
References
Abt Associates. (2012). National evaluation of i3: Analysis and reporting plan, ver-sion 1.0. Washington, DC: Author.
Randomized Evaluation of Reading Recovery
577

Allington, R. (2005). How much evidence is enough evidence? The Journal ofReading Recovery, 4(2), 8–11.
Ashdown, J., & Simic, O. (2000). Is early literacy intervention effective for English lan-guage learners? Evidence from Reading Recovery. Literacy Teaching andLearning: An International Journal of Early Reading and Writing, 5(1), 27–42.
Baenen, N., Bernhole, A., Dulaney, C., & Banks, K. (1997). Reading Recovery: Long-term progress after three cohorts. Journal of Education for Students Placed atRisk, 2(2), 161.
Bloom, H. S., Raudenbush, S. W., & Weiss, M. (2012). Estimating variation in pro-gram impacts: Theory, practice and applications. Manuscript submitted forpublication.
Borman, G. D., & D’Agostino, J. V. (1996). Title I and student achievement: A meta-analysis of federal evaluation results. Educational Evaluation and PolicyAnalysis, 18, 309–326.
Briggs, C., & Young, B. (2003). Does Reading Recovery work in Kansas? A retrospec-tive longitudinal study of sustained effects. The Journal of Reading Recovery,3(1), 59–64.
Brown, W., Denton, E., Kelly, P., & Neal, J. (1999). Reading Recovery effectiveness: Afive-year success story in San Luis Coastal Unified School District. ERS Spectrum:Journal of School Research and Information, 17(1), 3–12.
Center, Y., Wheldall, K., Freeman, L., Outhred, L., & McNaught, M. (1995). An exper-imental evaluation of Reading Recovery. Reading Research Quarterly, 30, 240–263.
Chapman, J. W., Tunmer, W. E., & Prochnow, J. E. (1999). Why Reading Recoverydoes not work: A longitudinal study in a whole language context. Thalamus,17, 52–53.
Clay, M. (1991). Becoming literate: The construction of inner control. Portsmouth,NH: Heinemann.
Clay, M. (2005). Literacy lessons designed for individuals: Part one. Portsmouth, NH:Heinemann.
Cooper, H. (1998). Synthesizing research: A guide for literature review. ThousandOaks, CA: Sage.
Corbin, J., & Strauss, A. (2008). Basics of qualitative research (3rd ed.). ThousandOaks CA: Sage.
D’Agostino, J., & Murphy, J. (2004). A meta-analysis of Reading Recovery in UnitedStates’ schools. Educational Evaluation and Policy Analysis, 26(1), 23–38.
Dyer, P. C., & Binkney, R. (1995). Estimating cost-effectiveness and educational out-comes: Retention, remediation, special education, and early intervention. InR. L. Allington & S. A. Walmsley (Eds.), No quick fix: Rethinking literacy pro-grams in America’s elementary schools (pp. 45–60). New York, NY: TeachersCollege Press.
Elbaum, B., Vaughn, S. M. T., & Moody, S. W. (2000). How effective are one-to-onetutoring programs in reading for elementary students at risk for reading failure? Ameta-analysis of the intervention research. Journal of Educational Psychology,92(4), 605–619.
Emerson, R. M., Fretz, R. I., & Shaw, L. L. (1995). Writing ethnographic field notes.Chicago, IL: University of Chicago Press.
Fuchs, D., & Fuchs, L. S. (2006). Introduction to Response to Intervention: What,why, and how valid is it? Reading Research Quarterly, 41(1), 93–99.
Gomez-Bellenge, F. X. (2002). Measuring the cost of Reading Recovery: A practicalapproach. The Journal of Reading Recovery, 2(1), 47–54.
May et al.
578

Hiebert, E. H. (1994). Reading Recovery in the United States: What difference does itmake to an age cohort? Educational Researcher, 23, 15–25.
Hoover, H. D., Dunbar, S. B., Frisbie, D. A., Oberley, K. R., Bray, G. B., Naylor, R. J.,. . . Qualls, A. L. (2006). The Iowa tests: 2005 norms and score conversions. IowaCity, IA: University of Iowa.
Iversen, S., & Tunmer, W. (1993). Phonological processing skills and the ReadingRecovery program. Journal of Educational Psychology, 80(4), 437–447.
Johnston, P. A., Allington, R. L., & Afflerback, P. (1985). The congruence of classroomand remedial reading instruction. The Elementary School Journal, 85, 465–478.
Johnston, P. H. (2011). Response to Intervention in literacy: Problems and possibili-ties. The Elementary School Journal, 111(4), 511–534.
Juel, C. (1988). Learning to read and write: A longitudinal study of 54 children fromfirst through fourth grades. Journal of Educational Psychology, 80(4), 437–447.
Lipsey, M. W., & Wilson, D. B. (2001). Practical meta-analysis. Thousand Oaks, CA:Sage.
Lofland, J., Snow, D., Anderson, L., & Lofland, L. H. (2006). Analyzing social settings:A guide to qualitative observation and analysis (4th ed.). Belmont, CA:Wadsworth.
Lyon, G. R., Fletcher, J. M., Shaywitz, S. E., Shaywitz, B. A., Torgesen, J. K., Wood, F. B.,. . . Olson, R. (2001). Rethinking learning disabilities. In C. E. Finn, A.J. Rotherham, & C. R. Hokanson (Eds.), Rethinking special education fora new century (pp. 259–288). Washington, DC: Progressive Policy Instituteand Thomas B. Fordham Foundation.
May, H. (2014). Distortions in distributions of impact estimates in multi-site trials:The central limit theorem is not your friend. Paper presented at the fall meetingof the Society for Research in Educational Effectiveness, Washington, DC.
May, H., Perez-Johnson, I., Haimson, J., Sattar, S., & Gleason, P. (2009). Using statetests in education experiments: A discussion of the issues (NCEE 2009-013).Washington, DC: National Center for Education Evaluation and RegionalAssistance, Institute of Education Sciences, U.S. Department of Education.
Moats, L. (2007). Whole-language high jinks: How to tell when ‘‘scientifically basedreading instruction’’ isn’t. Washington, DC: Thomas B. Fordham Institute.
Morrow, L. M. (1993). Literacy development in the early years: Helping children readand write. Needham Heights, MA: Allyn & Bacon.
National Reading Panel (US), National Institute of Child Health, & HumanDevelopment (US). (2000). Teaching children to read: An evidence-based assess-ment of the scientific research literature on reading and its implications forreading instruction. Washington, DC: National Institute of Child Health andHuman Development, National Institutes of Health.
National Research Council. (1998). Preventing reading difficulties in young children.Washington, DC: National Academy of Sciences.
Pikulski, J. (1994). Preventing reading failure: A review of five effective programs.The Reading Teacher, 48, 30–39.
Pinnell, G. (1989). Reading Recovery: Helping at-risk children learn to read. TheElementary School Journal, 90, 161–183.
Pinnell, G. S., DeFord, D. E., & Lyons, C. A. (1988). Reading Recovery: Early interven-tion for at-risk first graders (Educational Research Service Monograph).Arlington, VA: Educational Research Service.
Pinnell, G., Lyons, C., DeFord, D., Bryk, A., & Seltzer, N. (1994). Comparing instruc-tional models for the literacy education of high-risk first graders. ReadingResearch Quarterly, 29, 8–39.
Randomized Evaluation of Reading Recovery
579

Quay, L., Steele, D., Johnson, C., & Hortman, W. (2001). Children’s achievement andpersonal and social development in a first-year Reading Recovery program withteachers in training. Literacy Teaching and Learning: An International Journalof Early Reading and Writing, 5(2), 7–25.
Rasinski, T. V. (1995). Commentary: On the effects of Reading Recovery: A responseto Pinnell, Lyons, DeFord, Bryk, and Seltzer. Reading Research Quarterly, 20(2),264–270.
Raudenbush, S. W., & Bryk, A. S. (2002). Hierarchical linear models (2nd ed.).Thousand Oaks, CA: Sage Publications.
Rodgers, E., Gomez-Bellenge, F., Wang, C., & Schultz, M. (2005). Predicting the liter-acy achievement of struggling readers: Does intervening early make a difference?Paper presented at the annual meeting of the American Educational ResearchAssociation, Montreal, Quebec, Canada.
Rodgers, E., Wang, C., & Gomez-Bellenge, F. (2004). Closing the literacy achievementgap with early intervention. Paper presented at the annual meeting of theAmerican Educational Research Association, San Diego, CA.
Rowe, K. (1995). Factors affecting students’ progress in reading: Key findings froma longitudinal study. Literacy Teaching and Learning: An InternationalJournal of Early Literacy, 1(2), 57–110.
Reading Recovery Council of North America. (2002). A principal’s guide to ReadingRecovery. Columbus, OH: Author.
Reading Recovery Council of North America. (2009). Standards and guidelines ofReading Recovery in the United States (5th ed.). Columbus, OH: Author.Retrieved from http://www.readingrecovery.org/pdf/implementation/Standards_Guidelines-09_Full_Version.pdf
Ruhe, V., & Moore, P. (2005). The impact of Reading Recovery on later achievementin reading and writing. ERS Spectrum, 23(1), 20–30.
Schmitt, M. C., & Gregory, A. E. (2005). The impact of an early literacy intervention:Where are the children now? Literacy Teaching and Learning: An InternationalJournal of Early Literacy, 10, 1–20.
Schwartz, R. (2005). Literacy learning of at-risk first-grade students in the ReadingRecovery early intervention. Journal of Educational Psychology, 97, 257–267.
Shanahan, T., & Barr, R. (1995). A synthesis of research on Reading Recovery.Reading Research Quarterly, 30, 958–996.
Shaywitz, S. E., Fletcher, J. M., Holahan, J. M., Shneider, A. E., Marchione, K. E.,Stuebing, K. K., . . . Shaywitz, B. A. (1999). Persistence of dyslexia: TheConnecticut longitudinal study at adolescence. Pediatrics, 104(6), 1351–1359.
Strickland, D. S. (2002). The importance of effective early intervention. InA. E. Farstrup & S. J. Samuels (Eds.), What research has to say about readinginstruction (3rd ed., pp. 69–86). Newark, DE: International Reading Association.
Torgesen, J. K. (2000). Individual responses to early interventions in reading: The lin-gering problem of treatment resisters. Learning Disabilities Research & Practice,15, 55–64.
Tunmer, W. E., & Chapman, J. W. (2002). The relation of beginning readers’ reportedword identification strategies to reading achievement, reading-related skills, andacademic self-perceptions. Reading and Writing, 15(3–4), 341–358.
Vellutino, F. R., Scanlon, D. M., Sipay, E. R., Small, S., Chen, R., Pratt, A., & Denckla,M. B. (1996). Cognitive profiles of difficult-to-remediate and readily remediatedpoor readers: Early intervention as a vehicle for distinguishing between cogni-tive and experiential deficits as basic causes of specific reading disability.Journal of Educational Psychology, 88, 601–638.
May et al.
580

Vellutino, F. R. (2010). Learning to be learning disabled: Marie Clay’s seminal contri-bution to the Response to Intervention approach to identifying specific readingdisability. The Journal of Reading Recovery, 10(1), 5–23.
Wasik, B. A., & Slavin, R. E. (1993). Preventing early reading failure with one-to-onetutoring: A review of five programs. Reading Research Quarterly, 28, 179–200.
What Works Clearinghouse. (2008). WWC intervention report: Reading Recovery.Washington, DC: US Department of Education, Institute of Education Sciences.
What Works Clearinghouse. (2012). Procedures and standards handbook: Version3.0. Washington, DC: US Department of Education, What WorksClearinghouse. Retrieved from http://ies.ed.gov/ncee/wwc/
Manuscript received January 31, 2014Final revision received July 11, 2014
Accepted September 10, 2014
Randomized Evaluation of Reading Recovery
581