year end crime review: 2016
TRANSCRIPT

Year End Crime Review: 2020
Jan 19, 2020
Prepared by:Michael John, Lieutenant Colonel
Brandon Kyle, Senior Crime Analyst

PART 1 CRIMEVIOLENT CRIMES: HOMICIDE, RAPE, ROBBERY, AGGRAVATED ASSAULT
PROPERTY CRIMES: BURGLARY / BE, THEFT FROM AUTO, PERSONNEL/ OTHER THEFT, AUTO THEFT

↓20.2%
↓15.6%
↓10.6%
PART 1 CRIME2011 – 2020
2,911 2,827 2,654 2,357 2,333 2,357 2,376 1,946 1,987 2,034
20,87018,938
17,58616,886 16,791 15,686 15,137
13,903 13,35311,674
24,002
21,765
20,24019,243 19,124
18,043 17,513
15,849 15,340
13,708
0
4000
8000
12000
16000
20000
24000
28000
2011 2012 2013 2014 2015 2016 2017 2018 2019 2020
Part 1 Violent Crime Part 1 Property Crime
compared to2019
compared to3 year avg
compared to5 year avg

1,82
1
3,04
1
6,19
2
3,76
5
3,26
3
1,04
5
2,03
2
2,75
0
5,56
1
3,56
9
3,09
1
1,03
7
1,79
4
2,61
4
5,57
7
3,51
6
2,99
6
1,01
5
1,49
6
2,31
9
4,82
0
3,51
3
2,96
5
738
1,46
6
2,33
8
4,52
2
3,34
4
2,92
8
743
1,21
4
2,10
0
4,06
9
3,21
6
2,58
4
535
0
1000
2000
3000
4000
5000
6000
7000
D1 D2 D3 D4 D5 CBS
Part 1 Crime Counts by District: 2015 - 2020
2015 2016 2017 2018 2019 2020

9.5% 11.3% 10.2% 9.4% 9.6% 8.8%
15.9%15.2% 14.9% 14.6% 15.2% 15.3%
32.4% 30.8% 31.8%30.4% 29.5% 29.7%
19.7% 19.8% 20.1%22.2% 21.8% 23.4%
17.1% 17.1% 17.1% 18.7% 19.1% 18.8%
5.7% 5.5% 5.7% 5.8% 4.7% 4.8%
0%
10%
20%
30%
40%
50%
60%
70%
80%
90%
100%
2015, n = 19,128 2016, n = 18,044 2017, n = 17,514 2018, n = 15,851 2019, n = 15,342 2020, n = 13,722
Part 1 Crimes (% of total) by District: 2015 - 2020
CBS
D5
D4
D3
D2
D1
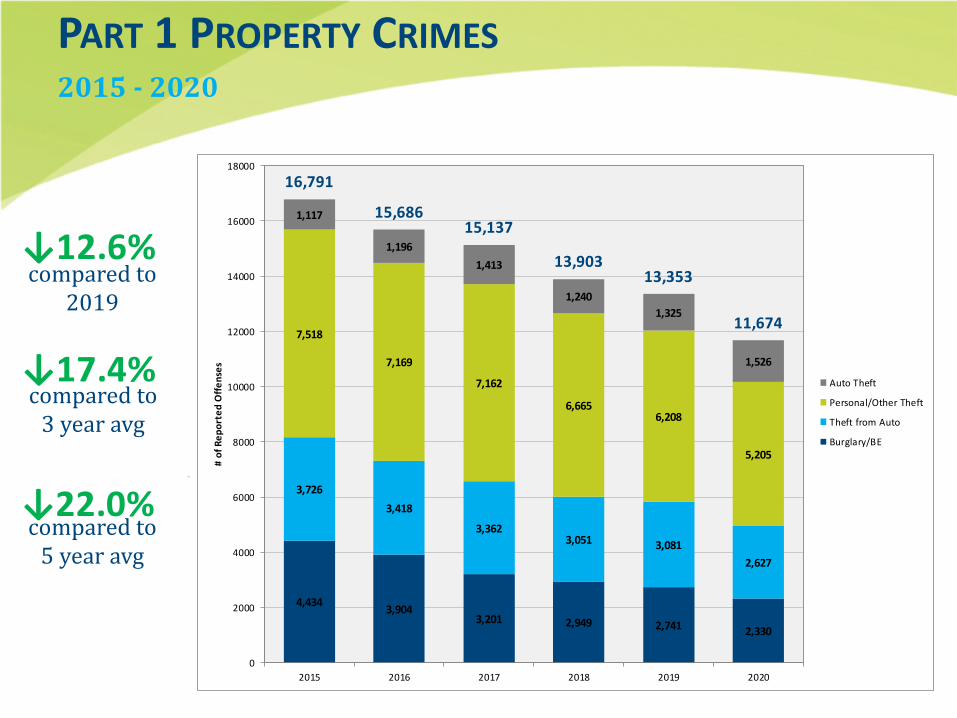
↓22.0%
↓17.4%
↓12.6%
4,434 3,9043,201 2,949 2,741 2,330
3,7263,418
3,3623,051 3,081
2,627
7,518
7,169
7,162
6,6656,208
5,205
1,117
1,1961,413
1,2401,325
1,526
16,791
15,68615,137
13,90313,353
11,674
0
2000
4000
6000
8000
10000
12000
14000
16000
18000
2015 2016 2017 2018 2019 2020
# of
Rep
orte
d O
ffens
es
Auto Theft
Personal/Other Theft
Theft from Auto
Burglary/BE
PART 1 PROPERTY CRIMES2015 - 2020
compared to2019
compared to3 year avg
compared to5 year avg

1,49
8
2,81
4
5,51
5
3,12
6
2,86
5
977
1,70
9
2,56
0
4,83
3
2,93
5
2,68
8
962
1,51
6
2,39
4
4,78
9
2,87
0
2,63
7
932
1,23
7
2,12
7
4,24
9
2,94
6
2,65
7
689
1,20
8
2,15
7
3,92
7
2,77
5
2,62
1
666
961
1,92
2
3,41
8
2,69
3
2,21
4
477
0
1000
2000
3000
4000
5000
6000
D1 D2 D3 D4 D5 CBS
Part 1 Property Crime Counts by District: 2015 - 2020
2015 2016 2017 2018 2019 2020

8.9% 10.9% 10.0% 8.9% 9.0% 8.2%
16.8%16.3% 15.8%
15.3% 16.2% 16.4%
32.8% 30.8% 31.6%30.6% 29.4% 29.2%
18.6% 18.7% 19.0%21.2% 20.8% 23.0%
17.1% 17.1% 17.4% 19.1% 19.6% 18.9%
5.9% 5.8% 6.1% 6.2% 5.0% 5.0%
0%
10%
20%
30%
40%
50%
60%
70%
80%
90%
100%
2015, n = 16,795 2016, n = 15,687 2017, n = 15,138 2018, n = 13,905 2019, n = 13,355 2020, n = 11,688
Part 1 Property Crimes (% of total) by District: 2015 - 2020
CBS
D5
D4
D3
D2
D1

PART 1 VIOLENT CRIME: NATIONAL TRENDMajor Cities Chiefs Association (MCCA)
United States 2019 2020 % ChangeHomicide 4,759 6,124 ↑28.7%Rape 25,130 21,100 ↓16.0%Robbery 91,940 82,249 ↓10.5%Aggravated Assault 189,460 209,490 ↑10.6%Total 311,289 318,963 ↑2.5%
Cincinnati 2019 2020 % ChangeHomicide 73 94 ↑28.8%Rape 310 249 ↓19.7%Robbery 850 777 ↓8.6%Aggravated Assault 754 914 ↑21.2%Total 1987 2034 ↑2.4%
*Numbers extracted from MCCA 2020 3rd Quarter Report

↓7.5%
↓3.3%
↑2.4%
PART 1 VIOLENT CRIMES2012 - 2020
53 74 63 71 62 71 61 73 94
276 243 237 243 255 289 316 310 249
1,7231,598
1,350 1,255 1,273 1,174
867 850777
775
739
707764 767 842
702 754 914
2,827
2,654
2,357 2,333 2,357 2,376
1,946 1,987 2,034
0
500
1000
1500
2000
2500
3000
2012 2013 2014 2015 2016 2017 2018 2019 2020
# of
Rep
orte
d O
ffens
es
Agg Assault
Robbery
Rape
Homicides
compared to2019
compared to3 year avg
compared to5 year avg

323
227
677
639
398
68
323
190
728
634
403
75
278
220
788
646
359
83
259
192
571
567
308
49
258
181
595
569
307
77
253
178
651
523
370
58
0
100
200
300
400
500
600
700
800
900
D1 D2 D3 D4 D5 CBS
Part 1 Violent Crime Counts by District: 2015 - 2020
2015 2016 2017 2018 2019 2020

13.8% 13.8% 13.7% 11.7% 13.3% 13.0%
9.7% 9.7% 8.1% 9.3%9.9% 9.1%
29.0% 29.0% 30.9% 33.2% 29.3% 29.9%
27.4% 27.4% 26.9%27.2%
29.1% 28.6%
17.1% 17.1% 17.1% 15.1% 15.8% 15.5%
3.8% 2.9% 2.9% 3.2% 3.5% 2.5%
0%
10%
20%
30%
40%
50%
60%
70%
80%
90%
100%
2015, n = 2,333 2016, n = 2,357 2017, n = 2,376 2018, n = 1,946 2019, n = 1,987 2020, n = 2,034
Part 1 Violent Crimes (% of total) by District: 2015 - 2020
CBS
D5
D4
D3
D2
D1

90.0
110.0
130.0
150.0
170.0
190.0
210.0
230.0
1-Ja
n
15-J
an
29-J
an
12-F
eb
26-F
eb
11-M
ar
25-M
ar
8-Ap
r
22-A
pr
6-M
ay
20-M
ay
3-Ju
n
17-J
un
1-Ju
l
15-J
ul
29-J
ul
12-A
ug
26-A
ug
9-Se
p
23-S
ep
7-O
ct
21-O
ct
4-N
ov
18-N
ov
2-De
c
16-D
ec
30-D
ec
Part 1 Violent Crime: Rolling 28 Day Offense Count
+/-2 St Dev Average (2015-2019) 2019 Count 2020 Count
Operational changes in response to COVID-19
Civil Unrest

20.0
30.0
40.0
50.0
60.0
70.0
80.0
90.0
100.0
110.01-
Jan
15-J
an
29-J
an
12-F
eb
26-F
eb
11-M
ar
25-M
ar
8-Ap
r
22-A
pr
6-M
ay
20-M
ay
3-Ju
n
17-J
un
1-Ju
l
15-J
ul
29-J
ul
12-A
ug
26-A
ug
9-Se
p
23-S
ep
7-O
ct
21-O
ct
4-N
ov
18-N
ov
2-De
c
16-D
ec
30-D
ec
Aggravated Assault: Rolling 28 Day Offense Count
+/-2 St Dev Average (2015-2019) 2019 Count 2020 Count
Operational changes in response to COVID-19
Civil Unrest

CITYWIDE SHOOTINGS2012 – 2020

↑21.3%
↑32.8%
↑36.5%
SHOOTINGSShooting victims: 2012 - 2020
374427
375
479426 409
333 356
486
0
100
200
300
400
500
600
2012 2013 2014 2015 2016 2017 2018 2019 2020
Shootings
compared to2019
compared to3 year avg
compared to5 year avg

0.0
10.0
20.0
30.0
40.0
50.0
60.0
70.0
80.01-
Jan
15-J
an
29-J
an
12-F
eb
26-F
eb
11-M
ar
25-M
ar
8-Ap
r
22-A
pr
6-M
ay
20-M
ay
3-Ju
n
17-J
un
1-Ju
l
15-J
ul
29-J
ul
12-A
ug
26-A
ug
9-Se
p
23-S
ep
7-O
ct
21-O
ct
4-N
ov
18-N
ov
2-De
c
16-D
ec
30-D
ec
Fatal and Non-Fatal Shootings: Rolling 28 Day Victim Count
+/-2 St Dev Average (2015-2019) 2019 Count 2020 Count
Operational changes in
response to COVID-19
Civil Unrest
22 total shooting victims,
weekend of 8/14-8/16

23 20
3747 46
56 5767
3628
4029
10589
107 109
165
119
95
160151
163 164
140
0
10
20
30
40
50
60
70
80
0
20
40
60
80
100
120
140
160
180
Jan Feb Mar Apr May Jun Jul Aug Sep Oct Nov Dec
# of
Sho
otin
g Vi
ctim
s
# of
Gun
Rec
over
ies
Fatal and Non-Fatal Shootings vs. Gun Recoveries: Counts by Month
Shootings Gun Recoveries

CITYWIDE HOMICIDES*2012 – 2020
*EXCLUDING HOMICIDES UNDER THE TRAFFIC CODE

↑39.1%
↑37.6%
↑28.8%
HOMICIDESHomicide victims: 2012 - 2020
46
67
56 5853
6154
61
84
7
7
7
13
9
10
7
12
10
53
74
63
71
62
71
61
73
94
0
10
20
30
40
50
60
70
80
90
100
2012 2013 2014 2015 2016 2017 2018 2019 2020
Non-Gun
Gun
compared to2019
compared to3 year avg
compared to5 year avg

HOMICIDESHomicide victims: 2012 - 2020
4667 56 58 53 61 54 61
84
374
427
375
479
426409
333356
486
0
100
200
300
400
500
600
2012 2013 2014 2015 2016 2017 2018 2019 2020
Shooting Victims
Fatal Victims

0.0
2.0
4.0
6.0
8.0
10.0
12.0
14.0
16.0
18.01-
Jan
15-J
an
29-J
an
12-F
eb
26-F
eb
11-M
ar
25-M
ar
8-Ap
r
22-A
pr
6-M
ay
20-M
ay
3-Ju
n
17-J
un
1-Ju
l
15-J
ul
29-J
ul
12-A
ug
26-A
ug
9-Se
p
23-S
ep
7-O
ct
21-O
ct
4-N
ov
18-N
ov
2-De
c
16-D
ec
30-D
ec
Homicides: Rolling 28 Day Victim Count
+/-2 St Dev Average (2015-2019) 2019 Count 2020 Count
Operational changes in response to COVID-19
Civil Unrest

SHOOTING VICTIMS BY DISTRICT

70
40
135
154
78
2
74
25
131
111
80
5
68
43
92
120
79
7
56
31
98
85
57
6
54
33
99 101
63
6
97
37
113 11
7
108
14
0
20
40
60
80
100
120
140
160
180
D1 D2 D3 D4 D5 CBS
Shooting Victim Counts by District: 2015 - 2020
2015 2016 2017 2018 2019 2020

14.6% 17.4% 16.6% 16.8% 15.2%20.0%
8.4%5.9%
10.5% 9.3%9.3%
7.6%
28.2%30.8% 22.5%
29.4%27.8% 23.3%
32.2% 26.1%29.3%
25.5%28.4%
24.1%
16.3%18.8% 19.3% 17.1% 17.7%
22.2%
0.4% 1.2% 1.7% 1.8% 1.7% 2.9%
0%
10%
20%
30%
40%
50%
60%
70%
80%
90%
100%
2015, n = 479 2016, n = 426 2017, n = 409 2018, n = 333 2019, n = 356 2020, n = 486
Shooting Victims (% of total) by District: 2015 - 2020
CBS
D5
D4
D3
D2
D1


SHOOTING VICTIM COUNTSTop 10 Neighborhoods
50
45
3533
28
25
2119 19
17
29.0
34.0
38.6
19.8
27.0
14.6
19.8
11.0
17.4
5.8
27 27 27
18
22
18
13
20
14
6
0
10
20
30
40
50
60
Shoo
ting
Vict
ims
2020 5 yr avg 2019