year ahead 2018 - ubs · year ahead 2018 changing context ... we expect another year of respectable...
TRANSCRIPT

ab
UBS House View
Year Ahead 2018
Changing context
United StatesChie n e t ent ce A erica


Mosaic Canyon Trail, Death Valley, California.


5Year Ahead 2018 – UBS House View
Welcome to the Year Ahead 2018. Inside, we explore many of the issues expected to impact economic performance and inves-tor sentiment a er a year that challenged conventional wisdom.
In 201 , we saw ongoing geopolitical tur ulence, heightened political and civil tensions here in the US and a road, and threats to the glo al alance of power. At the same time, we experi-enced strong and steady economic growth across a num er of regions and sectors. This divergence resulted in persistent uncer-tainty a out where the glo al economy was heading and how investors should react.
Against that ac drop, we now turn to the future and some of the ey factors that we anticipate will drive mar ets in the months ahead, including tighter monetary policy, political upheaval, technological disruption, and su stantial environmen-tal and social challenges.
As with any landscape de ned y constant change, investors must wor hard to identify oth opportunities and ris s as they progress toward their nancial goals. So the Year Ahead also o ers recommendations to help guide you and your portfolio through 2018 and eyond.
The outloo for 2018 is complex, and successfully navigating the mar ets will re uire thoughtful insight and glo al perspective. The Year Ahead has oth, and we than you for ta ing the time to read it.
Dear reader,
Tom Naratilresident Wealth Management
Americas and President AmericasUBS

8 Around the world
10 The beginning of history
12 Changing context
13 Recovery remains on sound footing
17 Monetary tightening
21 Political ux
26 Technological disruption
30 Sustainability challenges
34 How did we do last year?
36 Top risks
37 Much higher rates
40 Geopolitical shocks
44 China debt crisis
48 Regional hotspots
50 Dealing with change
51 Agility
53 Balance
56 Calm
59 US
60 Politics, policy, and pro ts
65 Asset Classes
65 Equities
66 Bonds
67 Alternatives
68 Currencies
70 Commodities
71 Economic forecasts
73 Key events
Contents
Highlights
Changing contextWe expect another year of respectable eco-nomic growth, higher corporate pro ts, and ris-ing equity markets. But investors will need to adapt to the changing monetary, political, tech-nological, social, and environmental context.
Read more from page 12
Top risksAlthough we expect the rally in equities to continue, we see the three most prominent threats as a signi cant rise in interest rates, a geopolitical con ict, and a China debt crisis.
Read more from page 36
Dealing with changeTo protect and grow wealth in a period of accelerated change, investors will need to demonstrate a combination of agility, balance, and calm, in our view.
Read more from page 50
Chapter title
8
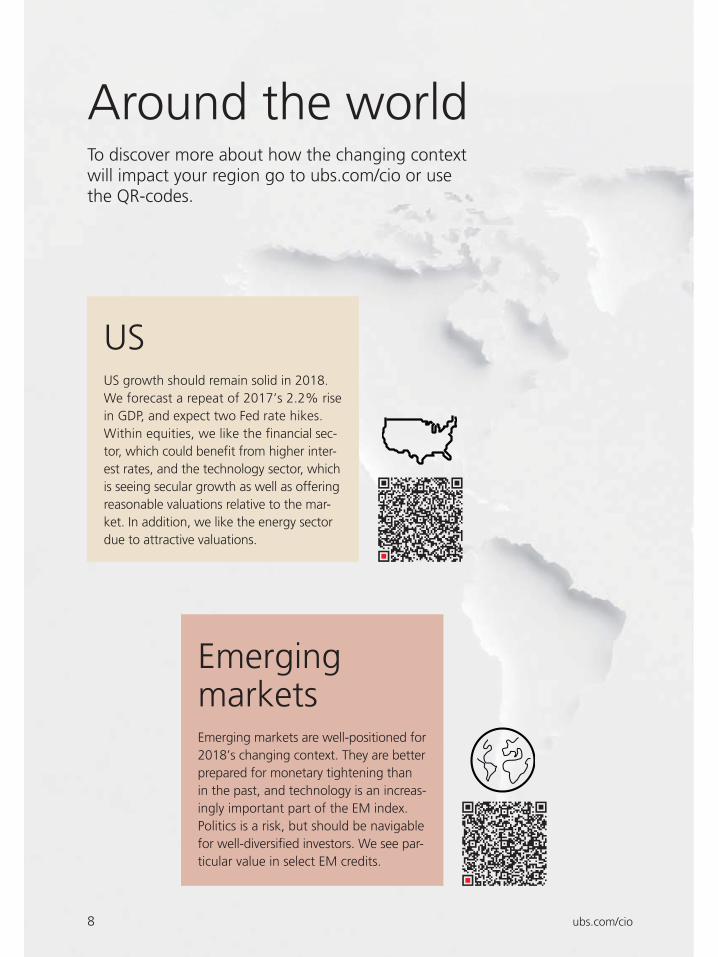
US US growth should remain solid in 2018. We forecast a repeat of 2017’s 2.2% rise in GDP, and expect two Fed rate hikes. Within equities, we like the nancial sec-tor, which could bene t from higher inter-est rates, and the technology sector, which is seeing secular growth as well as o ering reasonable valuations relative to the mar-ket. In addition, we like the energy sector due to attractive valuations.
Emerging markets Emerging markets are well-positioned for 2018’s changing context. They are better prepared for monetary tightening than in the past, and technology is an increas-ingly important part of the EM index. Politics is a risk, but should be navigable for well-diversi ed investors. We see par-ticular value in select EM credits.
Around the worldTo discover more about how the changing context will impact your region go to ubs.com/cio or use the QR-codes.
ubs.com/cio8

Chapter title
9
SwitzerlandWe expect Swiss growth to accelerate to 1.8% in 2018 from 0.8%. The SNB is likely to hike rates once, toward the end of the year, and we foresee modest franc depreciation versus the euro. It will be tough to make money in bonds, whose yields are negative, and we see house prices remaining unchanged. In equities, we favor high-quality dividend payers.
EuropeA stronger euro and Brexit uncertainty are likely to weigh on Europe’s economy, whose growth we expect to slow from 2.2% to 1.9%. We are positive on Euro-zone equities relative to the UK’s, due to contrasting earnings dynamics. It is likely to be a tough year for euro credit inves-tors. But we are optimistic on the euro, as investors gain con dence in its longevity.
Asia We see Asian economic growth of 6.1% in 2018, with innovation as a ris-ing force in the medium term. We expect China to maintain its policy direc-tion, bal ancing reform and growth. We particularly like Chinese equities and Asian high yield bonds, and also favor companies set to bene t from the tight-ening labor market in Japan.
Year Ahead 2018 – UBS House View 9

Chapter title
10 ubs.com/cio
Mark HaefeleGlobal Chief Investment f cerWealth Management
The beginning of history
Maldives. Syd Sujuaan. Unsplash
A decade from now, how will we look back on 2017? As trivial or pivotal? At rst glance it was straightforward: good growth and ris-ing markets. But I think we caught a glimpse of something stirring out there in the deep blue.
Twenty- ve years ago, Francis Fukuyama’s The End of His-tory and the Last Man hypothesized that the conclusion of the Cold War signaled “the end of history”: the victory of free-market capitalism and liberal democracy as the nal state of human sociopolitical evolution. Yet 2017’s events raised questions about this hypothesis. To paraphrase Police Chief Martin Brody in the movie Jaws, “You’re gonna need a bigger book.”
11Year Ahead 2018 – UBS House View
The beginning of history
Will the apparent peak of central bank stimu-lus begin a journey to “normalization,” or will the developed world economies prove unable to perform without low rates and quantitative easing?
Does Chinese President i Jinping’s speech on globalization at the World Economic Forum and the success of the One Belt One Road ini-tiative show a new model of governance and development in China? Is it leaving increasingly fraught Western democracies behind, in a quagmire of Twitterstorms, growing inequali-ties, slower economic growth, and separatism?
Will a new reality of human DNA editing, neural implants, and arti cial intelligence rede ne what it means to be human, and cre-ate previously unimagined levels of inequality within and among nations?
And will China’s massive investment in green technology lead the world toward a cleaner future, or will the US withdrawal from the Paris Climate Agreement start a race to the bottom on pollution and emissions regula-tion?
Finding a new way forwardLeaders and electorates are facing ever-more divergent options. And the consequences of their choices are perhaps less clear than
at any point since the end of the Cold War.How will it play out? A golden, though proba-bly unlikely, scenario is that heightened envi-ronmental challenges and the existential ques-tions posed by science will bring countries and people closer together in the quest for uni ed solutions. A less-beautiful scenario, echoing the Cold War struggle, would see a clearly victorious set of choices emerge, with extended hardship for those caught on the “wrong” side.
In a status quo scenario, perhaps likeliest of all, economic, political, and scienti c ideolo-gies would continue to diverge, with ongoing disharmony, as governments and peoples deal with their problems in a piecemeal fashion.
Regardless of whether time proves 2017 trivial or pivotal, the world, in all areas of human endeavor, seems to have entered a period of greater ideological divergence about what is the “right” way forward – for the economy, society, government, science, and the environ-ment. Investors will need to adapt to all these changes to protect and grow their wealth in the year ahead.

12 ubs.com/cio
Changing context
Stocksy
We are positive on global equity markets as we enter the new year, amid robust economic growth and limited evi-dence of an impending downturn. But monetary, political, technological, social, and environmental contexts are all changing. Each will require investors to adapt.
Changing context
13Year Ahead 2018 – UBS House View
Recovery remains on sound footing
Recession looks unlikely in 2018Periods of high economic growth o en sow the seeds of their own demise. But there is lit-tle evidence today of an impending recession. Historically, recessions have been caused by one or more of: oil price shocks, too-tight monetary policy, contractions in government spending, and nancial/credit crises. None of these look likely to materialize in 2018.
Oil prices are likely to move sideways. OECD inventories are around 10% above historical norms, providing a cushion even if supplies fall next year. Barring a signi cant rise in ten-sions in the Middle East, we expect Brent crude oil prices to trade at USD 57/bbl in 12 months’ time.
Central banks are likely to err on the side of caution as they tighten policy. In ation is sta-ble, and core measures are likely to remain below central bank targets. We expect just two interest rate hikes in the US and Canada, one in Switzerland, Australia, and New ea-land, and the Eurozone, UK, and Japan to see rates on hold in the year ahead. Meanwhile, quantitative easing will be withdrawn only gradually in the US and Eurozone, and will continue in Japan.
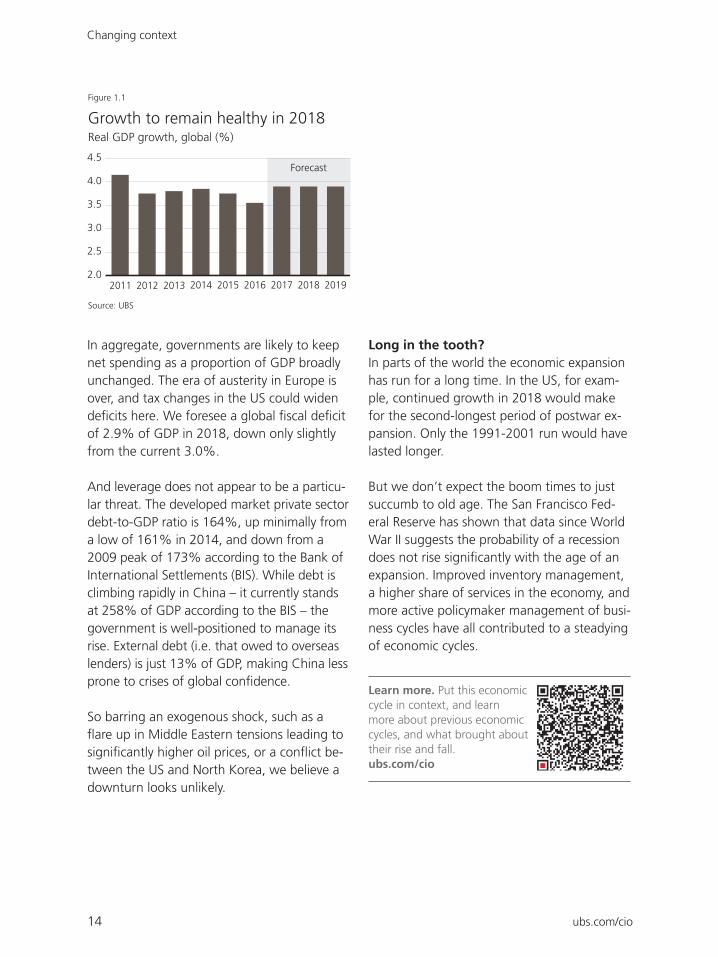
Global economic performance in 2017 looks to have been the best since 2011. Growth accelerated in the US, the Eurozone, China, Japan, Russia, and Brazil, pushing GDP world-wide up to 3.8% from 3.1% in 2016, on our estimates. The expansion has been particu-larly impressive for its synchronicity. Only six other times in the past 30 years has every economy in the G20 grown.
As we look ahead, we forecast little change in the positive economic backdrop. Both the US and Japan are bene ting from strong labor markets and solid corporate pro tability. Growth could moderate in Europe, weighed on by a stronger euro and Brexit uncertainty, and in China, where property construction is likely to slow in response to falling prices. But
ourishing economies in Brazil, whose recov-ery from the 2015–16 recession continues, and in India, where the economic reforms of the past 12 months should start taking e ect, should provide a positive o set.
Overall, we expect growth of 3.8% in the coming year, a repeat of the healthy current rate of expansion, see Figure 1.1.
Changing context
14 ubs.com/cio
2011 2012 2013 2014 2015 2016 2017 2018 2019
4.0
3.0
3.5
2.0
2.5
4.5
Growth to remain healthy in 2018
Source: UBS
Figure 1.1
Real GDP growth, global (%)
0
1
2
3
4
5
Forecast
In aggregate, governments are likely to keep net spending as a proportion of GDP broadly unchanged. The era of austerity in Europe is over, and tax changes in the US could widen de cits here. We foresee a global scal de cit of 2.9% of GDP in 2018, down only slightly from the current 3.0%.
And leverage does not appear to be a particu-lar threat. The developed market private sector debt-to-GDP ratio is 164%, up minimally from a low of 161% in 2014, and down from a 2009 peak of 173% according to the Bank of International Settlements (BIS). While debt is climbing rapidly in China – it currently stands at 258% of GDP according to the BIS – the government is well-positioned to manage its rise. External debt (i.e. that owed to overseas lenders) is just 13% of GDP, making China less prone to crises of global con dence.
So barring an exogenous shock, such as a are up in Middle Eastern tensions leading to
signi cantly higher oil prices, or a con ict be-tween the US and North Korea, we believe a downturn looks unlikely.
Long in the tooth?In parts of the world the economic expansion has run for a long time. In the US, for exam-ple, continued growth in 2018 would make for the second-longest period of postwar ex-pansion. Only the 1991-2001 run would have lasted longer.
But we don’t expect the boom times to just succumb to old age. The San Francisco Fed-eral Reserve has shown that data since World War II suggests the probability of a recession does not rise signi cantly with the age of an expansion. Improved inventory management, a higher share of services in the economy, and more active policymaker management of busi-ness cycles have all contributed to a steadying of economic cycles.
Learn more. Put this eco nomic cycle in context, and learn more about previous economic cycles, and what brought about their rise and fall. ubs.com/cio

Changing context
15Year Ahead 2018 – UBS House View
Positive on equitiesOverall, solid growth and limited evidence of an impending slowdown keep us positive on global equity markets as we enter the new year. At a trailing price-to-earnings ratio of 18.0x, global equities are priced broadly in line with their long-term average (18.3x). Prices are not yet at levels that have histori-cally presaged weak performance, though in-vestors should not expect a repeat of the dou-ble-digit annualized returns seen in recent years. Historically, global equity valuations be-tween 18x and 23x have been consistent with 6% subsequent 6-month performance, see Figure 1.2. And, much like in 2017, robust earnings growth should help push stock mar-kets higher.
More generally, investors are wise to remem-ber that avoiding taking pro ts too soon is critical for long-term performance. Since 1927, the average increase in the nal 12 months before the end of a bull market has been 22%. Missing these periods would lower in-vestors’ long-term annualized price returns on the S&P 500 from 9.6% to just 7.2%.
Changing contextWhile our view on markets is positive, this does not mean the coming year will be easy for investors. The investment context is
changing. Abnormally low levels of volatility may end on the back of monetary tightening, political ux, technological disruption, and sustainability challenges, which each bring their own set of opportunities and risks.
Monetary tightening: With almost a decade of monetary easing drawing to a close, inves-tors will need to prepare for higher volatility and potentially higher correlations and stock dispersion. We see opportunities in the nan-cial sector and, for investors looking to reduce portfolio volatility, in alternatives.
: The political calendar will raise risks to local markets, with a particular likeli-hood of heightened volatility in Brazil, Mexico, Russia, South Africa, Spain, and the UK. That said, US tax reform, and China’s One Belt One Road initiative, could provide investors with politically-driven investment opportunities too.
: New technologies will both delight and disrupt. Investors with high weightings to individual industries under threat of disruption are at risk. But we see
Valuations consistent with further upside
Source: UBS, Thomson Reuters
Figure 1.2
< 13x 13–18x 18–23x > 23x
Average 6m subsequent total return MSCI AC World, for given price-to-earnings ratio
MSCI AC World 6m return
9%
4%
6%
–1%
Price earnings
Note: Average total return of MSCI AC World index over the following 6 months when the valuation is in the indicated valuation bucket at the end of the month. Based on data since 1987.
We are here
Changing context
16 ubs.com/cio
opportunity in companies enabling and adopt-ing big data technology, those supplying auto-mation and robotics solutions, and those that provide electronics and components for elec-tric cars and autonomous driving.
: The world will con-tinue to face myriad challenges ranging from climate change, to resource overuse, and eco-nomic inequality. While the near-term e ect on markets is uncertain, the sustainable in-vesting industry can enable investors to play an important role in the long-term solution, while still seeking good risk-adjusted returns.
The boom is still going strong in the US, and the booms developing in some other countries came as a surprise (as booms usu-ally do). They seem to be based on a loss of pessimism, and perhaps a new-found opti-mism about the future. It looks like the growth rate of GDP in the US is running around 3.0% p.a., and I think growth may continue at that rate for several quarters, but much depends on the tax-cut legisla-tion: I believe the boom in the US is likely to run on through 2018 if a tax cut is passed and signed, and likely to run down if there is no tax cut.
Looking forward, I expect that if the global growth in total factor productiv-ity – a weighted average of labor pro-ductivity and capital productivity – is not signi cantly increased within the next four or ve years, investment will return to the weak level relative to GDP that we have seen over the past decades. It seems to me that investors are already well-prepared for such a period of lower long-term returns.
Source: ubs.com/nobel
Nobel Perspectives How long is left in the cycle?
Changing context
17Year Ahead 2018 – UBS House View
Monetary tightening
Central banks will tighten mone-tary policy in the year ahead. We see no cause for alarm, and higher rates could even usher in opportu-nities. But investors will need to prepare for higher volatility, cross-asset corre lations, and stock dis-persion.
Investors are likely to hear a lot about tighter monetary policy in 2018. Central banks have
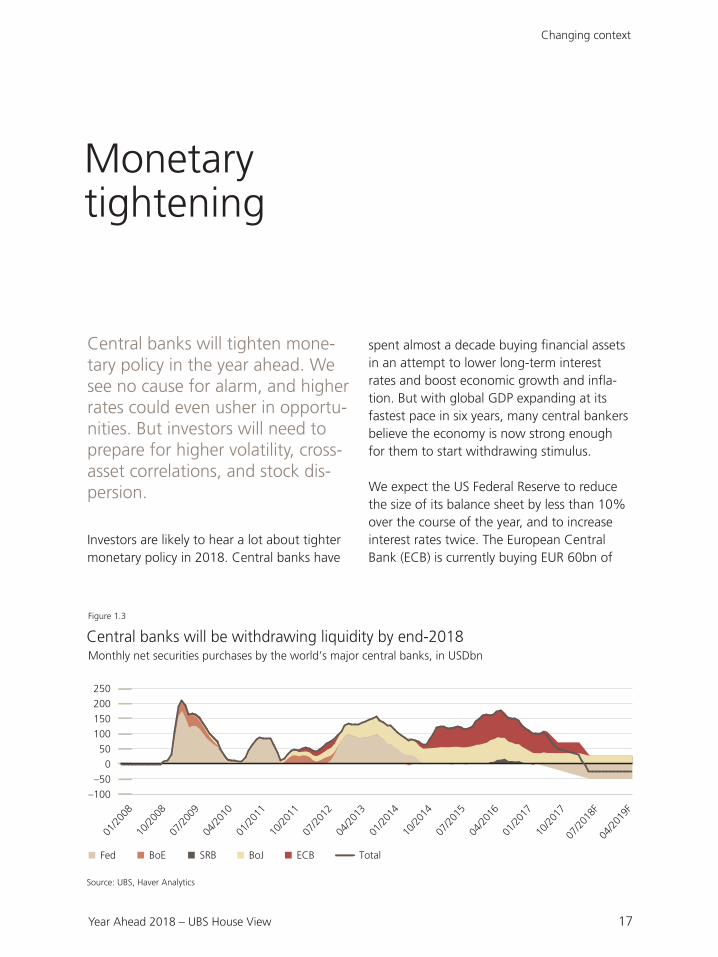
spent almost a decade buying nancial assets in an attempt to lower long-term interest rates and boost economic growth and in a-tion. But with global GDP expanding at its fastest pace in six years, many central bankers believe the economy is now strong enough for them to start withdrawing stimulus.
We expect the US Federal Reserve to reduce the size of its balance sheet by less than 10% over the course of the year, and to increase interest rates twice. The European Central Bank (ECB) is currently buying EUR 60bn of
01/2
008
10/2
008
07/2
009
04/2
010
01/2
011
10/2
011
07/2
012
04/2
013
01/2
014
10/2
014
07/2
015
04/2
016
01/2
017
10/2
017
07/2
018F
04/2
019F
250
200
150
100
50
0
–50
–100
Central banks will be withdrawing liquidity by end-2018
Source: UBS, Haver Analytics
Figure 1.3
Monthly net securities purchases by the world’s major central banks, in USDbn
Fed BoE SRB BoJ ECB Total
18 ubs.com/cio
nancial assets each month, but will reduce this to EUR 30bn monthly from January to September, and we see it winding up its asset purchase program by the end of the year. By the end of 2018, in our view, the Bank of Japan (BoJ) will be the only major central bank le providing monetary stimulus to the global economy, and in aggregate central banks will be net suppliers, rather than net demanders, of nancial assets for the rst time since the start of the nancial crisis, see Figure 1.3.
No cause for alarmAlthough the move away from monetary eas-ing marks a change, as long as it remains con-sistent with the global growth outlook, we do not see cause for investor alarm.
The scale of tightening is likely to be limited. The Fed’s “quantitative tightening” process is going to reduce the size of its balance sheet only modestly, and global central bank bal-ance sheets will still grow overall, thanks to stimulus from the ECB and BoJ. Furthermore, given that the Fed estimates that its entire quantitative easing program lowered long-term bond yields by just 100 basis points, the impact on yields directly resulting from this round of quantitative tightening should be limited. We forecast US 10-year yields of 2.5% by the end of 2018.
Central bankers remain responsive to eco-nomic data. They are only looking at raising interest rates in response to more robust growth, and their stance could be interpreted as a vote of con dence in the economy. Should global growth or in ation slow again, or should nancial markets experience a sig-ni cant dislocation, we would expect central banks to move to an easier stance.
In ation is likely to remain contained. Unlike in previous interest rate-hiking cycles, most central banks are not under pressure to slow in ation, which has remained stubbornly below targets. While policy may become less accommodative, there is no need for it to become restrictive.
Finally, there are structural factors beyond quantitative easing that have helped suppress interest rates and bond yields in recent years. They are not changing. The ongoing retirement of the baby boomer generation is lowering prospective growth and reallocating savings to-ward xed income. The development of low-capital-intensity industries is dampening de-mand for investment. And regulation continues to force pension and insurance fund managers to stock up on long-term xed income assets. A large amount of the US Treasury market, for example, is owned by investors who have no choice but to own them.
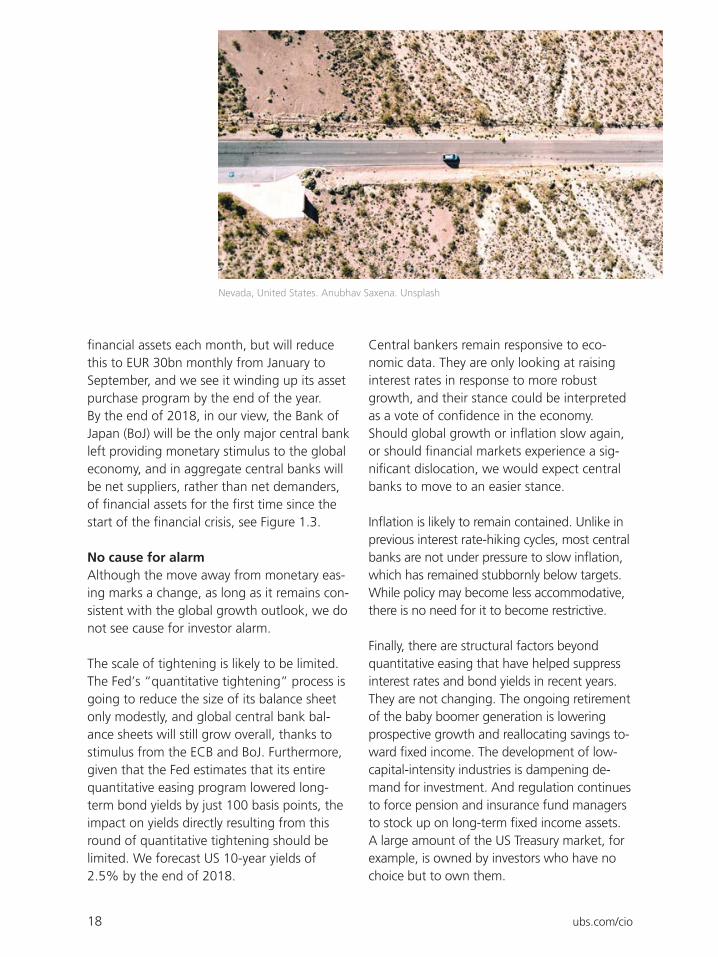
Nevada, United States. Anubhav Saxena. Unsplash
Changing context
19Year Ahead 2018 – UBS House View
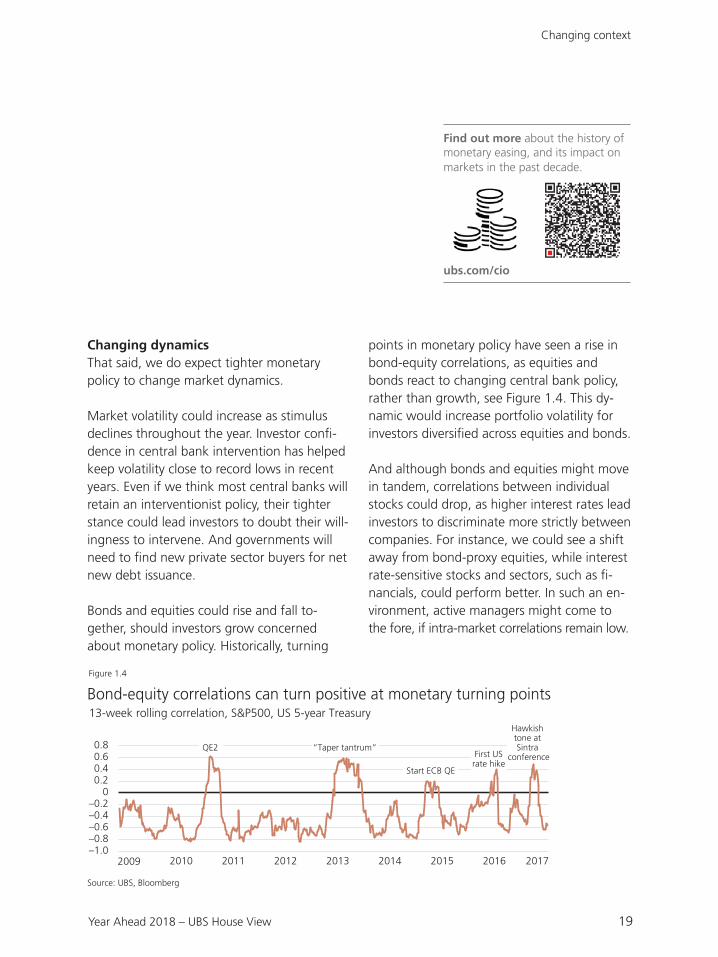
Changing dynamicsThat said, we do expect tighter monetary policy to change market dynamics.
Market volatility could increase as stimulus declines throughout the year. Investor con -dence in central bank intervention has helped keep volatility close to record lows in recent years. Even if we think most central banks will retain an interventionist policy, their tighter stance could lead investors to doubt their will-ingness to intervene. And governments will need to nd new private sector buyers for net new debt issuance.
Bonds and equities could rise and fall to-gether, should investors grow concerned about monetary policy. Historically, turning
points in monetary policy have seen a rise in bond-equity correlations, as equities and bonds react to changing central bank policy, rather than growth, see Figure 1.4. This dy-namic would increase portfolio volatility for investors diversi ed across equities and bonds.
And although bonds and equities might move in tandem, correlations between individual stocks could drop, as higher interest rates lead investors to discriminate more strictly between companies. For instance, we could see a shi away from bond-proxy equities, while interest rate-sensitive stocks and sectors, such as -nancials, could perform better. In such an en-vironment, active managers might come to the fore, if intra-market correlations remain low.
–0.20
–0.6–0.4
–1.0–0.8
2009 2010 2011 2012 2013 2014 2015 2016 2017
0.20.40.60.8
Bond-equity correlations can turn positive at monetary turning points
Source: UBS, Bloomberg
Figure 1.4
13-week rolling correlation, S&P500, US 5-year Treasury
First USrate hike
Hawkish tone at Sintra
conference“Taper tantrum”
Start ECB QE
QE2
Find out more about the history of monetary easing, and its impact on markets in the past decade.
ubs.com/cio
20 ubs.com/cio
Martin Reisch. Unsplash
Portfolio implications
– Diversifying into alternatives: At turning points in monetary policy, correlations between bonds and equities can rise, increasing portfolio volatility for investors. Diversification into alternatives, including hedge funds, could help reduce volatility.
– Active management: Reduced central bank support should make stocks more responsive to idiosyncratic factors. This could aid active managers, who have previously underperformed as central bank policy support helped all stocks move up together.
Investment ideas
– US financials: Higher interest rates gener-ally boost bank net interest margins. To the extent that a reduction in monetary stimu-lus indicates a positive macro-economic en-vironment, nancials should also bene t from greater client activity, higher loan de-mand, and good credit quality.

Changing context
21Year Ahead 2018 – UBS House View
Political ux
Politics will again dominate head-lines. We expect its global market impact to be limited, but it will both present risks and bring op-portunities at a local level.
With Russia and China asserting their pres-ence on the global stage, North Korea devel-oping nuclear weapons, political instability in the Middle East, the UK negotiating its exit from the EU, mid-terms in the US, and elec-tions taking place in Italy, Brazil, Mexico, Russia, and Malaysia, global politics is in a state of ux that will continue to play out through 2018.
Economics, usually, trumps politicsThe relevance of geopolitics for investors is debatable. Despite the signi cant media at-tention, and the plethora of political events and shocks in the past two years, the best strategy for investors would have been to turn o the 24-hour news and stay invested, see Figure 1.5. Equity markets rose and volatility plumbed record lows. Indeed, trying to trade the events could have been costly – the FTSE 100 lost nearly 9% in the immediate a er-math of the UK’s EU referendum, before recovering within days, and closing the year sharply higher.
Jan 16 Apr 16 Jul 16 Oct 16 Jan 17 Apr 17 Jul 17 Oct 17
450
350
400
500
Markets have proven relatively immune to political risk
Source: UBS, Bloomberg
Figure 1.5
MSCI All-Country World Index, since January 2016
China fears
Trumps’s victory
French elections
Catalan crisis
Brexit vote
22 ubs.com/cio
We don’t think this calm represents market complacency. In general, we believe that the impact of domestic politics on global markets is overestimated.
Politics is o en subjective. Events regarded as negative by one group can be interpreted as positive by another. Between October 2016 and August 2017, overall US consumer ex-pectations, as measured by the University of Michigan, declined by 33 points among Dem-ocrat voters and rose by 47 points among Re-publicans. This balancing e ect can neutralize the impact of politics on consumer and busi-ness con dence.
The e ect of political events also tends to be local and may not move markets internation-ally. Britain’s exit from the EU, Catalan sepa-ratism, sanctions on Russia, and modi cations
to the North American Free Trade Agreement (NAFTA) might have meaningful e ects on the UK, Spanish, Russian, and Mexican markets, respectively, but their relative impact on global markets is much smaller, and individual politi-cal issues can cancel one another out.
And since markets focus on long-term cash ows, policies instituted by a government
whose mandate will expire tend to get dis-counted somewhat.
Test your ability to assess the impact of geopolitical events on markets, using historical case studies ranging from World War II to the Cuban Missile Crisis and Brexit.ubs.com/cio
Barcelona, Spain. 2017. iStock
Changing context
23Year Ahead 2018 – UBS House View
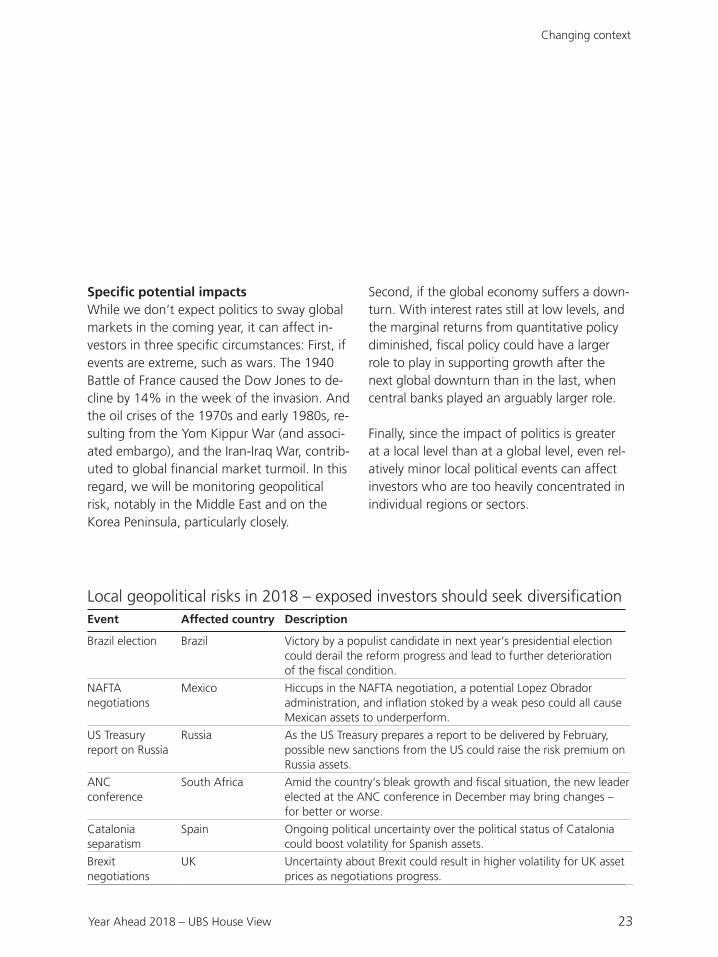
Local geopolitical risks in 2018 – exposed investors should seek diversi cation Event Description
Brazil election Brazil Victory by a populist candidate in next year’s presidential election could derail the reform progress and lead to further deterioration of the scal condition.
NAFTA negotiations
Mexico Hiccups in the NAFTA negotiation, a potential Lopez Obrador administration, and in ation stoked by a weak peso could all cause Mexican assets to underperform.
US Treasury report on Russia
Russia As the US Treasury prepares a report to be delivered by February, possible new sanctions from the US could raise the risk premium on Russia assets.
ANC conference
South Africa Amid the country’s bleak growth and scal situation, the new leader elected at the ANC conference in December may bring changes – for better or worse.
Catalonia separatism
Spain Ongoing political uncertainty over the political status of Catalonia could boost volatility for Spanish assets.
Brexit negotiations
UK Uncertainty about Brexit could result in higher volatility for UK asset prices as negotiations progress.
Specific potential impactsWhile we don’t expect politics to sway global markets in the coming year, it can a ect in-vestors in three speci c circumstances: First, if events are extreme, such as wars. The 1940 Battle of France caused the Dow Jones to de-cline by 14% in the week of the invasion. And the oil crises of the 1970s and early 1980s, re-sulting from the Yom Kippur War (and associ-ated embargo), and the Iran-Iraq War, contrib-uted to global nancial market turmoil. In this regard, we will be monitoring geopolitical risk, notably in the Middle East and on the Korea Peninsula, particularly closely.
Second, if the global economy su ers a down-turn. With interest rates still at low levels, and the marginal returns from quantitative policy diminished, scal policy could have a larger role to play in supporting growth a er the next global downturn than in the last, when central banks played an arguably larger role.
Finally, since the impact of politics is greater at a local level than at a global level, even rel-atively minor local political events can a ect investors who are too heavily concentrated in individual regions or sectors.
24 ubs.com/cio
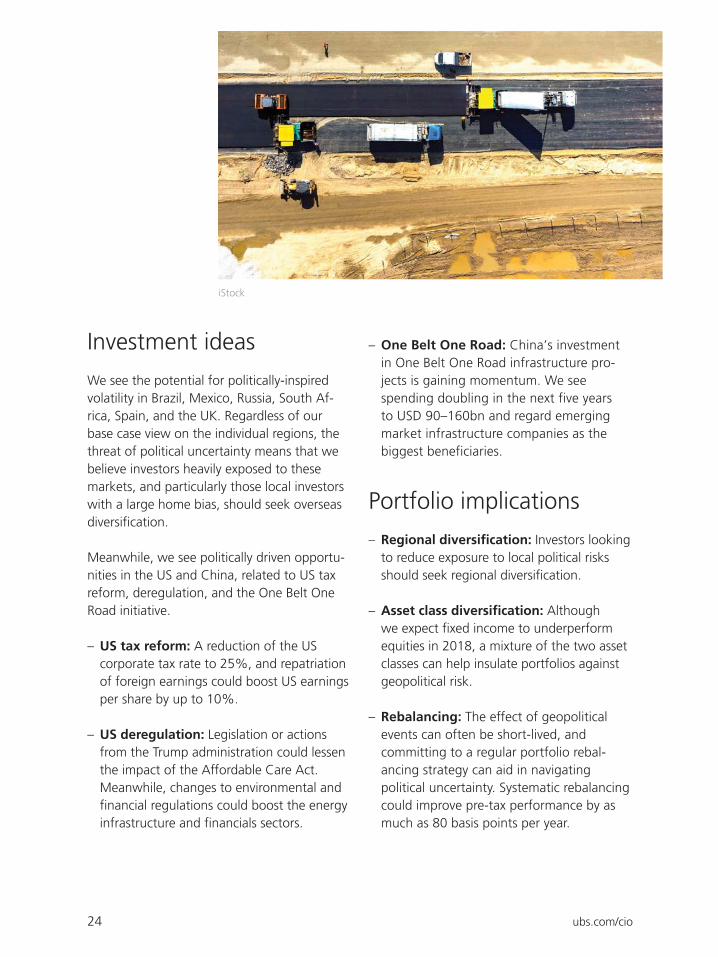
Investment ideas
We see the potential for politically-inspired volatility in Brazil, Mexico, Russia, South Af-rica, Spain, and the UK. Regardless of our base case view on the individual regions, the threat of political uncertainty means that we believe investors heavily exposed to these markets, and particularly those local investors with a large home bias, should seek overseas diversi cation.
Meanwhile, we see politically driven opportu-nities in the US and China, related to US tax reform, deregulation, and the One Belt One Road initiative.
– US tax reform: A reduction of the US corporate tax rate to 25%, and repatriation of foreign earnings could boost US earnings per share by up to 10%.
– US deregulation: Legislation or actions from the Trump administration could lessen the impact of the Affordable Care Act. Meanwhile, changes to environmental and financial regulations could boost the energy infrastructure and financials sectors.
iStock
– One Belt One Road: China’s investment in One Belt One Road infrastructure pro -jects is gaining momentum. We see spending doubling in the next five years to USD 90–160bn and regard emerging market infrastructure companies as the biggest beneficiaries.
Portfolio implications
– Regional diversification: Investors looking to reduce exposure to local political risks should seek regional diversification.
– Asset class diversification: Although we expect fixed income to underperform equities in 2018, a mixture of the two asset classes can help insulate portfolios against geopolitical risk.
– Rebalancing: The effect of geopolitical events can often be short-lived, and committing to a regular portfolio rebal-ancing strategy can aid in navigating political uncertainty. Systematic rebalancing could improve pre-tax performance by as much as 80 basis points per year.
Changing context
25Year Ahead 2018 – UBS House View
Nobel Perspectives The geopolitical impact of the America-first presidency
President Trump’s 2018 budget blueprint includes plans to increase military spend-ing. But the proposed new investments in military hardware are not likely to make any di erence for America’s geopolitical power. Recent frustrations of US foreign policy have not been due to any lack of military capability, but instead have been due to a weakness of diplomatic capabili-ties for turning battle eld successes into positive political developments.
A nation’s power in international a airs depends as much on its ability to make credible long-term commitments as on its military might. In this regard, President Trump’s shi to an opportunistic America-
rst policy could actually weaken America’s ability to achieve foreign-policy goals. Withdrawal from major international agreements will make it harder to build con dence in any newly negotiated prom-ises. In this environment, the best hope for e ective containment of North Korean
militarism may be found in security agree-ments directly between China and South Korea, even though such agreements could be interpreted as evidence of a decline of American in uence in Asia.
Meanwhile, NAFTA is at risk a er being blamed by the President for contributing to America’s longstanding trade de cit. But this trade de cit has been driven primarily by strong international demand for US debt, based on global con dence in the stability and reliability of the United States government. America- rst policies could erode this con dence and weaken global demand for US debt, resulting in US fed-eral de cits becoming harder to nance under Trump than under Obama or Rea-gan. The result could be higher US interest rates a er tax cuts in 2018.
Source: ubs.com/nobel
Changing context
26 ubs.com/cio
Technological disruption
We are living in a time of rapid technological development. We see particular opportunities in digital data, automation & robotics, and smart mobility. But investors heavily exposed to individual companies or sectors are at risk of disruption.
Technology is developing rapidly. Quantum computers can process data 100 million times faster than any traditional computer. The rst driverless cars are loose on our roads. Earbuds can translate dozens of languages in real time. And tech pioneers are setting their sights on even grander goals. Scientists are developing living solar panels that can be printed on paper, and have made strides in their ability to perform surgery directly on DNA. Elon Musk’s Neuralink, meanwhile, aims to enhance the human brain with implants, envisioning a future of telepathic communica-tion.
Some of these developments will prove to be more hype than substance. As the dotcom bubble showed, alluring visions don’t neces-sarily tally with attractive investments, even if they are ultimately proven right. Technologies may take too long to develop, companies may
be unable to monetize their growth, and in-vestors may miscalculate the sector that value ultimately accrues to.
But technology is having a very real impact too. In the most recent quarter, technology
rms accounted for 23% of S&P 500 earn-ings, up by 5ppts in three years. The tech sec-tor is now the largest in the MSCI Emerging Market and MSCI China indices. The number of patents granted has doubled over the past decade, with 1.2 million approved worldwide in the last year of data. And the US Bureau of Labor Statistics estimates that the economy will need 30% more so ware developers over the coming decade, the fastest-growing highly paid job.
Investment opportunities
We remain con dent on the shorter-term prospects for the US technology sector. We project 2018 earnings growth of 12–13%, and see price-to-earnings ratios of 19.3x as reasonable. They currently trade on a 7.5% premium to the market relative to a 25-year average of 22%. But longer term we see the most compelling technology-related opportu-nities in three areas.
27Year Ahead 2018 – UBS House View
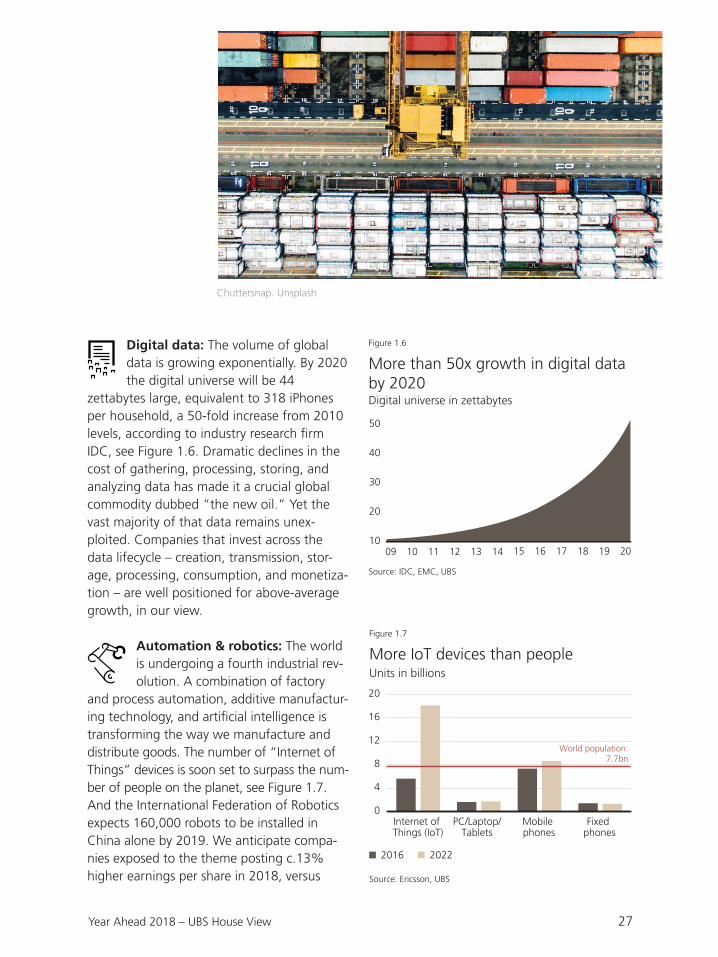
Digital data: The volume of global data is growing exponentially. By 2020 the digital universe will be 44
zettabytes large, equivalent to 318 iPhones per household, a 50-fold increase from 2010 levels, according to industry research rm IDC, see Figure 1.6. Dramatic declines in the cost of gathering, processing, storing, and analyzing data has made it a crucial global commodity dubbed “the new oil.” Yet the vast majority of that data remains unex-ploited. Companies that invest across the data lifecycle – creation, transmission, stor-age, processing, consumption, and monetiza-tion – are well positioned for above-average growth, in our view.
Automation & robotics: The world is undergoing a fourth industrial rev-olution. A combination of factory
and process automation, additive manufactur-ing technology, and arti cial intelligence is transforming the way we manufacture and distribute goods. The number of “Internet of Things” devices is soon set to surpass the num-ber of people on the planet, see Figure 1.7. And the International Federation of Robotics expects 160,000 robots to be installed in China alone by 2019. We anticipate compa-nies exposed to the theme posting c.13% higher earnings per share in 2018, versus
09 10 11 12 13 14 15 16 17 18 19 20
30
40
10
20
50
More than 50x growth in digital data by 2020
Source: IDC, EMC, UBS
Figure 1.6
Digital universe in zettabytes
Internet of Things (IoT)
PC/Laptop/Tablets
Mobile phones
Fixed phones
16
8
12
0
4
20
More IoT devices than people
Source: Ericsson, UBS
Figure 1.7
Units in billions
2016 2022
World population:7.7bn
Chuttersnap. Unsplash
28 ubs.com/cio
Long-term themesDigital data, automation & robotics, and smart mobility are thematic ideas that are captured within our Longer Term Investments. This series of thematic investment ideas should bene t from secular trends such as population growth, aging, and urbanization.
8–12% for the global equity market as a whole, with industrial so ware at the forefront.
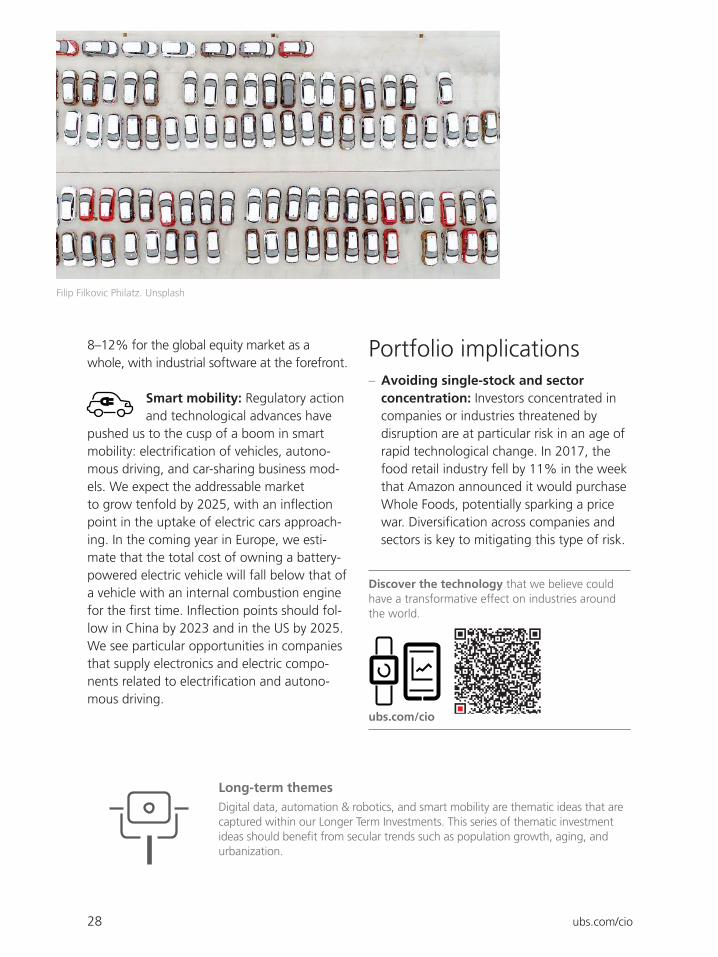
Smart mobility: Regulatory action and technological advances have
pushed us to the cusp of a boom in smart mobility: electri cation of vehicles, autono-mous driving, and car-sharing business mod-els. We expect the addressable market to grow tenfold by 2025, with an in ection point in the uptake of electric cars approach-ing. In the coming year in Europe, we esti-mate that the total cost of owning a battery-powered electric vehicle will fall below that of a vehicle with an internal combustion engine for the rst time. In ection points should fol-low in China by 2023 and in the US by 2025. We see particular opportunities in companies that supply electronics and electric compo-nents related to electri cation and autono-mous driving.
Filip Filkovic Philatz. Unsplash
Portfolio implications – Avoiding single-stock and sector concentration: Investors concentrated in companies or industries threatened by disruption are at particular risk in an age of rapid technological change. In 2017, the food retail industry fell by 11% in the week that Amazon announced it would purchase Whole Foods, potentially sparking a price war. Diversification across companies and sectors is key to mitigating this type of risk.
Discover the technology that we believe could have a transformative effect on industries around the world.
ubs.com/cio
Changing context
29Year Ahead 2018 – UBS House View
Nobel Perspectives Is technology becoming a risk to jobs?
Ever since the industrial revolution, new technology has been replacing human la-bor. Steam power, the internal combustion engine, electricity, and the computer de-stroyed jobs previously done by humans. Each time, new jobs were created that had the potential to make everyone better o .
Again this time new jobs will appear to re-place the ones that robots and arti cial in-telligence destroy because there are still many things that robots cannot do; such as jobs that involve decision making in unpre-dictable environments. And with robots doing the work, we will be able to work less and enjoy more of the products of the new technology in our leisure time.
But like globalization, new technology can only bene t everyone if we manage the transition well. CEOs will have to see how they can combine robotics with labor, and be prepared to look outside the box for the things that the new technologies can do. Workers need to be more exible in their skills, and in the jobs that they are pre-pared to contemplate. And governments need to make sure that human decency and high standards are maintained in the new work environment and not panic into blocking the advance of new technology. The education needs of a country need to be re-thought, and the support mecha-nisms for workers initially losing out ex-panded.
Source: ubs.com/nobel

Changing context
30 ubs.com/cio
Sustainability challenges
The world will continue to grapple with environmental and social challenges in 2018. Whether there is any progress in solving them in the face of global disunity remains to be seen. But investors can play an important role in furthering and funding solutions without sacri cing risk-adjusted returns.
The world economy continues to expand in a manner that cannot be maintained inde -nitely. Atmospheric carbon dioxide levels are the highest they’ve been in three million years, contributing to more frequent extreme weather events. Use of natural materials has tripled in the past 40 years, leading to in-creased environmental degradation and chal-lenges with urban pollution. And close to one billion people still live on less than USD 2 per day, lack access to clean water, and su er un-dernourishment, contributing to the growing challenge with global migration policies.
UN Sustainable Development Goals
Source: UN
Figure 1.8
THE GLOBAL GOALS For Sustainable Development

31Year Ahead 2018 – UBS House View
Investors could have an important role to play in the solution. In 2015, the UN created its Sustainable Development Goals (SDGs) resolv-ing to, among other things, end poverty, com-bat climate change, and ght injustice, see Figure 1.8. The UN acknowledges that social and legal structures have a role to play, but also recognize that ful lling this ambitious set of 17 goals will require both public and pri-vate investment across all forms of capital – physical, human, and environmental.
This demand for private capital within the SDG framework, and the rapid evolution of the sustainable investment industry across a broader range of asset classes, and with greater depth, means that investors now have an opportunity to make a positive impact on some of the world’s most pressing issues, while still seeking good risk-adjusted returns.
Investment ideasGreen bonds: One of the fastest-growing segments of the xed income market, green bonds are conventional xed income instru-ments in which the proceeds are earmarked speci cally for projects with environmental value. One can invest, for example, in bonds that target renewable energy, energy ef -ciency, sustainable waste management, sus-tainable land use, biodiversity conservation, clean transportation, and clean water/drinking water. We believe one could expect diversi ed green bond exposure to generate returns com-parable to a mix of traditional government and investment grade corporate bonds.
Multilateral development bank bonds: Mul-tilateral development banks (MDBs) like the World Bank Group play a critical role in provid-ing development where it is needed most. In re-cent years, they have nanced: irrigation services for more than two million hectares of land; ac-cess to an improved water source for 42 million people; and the reduction of 588 million tons of CO
2-equivalent emissions annually, according to
the World Bank. Bonds issued by these banks are typically AAA rated, are backed by multiple sovereign governments, have never defaulted, and can be considered, in our view, comparable to high quality bonds such as US Treasuries.
Solar power station. Nevada, USA. Getty Images
Changing context
32 ubs.com/cio
Equity strategies: By diversifying across sus-tainable equity strategies, investors can look to earn returns comparable to those available from a standard globally diversi ed equity portfolio, while making a positive environ-mental and social impact.
– Thematic: By investing in companies likely to see increased demand as they address the world’s environmental and social challenges, investors can both benefit from, and support, the solutions such companies offer. Our longer-term investment themes include numerous companies involved, for instance, in expanding water infrastructure in, providing renewable energy for, and delivering healthcare equipment to emerging markets.
– Leaders in environmental, social, and governance (ESG) standards are those companies that not only avoid major adverse effects on society and the environment, but also seek to influence their wider industry in improving sustainability standards. Many of these firms view ESG factors as opportunities to improve financial returns. Empirical evidence suggests that it is possible to construct portfolios with an above-average
sustainability standard while still achieving a risk/return profile that is comparable to “conventional” investments.
– Investors can help reward improvements in corporate behavior with respect to social and environmental issues by tilting allocations toward companies that have shown significant signs of improvement in recent months and years, and away from companies whose ESG performance has deteriorated. We believe that investment strategies capitalizing on ESG momentum should be able to deliver performance in line with, or better than, broad-market benchmarks.
– ESG engagement: Fund managers can also employ a shareholder engagement ap-proach to push com pany management into making ESG im provements. This can have a direct impact. For example, according to data compiled and analyzed by Ceres, of 779 climate-friendly shareholder proposals
led from 2013 to 2017, 36% were ad-opted without the need for a vote a er in-vestors and the companies in question agreed that more needed to be done to make suf cient progress in this area, i.e. by reducing their carbon footprint.
33Year Ahead 2018 – UBS House View
Traditional asset class
Equivalent sustainable or impact investment
Global equities ESG ThemesESG LeadersESG improvementESG engagement
Government bonds
MDB bonds
Investment grade credit
Green/climate bondsESG Leaders
Private markets Impact private equityImpact private debt
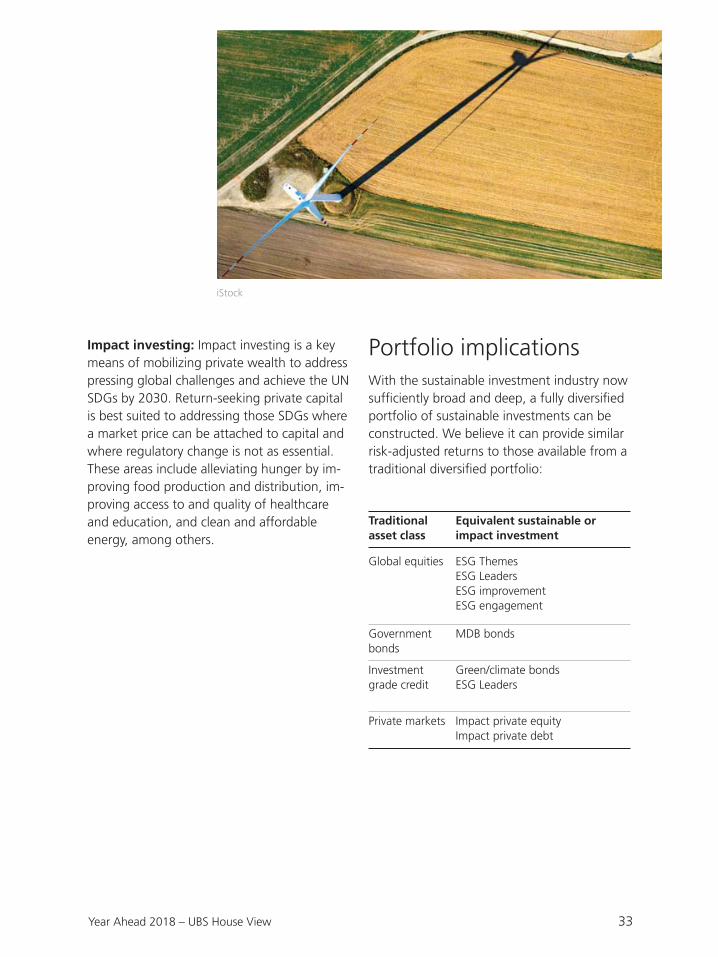
Impact investing: Impact investing is a key means of mobilizing private wealth to address pressing global challenges and achieve the UN SDGs by 2030. Return-seeking private capital is best suited to addressing those SDGs where a market price can be attached to capital and where regulatory change is not as essential. These areas include alleviating hunger by im-proving food production and distribution, im-proving access to and quality of healthcare and education, and clean and a ordable energy, among others.
Portfolio implicationsWith the sustainable investment industry now suf ciently broad and deep, a fully diversi ed portfolio of sustainable investments can be constructed. We believe it can provide similar risk-adjusted returns to those available from a traditional diversi ed portfolio:
iStock
Changing context
34 ubs.com/cio
How did we do last year?
One year on from the publication of the Year Ahead 2017, we look back at some calls we made that proved right, and some that did not.
Right
“ We forecast the euro and the British pound appreciating relative to the US dollar in 2017.”
Against the US dollar, the euro rose to 1.18 and the British pound to 0.89, from 1.06 and 0.86 at the time of writing in late 2016, respectively.
“ We are positive on US equities, anticipating 8% earnings growth in 2017.”
US equities have risen 17% since our publi-cation date, with 2017 earnings growth surpassing our estimates, up 10%.
“ In spite of political uncertainty, we are positive on emerging market (EM) equities.”
EM stocks climbed 34%, aided by rising commodity prices, a falling dollar, and stron-ger-than-expected growth across the region.
“ We expect oil prices to trade at USD 60/bbl in 12 months.”
Oil prices are currently trading at USD 63/bbl, from USD 49/bbl at the time of writing in late 2016.

35Year Ahead 2018 – UBS House View
Wrong
“ We anticipate Eurozone growth of 1.3% in 2017, down from 1.6% in 2016. We expect Eurozone earn-ings growth of 5–9%.”
Eurozone growth surprised us to the up-side, reaching 2.3%, and earnings also sur-prised us positively, up 10%.
“ We expect China to manage its slowdown e ectively, with growth of 6.4%.”
China managed its slowdown so e ectively that its GDP growth rate actually rose, ex-ceeding our expectations. Growth for 2017 looks set to be 6.8%, up from 6.7% in 2016.
“ We expect the Federal Reserve to hike rates once in December and twice in 2017.”
The Fed did indeed hike rates once in December 2016 and has done so twice so far in 2017, but we think a third 2017 hike now looks likely in December.
Martin Forster, Unsplash

36 ubs.com/cio
Johannes Schwaerzler. Unsplash
Top risksThe changing context brings risks that could weigh on global markets in 2018. While there are many known unknowns, and unknown unknowns, that could a ect investors next year, we see three risks as the most promi-nent: sharply higher in ation might force central banks to tighten policy aggressively, hurting growth; geopolitical shocks could emerge from North Korea’s nuclear weap-ons testing and from political instability in the Middle East; and China could mismanage its rising debt, leading to a greater-than-expected economic slowdown.
Top risks
37Year Ahead 2018 – UBS House View
Much higher rates
The risk scenario
Two circumstances could arise that might prompt central banks to act more boldly, in our view. They are: a) an unexpected surge in in a-tion, or, b) a dramatic change in how members interpret economic data.
An abrupt change in philosophy seems unlikely. Key central bank personnel remain the same in most regions, and the nomination of Jay Powell as new Fed Chair suggests continuity at the Fed. Powell has served at the US cen-tral bank since 2012, and has supported the current set of policies.
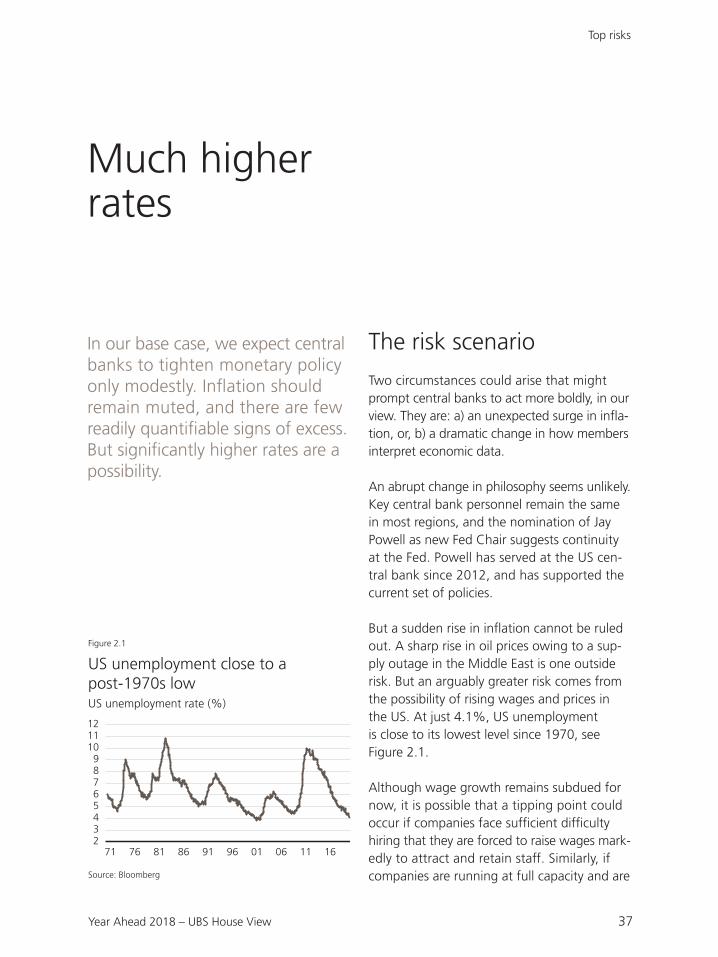
But a sudden rise in in ation cannot be ruled out. A sharp rise in oil prices owing to a sup-ply outage in the Middle East is one outside risk. But an arguably greater risk comes from the possibility of rising wages and prices in the US. At just 4.1%, US unemployment is close to its lowest level since 1970, see Figure 2.1.
Although wage growth remains subdued for now, it is possible that a tipping point could occur if companies face suf cient dif culty hiring that they are forced to raise wages mark-edly to attract and retain sta . Similarly, if companies are running at full capacity and are
In our base case, we expect central banks to tighten monetary policy only modestly. In ation should remain muted, and there are few readily quanti able signs of excess.But signi cantly higher rates are a possibility.
67
45
23
71 76 81 86 91 96 01 06 11 16
89
101112
US unemployment close to a post-1970s low
Source: Bloomberg
Figure 2.1
US unemployment rate (%)
38 ubs.com/cio
unable or unwilling to expand production, they might raise prices to try and contain demand.
Although an increase in in ation isn’t neces-sarily a bad thing in itself, should it become apparent that in ation is increasing too quickly, the Fed could be forced to raise interest rates rapidly to restrain demand. This would increase the risk of recession: every US downturn in the past 45 years has been preceded by a steep rate hike cycle by the Fed.
Market impact
Slower growth and heightened uncertainty over the course of in ation and interest rates could prompt investors to demand higher risk premia for equities and credit. In previous US recessions, a downturn in economic growth was preceded, on average, by a 20% correc-tion in the S&P 500. A correction of that mag-nitude could be expected to be accompanied by lower commodity prices, and reduced long-term bond yields.
Lessons from history
In ation running above target and Fed rate hikes don’t always immediately lead to a mar-
ket downturn. Core in ation ran slightly above the Fed’s target from 2005–07. During that episode, the yield curve inverted, but equities continued to perform well through the hiking cycle, supported by strong economic growth. But the cumulative impact of higher rates ulti-mately contributed to a decline in the housing market, creating a catalyst for the unwinding of large economic imbalances, which culmi-nated in the nancial crisis.
Key signposts
The leading indicators we will be watching closely to determine if the probability of much tighter policy is rising include:
– Average hourly earnings increases exceeding 3.5% (currently 2.4%).
– Core personal consumption expenditure in ation rising above 2.5% (currently 1.3%).
– Five-year/ ve-year breakeven in ation expectations surpassing 2.5% (currently 1.8%).
– Two-year yields rising above 2.5% (currently 1.7%).
iStock
Top risks
39Year Ahead 2018 – UBS House View
Investment ideas
– Hedge funds: They have historically out-performed other asset classes when mone-tary policy tightens, returning an average annualized 11% versus 8% for the S&P 500 during the 1994–95, 1999–2000, and 2004-06 hiking cycles. They also provide diversi cation in case of higher equity-bond correlations.
– Long-duration government bonds as part of a well-diversi ed portfolio. Although our base-case outlook on longer-duration government bonds is negative, the down-side in absolute terms is likely to be rela-tively limited, given the structural support they enjoy from aging populations and regu-lation. Meanwhile, they could be expected to rally in the event that the Fed provokes a recession.
Portfolio consequences
– It is unlikely that every monetary region would simultaneously run into labor shortages or capacity con-straints that would necessitate higher interest rates. By diversifying across monetary blocs, investors can continue to bene t from rising markets while insulating themselves against the risk of greater in ation.
– By ensuring the cur-rencies of assets are matched to the curren-cies of liabilities, investors can minimize their exposure to potentially sharp currency moves that could arise from abrupt mon-etary policy changes.

Top risks
40 ubs.com/cio
Geopolitical shocks
The risk scenario
– Although we consider a “ rst strike” unlikely, North Korea’s nuclear tests raise the risk and consequence of miscalcu-lation. For instance, test missiles could miss their intended neutral targets, sparking retaliation, or North Korea could miscalcu-late the location or intention of US war-planes, which regularly conduct exercises in the region. The potential threat to Japan and South Korea, the world’s third and eleventh-largest economies, respectively, means any con ict, or fear thereof, could have global consequences.
– Middle East: Saudi Arabia is the world’s largest oil exporter, and controls most of the market s 2.5–3 million barrels a day of spare capacity. Its recent increase in tensions with Iran has raised the risk of a disruption to oil supplies. If proxy wars between Iran and Saudi Arabia upset energy exports, and if this coincided with renewed sanctions on Iranian energy exports, the oil price, we believe, could reach USD 80/bbl and stay there for three to six months.
In our base case we do not expect ashpoints on the Korean Penin-
sula or in the Middle East to disrupt markets. We see little incentive for either North Korea or the US to make a “ rst strike.” And the recent unease in the Middle East we view as part of long-running tensions between Saudi Arabia and Iran rather than the start of some-thing potentially more serious. But even a small chance of a geopoliti-cal shock bears monitoring.

41Year Ahead 2018 – UBS House View
Market impact
In the case of a military escalation, we would expect risky asset classes to sell o , particu-larly those in the regions where con ict is occurring (i.e. APAC or MENA). Traditional safe-haven assets such as Treasuries, and so-called safe-haven currencies, such as the USD and CHF, should bene t. This could mean that, counterintuitively, the Japanese yen could also appreciate, as it has at times this past year, in the event of rising tensions on the Korean Peninsula.
Lessons from history
The Cuban Missile Crisis is perhaps the closest parallel to the situation with North Korea, and shows how stocks are likely to remain calm right up to the moment of actual con ict. The Dow Jones fell 2% during the crisis, even with the world then arguably closer to a Third World War than at any point before or since.
During previous episodes of large oil supply shocks such as the Iranian revolution in 1979, and the Iraqi invasion of Kuwait in 1990, global equities fell by about 15%, but recovered within six months.
Key signposts
Given that most of the scenarios posit a rela-tively sudden escalation, monitoring the risk of a con ict will be challenging. We will be focusing on:
– We will be watching for evi-dence of its technological development. The closer the country comes to creating a nuclear-enabled intercontinental ballistic missile, the greater the risk and consequence of accidents or miscalculations. Increased signs of military readiness in the US, North Korea, South Korea, or Japan could also provide cause for concern.
– Middle East: Potential red ags would be raised by a proxy war in Lebanon, pitting Saudi Arabia against Iran, in addition to the con ict in Yemen, tensions in Iraq, and the spat between the Saudi-led block and Qatar. This might include the US issuing sanctions against Hezbollah. The worst-case scenario would be a direct confrontation between Saudi Arabia and Iran.
iStock
Top risks
42 ubs.com/cio
Investment ideas
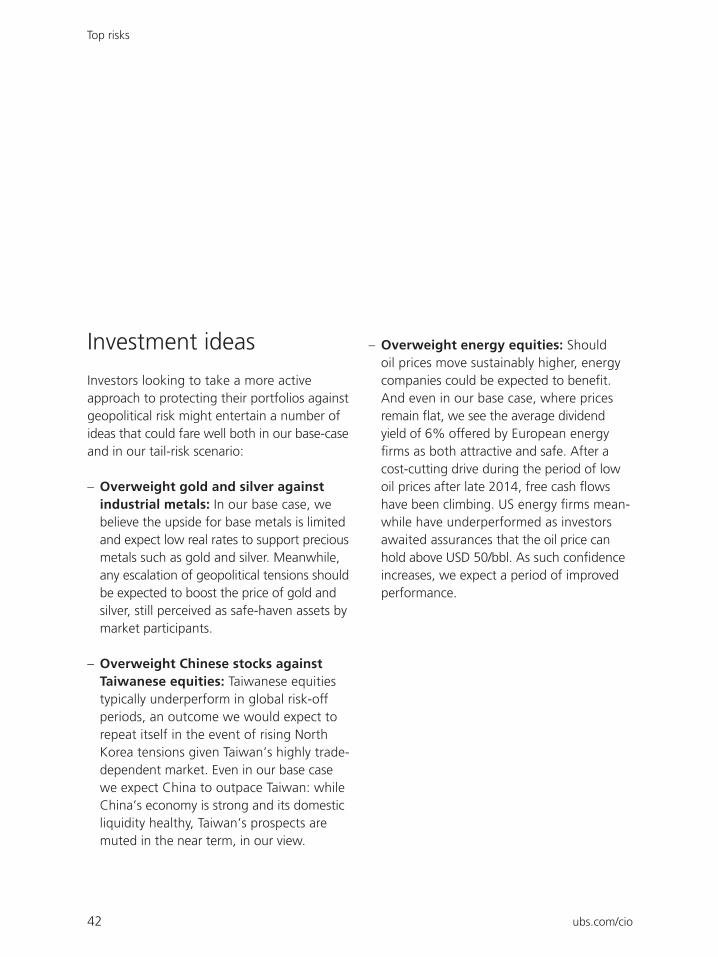
Investors looking to take a more active approach to protecting their portfolios against geopolitical risk might entertain a number of ideas that could fare well both in our base-case and in our tail-risk scenario:
–industrial metals: In our base case, we believe the upside for base metals is limited and expect low real rates to support precious metals such as gold and silver. Meanwhile, any escalation of geopolitical tensions should be expected to boost the price of gold and silver, still perceived as safe-haven assets by market participants.
– Taiwanese equities: Taiwanese equities typically underperform in global risk-o periods, an outcome we would expect to repeat itself in the event of rising North Korea tensions given Taiwan’s highly trade-dependent market. Even in our base case we expect China to outpace Taiwan: while China’s economy is strong and its domestic liquidity healthy, Taiwan’s prospects are muted in the near term, in our view.
– Should oil prices move sustainably higher, energy companies could be expected to bene t. And even in our base case, where prices remain at, we see the average dividend yield of 6% o ered by European energy
rms as both attractive and safe. A er a cost-cutting drive during the period of low oil prices a er late 2014, free cash ows have been climbing. US energy rms mean-while have under performed as investors awaited assurances that the oil price can hold above USD 50/bbl. As such con dence increases, we expect a period of improved performance.

43Year Ahead 2018 – UBS House View
Portfolio consequences
– Con ict in North Korea would have global implications, but would likely prove particularly severe for investors concentrated in Asia. Meanwhile, the e ects of an oil-price spike on markets would di er, favoring exporters but dama-ging importers. Those looking to reduce exposure to these risks should look to diver-sify across global markets.
– Although equity markets would likely fall in the event of outright con ict, high-quality bonds could prove a safe haven and help shield well-diversi ed portfolios from losses.
– Historically, geopolitical tensions, oil-price spikes, and even military con icts have had only short-lived e ects on global equity markets. Generally, staying invested through the noise has proven more e ective than attempting to trade events.
iStock

Top risks
44 ubs.com/cio
China debt crisis
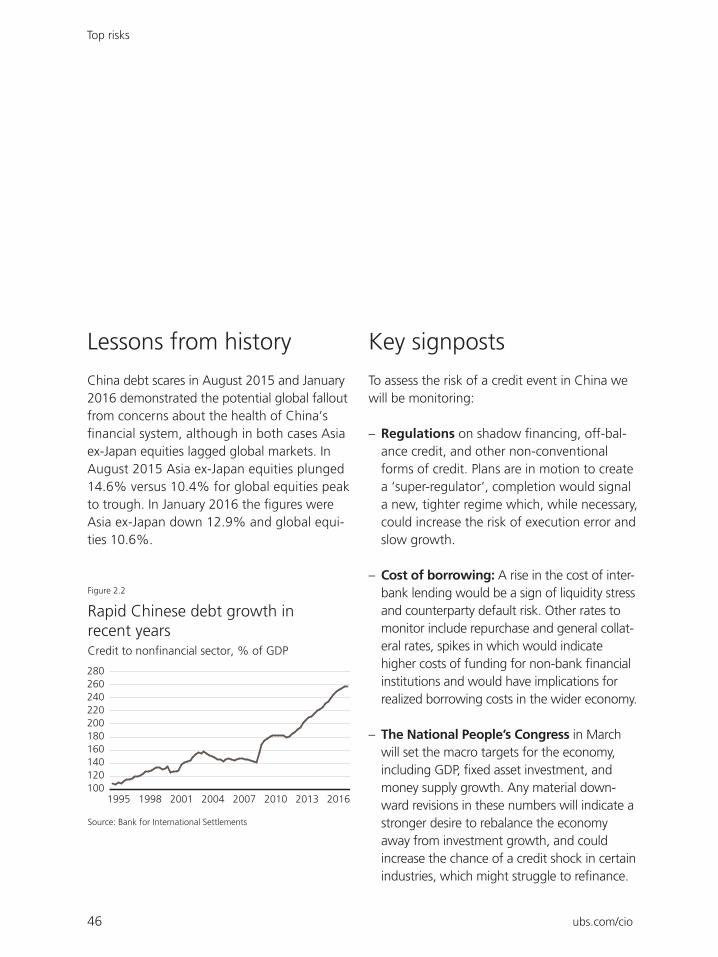
China’s total non- nancial sector debt rose from 145% of GDP in 2007 to about 257% in 2016, and has increased by about 20 percent-age points a year for the past three years. Total bank assets in China hover around 310% of GDP, nearly three times higher than the emerging market average.The Chinese government has recognized that the leverage build-up in the economy is unsustainable, and has emphasized the need to improve the “quality” of economic growth, pivoting from an economic model based on borrowing and investment to one fueled largely by domestic consumption.
The risk scenario
Credit risk is colloquially referred to in China as a “Grey Rhino,” due to its potentially uncontrollable nature. In the words of the out-going People’s Bank of China Governor hou
iaochuan, “If we’re too optimistic when things go smoothly, tensions build up, which could lead to a sharp correction, what we call a Minsky Moment. That’s what we should particularly defend against.”
China’s high growth rate, power-ful state apparatus, low external debt, and closed capital account make it less susceptible to debt crises, and our base case is for its economy to continue expanding at a robust, albeit slower, pace. But debt is rising rapidly.

45Year Ahead 2018 – UBS House View
We see two potential ways in which markets could grow fearful of a debt crisis in China:
The rst, and most likely of the two, in our view, is for one or more smaller-scale credit crunches to emerge at a regional or sector level. Some sectors have signi cant overcapac-ity issues, and several large Chinese compa-nies in the insurance, real estate, and aviation sectors are already showing initial signs of credit problems.
If clusters of credit defaults start to form, concerns about contagion into the wider econ-omy could take hold if fears of default in wealth management products arise. Should this happen, the Chinese government, in our view, would likely have suf cient resources to prevent widespread contagion. But global
nancial market volatility could increase until the situation is contained.
Stone Bridge in Fenghuang County. iStock
A second potential route is if the government miscalculates and takes steps toward capital account liberalization that back re and spark a renewed spell of capital out ows from the country. As in 2015, global concerns could arise about China running short of reserves and needing to signi cantly devalue its currency, potentially hurting companies that supply goods and commodities to the Chinese econ-omy. Again, we believe that the government is likely to be able to contain this risk through targeted regulation, as it has before, but mar-ket concerns cannot be ruled out.
Market impact
If China starts to experience a credit event, Asian equities would likely fare worse than equities in the rest of the world. Weakness in the Chinese credit sector could spill over into the rest of Asia and raise temporary concerns about the broader health of the Asian econ-omy, given its tight trade links to China. We would not foresee a credit event in China gen-erating the same type of dire consequences as one in the US or Eurozone, since China has relatively low external debt (at just 13% of GDP) and overseas investors generally have limited exposure.
Top risks
46 ubs.com/cio
Lessons from history
China debt scares in August 2015 and January 2016 demonstrated the potential global fallout from concerns about the health of China’s
nancial system, although in both cases Asia ex-Japan equities lagged global markets. In August 2015 Asia ex-Japan equities plunged 14.6% versus 10.4% for global equities peak to trough. In January 2016 the gures were Asia ex-Japan down 12.9% and global equi-ties 10.6%.
Key signposts
To assess the risk of a credit event in China we will be monitoring:
– Regulations on shadow nancing, o -bal-ance credit, and other non-conventional forms of credit. Plans are in motion to create a super-regulator’, completion would signal a new, tighter regime which, while nec essary, could increase the risk of execu tion error and slow growth.
– Cost of borrowing: A rise in the cost of inter-bank lending would be a sign of liquid ity stress and counterparty default risk. Other rates to monitor include repurchase and general collat-eral rates, spikes in which would indicate higher costs of funding for non-bank nancial institutions and would have implications for realized borrowing costs in the wider economy.
– in March will set the macro targets for the economy, including GDP, xed asset investment, and money supply growth. Any material down-ward revisions in these numbers will indicate a stronger desire to rebalance the economy away from investment growth, and could increase the chance of a credit shock in cer tain industries, which might struggle to re nance.
1995 1998 2001 2004 2007 2010 2013 2016
180200
140160
100120
220240260280
Rapid Chinese debt growth in recent years
Source: Bank for International Settlements
Figure 2.2
Credit to nonfinancial sector, % of GDP
Top risks
47Year Ahead 2018 – UBS House View
Investment ideas
– Long-duration US government bonds and can help provide downside protection during risk-o scenar-ios, and tend to appreciate from a “ ight to quality” during debt crises.
Portfolio consequences
– Given that a China debt crisis is likely to be felt more keenly in Asia than in other regions, inves-tors looking to reduce their exposure to China risk should ensure their portfolios are well-diversi ed across regions.
– China’s low external debt means, in our view, that most debt scares should ultimately be manageable internally. As such, the longer-term impact would likely be limited. As in 2015 and 2016, vol-atility could rise temporarily, but markets would likely recover as investors came to realize that the situation could ultimately be managed through targeted regulation. It is important for investors to keep a long-term focus, and use periods of market volatility to rebalance toward their strategic asset allocation.

Top risks
48 ubs.com/cio
Regional hotspots
North America
– Rising interest rates: Higher in ation could force the Fed to hike rates quickly, potentially damaging economic growth.
– Uncertainty over NAFTA negotiations, and US trade policy more generally, could lead to uncertainty among trade partners and a ected com panies.
Europe
– Brexit – deal or no deal: The UK will need to reach a “Brexit” deal with the EU by October for it to be rati ed in time for the March 2019 deadline.
– An inconclusive vote could result in another technocratic govern-ment or repeat elections, prolonging busi-ness and household uncertainty.
– Protests in Catalonia over independence for the region have already a ected local economic growth; it could continue.
While our “top three” risks for the year are sharply higher US interest rates, a geopolitical shock, and a China debt crisis, they rep-resent just a few of the “known unknowns” investors will need to guard against. Any number of “unknown unknowns” could also emerge. Diversi cation is the best defense against them, in our view.

49Year Ahead 2018 – UBS House View
To keep yourself up-to-date with key risks through the year check out Risk radar on ubs.com/cio.
Asia
– North Korea’s development of nuclear weapons has raised tensions in the region and with the US, increasing the possibility of military confron-tation.
– China’s rapid build-up of debt has been well-managed thus far, but high debt carries the risk of occasional
are-ups.
Latin America
– A potential Lopez Obrador administration could cause Mexican assets to underperform.
– A populist victory in the presidential election could derail the progress made on reform and worsen the scal posi-tion.
– The country is restructuring its debt and is also scheduled to hold general elections, although it is uncertain whether they will take place.
Eastern Europe/MENA
– Saudi-Iran tensions: Increased tensions between Saudi Arabia and Iran could cause oil prices to spike if regional supplies are disrupted.
– Sanctions remain a key topic in Russia; any new ones imposed by the US could hurt Russian assets.
– The country is already su ering from weak growth and a high de cit, and it is unclear whether a new leader will improve or worsen matters.
Golden Gate Bridge in San Francisco. iStock

50 ubs.com/cio
Dealing with changeWe believe that investors navigating the changing context will need to demonstrate a combination of agility, balance, and calm: the agility to take advantage of the opportunities the changing context presents; the balance to manage the risks of the inevitable monetary, political, technological, environmental, and social changes that occur; and the calm to remain focused and far-sighted in an era of information overload.
Bondi Beach, Australia. Raj Eiamworakul. Unsplash
Dealing with change
51Year Ahead 2018 – UBS House View
The returns on active investment strategies have generally been disappointing in recent years. But market dynamics are now becoming more conducive to them. We believe 2018 will be a year in which it will pay for inves-tors to be more agile. Monetary tightening, political ux, and tech-nological disruption will all present opportunities.
The returns to active investors have been disappointing The returns from picking out favored stocks and sectors, relative to just passively investing in rising markets, have been limited in recent years. Between 2013 and 2016, more than 93% of fund managers benchmarked against the S&P 500 failed to beat the market. Loose monetary policy around the world has prompted stock prices to move in unison, rising or falling together. From 2013 to 2016, intra-stock correlations on the S&P 500 aver-aged 28%, versus a long-term average of
17%. In such an environment of undi erenti-ated stock performance, stock and sector picking is largely ine ective.
But market dynamics are changingToday, however, market dynamics are starting to favor investors looking to take advantage of speci c opportunities.
The increased share of money being managed passively is creating more mispricings relative to fundamentals, providing more opportuni-ties for investors and managers looking to create alpha. The share of equity mutual fund and exchange-traded fund (ETF) assets that are passively managed has risen in the US from 22% in 2007 to 46% by 2017, and in Europe from 11% to 35% over the same period. USD 4.3trn of assets are now invested in global ETFs, making the market more than USD 1trn larger than the entire hedge fund industry. And this has contributed to a grow-ing valuation dispersion that investors and managers can look to exploit. The dispersion in valuation between the cheapest and most expensive stocks is wide – at the 80th percen-tile of its range since 1991.
Agility
Dealing with change
52 ubs.com/cio
1991 1995 1999 2003 2007 2011 2015
0.4
0.5
0.2
0.3
0
0.1
0.6
0.7
Decade-low correlations should create opportunities for agile investors
Source: Bloomberg
Figure 3.1
S&P 500 pairwise correlation
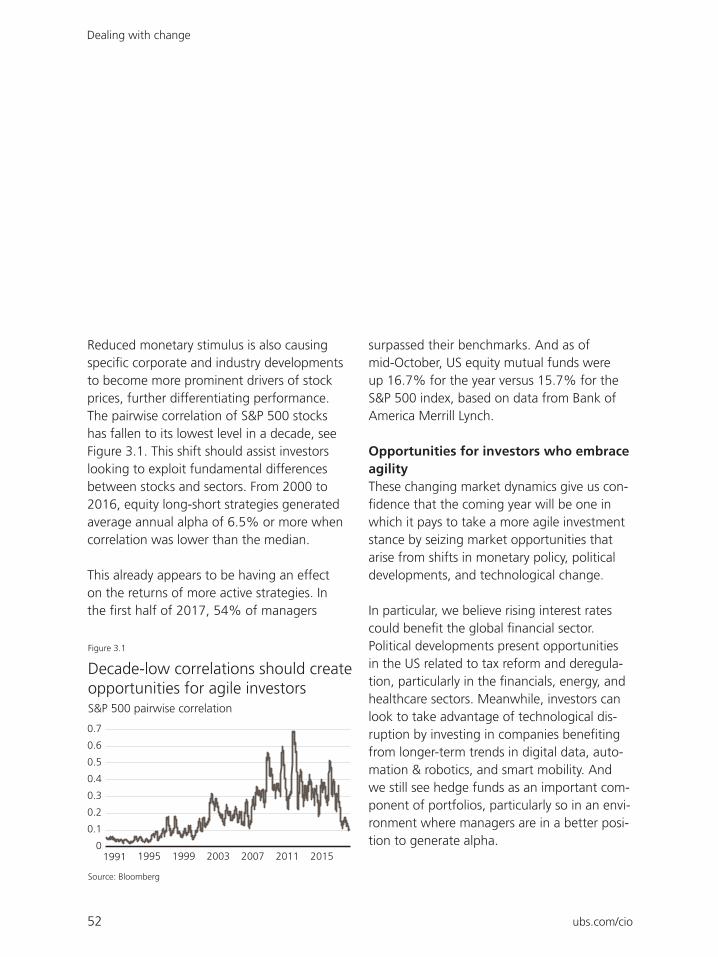
Reduced monetary stimulus is also causing speci c corporate and industry developments to become more prominent drivers of stock prices, further di erentiating performance. The pairwise correlation of S&P 500 stocks has fallen to its lowest level in a decade, see Figure 3.1. This shi should assist investors looking to exploit fundamental di erences between stocks and sectors. From 2000 to 2016, equity long-short strategies generated average annual alpha of 6.5% or more when correlation was lower than the median.
This already appears to be having an e ect on the returns of more active strategies. In the rst half of 2017, 54% of managers
surpassed their benchmarks. And as of mid-October, US equity mutual funds were up 16.7% for the year versus 15.7% for the S&P 500 index, based on data from Bank of America Merrill Lynch.
Opportunities for investors who embrace agilityThese changing market dynamics give us con-
dence that the coming year will be one in which it pays to take a more agile investment stance by seizing market opportunities that arise from shi s in monetary policy, political developments, and technological change.
In particular, we believe rising interest rates could bene t the global nancial sector. Political developments present opportunities in the US related to tax reform and deregula-tion, particularly in the nancials, energy, and healthcare sectors. Meanwhile, investors can look to take advantage of technological dis-ruption by investing in companies bene ting from longer-term trends in digital data, auto-mation & robotics, and smart mobility. And we still see hedge funds as an important com-ponent of portfolios, particularly so in an envi-ronment where managers are in a better posi-tion to generate alpha.

53Year Ahead 2018 – UBS House View
Holding a well-balanced portfolio is a perennial investment strategy. But the cross-currents of monetary tightening, political ux, techno-logical disruption, and environ-mental and social change make keeping your portfolio in balance of particular importance this year.
Diversi cation across asset classesAs our themes of monetary tightening, politi-cal ux, technological disruption, and sustain-ability challenges play out against a backdrop of an expanding global economy, under- or overexposure to any one asset class could leave investors at risk.
Underexposure to equities might help reduce exposure to political events, but it could leave investors poorly positioned to gain from eco-nomic growth and technological develop-ments, jeopardizing the ability of their port-folios to keep pace with in ation.
Underexposure to xed income might pre-pare a portfolio well for potentially tighter monetary policy, but would also leave inves-tors vulnerable to sharp drawdowns in the event of extreme political shocks, such as a US-North Korea con ict, in which xed income would likely help insulate portfolios from marked declines.
Underexposure to alternatives might not appear costly during a time when bonds and equities are diversifying one another, but it would leave portfolios at risk of much higher volatility if monetary tightening causes bonds and equities to move in tandem.
We believe that holding a balanced combina-tion of equities, bonds, and alternatives is the best way to navigate markets.
Balance
Claus Pescha. Unsplash
The historical evidenceIn the dotcom crash, the drawdown on US equities was 46% but was just 12% on a diversi ed portfolio. In 2008–2009 US stocks fell 51% with a diversi ed portfolio down 29%.
Dealing with change
54 ubs.com/cio
Diversi cation across regionsRegional diversi cation will help reduce inves-tor exposure to monetary and political risks. We expect another year of politics dominat-ing the headlines, and see particular political risks in Brazil, Mexico, Russia, Saudi Arabia, South Africa, Spain, and the UK, while “unknown unknown” political events could occur anywhere. Investors seeking to reduce their exposure to political uncertainty can do this relatively easily by spreading investments worldwide. The impact of political events on global markets has generally proven limited or short-lived.
Regional diversi cation can also help reduce monetary policy risks. The US, UK, Eurozone, Switzerland, and Japan are all at di erent stages in their economic and monetary policy cycles. As such, in ation or a policy mistake, if one occurs, is likely to be localized in an individual monetary regime. Investors who hold their assets across a range of monetary regimes, while hedging currency risk, lessen their exposure to potential policy errors and rising in ation.
The historical evidenceInvestors concentrated in one market have probably su ered a much bumpier ride than global investors. Since global equities plumbed their post- nancial cri-sis trough in 2009, only one G20 stock market has exhibit ed lower volatility than the global MSCI All Country World index. And while the global index has not su ered a bear market decline of 20% or more since 2009, 15 of the G20 countries have done so during this period.
Dealing with change
55Year Ahead 2018 – UBS House View
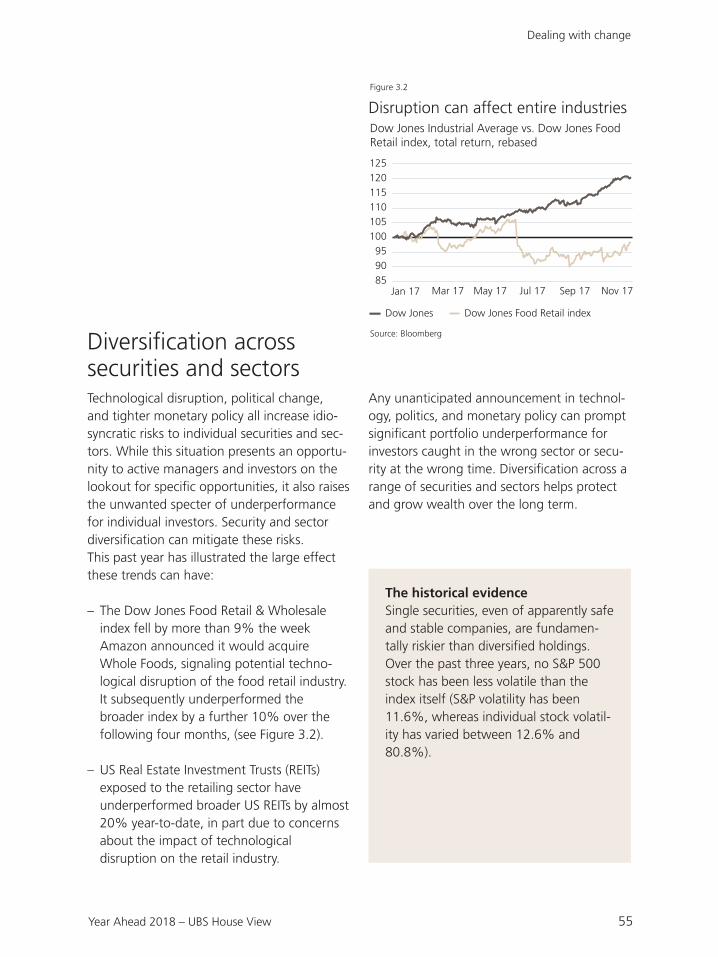
Diversi cation across securities and sectorsTechnological disruption, political change, and tighter monetary policy all increase idio-syncratic risks to individual securities and sec-tors. While this situation presents an opportu-nity to active managers and investors on the lookout for speci c opportunities, it also raises the unwanted specter of underperformance for individual investors. Security and sector diversi cation can mitigate these risks.This past year has illustrated the large e ect these trends can have:
– The Dow Jones Food Retail & Wholesale index fell by more than 9% the week Amazon announced it would acquire Whole Foods, signaling potential techno-logical disruption of the food retail industry. It subsequently underperformed the broader index by a further 10% over the following four months, (see Figure 3.2).
– US Real Estate Investment Trusts (REITs) exposed to the retailing sector have underperformed broader US REITs by almost 20% year-to-date, in part due to concerns about the impact of technological disruption on the retail industry.
Any unanticipated announcement in technol-ogy, politics, and monetary policy can prompt signi cant portfolio underperformance for investors caught in the wrong sector or secu-rity at the wrong time. Diversi cation across a range of securities and sectors helps protect and grow wealth over the long term.
Jan 17 Mar 17 May 17 Jul 17 Sep 17 Nov 17
105110115
95100
8590
120125
Disruption can affect entire industries
Source: Bloomberg
Figure 3.2
Dow Jones Industrial Average vs. Dow Jones Food Retail index, total return, rebased
Dow Jones Dow Jones Food Retail index
The historical evidenceSingle securities, even of apparently safe and stable companies, are fundamen-tally riskier than diversi ed holdings. Over the past three years, no S&P 500 stock has been less volatile than the index itself (S&P volatility has been 11.6%, whereas individual stock volatil-ity has varied between 12.6% and 80.8%).

Dealing with change
56 ubs.com/cio
Noise and distraction are traps always ready to ensnare investors. Maintaining a long-term focus is critical and can help boost even short-term performance.
Many investors live lives engulfed by noise thanks to our increasingly connected world. Things will be no di erent in the year ahead. Each of our key trends will be “noisy.” The end of easy money will bring with it numerous central bank meetings and pronouncements to analyze. Technological disruption promises new launches, mergers, and market entries. And political ux will spark reports of negotia-tions and elections, and plenty of tweets.
More information should enable investors to make better investment decisions, but too much information can also back re and lead to poor decisions.
Individuals have a natural tendency to seek out information that solidi es their views and beliefs – con rmation bias. By uninten-tionally ignoring important data, investors
base their decisions only on information that supports their existing beliefs. In addition, recency bias causes investors to in ate the importance of the latest report or gures they are privy to, and the herding instinct can result in the blind copying of what oth-ers are doing. In other words, investors may overemphasize information they already agree with, the latest media headlines, or what others are doing while disregarding fundamental analysis.
Instant access to market and portfolio data can both change an individual’s risk prefer-ences and lead to confusion between signal and noise. Investors who check their portfolio daily or weekly are, likelier than not, merely treating themselves to a lot of noise. For example, a fund with a very good information ratio (return-to-risk ratio) of 1x has a 86% probability of delivering positive performance over the course of a year. But the probability of positive performance over a given month is just 61%, and its chance of putting up a posi-tive number in a given day is just 52%, (see Figure 3.3). Whether returns are positive or negative in the short-term is largely down to
Calm

57Year Ahead 2018 – UBS House View
chance. Meanwhile, the act of checking will make investors confront losses more fre-quently, which can turn them more risk averse (and hence less able to earn returns over the long-term). This phenomenon is known as myopic loss aversion.
In addition, increased information and access to data can up the temptation to trade fre-quently. But evidence suggests that frequent trading hurts portfolios. A study by Barber and Odean (2000) found that average house-holds turned over 75% of their equity portfo-lios annually, and lost ground to a buy-and-
5 years 1 year 1 month 1 week 1 day
90
70
80
50
60
100
There is almost no useful information in daily performance
Source: UBS
Figure 3.3
Probability of a positive return for a 1x information ratio fund over a given time horizon (%)
Getty Images

Dealing with change
58 ubs.com/cio
hold strategy by 1.5% per year. Our own analysis of mutual fund investors’ buy and sell decisions indicates underperformance of 0.9% annually for core equity fund investors, compared to the performance of the fund itself, between April 2007 and March 2016. Staying calm amid the blizzard of informa-tional noise will be a key trait of successful investing in the coming year, we believe. But while awareness of the need for calm is a good start, actually behaving that way poses a greater challenge. We see three strategies private investors can use:
First, seeking out sources of information that challenge your conclusions and even your entire investing framework can help over-come con rmation and recency bias. In our investment process, we incorporate the UBS Investor Forum to allow external asset managers to challenge our views.
Second, xing regular but infrequent times to check your portfolio can reduce your exposure to noise, which might otherwise be mistaken for a signal. Provided your investment portfo-lio is well balanced, there is little to be gained from checking it too regularly.
Third, it’s crucial to remain patient and disci-plined. The start of the year is as good a time as any to carefully think through an invest-ment strategy: how to allocate strategically to ful ll goals and ambitions, how much to deviate from the long-term plan to seize un expected opportunities, how to behave in the case of drawdowns, and how frequently to rebalance. Sticking to your plan once you’ve determined it is a key part of long-term invest-ing success. The wrong strategic allocation, portfolio dri , and, most importantly, not stay-ing invested are among the main causes of wealth destruction over the long term.

US
Belmont, United States. Steven Lewis. Unsplash

US
60 ubs.com/cio
Politics, policy, and profits
The US economic expansion has now spanned 101 months, mak-ing it the third longest of the post-war era. Meanwhile, the 350% cumulative total return for the S&P 500 generated thus far during this bull market represents the third highest in history. There are many who now openly question just how much longer each can endure.
While there is no shortage of factors that will likely a ect the outcome, both the durability of the US expansion and the sustainability of the current bull market still will depend, to a large degree, on the three themes that loom large in this edition of the Year Ahead: politics, policy, and pro ts.
The emergence of threats in an increasingly fractious geopolitical landscape, coupled with a rancorous and divisive domestic politi-cal environment, represents formidable chal-lenges for elected US of cials. Meanwhile, a continued pivoting of monetary policy and prospects for more expansive scal policy alter the investment implications and reac-tion function for market participants. And, of
course, as we progress into the mature phase of the business cycle, the ability of corpora-tions to maintain pro t growth will be critical to sustaining and extending market gains. We therefore need to explore the potential interplay and impact between all three.
Political perils Seldom has politics played such a prominent role in discussions about the outlook for eco-nomic growth and nancial market returns. On the geopolitical stage, escalating tension on the Korean peninsula, ongoing Middle East unrest, a surprising crackdown on “cor-ruption” within Saudi Arabia, increasingly contentious trade negotiations, and greater assertiveness on the part of China all pose challenges for US policymakers.
The unconventional manner in which the current administration conducts foreign policy suggests that are-ups in geopolitical hot spots and/or rising trade tensions could threaten both the economic outlook and market return prospects.
But domestic political dynamics may present an even less welcome development. Recent local election results hint at a backlash against the Trump administration. While care must be taken not to over-interpret these results,
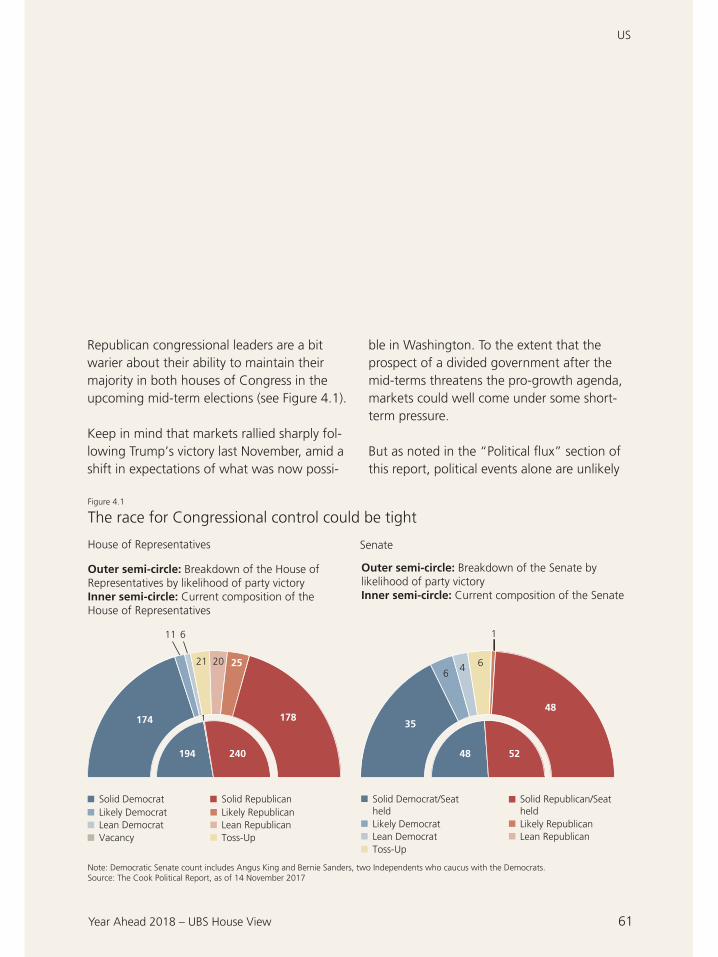
US
61Year Ahead 2018 – UBS House View
Republican congressional leaders are a bit warier about their ability to maintain their majority in both houses of Congress in the upcoming mid-term elections (see Figure 4.1).
Keep in mind that markets rallied sharply fol-lowing Trump’s victory last November, amid a shi in expectations of what was now possi-
ble in Washington. To the extent that the prospect of a divided government a er the mid-terms threatens the pro-growth agenda, markets could well come under some short-term pressure.
But as noted in the “Political ux” section of this report, political events alone are unlikely
The race for Congressional control could be tight
House of Representatives Senate
Note: Democratic Senate count includes Angus King and Bernie Sanders, two Independents who caucus with the Democrats. Source: The Cook Political Report, as of 14 November 2017
Figure 4.1
Solid DemocratLikely Democrat
Vacancy
Solid Republican
Lean Democrat Lean RepublicanLikely Republican
Outer semi-circle: Breakdown of the House of Representatives by likelihood of party victory Inner semi-circle: Current composition of the House of Representatives
Outer semi-circle: Breakdown of the Senate bylikelihood of party victoryInner semi-circle: Current composition of the Senate
Solid Democrat/SeatheldLikely DemocratLean Democrat Lean Republican
Likely Republican
Solid Republican/Seat held
Toss-Up Toss-Up
11 6 1
174
21 20 25
178
194 240 48
35
64 6
52
481

US
62 ubs.com/cio
tion of regional bank presidents, means that there could be as many as nine fresh faces among the twelve voting members of the Federal Open Market Committee. This leader-ship shi could well trigger uncertainty about the direction of monetary policy and begin to weigh on markets.
But any ratcheting up of market volatility associated with a leadership transition at the Fed is apt to prove temporary. Jay Powell, tapped by President Donald Trump to replace
to materially alter the market outlook. The US economy is showing little evidence of the sorts of imbalances and excesses that typically mark the terminal phase of the business cycle.
Just as important, the improvement in the global economy amid a somewhat more syn-chronized expansion further bolsters the US growth picture. What’s more, the executive branch will likely continue to make progress on its deregulatory push, regardless of the makeup of Congress. Should political events alter economic or market return prospects, they most likely will do so by markedly shi -ing either monetary or scal policy dynamics.
Policy inflectionsThe Federal Reserve is two years into the pro-cess of resetting interest rates, and it has also taken its rst tentative steps toward normaliz-ing its balance sheet (see Figure 4.2). All this is occurring amid the most signi cant turnover of the central bank’s leadership structure since the 1930s. In addition to a new chairman and vice chairman, three governors are likely to be appointed to ll currently vacant seats, and the replacement for outgoing New York Fed President Bill Dudley, who is retiring early, will be named.
These changes, coupled with the regular rota-
2,000,000
3,000,000
0
1,000,000
2016
2015
2014
2013
2012
2011
2010
2009
2008
2007
2017
4,000,000
5,000,000
The Fed balance sheet expandedrapidly aer the financial crisis
Source: Federal Reserve Bank of St. Louis, as of 14 November 2017
Figure 4.2
Total Fed assets, in USDmn
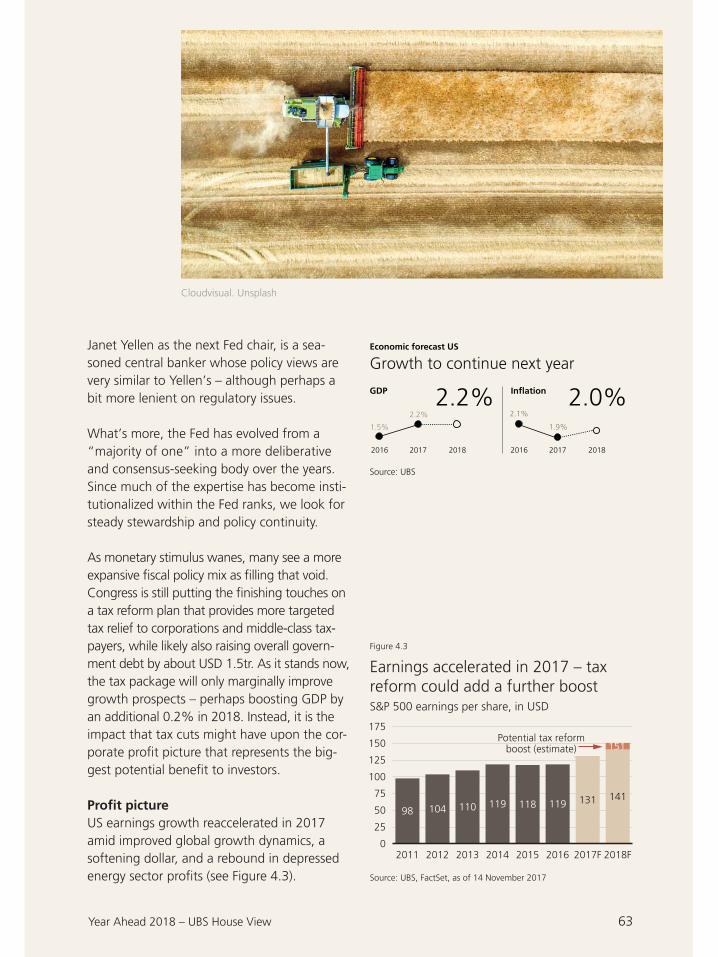
US
63Year Ahead 2018 – UBS House View
2.2%GDP
Growth to continue next year
2.2%
1.5%
2016 2017 2018
2.0%1.9%
2.1%
2016 2017 2018
Source: UBS
Janet Yellen as the next Fed chair, is a sea-soned central banker whose policy views are very similar to Yellen’s – although perhaps a bit more lenient on regulatory issues.
What’s more, the Fed has evolved from a “majority of one” into a more deliberative and consensus-seeking body over the years. Since much of the expertise has become insti-tutionalized within the Fed ranks, we look for steady stewardship and policy continuity.
As monetary stimulus wanes, many see a more expansive scal policy mix as lling that void. Congress is still putting the nishing touches on a tax reform plan that provides more targeted tax relief to corporations and middle-class tax-payers, while likely also raising overall govern-ment debt by about USD 1.5tr. As it stands now, the tax package will only marginally improve growth prospects – perhaps boosting GDP by an additional 0.2% in 2018. Instead, it is the impact that tax cuts might have upon the cor-porate pro t picture that represents the big-gest potential bene t to investors.
Profit pictureUS earnings growth reaccelerated in 2017 amid improved global growth dynamics, a so ening dollar, and a rebound in depressed energy sector pro ts (see Figure 4.3).
100
125
50
75
0
25
2011 2012 2013 2017F201620152014 2018F
150 Potential tax reformboost (estimate)
175
Earnings accelerated in 2017 – taxreform could add a further boost
Source: UBS, FactSet, as of 14 November 2017
Figure 4.3
S&P 500 earnings per share, in USD
13111911811911010498141
151
Cloudvisual. Unsplash
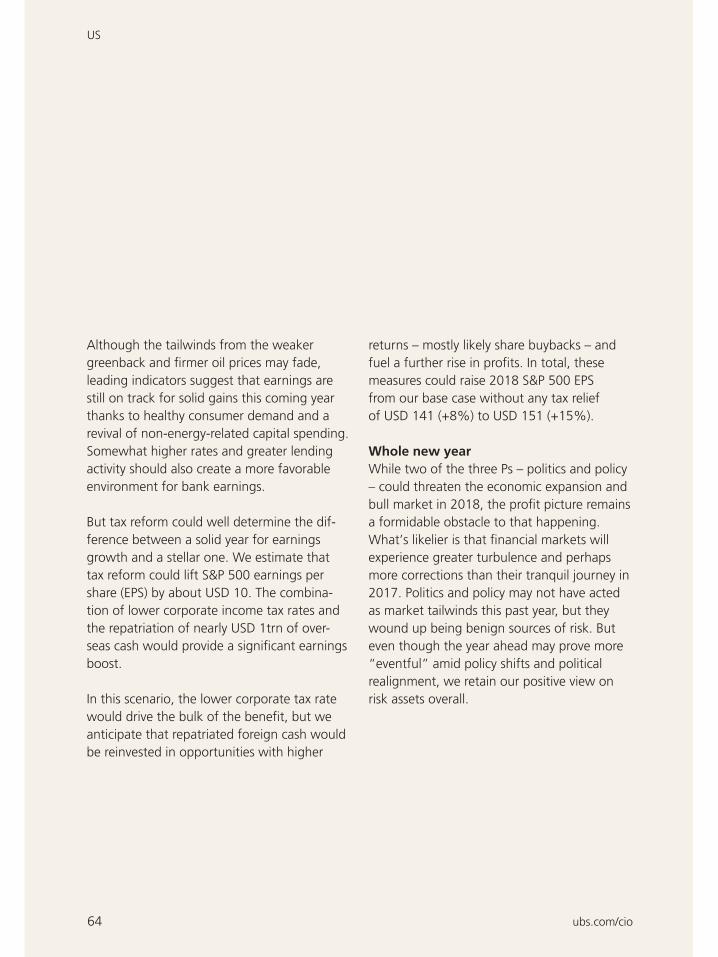
US
64 ubs.com/cio
returns – mostly likely share buybacks – and fuel a further rise in pro ts. In total, these measures could raise 2018 S&P 500 EPS from our base case without any tax relief of USD 141 (+8%) to USD 151 (+15%).
Whole new yearWhile two of the three Ps – politics and policy – could threaten the economic expansion and bull market in 2018, the pro t picture remains a formidable obstacle to that happening. What’s likelier is that nancial markets will experience greater turbulence and perhaps more corrections than their tranquil journey in 2017. Politics and policy may not have acted as market tailwinds this past year, but they wound up being benign sources of risk. But even though the year ahead may prove more “eventful” amid policy shi s and political realignment, we retain our positive view on risk assets overall.
Although the tailwinds from the weaker greenback and rmer oil prices may fade, leading indicators suggest that earnings are still on track for solid gains this coming year thanks to healthy consumer demand and a revival of non-energy-related capital spending. Somewhat higher rates and greater lending activity should also create a more favorable environment for bank earnings.
But tax reform could well determine the dif-ference between a solid year for earnings growth and a stellar one. We estimate that tax reform could li S&P 500 earnings per share (EPS) by about USD 10. The combina-tion of lower corporate income tax rates and the repatriation of nearly USD 1trn of over-seas cash would provide a signi cant earnings boost.
In this scenario, the lower corporate tax rate would drive the bulk of the bene t, but we anticipate that repatriated foreign cash would be reinvested in opportunities with higher
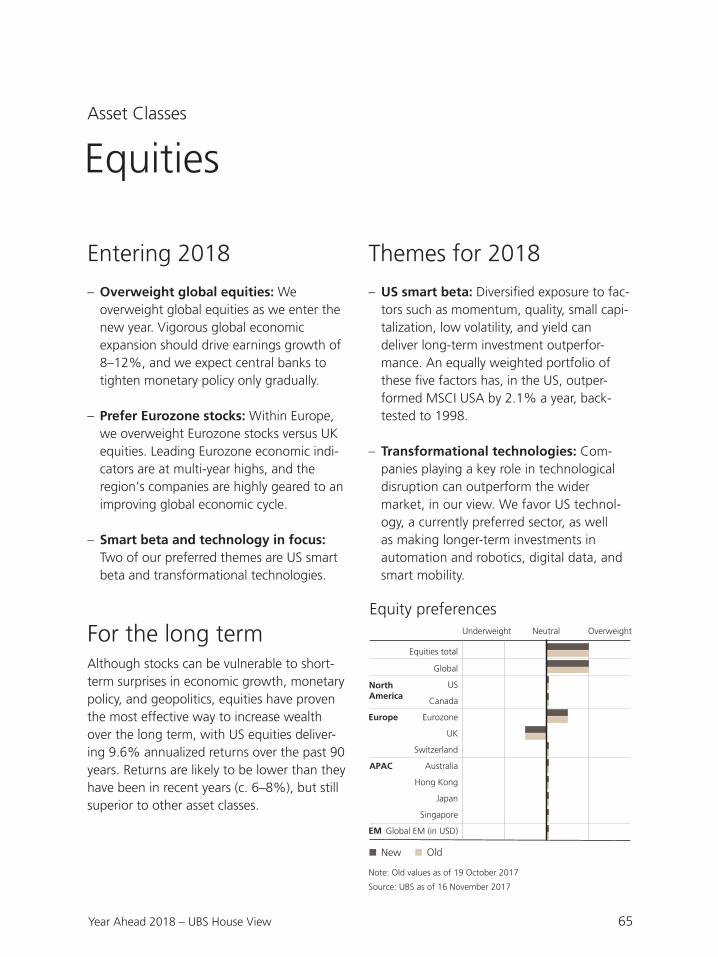
65Year Ahead 2018 – UBS House View
Equities
Entering 2018
– Overweight global equities: We overweight global equities as we enter the new year. Vigorous global economic expansion should drive earnings growth of 8–12%, and we expect central banks to tighten monetary policy only gradually.
– Prefer Eurozone stocks: Within Europe, we overweight Eurozone stocks versus UK equities. Leading Eurozone economic indi-cators are at multi-year highs, and the region’s companies are highly geared to an improving global economic cycle.
– Smart beta and technology in focus: Two of our preferred themes are US smart beta and transformational technologies.
For the long termAlthough stocks can be vulnerable to short-term surprises in economic growth, monetary policy, and geopolitics, equities have proven the most e ective way to increase wealth over the long term, with US equities deliver-ing 9.6% annualized returns over the past 90 years. Returns are likely to be lower than they have been in recent years (c. 6–8%), but still superior to other asset classes.
Themes for 2018
– US smart beta: Diversi ed exposure to fac-tors such as momentum, quality, small capi-talization, low volatility, and yield can deliver long-term investment outperfor-mance. An equally weighted portfolio of these ve factors has, in the US, outper-formed MSCI USA by 2.1% a year, back-tested to 1998.
– Transformational technologies: Com-panies playing a key role in technological disruption can outperform the wider market, in our view. We favor US technol-ogy, a currently preferred sector, as well as making longer-term investments in automation and robotics, digital data, and smart mobility.
Equity preferences
New Old
Underweight Neutral Overweight
Equities total
Global
US
Canada
Eurozone
UK
Switzerland
Australia
Hong Kong
Japan
Singapore
Global EM (in USD)
North America
Europe
APAC
EM
Note: Old values as of 19 October 2017
Source: UBS as of 16 November 2017
Asset Classes
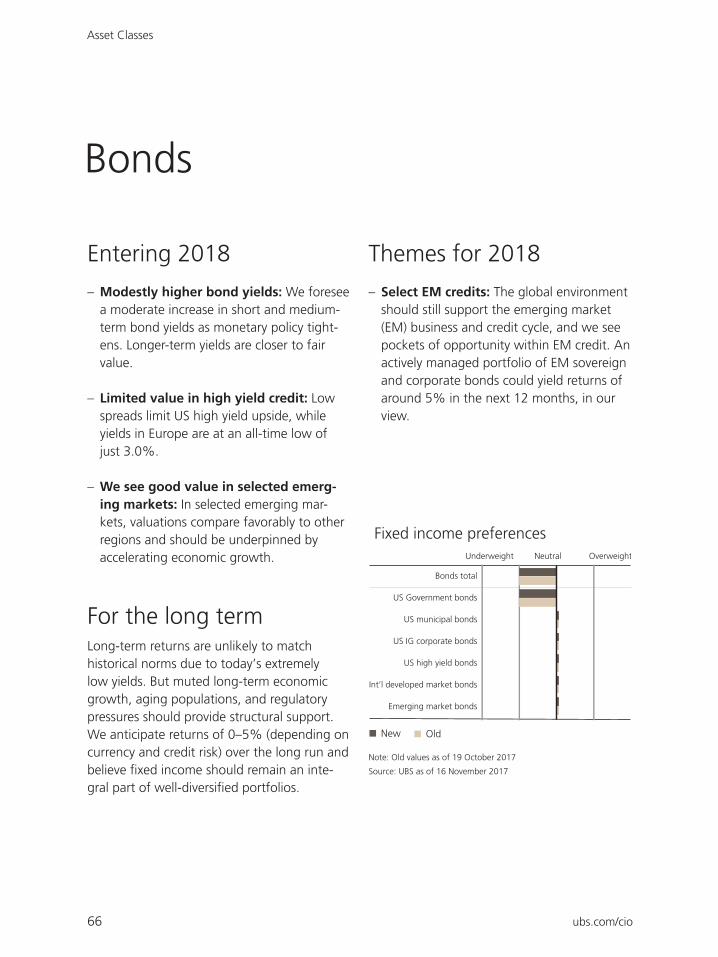
Asset Classes
66 ubs.com/cio
Bonds
Entering 2018
– Modestly higher bond yields: We foresee a moderate increase in short and medium-term bond yields as monetary policy tight-ens. Longer-term yields are closer to fair value.
– Limited value in high yield credit: Low spreads limit US high yield upside, while yields in Europe are at an all-time low of just 3.0%.
– We see good value in selected emerg-ing markets: In selected emerging mar-kets, valuations compare favorably to other regions and should be underpinned by accelerating economic growth.
For the long termLong-term returns are unlikely to match historical norms due to today’s extremely low yields. But muted long-term economic growth, aging populations, and regulatory pressures should provide structural support. We anticipate returns of 0–5% (depending on currency and credit risk) over the long run and believe xed income should remain an inte-gral part of well-diversi ed portfolios.
Themes for 2018
– Select EM credits: The global environment should still support the emerging market (EM) business and credit cycle, and we see pockets of opportunity within EM credit. An actively managed portfolio of EM sovereign and corporate bonds could yield returns of around 5% in the next 12 months, in our view.
Fixed income preferences
New Old
Underweight Neutral Overweight
Bonds total
US Government bonds
US municipal bonds
US IG corporate bonds
US high yield bonds
Emerging market bonds
Int’l developed market bonds
Note: Old values as of 19 October 2017
Source: UBS as of 16 November 2017
Asset Classes
67Year Ahead 2018 – UBS House View
Alternatives
Entering 2018
– Low correlation should enable alpha generation: Correlations between stocks in the S&P 500 are at a decade-long low, and we believe the end of easy money is likely to keep them there. Low intra-stock correla-tions have historically spurred alpha genera-tion.
– Valuation dispersion creates mean-reversion opportunities: Although the dispersion between stocks is still low, high valuation dispersion means that it could rise if markets begin to focus on relative valua-tions.
– Well-positioned for tighter policy: Hedge funds have historically outperformed other asset classes during periods of tight-ening monetary policy.
For the long term
We believe investors with a higher illiquidity tolerance could allocate up to 30% to non-traditional markets as a whole. Adding hedge funds can help improve the returns and lessen the volatility of an equity-bond-only portfolio. We also expect private markets to earn supe-rior returns to public markets over the long term due to illiquidity premia. Diversi cation across managers and styles is key to stabilizing returns and reducing single-manager risk.
Highest convictionWe continue to recommend strategies that follow di erentiated investment approach with low directionality and that seek to gener-ate returns uncorrelated to those of tradi-tional markets. Meanwhile we also see value in selected equity event driven strategies.
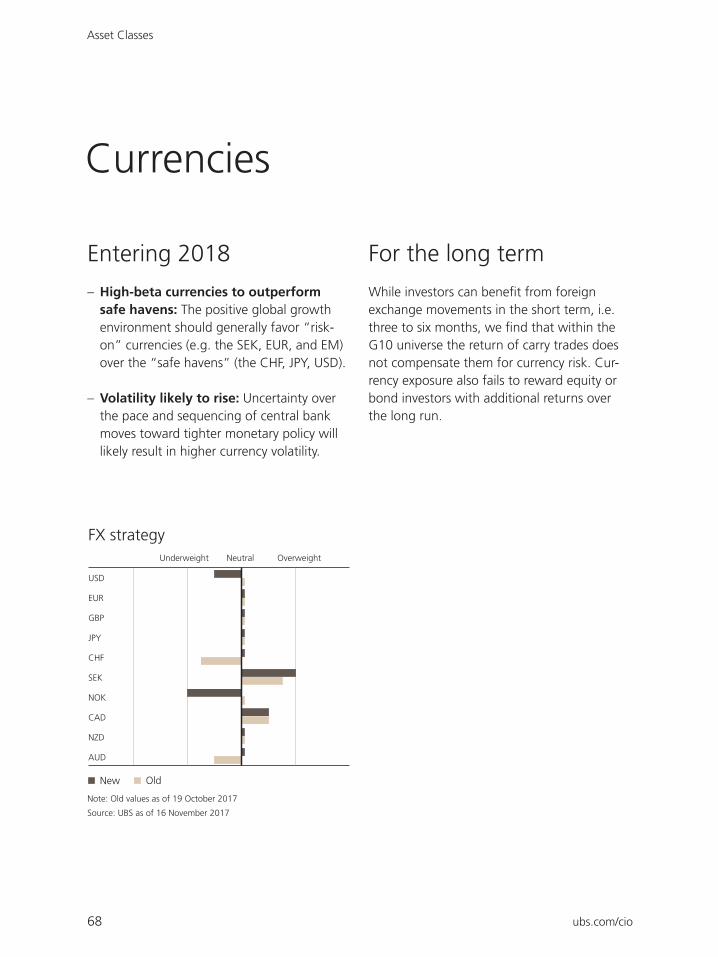
Asset Classes
68 ubs.com/cio
Currencies
Entering 2018
– High-beta currencies to outperform safe havens: The positive global growth environment should generally favor “risk-on” currencies (e.g. the SEK, EUR, and EM) over the “safe havens” (the CHF, JPY, USD).
– Volatility likely to rise: Uncertainty over the pace and sequencing of central bank moves toward tighter monetary policy will likely result in higher currency volatility.
New Old
Underweight Neutral Overweight
USD
EUR
GBP
JPY
CHF
SEK
NOK
CAD
NZD
AUD
FX strategy
Note: Old values as of 19 October 2017
Source: UBS as of 16 November 2017
For the long term
While investors can bene t from foreign exchange movements in the short term, i.e. three to six months, we nd that within the G10 universe the return of carry trades does not compensate them for currency risk. Cur-rency exposure also fails to reward equity or bond investors with additional returns over the long run.
Asset Classes
69Year Ahead 2018 – UBS House View
Highest convictions
Within our FX strategy, we enter the new year with two open positions:
– Overweight SEK versus NOK: The Swedish krona is our top pick over the next 12 months. Sweden’s vigorous economic growth and rising inflation should lead to rate hikes that support the SEK. Meanwhile, we believe Norway’s weak housing market and falling inflation mean rates there will remain on hold, and negatively affect the NOK.
– Overweight CAD versus USD: We are positive on the Canadian dollar. We see the Bank of Canada at least matching the US Federal Reserve’s pace of rate hikes, given Canada’s robust growth and rising wages. Current real swap spreads indicate that the CAD should trade stronger, and we also consider it undervalued relative to the US dollar on purchasing power parity.
Currency-by-currency views
– US dollar: We foresee the greenback trading moderately weaker next year. Tax reforms provide some near-term potential support, but longer term the twin US current account and fiscal deficits are likely to hurt the currency.
– Euro: Solid Eurozone growth, rising trust in the European Central Bank’s ability to manage political risks, a high and rising current account surplus, and only moderate US rate hikes should underpin the euro through the coming year and beyond.
– Swiss franc: We expect the franc to weaken moderately against the euro, as stronger global growth reduces the demand for the safe-haven currency.
– British pound: The pound will remain flat against the dollar, in our view, while weakening against the euro. The recent UK interest rate hike should bolster sterling in the near term, but a sputtering economy and Brexit uncertainty are longer-term drags.
– Japanese yen: The Bank of Japan could end the coming year as the only central bank still engaged in quantitative easing, which suggests a weaker yen. The extent of yen downside will depend on the pace of US rate hikes.
Asset Classes
70 ubs.com/cio
Commodities
Entering 2018
– A good start: Vigorous global economic activity across all regions should buoy com-modity demand and prices in the rst half of the year. Demand growth for oil is above trend, and reduced industrial metals output in China should underpin prices.
– We expect rst-half gains to evaporate by year-end. Greater demand for oil is likely to be more than o set by increased output in the Americas and from OPEC in the second half.
For the long termWe do not hold an allocation to commodities in our strategic asset allocation since diversi-
ed commodity indexes have failed to suf -ciently compensate investors for their volatility over the long run.
Highest convictionFirm demand growth and ongoing supply challenges should support higher copper and aluminum prices in 2018. Aluminum produc-tion closures in China have the potential to tighten the market particularly rmly. Mean-while, gold and silver prices should be sup-ported by a weaker USD and renewed in a-tion pressure. Negative real rates in the US favor higher precious metal prices.
Commodity-by- commodity
– Oil: We expect oil prices to peak early in the year. While demand growth remains above trend, it will be more than offset by increased output in the Americas and from OPEC in the second half of the year. We forecast Brent at USD 57/bbl in 12 months.
– Industrial metals: Reduced output in China and greater industrial demand should lift industrial metal prices. Since supply curbs affect some metals more than others, outcomes will vary.
– Gold: Monetary tightening and global growth will challenge gold prices. But geopolitical uncertainty, higher inflation, and a weaker dollar should underpin demand, particularly in 2H18. We fore cast the gold price at USD 1,325/oz. in 12 months.
– Agriculture: We believe agriculture prices are bottoming out. Inventory-to-consumption ratios have peaked, in our estimate, and we think weather risks have risen alongside the increased likelihood of a La Ni a event.

71Year Ahead 2018 – UBS House View
Economic forecasts
GDP growth (%)
2016 2017E 2018E 2019E 2016 2017E 2018E 2019E
Americas
US 1.5 2.2 2.2 2.3 2.1 1.9 2.0 2.3
Brazil –3.6 0.5 3.1 2.7 6.3 3.1 3.7 4.2
Canada 1.5 3.6 2.5 2.3 1.5 1.3 2.1 2.2
Europe
Eurozone 1.8 2.3 1.9 1.7 1.1 1.1 1.6 1.6
– Germany 1.9 2.2 1.9 1.6 1.7 1.1 2.0 1.7
– France 1.1 1.8 1.8 1.6 0.8 1.0 1.6 1.5
– Italy 1.1 1.5 1.3 1.0 0.5 0.8 1.4 1.2
– Spain 3.3 3.1 2.3 1.9 1.4 0.9 1.4 1.5
UK 1.8 1.5 1.1 1.1 1.2 3.0 2.5 2.1
Russia –0.2 1.9 1.7 1.8 5.4 3.0 4.2 4.0
Switzerland 1.4 0.8 1.8 1.8 –0.4 0.5 0.6 0.9
Asia
China 6.7 6.8 6.4 6.3 2.1 1.5 2.2 1.9
Japan 1.0 1.8 1.8 1.1 0.1 0.8 1.5 3.4
India 7.1 6.6 7.4 7.7 3.6 4.4 4.0 4.2
South Korea 2.8 3.0 3.0 3.0 1.3 2.0 2.1 2.8
Advanced economies 1.6 2.2 2.1 2.0 1.4 1.5 1.9 2.2
Emerging markets 4.4 5.1 5.2 5.3 3.9 3.3 3.4 3.2
World 3.1 3.8 3.8 3.8 2.8 2.5 2.7 2.8
Note: In ation data based on 4Q/4Q % change. GDP data based on annual % change. See appendix for additional information on CIO economic forecasts.
Source: UBS, as of 20 November 2017
Rates and bonds
Base rates 10-year yields (%)
Current End-2017 End-2018 Current 6m 12m
USD 1.00–1.25 1.25–1.50 1.75–2.00 2.36 2.50 2.50
EUR –0.40 –0.40 –0.40 0.36 0.60 0.70
CHF –0.75 –0.75 –0.50 –0.16 0.00 0.10
GBP 0.50 0.50 0.50 1.29 1.50 1.70
JPY –0.05 –0.05 –0.05 0.03 0.15 0.20
Source: UBS, as of 21 November 2017

Economic forecast
72 ubs.com/cio
Commodities
Spot 6 month 12 month
Brent crude oil (USD/bbl) 62.0 57.0 57.0
WTI crude oil (USD/bbl) 56.2 53.0 53.0
Gold (USD/oz) 1,288 1,250 1,325
Silver (USD/oz) 17.0 17.5 18.5
Copper (USD/mt) 6,777 7,100 7,100
Source: UBS, as of 20 November 2017
CurrenciesDeveloped market
Spot 6 month 12 month PPP
EURUSD 1.18 1.22 1.25 1.26
USDJPY 112 115 115 76
GBPUSD 1.32 1.36 1.36 1.59
USDCHF 0.99 0.97 0.95 0.96
EURCHF 1.17 1.18 1.19 1.21
EURGBP 0.89 0.90 0.92 0.80
AUDUSD 0.76 0.79 0.79 0.70
USDCAD 1.28 1.20 1.20 1.19
EURSEK 9.97 9.20 9.20 9.06
EURNOK 9.75 9.60 9.80 9.95
Source: UBS, as of 20 November 2017
Emerging market
Spot 6 month 12 month
USDCNY 6.64 6.55 6.50
USDIDR 13,529 13,500 13,500
USDINR 65.00 64.00 64.00
USDKRW 1,100 1,080 1,060
USDRUB 59.40 58.00 55.00
USDTRY 3.90 3.60 3.80
USDBRL 3.26 3.00 2.90
USDMXN 19.00 18.50 19.00
Source: UBS, as of 20 November 2017
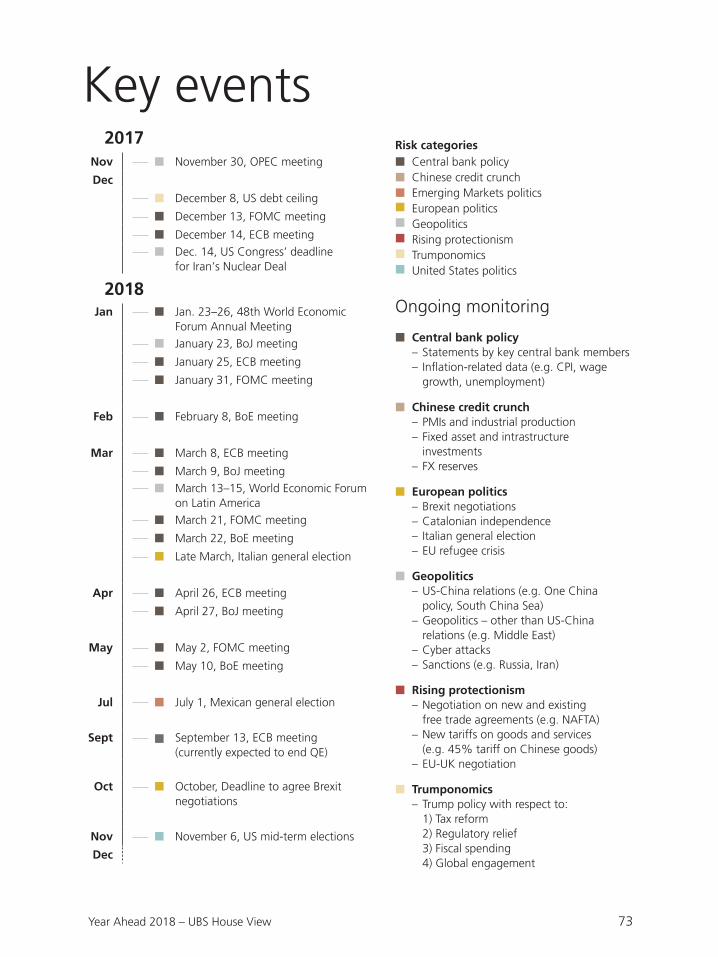
73Year Ahead 2018 – UBS House View
Key events2017
Nov November 30, OPEC meeting
Dec
December 8, US debt ceiling
December 13, FOMC meeting
December 14, ECB meeting
Dec. 14, US Congress’ deadline for Iran’s Nuclear Deal
2018Jan Jan. 23–26, 48th World Economic
Forum Annual Meeting
January 23, BoJ meeting
January 25, ECB meeting
January 31, FOMC meeting
Feb February 8, BoE meeting
Mar March 8, ECB meeting
March 9, BoJ meeting
March 13–15, World Economic Forum on Latin America
March 21, FOMC meeting
March 22, BoE meeting
Late March, Italian general election
Apr April 26, ECB meeting
April 27, BoJ meeting
May May 2, FOMC meeting
May 10, BoE meeting
Jul July 1, Mexican general election
Sept September 13, ECB meeting (currently expected to end QE)
Oct October, Deadline to agree Brexit negotiations
Nov November 6, US mid-term elections
Dec
Risk categoriesCentral bank policyChinese credit crunchEmerging Markets politicsEuropean politicsGeopoliticsRising protectionismTrumponomicsUnited States politics
Ongoing monitoring
Central bank policy– Statements by key central bank members– In ation-related data (e.g. CPI, wage
growth, unemployment)
Chinese credit crunch– PMIs and industrial production– Fixed asset and intrastructure
investments– FX reserves
European politics– Brexit negotiations– Catalonian independence– Italian general election– EU refugee crisis
Geopolitics– US-China relations (e.g. One China
policy, South China Sea)– Geopolitics – other than US-China
relations (e.g. Middle East)– Cyber attacks– Sanctions (e.g. Russia, Iran)
Rising protectionism– Negotiation on new and existing
free trade agreements (e.g. NAFTA)– New tari s on goods and services
(e.g. 45% tari on Chinese goods)– EU-UK negotiation
Trumponomics– Trump policy with respect to: 1) Tax reform 2) Regulatory relief 3) Fiscal spending 4) Global engagement

74 ubs.com/cio
Publication details
Year Ahead 2018 – UBS House ViewThis report has been prepared by UBS AG, UBS Switzerland AG and UBS Financial Services Inc. (”UBS FS”).
Editor-in-chiefKiran Ganesh
EditorTom GundyRussell Comer
Design/Desktop PublishingCIO Content Design
Editorial deadline21 November 2017

Disclaimer
This report contains statements that constitute “forward-looking statements,” including but not limited to state-ments relating to the current and expected state of the secu-rities market and capital market assumptions. While these forward-looking statements represent our judgments and future expectations concerning the matters discussed in this document, a number of risks, uncertainties, changes in the market, and other important factors could cause actual developments and results to di er materially from our expectations. These factors include, but are not limited to (1) the extent and nature of future developments in the US
Sources of strategic asset allocations and investor risk
Strategic asset allocations represent the longer-term alloca-tion of assets that is deemed suitable for a particular inves-tor.
The strategic asset allocations are provided for illustrative purposes only for hypothetical US investors. In general, stra-tegic asset allocations will di er among investors according to their individual circumstances, risk tolerance, return objectives and time horizon. Therefore, the strategic asset allocations in this publication may not be suitable for all investors or investment goals and should not be used as the sole basis of any investment decision. Minimum net worth requirements may apply to allocations to non-traditional assets. As always, please consult your UBS Financial Advisor
market and in other market segments; (2) other market and macro-economic developments, including movements in local and international securities markets, credit spreads, currency exchange rates and interest rates, whether or not arising directly or indirectly from the current market crisis; (3) the impact of these developments on other markets and asset classes. UBS is not under any obligation to (and expressly disclaims any such obligation to) update or alter its forward-looking statements whether as a result of new information, future events, or otherwise.
to see how these weightings should be applied or modi ed according to your individual pro le and investment goals.
Deviations from strategic asset allocation or bench-mark allocationThe recommended tactical deviations from the strategic asset allocation or benchmark allocation re ect the short- to medium-term assessment of market opportunities and risks. Positive/zero/negative tactical deviations correspond to an overweight/neutral/underweight stance for each respective asset class and market segment relative to their strategic allocation.
Asset allocation does not assure pro ts or prevent against losses from an investment portfolio or accounts in a declin-ing market.
Cautionary statement regarding forward-looking statements
Explanations about asset classess
Equities - Stock market returns are dif cult to forecast because of uctuations in the economy, investor psychology, geopolitical conditions and other important variables.
Fixed income - Bond market returns are dif cult to forecast because of uctuations in the economy, investor psychology, geopolitical conditions and other important variables. Cor-porate bonds are subject to a number of risks, including credit risk, interest rate risk, liquidity risk, and event risk. Though historical default rates are low on investment grade corporate bonds, perceived adverse changes in the credit quality of an issuer may negatively a ect the market value of securities. As interest rates rise, the value of a xed coupon security will likely decline. Bonds are subject to market value uctuations, given changes in the level of risk-free interest
rates. Not all bonds can be sold quickly or easily on the open market. Prospective investors should consult their tax advi-sors concerning the federal, state, local, and non-U.S. tax consequences of owning any securities referenced in this report.
Preferred securities - Prospective investors should consult their tax advisors concerning the federal, state, local, and non-U.S. tax consequences of owning preferred stocks. Pre-ferred stocks are subject to market value uctuations, given
Emerging Market InvestmentsInvestors should be aware that Emerging Market assets are subject to, among others, potential risks linked to currency volatility, abrupt changes in the cost of capital and the eco-nomic growth outlook, as well as regulatory and sociopoliti-cal risk, interest rate risk and higher credit risk. Assets can sometimes be very illiquid and liquidity conditions can abruptly worsen. CIO Americas, WM generally recommends
changes in the level of interest rates. For example, if interest rates rise, the value of these securities could decline. If pre-ferred stocks are sold prior to maturity, price and yield may vary. Adverse changes in the credit quality of the issuer may negatively a ect the market value of the securities. Most preferred securities may be redeemed at par a er ve years. If this occurs, holders of the securities may be faced with a reinvestment decision at lower future rates. Preferred stocks are also subject to other risks, including illiquidity and cer-tain special redemption provisions.
Municipal bonds - Although historical default rates are very low, all municipal bonds carry credit risk, with the degree of risk largely following the particular bond’s sector. Addition-ally, all municipal bonds feature valuation, return, and liquid-ity risk. Valuation tends to follow internal and external fac-tors, including the level of interest rates, bond ratings, supply factors, and media reporting. These can be dif cult or impossible to project accurately. Also, most municipal bonds are callable and/or subject to earlier than expected redemption, which can reduce an investor’s total return. Because of the large number of municipal issuers and credit structures, not all bonds can be easily or quickly sold on the open market.
only those securities it believes have been registered under Federal US registration rules (Section 12 of the Securities Exchange Act of 1934) and individual State registration rules (commonly known as “Blue Sky” laws). Prospective inves-tors should be aware that to the extent permitted under US law, CIO Americas, WM may from time to time recommend bonds that are not registered under US or State securities laws. These bonds may be issued in jurisdictions where the
Statement of risk
Appendix
Scale for tactical deviation charts
Symbol Symbol Symbol
+ moderate overweight vs. benchmark – moderate underweight vs. benchmark n neutral, i.e., on benchmark
++ overweight vs. benchmark – – underweight vs. benchmark n/a not applicable
+++ strong overweight vs. benchmark – – – strong underweight vs. benchmark
Source: UBS
• Hedge Fund Risk: There are risks speci cally associated with investing in hedge funds, which may include risks asso-ciated with investing in short sales, options, small-cap stocks, “junk bonds,” derivatives, distressed securities, non-US securities and illiquid investments.• Managed Futures: There are risks speci cally associated with investing in managed futures programs. For example, not all managers focus on all strategies at all times, and managed futures strategies may have material directional elements.• Real Estate: There are risks speci cally associated with investing in real estate products and real estate investment trusts. They involve risks associated with debt, adverse changes in general economic or local market conditions, changes in governmental, tax, real estate and zoning laws or regulations, risks associated with capital calls and, for some real estate products, the risks associated with the ability to qualify for favorable treatment under the federal tax laws.• Private Equity: There are risks speci cally associated with investing in private equity. Capital calls can be made on short notice, and the failure to meet capital calls can result in signi cant adverse consequences including, but not lim-ited to, a total loss of investment.• Foreign Exchange/Currency Risk: Investors in securi-ties of issuers located outside of the United States should be aware that even for securities denominated in US dollars, changes in the exchange rate between the US dollar and the issuer’s “home” currency can have unexpected e ects on the market value and liquidity of those securities. Those securities may also be a ected by other risks (such as politi-cal, economic or regulatory changes) that may not be readily known to a US investor.
Economic forecastsIn developing the CIO economic forecasts, CIO economists work in collaboration with economists employed by UBS Investment Research. Forecasts and estimates are current only as of the date of this publication, and may change with-out notice.
Nobel perspectivesThese sections contain views of third parties ad do not nec-essarily re ect those of UBS.
level of required disclosures to be made by issuers is not as frequent or complete as that required by US laws.
For more background on emerging markets generally, see the CIO Americas, WM Education Notes “Investing in Emerging Markets (Part 1): Equities,” 27 August 2007, “Emerging Market Bonds: Understanding Emerging Market Bonds,” 12 August 2009 and “Emerging Markets Bonds: Understanding Sovereign Risk,” 17 December 2009.
Investors interested in holding bonds for a longer period are advised to select the bonds of those sovereigns with the highest credit ratings (in the investment-grade band). Such an approach should decrease the risk that an investor could end up holding bonds on which the sovereign has defaulted. Subinvestment-grade bonds are recommended only for cli-ents with a higher risk tolerance and who seek to hold higher-yielding bonds for shorter periods only.
Nontraditional AssetsNontraditional asset classes are alternative invest-ments that include hedge funds, private equity, real estate, and managed futures (collectively, alternative investments). Interests of alternative investment funds are sold only to quali ed investors, and only by means of o er-ing documents that include information about the risks, performance and expenses of alternative investment funds, and which clients are urged to read carefully before sub-scribing and retain. An investment in an alternative invest-ment fund is speculative and involves signi cant risks. Spe-ci cally, these investments (1) are not mutual funds and are not subject to the same regulatory requirements as mutual funds; (2) may have performance that is volatile, and inves-tors may lose all or a substantial amount of their investment; (3) may engage in leverage and other speculative investment practices that may increase the risk of investment loss; (4) are long-term, illiquid investments; there is generally no sec-ondary market for the interests of a fund, and none is expected to develop; (5) interests of alternative investment funds typically will be illiquid and subject to restrictions on transfer; (6) may not be required to provide periodic pricing or valuation information to investors; (7) generally involve complex tax strategies and there may be delays in distribut-ing tax information to investors; (8) are subject to high fees, including management fees and other fees and expenses, all of which will reduce pro ts.
Interests in alternative investment funds are not deposits or obligations of, or guaranteed or endorsed by, any bank or other insured depository institution, and are not federally insured by the Federal Deposit Insurance Corporation, the Federal Reserve Board, or any other governmental agency. Prospective investors should understand these risks and have the nancial ability and willingness to accept them for an extended period of time before making an investment in an alternative investment fund, and should consider an alternative investment fund as a supplement to an overall investment program.
In addition to the risks that apply to alternative investments generally, the following are additional risks related to an investment in these strategies:
Research publications from Chief Investment Of ce Americas, Wealth Management, formerly known as CIO Wealth Manage-ment Research, are published by UBS Wealth Management and UBS Wealth Management Americas, Business Divisions of UBS AG or an af liate thereof (collectively, UBS). In certain countries UBS AG is referred to as UBS SA. This publication is for your information only and is not intended as an o er, or a solicitation of an o er, to buy or sell any investment or other speci c product. The analysis contained herein does not constitute a personal recommendation or take into account the particular investment objectives, investment strategies,
nancial situation and needs of any speci c recipient. It is based on numerous assumptions. Di erent assumptions could result in materially di erent results. We recommend that you obtain nancial and/or tax advice as to the implications (includ-ing tax) of investing in the manner described or in any of the products mentioned herein. Certain services and products are subject to legal restrictions and cannot be o ered world-wide on an unrestricted basis and/or may not be eligible for sale to all investors. All information and opinions expressed in this document were obtained from sources believed to be reliable and in good faith, but no representation or warranty, express or implied, is made as to its accuracy or completeness (other than disclosures relating to UBS). All information and opinions as well as any prices indicated are current only as of the dateof this report, and are subject to change without notice. Opinions expressed herein may di er or be contrary to thoseexpressed by other business areas or divisions of UBS as a result of using di erent assumptions and/or criteria. At any time, investment decisions (including whether to buy, sell or hold securities) made by UBS and its employees may di er from or be contrary to the opinions expressed in UBS research publications. Some investments may not be readily realizable since the market in the securities is illiquid and therefore valu-ing the investment and identifying the risk to which you are exposed may be dif cult to quantify. UBS relies on information barriers to control the ow of information contained in one or more areas within UBS, into other areas, units, divisions or af liates of UBS. Futures and options trading is considered risky. Past performance of an investment is no guarantee for
its future performance. Some investments may be subject to sudden and large falls in value and on realization you may receive back less than you invested or may be required to pay more. Changes in FX rates may have an adverse e ect on the price, value or income of an investment. This report is for distribution only under such circumstances as may be permitted by applicable law. Distributed to US persons by UBS Financial Services Inc. or UBS Securities LLC, subsidiaries of UBS AG. UBS Switzerland AG, UBS Deutschland AG, UBS Bank, S.A., UBS Brasil Administra-dora de Valores Mobiliarios Ltda, UBS Asesores Mexico, S.A. de C.V., UBS Securities Japan Co., Ltd, UBS Wealth Manage-ment Israel Ltd and UBS Menkul Degerler AS are af liates of UBS AG. UBS Financial Services Incorporated of PuertoRico is a subsidiary of UBS Financial Services Inc. UBS Financial Services Inc. accepts responsibility for the content of a report prepared by a non-US af liate when it distributes reports to US persons. All transactions by a US person in the securities mentioned in this report should be e ected through a US-registered broker dealer af liated with UBS, and not through a non-US af liate. The contents of this report have not been and will not be approved by any securities or investment authority in the United States or elsewhere. UBS Financial Services Inc. is not acting as a municipal advisor to any municipal entity or obligated person within the meaning of Section 15B of the Securities Exchange Act (the “Municipal Advisor Rule”) and the opinions or views contained herein are not intended to be, and do not constitute, advice within the meaning of the Municipal Advisor Rule.
UBS speci cally prohibits the redistribution or reproduction of this material in whole or in part without the prior written permission of UBS and UBS accepts no liability whatsoever for the actions of third parties in this respect.
Version as per May 2017.
UBS 2017. The key symbol and UBS are among the regis-tered and unregistered trademarks of UBS. All rights reserved.
Disclaimer


ab