yazdani - microbiome species data exploration
TRANSCRIPT

8/12/14, 1:58 PMMicrobiome Species Data Exploration
Page 1 of 23file:///Users/myazdaniUCSD/Documents/microbiome/july29/index.html#1
Microbiome Species Data ExplorationMicrobiome Species Data ExplorationUnsupervised and Supervised Approach
Mehrdad YazdaniAugust 12, 2014

8/12/14, 1:58 PMMicrobiome Species Data Exploration
Page 2 of 23file:///Users/myazdaniUCSD/Documents/microbiome/july29/index.html#1
Outline1. Properties of data set
2. Unsupervised Analysis
3. Supervised Analysis
2/23

8/12/14, 1:58 PMMicrobiome Species Data Exploration
Page 3 of 23file:///Users/myazdaniUCSD/Documents/microbiome/july29/index.html#1
Where does this data come from?The data originates from stool samples from the NIH Human Microbiome Project and ProfessorLarry Smarr. The NIH HMP has healthy and sick subjects.
Here we focus on different population of species.
3/23
8/12/14, 1:58 PMMicrobiome Species Data Exploration
Page 4 of 23file:///Users/myazdaniUCSD/Documents/microbiome/july29/index.html#1
Properties of Species Data SetThe data shows the different compositions of different species for each subject. Hence, it hasthe properties of a compositional data set:
1. For each subject, the composition of a specific species is greater than 0.0 and less than 1.0
2. The composition of all species for a single subject must sum to 1.0
In our data, the number of species are:
The number of subjects are:
Note that we have far more species than subjects in this data set.
## [1] 2572
## [1] 249
4/23

8/12/14, 1:58 PMMicrobiome Species Data Exploration
Page 5 of 23file:///Users/myazdaniUCSD/Documents/microbiome/july29/index.html#1
Species Compositions for Each SubjectThe composition of the species for each subject must sum to 1.0, however this is not the casefor this data set:
Possible reason: numerical "round-off"" errors introduce this discrepancy.
5/23

8/12/14, 1:58 PMMicrobiome Species Data Exploration
Page 6 of 23file:///Users/myazdaniUCSD/Documents/microbiome/july29/index.html#1
ZerosZeros must be handled carefully. There are two classes of zeros in compositional data sets:
1. Absolute zeros: indicate that the species should be removed
2. Round-off zeros: indicates that the amount of species was below threshold of detection
Absolute zeros are dealt with by removing them. Round-off zeros are trickier and are typicallyreplaced with "small" values (imputation tricks).
6/23

8/12/14, 1:58 PMMicrobiome Species Data Exploration
Page 7 of 23file:///Users/myazdaniUCSD/Documents/microbiome/july29/index.html#1
Number of Absolute ZerosThe number of species that are always zero for all subjects is:
We will treat these species as being absolute zeros and remove them from the data:
## [1] 29
## [1] "Marinilabilia sp. AK2"
## [2] "Desulfovibrio piezophilus"
## [3] "Streptomyces bottropensis"
## [4] "Novosphingobium sp. AP12"
## [5] "Acinetobacter sp. NCTC 7422"
## [6] "Caldisphaera lagunensis"
## [7] "Streptomyces auratus"
## [8] "Candidatus Arthromitus sp. SFB-1"
## [9] "Gillisia sp. CBA3202"
## [10] "Thielavia terrestris"
## [11] "Synechococcus sp. PCC 6312"
## [12] "Alcaligenes faecalis"
## [13] "Aspergillus fumigatus" 7/23

8/12/14, 1:58 PMMicrobiome Species Data Exploration
Page 8 of 23file:///Users/myazdaniUCSD/Documents/microbiome/july29/index.html#1
Number of Round-off ZerosAfter removing absolute zeros, we observe that there are also a large number of zeros fromround-off errors:
Since the compositions do not sum to 1.0, we replace these round-off zeros with values so thatour data is a true compositional data set.
8/23

8/12/14, 1:58 PMMicrobiome Species Data Exploration
Page 9 of 23file:///Users/myazdaniUCSD/Documents/microbiome/july29/index.html#1
Recall that we are dealing with compositions1. For each subject, the composition of a specific species is greater than 0.0 and less than 1.0
2. The composition of all species for a single subject must sum to 1.0
Because of these constraints, the usual algebra of additions, multiplications, etc. that we areused to does not apply. Typically, a transformation function is applied to the composition sothat we can apply the usual Euclidean algebra. There are many possible transformationfunctions used.
Here we apply the log transformation on compositions.
9/23

8/12/14, 1:58 PMMicrobiome Species Data Exploration
Page 10 of 23file:///Users/myazdaniUCSD/Documents/microbiome/july29/index.html#1
Unsupervised Approach
10/23

8/12/14, 1:58 PMMicrobiome Species Data Exploration
Page 11 of 23file:///Users/myazdaniUCSD/Documents/microbiome/july29/index.html#1
11/23

8/12/14, 1:58 PMMicrobiome Species Data Exploration
Page 12 of 23file:///Users/myazdaniUCSD/Documents/microbiome/july29/index.html#1
PCA
Top 3 PC's explain 80% of variance.
12/23
8/12/14, 1:58 PMMicrobiome Species Data Exploration
Page 13 of 23file:///Users/myazdaniUCSD/Documents/microbiome/july29/index.html#1
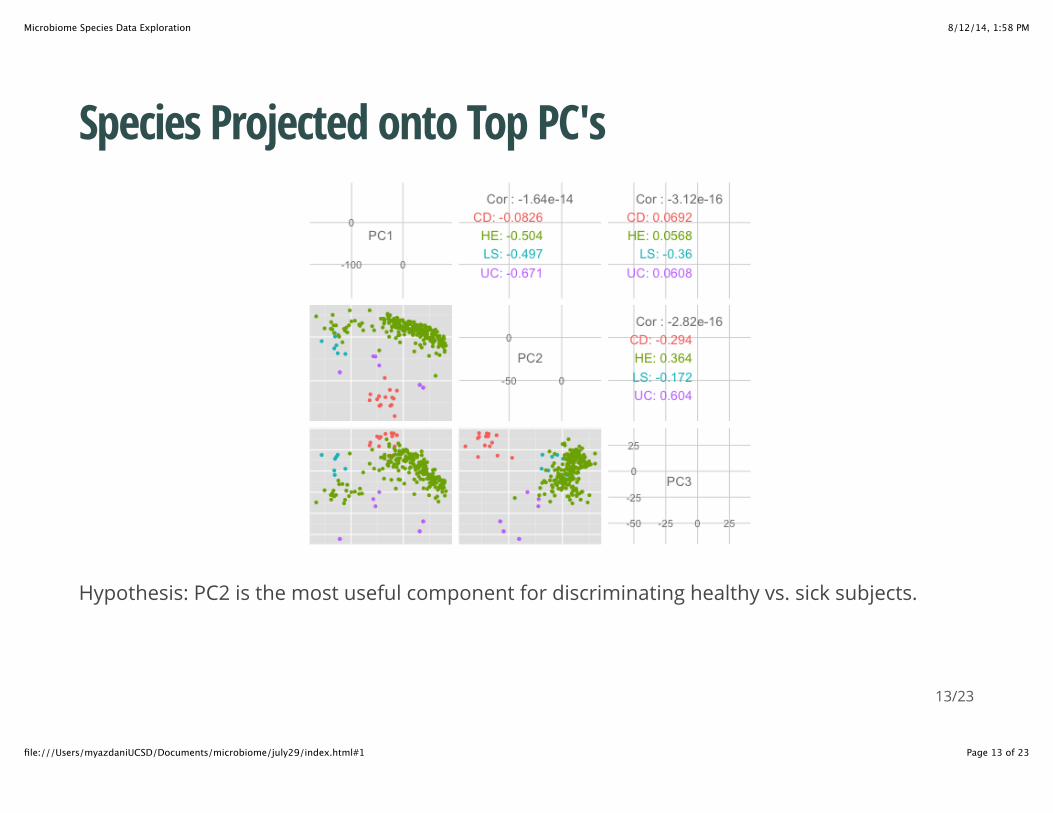
Species Projected onto Top PC's
Hypothesis: PC2 is the most useful component for discriminating healthy vs. sick subjects.
13/23

8/12/14, 1:58 PMMicrobiome Species Data Exploration
Page 14 of 23file:///Users/myazdaniUCSD/Documents/microbiome/july29/index.html#1
What does PC-1 look like?
14/23
8/12/14, 1:58 PMMicrobiome Species Data Exploration
Page 15 of 23file:///Users/myazdaniUCSD/Documents/microbiome/july29/index.html#1
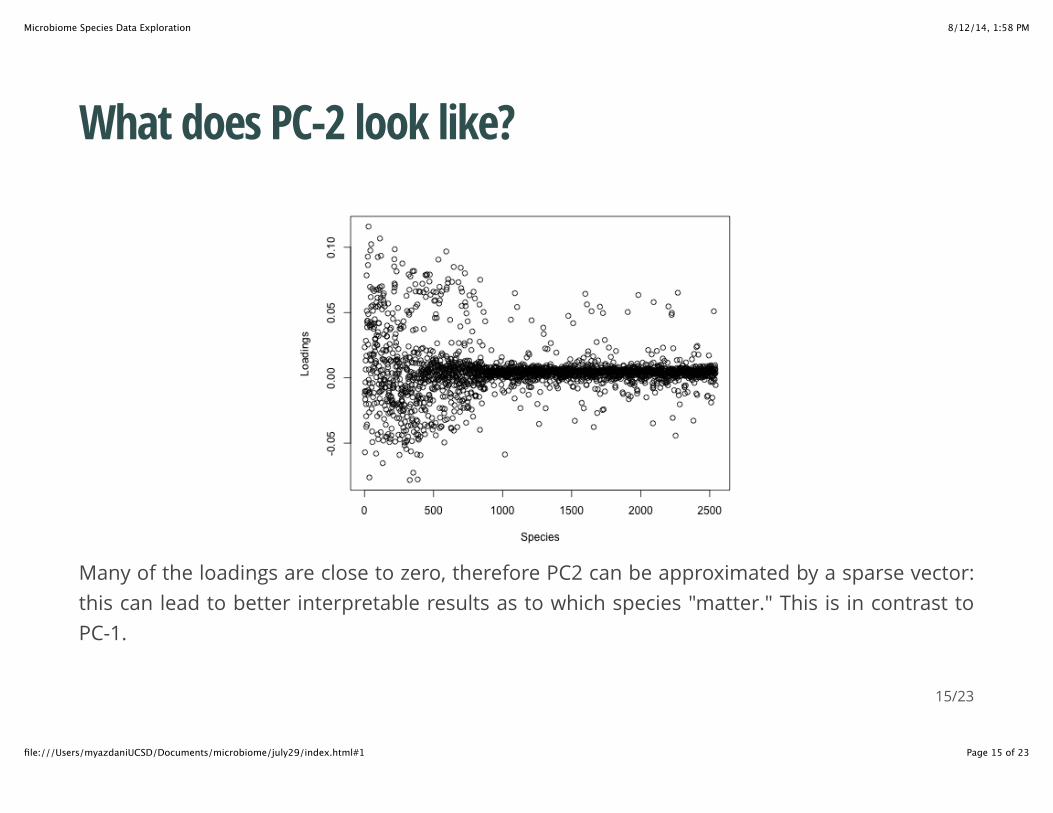
What does PC-2 look like?
Many of the loadings are close to zero, therefore PC2 can be approximated by a sparse vector:this can lead to better interpretable results as to which species "matter." This is in contrast toPC-1.
15/23

8/12/14, 1:58 PMMicrobiome Species Data Exploration
Page 16 of 23file:///Users/myazdaniUCSD/Documents/microbiome/july29/index.html#1
Supervised Approach
16/23

8/12/14, 1:58 PMMicrobiome Species Data Exploration
Page 17 of 23file:///Users/myazdaniUCSD/Documents/microbiome/july29/index.html#1
Logistic RegressionWe build classifiers to determine which species are important for discriminating healthy fromsick subjects. In our approach, we pool all LS, CD, and UC subjects into one group labeled as"sick," and all HE subjects are labeled as "healthy."
The classifier that we use is a logistic regression model and we measure the error of theclassifier using the Akaike information criterion (AIC).
Note that since we have an order of magnitude less subjects than species, this is anundetermined system (more unknowns than equations) and it is not meaningful to use "all" thedata. To mitigate this issue, we take subsets of the species that we have. We first take subsetsfrom the PCs, followed by subsets of the species.
17/23

8/12/14, 1:58 PMMicrobiome Species Data Exploration
Page 18 of 23file:///Users/myazdaniUCSD/Documents/microbiome/july29/index.html#1
Logistic Regression on PCsWe build a logistic regression model on the top 3 PC's to measure just how good thesecomponents are classifying sick from healthy subjects. Recall that our PCA plots from beforeappeared to show PC2 to be the most useful for this task. The AIC for the logistic regressionmodel that uses only PC 1 is:
The AIC for the logistic regression model that uses only PC 2 is:
The AIC for the logistic regression model that uses only PC 3 is:
The lower the AIC, the less error the model has. Therefore these analyses support our earlierhypothesis that PC2 is more discriminative than the other PCs.
## [1] 163.8
## [1] 61.6
## [1] 190.9
18/23
8/12/14, 1:58 PMMicrobiome Species Data Exploration
Page 19 of 23file:///Users/myazdaniUCSD/Documents/microbiome/july29/index.html#1
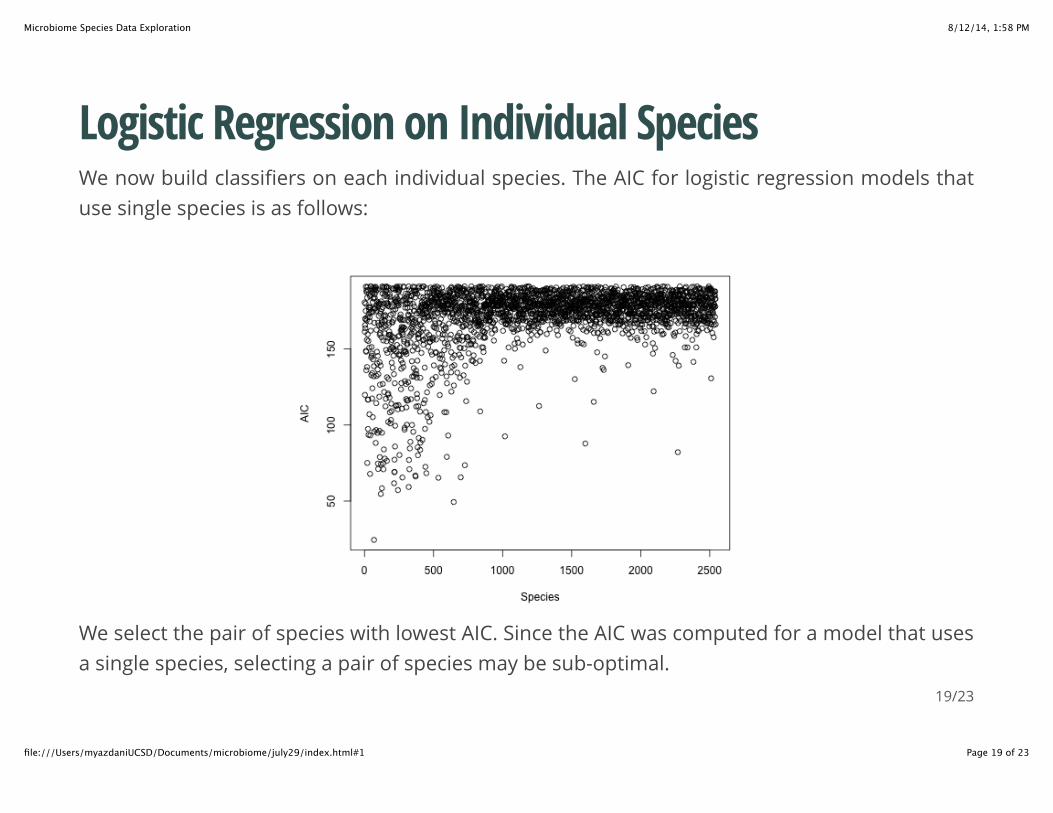
Logistic Regression on Individual SpeciesWe now build classifiers on each individual species. The AIC for logistic regression models thatuse single species is as follows:
We select the pair of species with lowest AIC. Since the AIC was computed for a model that usesa single species, selecting a pair of species may be sub-optimal.
19/23

8/12/14, 1:58 PMMicrobiome Species Data Exploration
Page 20 of 23file:///Users/myazdaniUCSD/Documents/microbiome/july29/index.html#1
Two species with lowest AICThe two species with the lowest individual AIC are:
Their respective individual AIC's are:
## [1] "Bacteroides.dorei" "Bacteroides.oleiciplenus"
## [1] 24.47 49.38
20/23

8/12/14, 1:58 PMMicrobiome Species Data Exploration
Page 21 of 23file:///Users/myazdaniUCSD/Documents/microbiome/july29/index.html#1
Plot of the Two Species with Lowest AIC
This plot shows that the species with the lowest AIC have a larger separability than the PCA plotfrom before. However, a lot of interesting structure that the PCA plot revealed is lost (forexample: the sub-cluster within healthy subjects).
21/23

8/12/14, 1:58 PMMicrobiome Species Data Exploration
Page 22 of 23file:///Users/myazdaniUCSD/Documents/microbiome/july29/index.html#1
Plot of the Species with Lowest AIC against E. Coli
While E. Coli does not have lowest AIC, comparing it with the lowest AIC specie reveals gooddiscrimination and interesting structures that PCA had revealed.
22/23

8/12/14, 1:58 PMMicrobiome Species Data Exploration
Page 23 of 23file:///Users/myazdaniUCSD/Documents/microbiome/july29/index.html#1
Future Work1. Instead of selecting a single species to build a logistic regression model, select pairs of
species. This will involve solving over 3 million logistic regression models. Solving a triplet willrequire over 2.8 billion! (Dell resources??)
2. Incorporate Ayasdi features
3. Apply similar analysis to the other data sets.
23/23