ya-noh wuarizona.openrepository.com/arizona/bitstream/10150/...the effect of salt stress on growth...
TRANSCRIPT

The effect of salt stress on growth and adenylateenergy charge in pumpkin (Cucurbita pepo L.)
Item Type text; Thesis-Reproduction (electronic)
Authors Wu, Ya-Noh, 1948-
Publisher The University of Arizona.
Rights Copyright © is held by the author. Digital access to this materialis made possible by the University Libraries, University of Arizona.Further transmission, reproduction or presentation (such aspublic display or performance) of protected items is prohibitedexcept with permission of the author.
Download date 16/06/2018 18:55:13
Link to Item http://hdl.handle.net/10150/554586

THE EFFECT OF SALT STRESS ON GROWTH AND ADENYLATE ENERGY CHARGE IN PUMPKIN
(CUCURBITA PEPO L. )
byYa-Noh Wu
A Thesis Submitted to the Faculty of theDEPARTMENT OF BIOLOGICAL SCIENCES
In Partial Fulfillment of the Requirements For the Degree ofMASTER OF SCIENCE
WITH A MAJOR IN BIOLOGYIn the Graduate College/
THE 'UNIVERSITY OF ARIZONA
1 9 7 3

STATEMENT BY AUTHOR
This thesis has been submitted in partial fulfillment of requirements for an advanced degree at The University of Arizona and is deposited in the University Library to be made available to borrowers under rules of the Library.
Brief quotations from this thesis are allowable without special permission, provided that accurate acknowledgment of source is made. Requests for permission ■ for extended quotation from or reproduction of this manuscript in whole or in part may•be-granted by the head of the major department or the Dean of the Graduate College when in his judgment the proposed use of the material is in the interests of scholarship. In all other instances, however, permission must be obtained from the author.
SIGNED: /U5^-o .
APPROVAL BY THESIS DIRECTOR This thesis has been approved on the date shown below:
KAORU MATSUDA Associate Professor of Biology
ACKNOWLEDGMENTS
The author gratefully acknowledges her appreciation for the encouragement and guidance given by Dr. K. Matsuda.
Also, I would like to thank my entire family for their encouragement and patience during this period of difficult work.

TABLE OF CONTENTS
PageLIST OF ILLUSTRATIONS . . . . . . . . . . . . . . . viLIST OF TABLES. . .......... . . . . . . . . . . . . viiABSTRACT . . . . . . . . . . 1 . . . . . . . . . . . . viii..CHAPTER
1 INTRODUCTION............................ . 12 LITERATURE REVIEW . .......... 3
Bichemical and Biophysical Explanation of theRole of Water in Growth and Metabolism . . 3
Effects of Stress on Photosynthesis andRespiration . . . . . . . . . . . . . . . . 4
Stress-induced Alteration of Mitochondria andChloroplasts........................ , . 6
Stress and Alteration in Growth RegulationLevel . . . ................ 8
Nitrogen Metabolism and Protein Synthesis inStressed Plants 9
The Cellular Content of Adenylate Compoundsand Regulation of Metabolism . 13
3 MATERIALS AND METHODS . . . . . . . . . . . . 17Plant Materials ........ 17Extraction of Adenosine Phosphates from
Plants . . . . . . . . . . 19Determination of Adenylate Energy Charge ... . 20
Solutions Used in Assays'. . . . .- . . 22The Determination of ATP. . . . . . . 23'The Determination of the Content of
ATP + ADP. . . . . . . . . . . . . 24Determination of the Total Adenosine
Nucleotide Content (ATP + ADP -3- AMP) .......... 24

VTABLE OP CONTENTS--Continued
PageGrowth Rate Determination. 25Measurement of Water Potential in Cotyledons 25
4 RESULT AND DISCUSSION .......... 28The Effect of NaCl Levels in the Growth of
Pumpkin Seedlings . . . . ..... . . . . 28The Effect of Nutrient Solution Water Poten
tial on Plant Water Potential. . . . . . .- 31 '• The Recovery of Adenylate Compounds from
Pumpkin Cotyledons . .......... 35Alterations of Energy Charge in Cotyledons, of .
Salt-stressed 4- day-old Pumpkin Seedlings 37Alterations of Energy Charge in Other Plant
Tissues . . . . . . . . . . . . . . . . . 45REFERENCES 54

LIST OF ILLUSTRATIONS
Figure Page1. The Activity of ATP Regeneration or Utiliza
tion Enzyme Is Regulated by Energy Charge Level.............. 15
2. The Effect of Salt Concentration on the Growthof Pumpkin Seedlings of Different Ages. =. . 30
3. The Effect of Various Salt Concentrations onthe Growth Rate of Pumpkin Seedlings fromDay 4 to Day 5. . . . . . . . . . . . . . 32
4. The Effect of the Water Potential of NutrientSolutions on Cotyledon Water Potentials . 34
5. Alterations in the Energy Charge of Cotyledonsin Salt-stressed Pumpkin Seedlings. . . . . 42
6. The Change of Energy Charge Values of Cotyledons of 4-day-old Seedlings under Different Nutrient Solutions. .... .......... 43
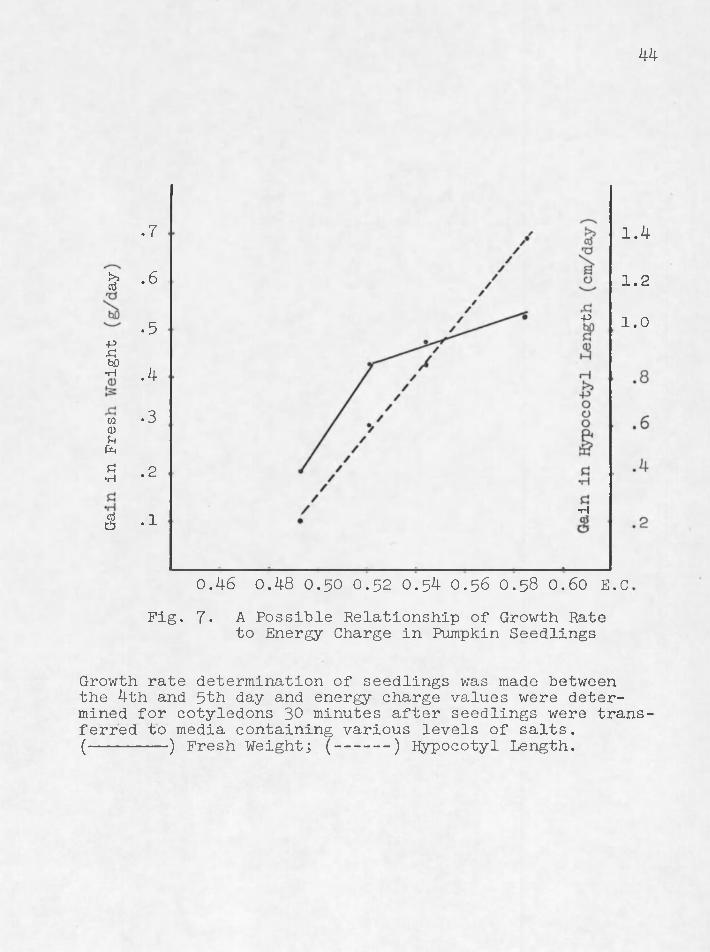
7. A Possible Relationship of Growth Rate toEnergy Charge in Pumpkin Seedlings. . . . . 44
8 . ' The Change in Energy Charge with Time of Various Tissues Exposed to -4 bar NaCl. . . . . 47
9. Alterations in the Energy Charge with Time ofLeaves of Wheat and Corn Seedlings Exposed to -1 Bar NaCl. .......... $0
10. A Comparison of the Energy Charge Values ofCotyledons of Salt-stressed and Control Seedlings of Various Ages . . . . . . . . . . 52
vi

LIST OF TABLES
Table Page1. The Growth of Pumpkin Seedlings Cultured in
Nutrient Solutions Containing Various Concentrations of NaCl 29
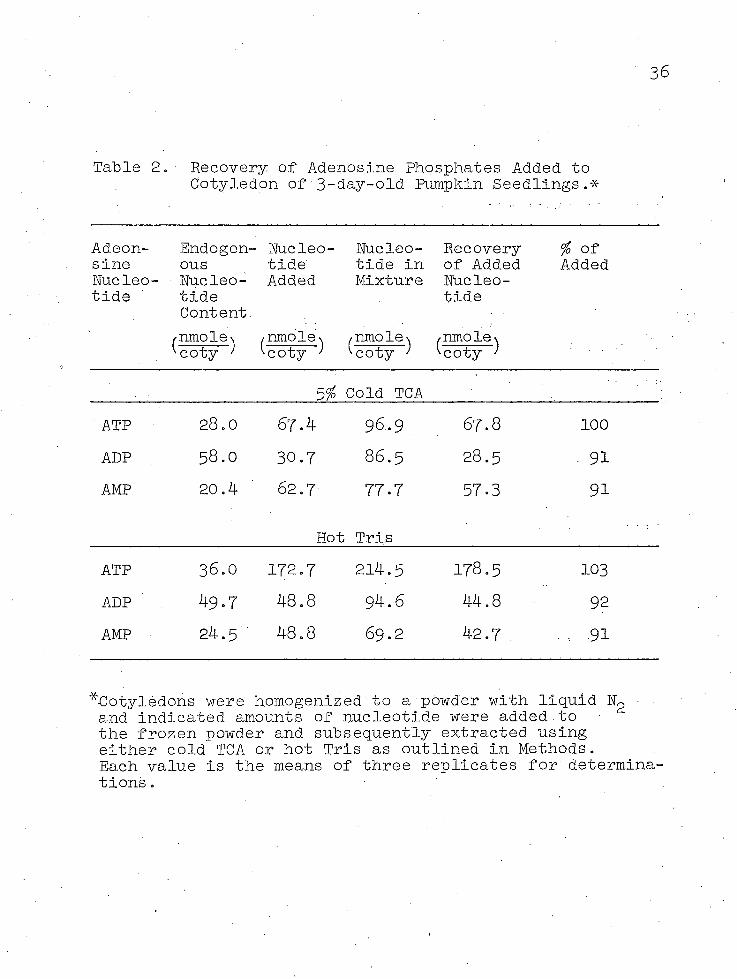
2. Recovery of Adenosine Phosphates Added toCotyledon of 3-day-old Pumpkin Seedlings . 36
3• Rapid Changes in Amounts of Adenylate Compounds and Energy Charge Levels in Cotyledon of 4-day-old Pumpkin Seedlings Exposed to -1 Bar NaCl . . . . . . . . . . . . . . . . 38
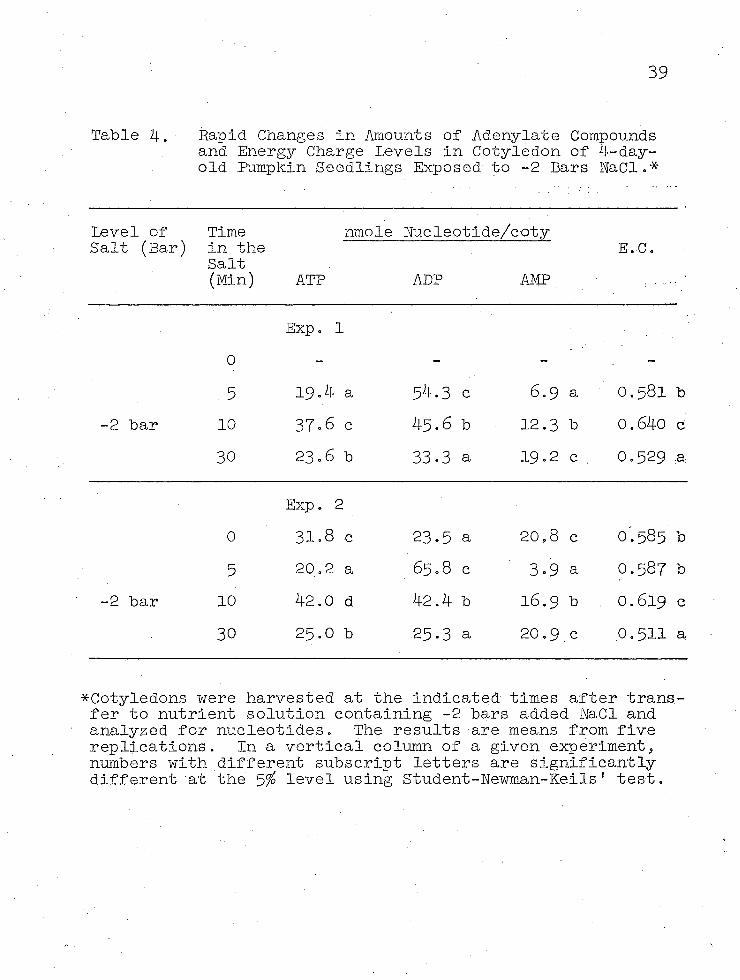
4. Rapid Changes in Amounts of Adenylate Compounds and Energy Charge Levels in Cotyledon of 4-day-old Pumpkin Seedlings Exposed to -2 Bars NaCl.................. 39
5* Rapid Changes in Amounts of Adenylate Com- -pounds and Energy Charge Levels in Cotyledon of 4-day-old Pumpkin Seedlings Exposed to -4 Bars NaCl. . .................... 40
6. Rapid Change of Adenylate Compound Levels andEnergy Charge in Various Tissues of Pumpkin Following Salt Stress............... . 46
7 • Rapid Change of Adenylate Compound Levels andEnergy Charge Values in Leaves of 10-day- old Wheat and 7-day-old Corn Seedlings . . 49
vii

ABSTRACT
Determinations of adenylate energy charge values were made of tissues of pumpkin seedlings of various ages that were transferred from nutrient medium containing low salt to medium containing -1 to -4 bar NaCl. All studies showed that energy, charge values transiently rose in 5 .to 10 minutes and subsequently decreased. Energy charge values after 30 minutes stress appeared to be stabilized values and in all cases tissues from stressed seedlings had lower values at 30 minutes than controls. In extensive studies conducted with 4-day-old seedlings, it was found that additions of increased levels of salt to the nutrient solutions resulted in decreased growth rates of plants, decreased plant water potential values and decreased energy charge values (measured 30 minutes after stress) of cotyledons stress. Preliminary studies with leaves from 7-day-old corn and 10-day-old wheat seedlings showed that energy charge values of these tissues were altered in a similar way to that of pumpkin seedlings.
viii

CHAPTER 1
INTRODUCTION
In many Irrigated agricultural-areas, plant growth and productivity gradually decline after many years■of cropping and it is known that this decline often occurs as the result of salt accumulation in the soils. Physiologically, salt effects in plant growth often resemble effects due to water stress. This is understandable since salts, reduce soil water potential which, in turn, effectively reduces the plant water potential of many crop species.Since maximum growth depends on high plant water potentials^ any reduction in water potential by either salt or water stress ultimately results in reduction of growth.
Mary attempts have been made to understand the metabolic alterations that lead to reduction in plant growth and two excellent (24,;33) reviews on this subject have appeared recently. Thus far, a number of metabolic alterations have been detected in stressed plants but there is presently no clear understanding of the sequence Of events that leads ultimately to a reduction in plant growth rate. In most cases, alterations in metabolism were' detected a number of hours or days after imposition of

stress, and it is quite possible that the detected changes were many steps removed from the primary events that occur following stress. Clearly, in attempting to determine primary effects of stress on metabolism, we must focus on rapid alterations in metabolism which occur upon imposition of stress.
The objective of this study is to determine if the content of ATP, ADP and AMP'will be quickly altered follow- ■ ing exposure of plants to salt stress.’ Although rapid . stress-induced changes in the content of these materials have not yet been reported, such rapid changes can be inferred from other types of published data. Furthermore, studies from a wide number of organisms indicate that the content of adenylate phosphates undergo extremely rapid changes and these changes are- related to the growth rate of - the organisms (8, 16 )• It is hoped that if consistent alterations in the content of adenylate compounds are obtained, it may be possible to use this information to help predict the course of events that occur in stressed . plants. In addition, such information may provide a basis for selecting for plants which differ in resistance to stress.

CHAPTER 2
LITERATURE REVIEW
Bichemical and Biophysical Explanation of the Role of Water in growth and
MetabolismA number of workers (16, 19, 20, 21, 33, 39, 48,
49, 51) have examined water stress effects on growth and have shown that the growth rate of a plant is directly related to the water potential in the plant. The water . potential of a plant, in turn, is affected by many factors which ultimately affect either the rate of water absorption or loss. Very commonly, water absorption rates of crop plants are reduced under conditions of drought or when the soil medium has high concentrations of salts. The latter situation results in a phenomenon called "physiological drought" and, characteristically, plants grown under saline conditions have smaller stomatae apertures and lower transpiration rates than plants which are grown under more ideal conditions (21).
Recently, Hsiao, Acevedo and Henderson (25) devised a technique which permitted the rapid measurement of growth changes that occurred when corn leaves were subjected to water stress. Using a linear variable differential
3

transformer, they found that growth rates changed within minutes after imposition of stress and changes in cell• turgidity preceded changes in growth rates. This change in turgidity, which is a physical phenomenon, was the first observable event which occurred when plants were under stress. However, stress is ultimately translated into a reduction in growth rate and this means that certain alteration in metabolism must also occur. Some of the more, probable stress-related metabolic effects, that have been reported are discussed below.
Effects of Stress on Photosynthesis and Respiration
Historically, effects on photosynthesis were among the first stress-related studies which were made. In 1925, Dastur (17) used gas exchange measurement together with quantitative measurements of the water content of leaves and found a linear relation between leaf water content and' rate of COg assimilation. Since that time, a number of papers have appeared which show that photosynthesis, respiration and COg diffusion rates changed when plant water contents were altered. Boyer (.TO) showed that when roots of cotton seedlings were exposed to medium containing salt, photosynthesis and respiration rates were 25/£ lower in medium containing -8.5 bars sodium chloride than in the control solution (0 bar). Similar results were also found

5/in tomato plants and loblolly pine seedlings (12). In contrast to these studies, Neiman (39) grew several different species of crop plants to maturity using gravel support medium and nutrient solutions containing different amounts of salts. He found that respiration rates on a per-plant basis were higher in plants grown in saline medium than in the control solutions. He suggested that high rates of respiration may occur because absorption of nutrients requires higher amounts of energy when roots are exposed to high concentrations of salts. An alternative explanation for the increased respiration rate associated with salin- ized medium has also been proposed (9, 34, 44). In some plant species, water potential gradients between the plant and the external solution are altered only slightly even in the presence of high salt levels in the root medium. This suggests that these plants absorb salts to increase the osmotic pressures in the plant, and this process is considered to require energy.
In most studies dealing with stress effects on photosynthesis or respiration, whole plants or leaves were used. Measurements were made several hours or days after imposition of stress'. The long time lag required and the fact that all results have not given consistently similar results make it difficult to conclude that stress affects photosynthesis and respiration directly. There is.

6however, evidence from in vitro studies that show that stress rapidly changes chloroplast and,mitochondrial activity.
Stress-induced Alteration ofMitochondria and Chloroplasts
Since gas exchange studies using whole tissue showed that photosynthesis and respiration can be altered when plants are stressed, a number of workers have attempted to show that the organelles involved in these processes, the chloroplasts and mitochondria, undergo alteration during stress. Miller, Bell and Koeppe (38) isolated mitochondria • from stressed and unstressed corn shoots, and they found that after only three minutes stress the isolated mitochondria had altered swelling and contraction properties and lower ion transport capabilities than mitochondria that were isolated from nonstressed shoots. Although Miller’s study appears to be the only experiment thus far presented which shows a rapid effect of stress on mitochondrial structure and function, other experiments have shown that stress affects oxygen uptake. Rir, Poljakoff-Mayber and Klein (43) and Rir, Klein and Poljakoff-Mayber (40) found that mitochondria isolated from maize root tips exposed to concentrated RaCl solution for 15 hours had reduced ability to absorb Og. They examined sections using the electron microscope and concluded that dehydration of root cells caused certain changes in^the structure of mitochondrial

cristae which prevented their staining with osmium. Zholkevich and Rogacheva (55) noted an'80 per cent reduction in oxygen uptake in mitochondria from water-stressed pea leaves which contained 72.5 per cent water as compared to controls which contain 87 per Cent water. In 1969, Flowers and Hanson (18) suggested that water potential may play a role in mitochondrial activity. They extracted mitochondria and subsequently effected partial dehydration by exposing them to sucrose solutions. The mitochondria • changed in phosphorylative activity within a few minutes following transfer to solutions containing sucrose.
Nir and Poljakoff-Mayber (4l) examined stress affects on chloroplasts and suggested that dehydration caused changes in the structure of isolated chloroplasts, and this was followed by a decrease in photosynthetic phosphorylation and COg reductive activity.. Boyer and Bowen (11) measured photosynthetic rates of chloroplasts isolated from pea or sunflower leaves that had been transferred to osmotic medium. They found that chloroplasts isolated from plants exposed to osmotic medium for only five minutes had lower ability to produce 0 than those from control plants.
cL
Stress effects on activity of isolated chloroplasts differed depending on the plant source. Chloroplasts from sunflowers were affected when the plants were exposed to water potentials lower than -8 bars, whereas, -12 bars were required to alter activity of chloroplasts from peas.

In summary, there is considerable evidence that stress does affect photosynthesis and respiration, and it appears that changes may occur rapidly. There is, however, evidence that other plant functions are also affected as some evidence has accumulated which indicates growth regulator levels are also affected by stress.
Stress ani Alteration in Growth Regulation Level
Reductions in the cytokinin contents of stressed plants have been reported to occur, and Itai and Vaadia (27) have advocated that cytokinins act by modulating protein synthesis. This view is based on their evidence that in stressed leaves, reductions in cytokinin levels parallel reductions in the ability of the leaves to incorporate amino acids into proteins. They also reported that applications of kinetin to stressed leaves increased amino acid incorporation (27) or leaf protein content (46). There is, however, conflicting data on the effect of cytokinin on stressed plants. Kahane and Poljakoff-Mayber (30) found ■ that kinetin inhibited amino acid incorporation into protein in control roots and in roots salinized with NagSO^, but stimulated incorporation of amino acids into protein in roots salinized with HaCl. In a later paper (28), Itai found that sometimes kinetin did not reverse the effect of stress on amino acid incorporation into protein.

' 9Stress has also been reported to lead to changes in
the content of other growth regulations. Jordan, Morgan and Davenport (29) reported that water stress led to elevated ethylene production and caused leaf abscission in cotton. This effect was reversed by 15 per cent COg in treatments in which the water potential was not less than -12 bars..
. Abscisic acid has also been suggested as being involved in metabolic changes which occur during stress. Wright (53) showed that abscisic acid increased in Wilted - leaves and this was related to the degree of wilting. In his study, wilting led to a 6 per cent decrease in fresh weight in 10 minutes and at this time no change in abscisic acid level was observed. However, a several fold increase in abscisic acid content occurred after two hours stress, and Wright (53) suggested that this may be how stress affects protein synthesis. Hsiao (24), however, believes that detectable changes in abscisic acid and other growth regulators are not sufficiently rapid and that other aspects of nitrogen metabolism are closer to the primary events which happen when plants are stressed.
Nitrogen Metabolism and Protein Synthesis in Stressed Plants
■ Although the evidence is limited, there are data that indicate that prolonged stress results in alterations in the amino acid content of plants. Barnett and Naylor
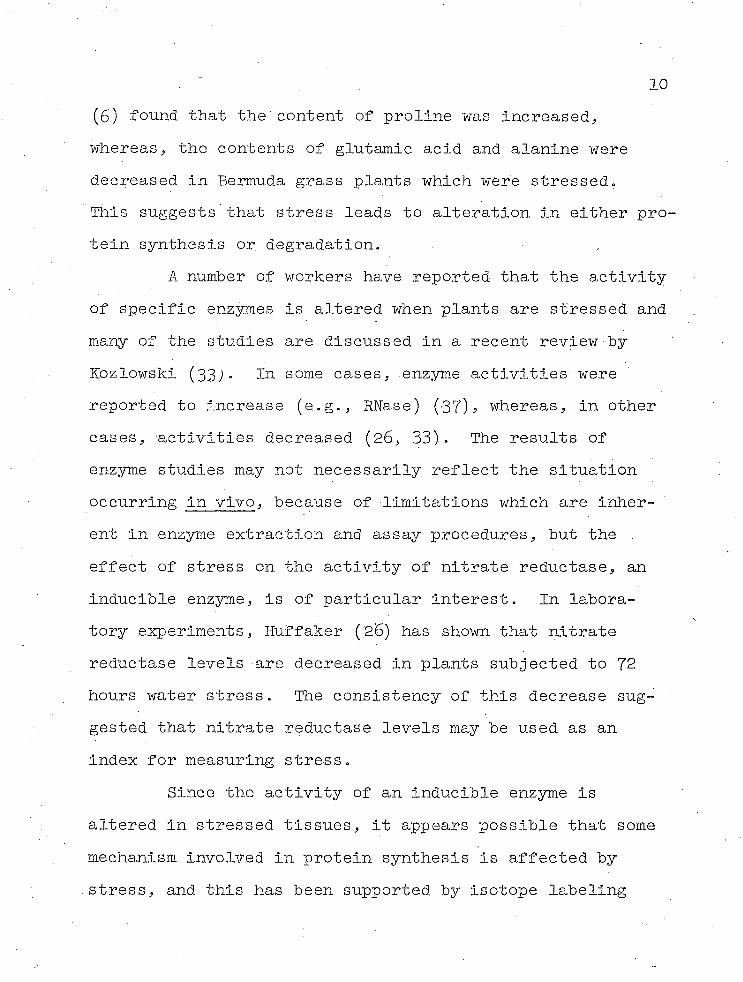
10(6) found that the content of .proline was increased, whereas, the contents of glutamic acid and alanine were decreased in Bermuda grass plants which were stressed.This suggests that stress leads to alteration in either protein synthesis or. degradation.
A number of workers have reported that the activity of specific enzymes is altered when plants are stressed and many of the studies are discussed in a recent review by Kozlowski (33)° In some cases, enzyme activities; were reported to increase (e.g., KNase) (37), whereas, in other cases, activities decreased (26, 33). The results of enzyme studies may not necessarily reflect the situation occurring in vivo, because of limitations which are inherent in enzyme extraction and assay procedures, but the effect of stress on the activity of nitrate reductase, an inducible enzyme, is of particular interest. In laboratory experiments, Huffaker (26) has shown that nitrate reductase levels are decreased in plants subjected to 72 hours water stress. The consistency of this decrease suggested that nitrate reductase levels may be used as an index for measuring stress.
Since the activity of an inducible enzyme is altered in stressed tissues, it appears possible that some mechanism involved in protein synthesis is affected by stress, and this has been supported by isotope labeling

11studies (27, 30, 42), and also by studies on the polysome content of extracts prepared from stressed and unstressed plants.
When organisms synthesize proteins, the ribosomes, mRNA, tRNA, and partially formed proteins are associated in a polysomes complex. Comparisons made in bacteria and in many other organisms have shown that organisms which conduct active protein synthesis characteristically have high polysome-to-monosome ratios. In maize root tips (42) and coleoptiles (23), it has been shown that water stress - leads to a shift from polysomes to monosomes. In maize coleoptiles (23) detectable reductions in polysome-to- monosome ratios were determined after 30 minutes stress. . Mild stress also leads to lowering of polysome-to-monosome ratios in maturing seeds (31), and in germinating seeds (14). This decrease in polysome content has been shown to result in lowered amino acid incorporation into protein. '
Polysome levels depend on a number of factors, and there is evidence that exposure to stress results in lowering of RNA levels, particularly if the treatment is pro-, longed. In studies with germinating wheat, Chen, Sarid and Katchalski (14) found that seeds imbibed for three days and subsequently stressed for two days appeared to have. lower"mRHA contents than unstressed seeds. However, when seeds were imbibed for only two days and stressed there was no effect on the content of mRHA. In another

12indirect attempt to measure mRNA levels, Ben-Zioni, Itai and Vaadia (7) first subjected tobacco plants to -4 bar NaCl until leaves lost 50$ of their ability to incorporate amino acids into protein. They then transferred plants to saline free medium and found that recovery of incorporation ability did not occur until after 72 hours. They noted that stressed leaves had high RNase levels, and suggested stressed induced RNase reduced the mRNA levels.
In experiments in which polysome level changes were detected after only a short exposure to stress, Hsiao (23) found no change in RNase levels. Furthermore, there was a rapid reformation of polysomes upon rewatering. Such a rapid reformation of polysomes was indicated and conversion of monosome to polysomes was dependent on preexisting mRNA. On the basis of inhibitor studies, he felt that stress somehow led to a lack of completion of polypeptide chains. In recent studies, Hsiao (24) found that detectable changes in polysome levels occurred 15 minutes after imposition.of stress in young green shoots of maize.
Protein synthesis is a complex process, and it is quite possible that the detected alterations in the content of polysomes is a reflection of changes in key intermediates that occur in cells. Since protein synthesis can be performed in vitro, using known components, one can speculate that this process can be controlled by regulating the content of any of the required components such as amino
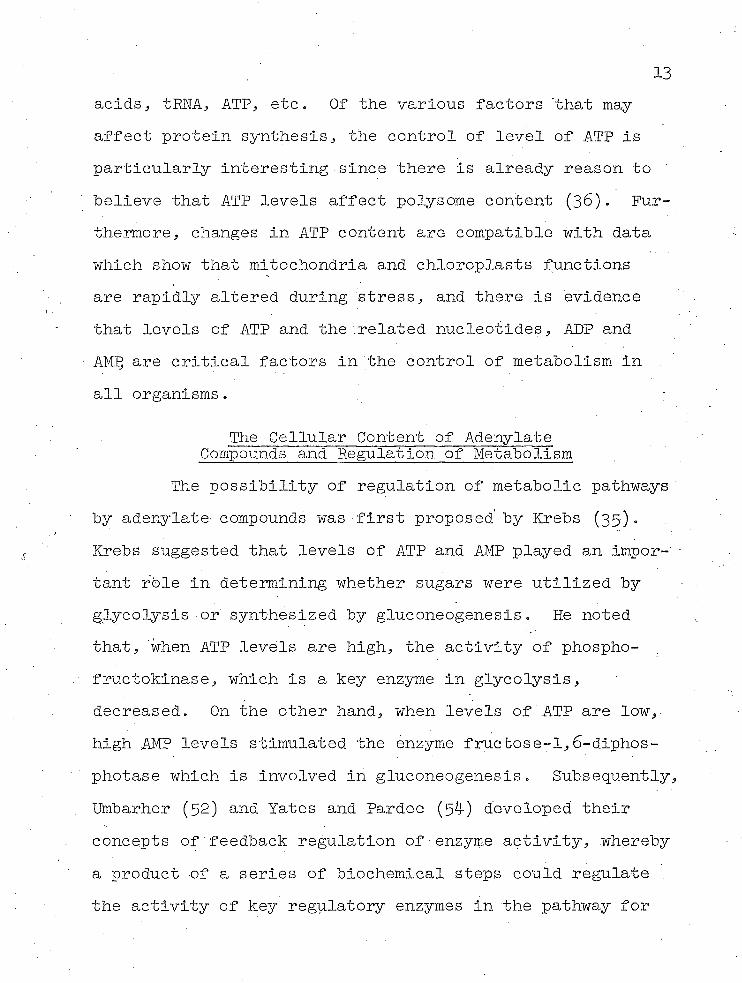
acids, tKDTA, ATP, etc. Of the various factors 'that, may affect protein synthesis, the control of level of ATP is particularly interesting■since there is already reason to believe that ATP levels affect polysome content (36). Furthermore, changes in ATP content are compatible with data which show that mitochondria and chloroplasts functions are rapidly altered during stress, and there is evidence that levels of ATP and the related nucleotides, ADP and AM13 are critical factors in the control of metabolism in all organisms.
The Cellular Content of Adenylate Compounds and Regulation of Metabolism
The possibility of regulation of metabolic pathways by adenylate compounds was first proposed by Krebs (35.). Krebs suggested that levels of ATP and AMP played an impor- - tant role in determining whether sugars were utilized by glycolysis or synthesized by gluconeogenesis. He noted that, when ATP levels are high, the activity of phospho- fructokinase, which is a key enzyme in glycolysis, decreased. On the other hand, when levels of ATP are low, high AMP levels stimulated the enzyme fructose-1,6-diphos- photase which is involved in gluconeogenesis. Subsequently, Umbarher (52) and Yates and Pardee (54) developed their concepts of feedback regulation of enzyme activity, whereby a product of a series of biochemical steps could regulate . the activity of key regulatory enzymes in the pathway for

14the formation of that product. Atkinson and Walton (.5) utilized the feedback inhibitor concept and suggested that key enzymes in processes which yield ATP will generally be inhibited by ATP, whereas, enzymes which utilize ATP will be stimulated by ATP. They examined the activity of a • number of such enzymes (l, 2, 3, 4, 5) and in their examination, they attempted to relate enzymes activity to the proportion of ATP, ADP and AMP present in cells. They viewed the balance of adenylate compounds in a manner similar to that of a storage battery with the adenylate system' serving as the energy mediating.system of living cells.ATP which has the potential of yielding two high phosphates was viewed as being in the fully charged state, and AMP , which has no high phosphate is viewed as being in thefully discharged state (2). They presented the equation,
f ATP) 4- 1/2 C AhP)E.c. = '[ATP)+(ADP)+(AMP) as an lndex of the energy chargestatus of a cell, where' (ATP), (ADP) and (AMP) are the molar concentration of adenylates. In this equation, one can see that if the adenylates are present only as ATP,E.G. = 1, whereas, if the adenylates are present as AMP, E.G. =0, and cells containing various amounts of both and also ADP could have intermediate values.
In their examination of key regulatory enzymes involved in ATP production, they showed that high Energy Charge values reduced enzyme activity. In contrast, enzyme

15involved in ATP utilization increased in activity with increased energy charge level (Fig. 1).
R: ATP regeneration enzyme
U : ATP utilization _ ,enzyme
Energy ChargeFig. 1. The Activity of ATP Regeneration or
Utilization Enzyme Is Regulated by Energy Charge Level
Atkinson and Fall (4) extended their findings obtained with studies using isolated enzymes to studies of energy charge relations to growth in organisms. They summarized results from many studies (13) and suggested that growth of nearly all organisms stops when the energy charge decreased below a critical minimum. They noted that energy charge values of about 0.5 or below were found in dominant seeds or spores and variable tissues had energy charge values of 0 .5 to 0.8. Except in the case of plants where energy charge values were somewhat lower, extremely rapidly growing tissues had energy charge value higher than O.85.
Ching and Ching (15) and Ching and Kronstad (16) examined energy charge values during seed germination and found energy charge values increased sharply as germination progressed in ponderosa pine (15) and wheat (16) seedlings.

16Ching and Kronstad (16) compared energy charge values of wheat varieties that differed in growth rate and found that overall adenylate levels and energy charge values were indeed higher in seedlings with higher growth potential.
Thus far, there is one paper (15) which has been published in which one can calculate the energy charge values of plants. A major objective of the study presented was to determine if energy charge values are altered rapidly and consistently upon subjecting plants to salt stress.But the detection of adenylate compounds was measured sev-' eral weeks after imposition of stress. Calculations from those results show that energy charge levels are lower in stressed than in unstressed plants.

CHAPTER 3
MATERIALS AND METHODS '
Plant Materials Pumpkin seedlings, Cucurbita.pepo L. var. Small
Sugar (Desert Seed Co., El Centro, California) were used as the primary source of plant material for this study.
Approximately 80 seeds were placed lengthwise in five rows over two liters of vermiculite in an 8ft x 12” x • 2-1/2” plant tray (Carolina) and were overlaid with another liter of vermiculite. The plants were watered between 9:00 to 10:00 a.m. each day. The growth chambers were maintained at 37 + 1 0 with a photoperiod (fluorescent and incandescent light) from 8:00 a.m. to 8:00 p.m. of about 800 ft-c intensity at plant height.
Although most work reported in this study was done with pumpkin, the results of studies with this plant suggested certain basic principles that could be applied to other plants, and studies were also conducted with Wheat .(Triticum vulgara L. ) and corn (Zea mays L. var. Rugosan Vas Yellow, Wrinkled). The method of planting was the same as that of pumpkin, but the temperature of growth was at 21 + 1 0. ■
17

18Three, four, and five day old pumpkin seedlings
were used in most experiments. Seedlings of the desired age were removed and after the roots were washed to remove vermiculite, they were then placed in nutrient solution using holders which were designed to permit rapid transfer of groups of seedlings from one nutrient solution to another. Seedlings were grown initially in two liters of modified Hoagland1s solution (22), consisting of 1 ml 1 M KHgPO^i 1 M K2HP0^(1:1), 1 ml 1 M MgS0^;7 HgO, 1 ml 1 M KHOg, 1 ml 1.5 M Ca(N03)2, and 1 ml of micromix (3.75 g. H^BO^, 2.25 g. MnClg-2 H2Q, 0.075 g. CuClg-ZHgO, 0.075 g. MnO^, 0.33 g. ZnSO^ made to a volume of 3 liters) and 0.015 g* Chel 138 (Geigy) for each liter of nutrient solution.
After one to five hours in nutrient solution, theiseedlings were either held in the control solution or were transferred to two liters of nutrient solution that contained various amounts of salt (-1 to -4 bars, where it was assumed that -1 bar = 1.4 g. NaCl) and cotyledons or other parts of plants were removed at five minutes to on̂ e hour after transfer. In these studies, care was taken to insure that all solutions were equilibrated to the temperature of the growth chamber (37 Jh 1 C) prior to transfer of plants.In studies that extended beyond one day, fresh nutrient solutions were prepared each day to reduce effects due to changes in salt concentration.

19A similar procedure of plant transfer was used in
studies with wheat and corn, but in these cases the plants and nutrient solutions were maintained at .21 + 2 0.
Extraction of Adenosine Phosphates from Plants
One cotyledon was removed from each of two plants and the two cotyledons were immediately frozen with liquid nitrogen and then transferred to a freezer (-20 0) and stored for no more than one-half hour. After all replicate groups were collected, the cotyledons were ground with liquid nitrogen in a pre-chilled mortar and pestle, and transferred quantitatively to centrifuge tubes. • All tubes were stored for no more than one-half hour (-20 0) until extraction for adenosine nucleotides. Each determination of adenosine nucleotide content was based on the use of three to seven replicate groups that each contained two cotyledons.
Adenylate compounds were extracted primarily using cold 5$ trichloroacetic acid (TCA). Ten ml of ice-cold TCA was added to the ground plant material in each tube and the mixture was shaken over ice periodically for 25 minutes.The homogenate was then centrifuged at 8,000 rpm for five minutes at 0 to 4C in a Sorvall RC 2-B centrifuge using a SS-34 head. An 0.025ml aliquot of the supernatant was then diluted with 10 ml ice-cold Tris-Mg buffer (0.04 M Trls,0.005 M MgSO^ • 7H20, PH 7.5)• TCA diluted to this extent

20did not interfere with the enzymatic conversions of adenylate compounds.
Adenosine phosphates were also extracted by adding 10 ml pre-heated (97 0) Tris-Mg buffer to the ground frozeni ■ ' ■ ■cotyledons and the mixture was immediately transferred to a 97 C water bath and held for five minutes. The samples were then cooled in ice, and diluted for assay.
Determination of Adenylate Energy Charge The contents of adenosine triphosphate (ATP),
adenosine diphosphate (ADP), and adenosine monophosphate (AMP) were determined using modification of the procedure of Strechler (51).
In this procedure, ATP content is determined by means of the firefly luciferin-luciferase assay and light output was measured using a liquid scintillation spectrometer according to Stanley and Williams (50). Briefly, the reactions for the firefly assay for ATP are: .
■ 4-2ATP 4- luciferin ^ ■-> adenyl-luciferin 4- pyrophosphate.
< enzyme0 ■ ■ :
adenyl-luciferin ------ > adenyl-oxyluciferin 4- H^O 4- light
After ATP determinations are made, ADP content isdetermined by first converting ADP to ATP using phosphenolpyruvate (PEP) and pyruvate kinase (PK):
+2'ADP 4- PEP ■ — ATP 4- pyruvate.
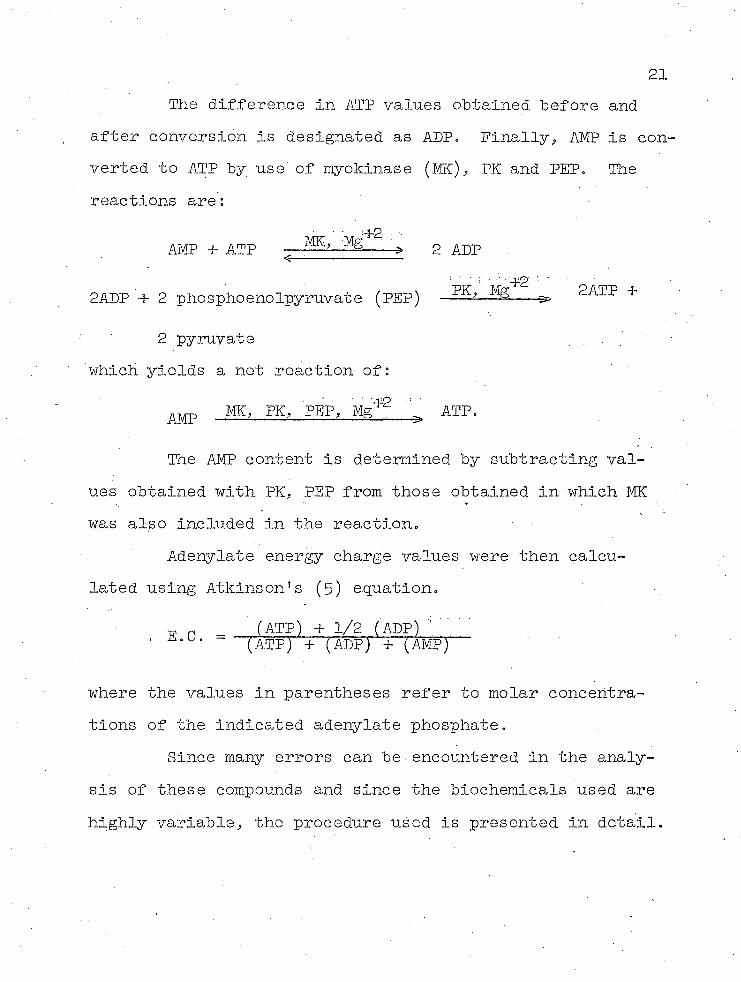
21The difference in ATP values obtained before and
after conversion is designated as ADP. Finally, AMP is converted to ATP by use of myokinase (ME), PK and PEP. The reactions are: -
AMP + ATP — 2 ADP: • - • •:jjig; -
2ADP + 2 phosphoenolpyruvate (PEP) — ---&» 2A'I'P +
2 pyruvate which yields a net reaction of:
AMP ME, PK, PEP, Mg*2' _ ATP.
The AMP content is determined by subtracting values obtained with PK, PEP from those obtained in which ME was also included in the reaction.
Adenylate energy charge values were then calculated using Atkinson's (5) equation.
tp o ... ■ (ATP) + 1/2 (ADP)' (ATP) + (ADP) + (AMP)
where the values in parentheses refer to molar concentrations of the indicated adenylate phosphate.
Since many errors can be encountered in the analysis of these compounds and since the biochemicals used are highly variable, the procedure, used is presented in detail.

Solutions Used in. AssaysThe following solutions were used for the determina
tion of energy charge:1. Tris-Mg buffer solution (0.04M Tris, 0.005M •
MgSO^, pH value adjusted to 7-5 with H^SO^). The solutions were stored at 0-4 C and were held for no more than two weeks. .
2„ Standard ATP solution: ATP solutions were pre-.pared fresh daily by dissolving powdered ATP in Tris-Mg buffer. Solutions were appropriately diluted with Tris-Mg buffer to give a final assay solution which contained 0.25 to 4.0 pmole ATP per reaction.
3. PhosphoenoIpyruvate (PEP): Preparations of PEP from various companies varied considerably in amount of contamination by ATP and other materials, and in activity. PEP solutions were prepared fresh daily by dissolving 25mg PEP (Cal. Biochem.) to 0.2 ml using ice-cold Tris-Mg
)buffer solution. Ten ul of the PEP solution was used in each conversion reaction.
4. lyruvate kinase (PK): Most commercial preparations of PK were found to be satisfactory for conversion of ADP to ATP. Five ul of Sigma's 10 mg Pk/ml in 2.2 M (NH^)gSO^ was used directly in each reaction.
5• Myokinase (MK): Considerable variability wasobtained in preparation of myokinase. To reduce variability, myokinase suspensions were dialyzed prior to

23reaction. Each day, 0.2 ml of Sigma's 5 mg MK/ml was dialyzed for two hours in 250 ml ice-cold Tris-Hg buffer.In later studies, improved results were obtained by using a dialysis buffer suggested by Ching (T. M.^Ching, Oregon State University,, personal communication). This solution contained 10"2 M Tris, 10“3 M EDTA and 10"^ M dithio- threitol, pH = 7-5<- 5 ul of the dialyzed MK was used ineach conversion reaction.
6. Firefly luciferin-luciferase solution: The .preparation of the firefly luciferin-luciferase solution was.essentially as described by Strechler (51)•
One hundred mg of vacuum-dried firefly lanterns (Sigma) were ground in 12 ml ice-cold 0.1 M sodium • arsenate buffer (pH 7.4) for 5 to 10 minutes, then centrifuged at 10,000 rpm for 5 minutes. The supernatant was then mixed with 100 mg MgSO^ • 7Hg0 and stored at 2 to 4 C for at least 2 days prior to use in ATP determination, in.." order to reduce spurious light emission. Storage in ice was avoided and the preparations were usually good for two weeks.
The Determination of ATPFirefly luciferin-luciferase assay for ATP were con
ducted using a Packard Tri-carb Model 3320 liquid scintillation counter with the coincidence circuit "off," a gain setting of 90 per cent, and a window setting of 50 to 1,000.

24Light output was measured using 5 ml mini vials (Nuclear Associates/ Inc.) and countings were for 1 sec. Luciferin- luciferase activities were monitored each day using standard ATP solutions.
ATP contents were measured by first adding 0.1 ml firefly extract to 0.4 ml Tris-Mg buffer and equilibrating in the counter chamber for at least five minutes. A background count was made and subsequently 0.1 ml of the appropriately diluted extract was added and counted immediately.
The Determination of the Content of ATP + ADPFive ul PK and 10 ul diluted PEP were added to each
vial which contained 0.1 ml of diluted sample, and 0.4 ml of Tris-Mg buffer. The mixture was then incubated at 34 to 36 0 for five minutes. Immediately after reaction, the mixture was transferred to 70 0 for two minutes to denature the pyruvate kinase since some preparations of firefly1, extract were found to be highly contaminated with ADP or AMP. The contents were then cooled and counted by adding 0.1 ml of firefly luciferase. ■
Determination of the Total Adenosine Nucleotide Content (ATP + ADP + AMP)
Five ul PK, 10 ul PEP ° 5 ul dialyzed MK and 0.1 ml of diluted sample were added to each vial which contained 0.4 ml Tris-Mg buffer. The mixture was incubated for five

25minutes at 3-4- to 36 C and then immediately transferred to a 70 C hath for two minutes. The contents were then cooled and counted after adding 0.1 ml firefly luciferase.
Growth Rate DeterminationGrowth rates were determined in plants grown in
nutrient solutions that contained various amounts of sodium • chloride (0 to -4 bars). Roots of 4-day-old seedlings grown in vermiculite were washed and transferred to nutrient solutions containing salt (1.4g NaCl/L = -1 bar ) and. measurements were made every day at the same time (2:00 p.m.), . .using ten pumpkin seedlings for each treatment.
Seedling fresh weights and hypocotyl lengths were determined and the plants were then placed into freshly prepared solutions containing the appropriate level of salt for later measurements (1.4g NaCl/liter -1 bar)
Measurement of Water Potential i .in Cotyledons
Water potential measurements Of the cotyledon were ' made using the Skardakov (47) method as modified by Knipling (32).
In this study a series of sucrose solutions was first made (-3 to -15 bars of water potential in 1 bar intervals) using van't Hoff's equation (45).

It is assumed that:In free solution, \jt = - it where
f = water potential (bars) ir = osmotic pressure (bars)
The osmotic pressure, in turn, is related to solution molality by van11 Hoff’s equation:
7T — miRTwhere
m = molality of the solution (mole liter- )i = a constant which accounts for ionization *
of the solute and/or other deviations fromperfect solution
R = gas constant (0.083 liter bar mole — 1degree )
T = absolute temperature (degree)Using this equation, at room temperature (23 + 1 C)
a water potential of -1 bar was calculated to be equal to asolution that is 0.04-7 molal in sucrose.
In order to measure the water potential of cotyledons, solutions containing different concentrations of sucrose were placed in 12 x 75 nun disposable culture tubes. One cotyledon from a given treatment was then completely immersed in each solution and each tube was capped tightly with a cork and allowed to stand at room temperature for one to five hours (best results were obtained when the equilibration period was four hours or more). After equilibration.

the cotyledon was removed from each tube and relative changes in density of. each sucrose solution were measured by adding a crop of sucrose solution of the original concentration (which contained a small amount of methylene blue as marker) near the center of the residual solution. In some cases, the drop was^buoyed upward. In these instances, it was assumed that the water potential of the exterior solution was greater than that in the cotyledon; the migration . of water from the1 exterior solution into the tissue resulted in increased sucrose concentration of the exterior solution. In some other cases, the drop tended to fall downward.This occurred because migration of water from the cotyledon, which had a higher water potential than the exterior solution, led to a decrease in sucrose concentration. The water potential of the cotyledon was assumed to lie between the solution in which the drop rises and that in which the drop falls.

CHAPTER 4
RESULT AND DISCUSSION
The Effect of NaCl Levels in the Growth of Pumpkin Seedlings
Although salts are known to affect the growth rate of plants, the specific effects vary from plant to plant.In order to define the effect of NaCl levels on the growth of pumpkin seedlings, plants were removed from vermiculite on the fourth day and transferred to two liters of nutrient medium containing various amounts of salts, and seedling fresh weights and hypocotyl lengths were determined at daily intervals. The data of Experiment 1, Table 1, showed that after 24 hours and in subsequent periods, plants grown in nutrient solutions containing higher level of NaCl had lower fresh weights and hypocotyl lengths than plants grown in lower concentrations of salt. These results are supported by the more limited data from Experiment 2.
Calculations of the daily growth rates showed that growth was not constant but rather was higher from day 4 to 6 than from day 6 to 8 . This is seen more clearly by examining the histograms (Pig. 2) prepared using the data from Experiment 1 of Table 1. Furthermore, comparisons of results show that in the intervals from day 4 to 5 and from
28

29
Table 1. The Growth of Pumpkin Seedlings Cultured inNutrient Solutions Containing Various Concentrations of NaCl.*
Age of 0 bar -1 bar -2 bar -4 barSeedling (day). „ _
FW HL FW HL . FW HL FW HL( g ).. . .. (cm). (g)____________ (cm) ^_LgL. _ (cm) . _(g). _ _ _ (cm)
4 1.161 5.09Expt 1 .
5 1.689 6.47 1.639 5.94 1.574 5.69 1.372 ■5.396 2.192 7.18 2.089 6.52 1.968 6.10 I.659 5.337 2.350 7.35 2.269 6.78 2.156 6.31 1.813 5.78
' 8 2.625 7.41 2.409 7.04 . 2.354 6.67 1.966 .5.92
growthrate 0.528 1.38 0.478 O.85 0.394 0.60 0.211 0.20
4 0.952 5.78Expt- .2 - 0.952 5.78
5 1.421 6.85 - - 1.255 6.056 1.720 7.95 - - - - 1.370 6.477 1.824 8.45 - - - - 1.521 6.838 ' 2.025 8.46 - - - - 1.645 7.20 ;
growth rate . .0.469 1..Q7 — - ■ — — 0.303 0.27 .
• *Values given are the means from 10 seedlings. Fresh weight (FW) and hypocotyl lengths (HL) were determined daily and growth rates are for changes between day 4 and 5*

Gain
in Fre
sh
Weight
(g/day)
_6 4th to 5th to 6th to 7th to5th day 6th day 7th day 8th day
...5
.4
.3
--.2
0 -1 -2 -4 0 -1 -2 -4 0 —1 -2 -4 0 -1 -2 -4(bar) (bar) (bar) (bar)Fig. 2. The Effect of Salt Concentration on the Growth of
Pumpkin Seedlings of Different Ages
Four-day-old seedlings were transferred from vermiculite into trays containing 2 liter nutrient solutions with the indicated amounts of additional salt. Plants were grown at 37 + 1 C and solutions were changed daily.
uoo

31day 3 to 6, the gain in fresh weight of plants is directly related to the water potential of the nutrient solution.The growth rate from day 6 to 7, however, is considerably less than in the previous period and the water potential of the nutrient solutions had little, if any, effect in the growth rate. Although the basis for the slowdown in growth between day 6 and day 7 is not understood, it may be related to changes in metabolism associated with expansion of primary leaves since these leaves normally undergo considerable expansion at this time.
The variation in growth rate obtained at the different ages suggests that if comparisons are made between metabolic phenomena and growth, growth measurements should be made close to the period in which metabolic studies are included. Accordingly,. since many metabolic studies were made on the fourth day of growth, increases in fresh weight and hypocotyl lengths were plotted in the interval from day. 4 to 5 ’(Fig. 3)• Their comparisons show a near linear relation of fresh weight gain to water potential.
The Effect of Nutrient Solution Water Potential on Plant Water Potential
Since the growth rate of pumpkin seedlings is reduced in nutrient solutions containing lower water potentials, it appears likely that the water potential within the plants is also altered. To test this possibility.

Gain
in Fre
sh Weight
(g/day)
32
.14.7. 6 12
.5 .10
.4
.3
.2
.1
0 -1 4-2ilr solu (bar)
Fig. 3• The Effect of Various Salt Concentrations on the Growth Rate of Pumpkin Seedlings from Day 4 to Day 5
(--------- ) Fresh Weight;(---------) Hypocotyl Length.
Gain
in Hypocotyl
Length

33water potentials of cotyledons from 4-day-old seedlings were determined using Kniplingr s (32) modification of the Skardakov (47) method. Initially, plant water potentials were determined at various times after plants were transferred to nutrient solutions containing salts. When measurements were attempted at one^half hour or less after exposure of seedlings to salt, some cotyledons showed evidence that water potential values were less than those of controls, whereas, others showed no change in water potential. These erratic results suggested that all plants did not respond at the same rate to alterations in nutrient solution water potential. Consistently reproducible values were, however, ..obtained after seedlings were exposed to salt for one or more hours.
Water potential values varied also with the duration of exposure of excised cotyledons to the sucrose solutions used in the Knipling procedure. Water potential values obtained after only a half hour's exposure to sucrose were consistently lower than those obtained after two to four hours. This was interpreted to mean that equilibration of water between the cotyledon and the external solution was not reached in a half hour and that values obtained after four or more hours' exposure to sucrose more correctly represented the plant water potential values. On this basis, it can be seen from Fig. 4, which is representative of several studies of the type.

34
-12
-11
-10
4-1 -20 3ili solu (bar)
Pig. 4. The Effect of the Water Potential of Nutrient Solutions on Cotyledon Water Potentials
Four-day-old seedlings were exposed to nutrient solutions containing the indicated amounts of salts for 1 to 2 hours, and cotyledons were then removed and placed in sucrose solutions for half to 1 hour (-----); 2 to 3 hours (---- ); andover 4 hours (- a - ■ - ) . In another study, seedlings were exposed to nutrient solution over night (-■»- , -) and cotyledons were then removed and placed in sucrose solutions over 4 hours.

35that plant water potential Is linearly related, to the water potential of the nutrient solution.
The Recovery of Adenylate Compounds from Pumpkin Cotyledons
A variety of procedures for extracting nucleotides from plant tissues has been presented in the literature and the comparative advantages of the procedures have been extensively discussed. In this study, extractions were conducted principally with cold 5 per cent trichloracetic acid (TCA), but extracts were also obtained with hot (97 C) Trls buffer. In order to gain some idea of the efficiency of extraction, known amounts of adenosine■nucleotides were added to the homogenized tissue prior to extraction, and measurements were then made of the recovery of these adenosine nucleotides. The results of these studies are given in Table 2. •
In a study of this type, it j.s recognized that additions of exogenous amounts of nucleotides cannot wholly simulate the conditions found in the tissues where some nucleotides may be tightly associated with certain cell fractions. However, both methods did provide very similar and nearly complete recoveries of the added adenosine compounds. For this reason, either method was considered to give a suitable estimate of the amount of extractable nucleotide present in pumpkin tissues, and the cold TCA method was principally used primarily because of convenience.
36
Table 2. Recovery of Adenosine Phosphates Added to Cotyledon of 3-day-old Pumpkin Seedlings.*
Adeon-sineNucleotide
EndogenousNucleotideContent
NucleotideAdded
Nucleotide in Mixture
Recovery of Added Nucleotide
% of Added
/nmole\ 'coty /
,nmole\ ^coty /
/nmolex 'vcoty '
/nmole x ^coty '
5# 'Cold TCAATP 28.0 67.4 96.9 67.8 100ADP 58.0 30.7 86.5 28.5 91AMP 20.4 62.7
Hot
77.7
Tris
57.3 91
ATP 36.0 172.7 214.5 178.5 103ADP 49.7 48.8 94.6 44.8 92AMP • 24,5 48.8 69.2 42.7 . • , 91
^Cotyledons were homogenized to a powder with liquid Ng and indicated amounts of nucleotide were added to the frozen powder and subsequently extracted using either cold TCA or hot Tris as outlined in Methods.Each value is the means of three replicates for determinations .

37Alterations of Energy Charge in
Cotyledons of Salt-stressed 4-day-old Pumpkin Seedlings
Most experiments for this thesis were conducted using cotyledons from 4-day-old pumpkin seedlings since cotyledons of this age showed more uniform coloration than those of the 3-day-old seedlings.
Pour-day-old seedlings were transferred from ver- miculite to nutrient medium containing -1, -2, or -4 bars H a d and the content of adenylate compounds in the cotyledons was determined at 0 to usually 30 minutes after transfer (Tables 3, 4, and 5- )• In this group of studies, thedata for Experiment 2 using -1 and -2 bars H a d were obtained on the same day, but data for all other experiments were obtained at separate times.
A comparison of results from the three tables shows that in the control cotyledons there is about 30 nmoles ATP, 25 nmoles ADP, 20 nmoles AMP, and 80 nmoles total adenylate compounds in each cotyledon. The energy charge values for the controls in all experiments was about 0.59•
All experiments showed that after 10 minutes exposure to salt, there is a transient rise in energy.charge. This results from increased levels of both ADP and ATP and decreased amounts of AMP; furthermore, the decrease in AMP is less than the combined increase of ADP and ATP. The approximately 10^ increase in total adenylate compounds after 10 minutes salt stress suggests that the cotyledons

38
Table 3. Rapid Changes in Amounts of Adenylate Compoundsand Energy Charge Levels in Cotyledon of 4-day-old Pumpkin - Seedlings Exposed to -1 Bar NaCl.*
Level of Salt(Bar)
Time in the Salt (Min)
nmole
ATP
Nucleotide/coty
ADP . AMP :B.C.
.0
Exp. 1
33.8 c 26.6 a 20.7 b O.588 b
-1 bar 5 28.3 b 51.5 a 20.5 b 0.594 b10 41.5 d 38.8 b 00 b 0.621 c30 22.4 a 43.2 c 14.8 a 0.544 a
0Exp. 2 31.8 b 23.5 a 20.8 b O.583 a
-1 bar • 5 25.5 a 74.1 c ll.l a 0.599 a10 38.7 c 47.0 b 11.8 a . 0.644 b30 - - -
^Cotyledons were harvested at the indicated times after transfer to nutrient solution containing -1 bar added NaCl and analyzed for nucleotides. • The results are means from five replications. In a vertical column of a given experiment, numbers with different subscript letters are significantly different at the 3% level using Student-Newman-KeiIs 1 test.
39
Table 4. Rapid Changes in Amounts of Adenylate Compoundsand Energy Charge Levels in Cotyledon of 4-day-old .Pumpkin Seedlings Exposed to -2 Bars NaCl.*
Level of Salt (Bar)
Time in the Salt (Min)
nmole Nucleotide/coty
ATP ADP .AMPB.C.
0Exp. 1
.5 19.4 a 54.3 c 6.9 a O.58I b-2 bar 10 37.6 c 45.6 b 12.3 b 0.640 c
30 23.6 b 33-3 a 19.2 c . 0.529 A
0Exp. 2 31.8 c 23.5 a 20.8 c O.585 b
5 20.2 a 65.8 c 3.9 a O.587 b-2 bar 10 42.0 d 42.4 b 16.9 b 0.619 c
30 25.0 b 25.3 a 20.9 c O.51I a
^Cotyledons were harvested at the indicated times after transfer to nutrient solution containing -2 bars added NaCl and analyzed for nucleotides. The results are means from five replications. In a vertical column of a given experiment, numbers with different subscript letters are significantly different at the 5^ level using Student-Newman-Keils' test.

4o.
Table 5• Rapid Changes in Amounts of Adenylate Compoundsand Energy Charge Levels in Cotyledon of 4-day-old Pumpkin Seedlings Exposed to -4 Bars NaCl.*
Level of Salt (Bar)
Time in the Salt (Min)
nmole Nucleotide/coty
ATP ADP . AMPB.C.
■Exp. 10 33.8 b 26.8 a 21.1 b 0.594 b
-4 bars 10 46.6 e 32.7 b 16.6 a 0.655 c30 27.0 a 34.1 b . 26.9 c 0.502 a60 26.5 a 38.1 b 28.8 c 0.497 a
Exp. 20 31.1 b 26.5 a 20.3 b. O.58I b
-4 bars 10 43.1 c 38.5 c 11.8 a 0.630 c30 23.5 a 34.6 b 24.4 c 0.485 a
1 60 27.O a 32.8 b 26.2 c 0.496 a
* Cotyledons were harvested at the indicated times after transfer to nutrient solution containing -4 bars added NaCl and analyzed for nucleotides. The results are means from five replications. In a vertical column of a given experiment,numbers with different subscript letters are significantly different at the 5$ level using Student-Newman-Keils' test.

41undergo some type of rapid conversion of non-adenylate compounds to adenylates (e.g., G-TP -------ATP), or there isa pileup of ATP and ADP due to a lack of utilization. At this time, the basis for the accumulation of ATP and ADP is not known but it should be pointed out that this transient increase in both ATP and ADP have consistently been obtained from cotyledon of 4-day-old seedlings.
The relative amounts of adenylate compound change considerably after longer exposure to salt. After 30 minutes exposure, the total adenylate compounds were found to be again similar to those of the controls and the ATP levels and energy charge values were always less in the salt treated plants than in the controls. The energy charge value at 30 minutes appears to be a stabilized value since measurements made after one hour in -4 bar NaCl gave results identical to those obtained after 30 minutes (Pig. 5).
In addition to showing that seedlings exposed to salts all transiently increased in energy charge after 10 minutes, the data of Pig. 5 show also that energy charge values after 30 minutes stress are in all cases lower than the energy charge value of the controls; furthermore, there is a direct although not a linear relation of energy charge to solution water potential (Pig. 6). Since the data of Pig. 7 closely resemble curves showing water potential in growth (Pig. 3), growth rates were plotted as a function of

42
0.64 -
0.62
c.
4o 6010 20 30 50Time (min)
Fig. 5• Alterations in the Energy Charge of Cotyledons in Salt-stressed Pumpkin Seedlings
Four-day old seedlings were exposed to nutrient solutionscontaining -T bar, (-------- ); -2 bar,(----- ); and -4 bar
NaCl for the indicated durations.

43
0.620.6o
0.58
0.52
0.50
0.48
4o - i -2 3\jf solu (bar)Fig. 6. The Change of Energy Charge Values of Coty
ledons of 4-day-old Seedlings under Different Nutrient Solutions
The relation of energy charge of pumpkin cotyledons to the water potential of nutrient solutions, indicated energy charge values were obtained 30 minutes after transfer of seedlings to nutrient solutions.
44
&
&•H
CO(UJhka•H
s
.7 1.4
.6 1.2-p 1.0.5
.4
.3
.2•H.1
0.46 0.48 O .50 0.52 0.54 0.56 0.58 0.60 E.CFig. 7• A Possible Relationship of Growth Rate
to Energy Charge in Pumpkin Seedlings
Growth rate determination of seedlings was made between the 4th and 5th day and energy charge values were determined for cotyledons 30 minutes after seedlings were transferred to media containing various levels of salts.(-------- ) Fresh Weight; (------ ) Hypocotyl Length.

• 45growth to energy charge values, and, interestingly, hypo- cotyl length is nearly linearly related to energy (Fig. 7).
In plotting these curves, it was recognized that any detected relationships must be viewed with caution since growth measurements were made over a I-day period (between day 4 and 5) ̂ whereas, energy charge values were measured within one hour after seedlings were transferred to saline media. Nevertheless, the existence of a possible relationship of growth to energy charge is of great inter-• est and the suggestion is compatible with the hypothesis of Atkinson (2) and coworkers.
Since, the energy charge values of cotyledons of 4-day-old seedlings were altered rapidly and consistently, it seemed likely that exposure to saline media would rapidly alter energy charge values in tissues.
Alterations of Energy Charge in Other Plant Tissues
In order to test the possibility that salt stress rapidly alters energy charge, other studies were conducted using hypocotyls of 4-day-old seedlings and cotyledons of 3 and 5-day-old pumpkin seedlings. In addition, preliminary experiments were conducted also with leaves of two monocots, corn and wheat.
Adenylate levels and energy charge values for pumpkin tissues are shown in Table 6 and Fig. 8 . A comparison

46
Table 6, Rapid Change of Adenylate Compound Levels and Energy Charge in Various Tissues of Pumpkin
. Following Salt Stress .-x- .......
Level of Salt (Bar)
Time in the Salt (Min)
nmole Nucleotide/coty
ATP ADP AMP ■B.C.
- • 4 days pumpkin seedlings (hypototyl)0 28.1 b 52.0 b 16.3 a 0.533 b
10 33.8 c 54.2 c 19.4 a O .599 c-4 bars 30 32.6 c 39.9 a 26.5 b 0.504 a
6o 23.1 a 48.6 b 16.4 a 0.498 a ■3 days pumpkin seedlings (cotyledon)'
0 29.4 c 19.7 b 14.5 a 0.541 c5 33 .5 d 9.7 a 22.2 c O .591 d
-4 bars 10 24.8 b 21.2 b 27.3 d 0.479 b30 20.7 a I6.8 b 20.2 b 0.475 a '
5 days pumpkin seedlings (cotyledon)0 30.6 b 76.1 b 1.5 a O.616 b
-4 bars 5 36.7 b 73.5 b 5.3 b 0.643 c. 10 . 68.7 c 21.2 a 14.8 c 0.763 d
z 30 17.1 a 72.3 b 4.4 b 0.566 a
*Each value represents the mean of five replication determinations.: In a vertical column of a given experiment,'numbers with different subscript letters are significantly different at the 5$ level using Student-Newman-Eeils' test.

47
0.80 .. 0.78 .. 0.76 .. 0.74 .. 0.72 .. 0.70 .. 0.68 ..
0.66 ..
0.64 ■ "C" 0.62 y'
o.6o 0.58 .. 0.56. 0.54 0.52 - 0.50 0.48 . 0.46 .. 0.44 .. 0.42
40 605 10 20 30 50Time (min)Fig. 8. The Change in Energy Charge with Time of Vari
ous Tissues Exposed to -4 bar NaCl
Energy charge values of hypocotyls of 4-day-old pumpkin seedlings (-); cotyledons of 3-day-old seedlings (-------------- ),and of 5-day-old seedlings Cotyledons were determined at indicated times of seedlings transferred to salin- ized media. Values are means from five replications.

48of data obtained from different tissues shows a remarkably similar pattern in response. In all cases, a transient rise in energy charge was noted 5 to 10 minutes and after 30 minutes the energy charge values of the' salt-treated plants decreased to a level below that of the control. -However, differences were noted in the time at which the transient peak appeared to occur. In cotyledon of 3-day- old seedlings (Table 6, Pig. 8), a transient peak was reached 5 minutes after transfer to salt, whereas, a peak was reached in 10 minutes in hypoigotyls of 4-day (Table6, Pig. 8) and cotyledons of 5-day old seedlings.
Data obtained using wheat and corn leaves also showed rapid fluctuations in energy charge levels (Table 7,Pig. 9)• Again a rapid rise in energy charge was noted atabout 10 minutes and after 30 minutes salt-treated samples had lower energy charge values than the controls.
In interpreting all the above data, it is recognized that the peak values of energy charge associated with these rapid fluctuations do not occur exactly at 5 or 10 minutes, but in all cases there is evidence of a transient rise in energy charge. This transient rise is consistently associated with a rise, in ATP levels, but changes in levels of ADP and AMP did not necessarily follow the same pattern in different tissues. Similarly, when measurements were .made after 30 minutes stress, the ATP values were in all instances lower in the stressed than in the control plants

49
Table 7. Rapid Change of Adenylate Compound Levels andEnergy Charge Values in Leaves of 10-day-oldWheat and 7-day-old .Corn Seedlings.*
Level of " Salt (Bar)
Time in the Salt (Min)
nmole Nucleotide/coty
ATP ADP AMPE.G.
10-day-■old wheat seedlings (leaf) ...
0 11.1 b 8.4 a 6.5 b : O .587 b5 •-9.7 a 20.1 b 4.2 a 0.577 b.
-110 13.3. c 8.9 a 5.9 b O .638 c30 9.1 a 11.6 a 8.5 c 0.540 a
7-day-■old corn seedlings (leaf)
0 19.2 b 23.1 b 6.1 b O .638 b-1 5 30.2 d 81.5 e 15.1 e 0.648 c
10 21.2 c 23.7 b 3.8 a 0.694 d, 30 12.0 a 16.2 a 6.6 b 0.571 a
■x-Each value represents the means of 6 replications for wheat and 3 replications for corn. In a vertical column of a given experiment, numbers with different subscript letters are significantly different at the 5$ level using Student- Newman-Keilsr test.

50
E.G.
0.70
0.68
0.66
0.64
0.62
0.60
25 30 35 40105 15 20Time (min)
Fig. 9• Alterations in the Energy Charge withTime of Leaves of Wheat and Corn Seedlings Exposed to -1 Bar NaCl
Corn and wheat seedlings following transfer to saline media,leaves from 10-day-old wheat seedlings (------- ) and 7-day-old corn seedlings (------) were measured for energy chargeat various times after transfer to -1 bar NaCl at 22C.

51but ADP and AMP levels did not follow a predictable pattern. This suggests that measurements of ATP values alone may be useful in some studies dealing with stress.
At the present time, it is not known exactly when the energy charge values of stressed plants drop to a level below that of control plants, but the fact that it is lower and apparently stabilized after 30 minutes exposure to saline conditions is believed to be significant. This is, among the most rapidly, detectable changes that, have been noted in stressed plants and the studies have not been limited to specific plant tissues. Furthermore, at least in one group of studies, there is good, evidence of a quantitative relationship existing between energy charge and plant water potential values. Since all results point in the same direction, it has raised hopes that energy charge measurements will be a useful tool for helping us to unravel the events which occur when a plant is stressed, and also for selecting plants that have resistance to stress. One might also speculate on how energy charge values of control and stress plants (30 minutes stress in -4 bar NaCl) of 3, 4, and 5-day-old is of particular content. The data (Fig. 10) show that'energy charge values of control plants increase linearly with age; in contrast, the limited available data indicate that the energy charge values of 5-day- old, seedlings' are more resistant to stress than 3 or 4-day- old seedlings. Conceivably, energy charge values will be

52
o.6o
0.56
.c.
0.48
0.46
0.44
43 5Age (day)Fig. 10. A Comparison of the Energy Charge Values
of Cotyledons of Salt-stressed and Control Seedlings of Various Ages.
Plots represent energy charge values of cotyledons fromcontrol (------ ) 3, 4 and 5-day-old seedlings and similarage seedlings subjected to -4 bar NaCl for 30 minutes(-----). Values are means from 5 replicate experimentsfor wheat, and 4 replicates for corn.

more or less altered by stress at other stages of growth and it may be possible to relate these values to growth.For example, one might be able to demonstrate that sensitivity is highest at germination or heading or some other stage of growth. One might also determine that salt resistance is altered in similar ways when stress is imposed.

REFERENCES
1. Atkinson, D. E. * (1968) Citrate and the citrate cyclein the regulation of energy metabolism. Biochem. Soc. Symp. 27:23-40.
2. Atkinson, D. E. (1968) The energy charge of theadenylate pool as a regulatory'parameter. Interaction with feedback modifiers. Biochem. 7:4030-4034.
3. Atkinson, D. E. (1969) Regulation of enzyme function.Ann. Rev. Microbiol. 23:47-68.
4. Atkinson, D. E. and L. Fall (1967), ATP conservationin biosynthetic regulation. Escherichia coli, phosphoribosyl pyrophosphate synthetase. J. Biol. Chem. 242:3941-3942.
5« Atkinson, D. E. and G. M. Walton (1967) Adenosinetriphosphate conservation in metabolic regulation rat liver citrate cleavage enzyme. J. Biol. Chem. 242:3239-3241.
6. Barnett, N. M. and A. W. Naylor (1966) Amino acidand protein metabolism in Bermuda grass during water stress. Plant Physiol. 4l:1222-1230.
7. Ben-Zioni, A., C. Itai and Y. Vaadia (1967) Waterand salt stresses, kinetin and protein synthesis in tobacco leaves. Plant Physiol. 42:361-365.
8 . Bergmeyer, H. U. (1963) Translated by Dermot H.Williamson. Estimation of substrates. Sec. B Methods of Enzymatic Analysis. 559-577.
9. Bernstein, L. (1963) Osmotic adjustment of plantsto saline media II. Amer. J. Bot. 50.360-370.
10. Boyer, J. S. (1965) Effects of osmotic water stress on metabolic rates of cotton plants with open ■ stomata. Plant Physio. 40:229-234.
54
1
55
11. Boyer, J. S. arid B. .L. Bowen (1970) Inhibition ofoxygen evolution in chloroplasts isolated from leaves with low water potentials. Plant Physiol. 45:612-615.
12. Brix, H. (1962) The effect of water stress on therates of photosynthesis and respiration in tomatoplant and loblolly pine seedlings. Physiologia PI. 15:10-20.
13. Chapman, A. 0., B. Fall and E. D. Atkinson .(1971)Adenylate energy charge in Escherichia coli duringgrowth and starvation. J. of Bacteriology. ' Dec. 1971, Vol. 108, No.. 3:1072-1086.
14. Chen, D., S. Sarid and E. Katchalski. (1968) The roleof water stress in the inactivation of messenger RNA of germinating wheat embryos. Proc. Nat. Acad. Sci. 61:1378-1385.
15. Ching, T. M. and K. K. Ching (1972) Content ofadenosine phosphates and adenylate energy charge in germinating ponderosa pine seeds. Plant Physiol. 50:536-540.
16. Ching, T. M. and W. E. Kronstad (1972) Varietaldifference in growth potential. Adenylate energy level, and energy charge of wheat. Crop Science12:785-7'89.
17. Dastur, R. H. (1925) The relation between watercontent and photosynthesis. Ann. Botany (London)39:769-786.
18. Flowers, T. J. and J. B. Hanson (1969) The effectof reduced water potential on soybean mitochondria. Plant Physiol. 44:939-945.
1 9 Gates, C. T. (1968) Water deficits and growth ofherbaceous plants, by T. T. Kozlowski.• Vol. 2: 135-190. • '
20. Greacen, E. L. and J. S. Oh (1972) Physics of rootgrowth. Nature New Biol. 235:24-25.
21. Greenway, H. (1962) Plant response to saline substrates. I:Growth and ion uptake of several varieties of;Hordeum during and after sodium chloride treatment. Aust. J. Biol. Sci. 15:16-38.

5622. Hoagland, D. R. and B. I. Arnon (1938) The water
culture method for growing plants without soil. Univ. Calif., College of Agr., Agr. Exp. Station, Berkeley. Circular 347.
23. Hsiao, T. C. (1970.) Rapid changes in levels of polyribosomes in Zea mays in response to water stress. Plant PhysiolTTb: 231-285.
24. Hsiao, T. C. (1973) Plant response to water stress.Annual Review of Plant Physiol. 24.:519-570.
25. Hsiao, T. C., E. Acevedo and D. ¥. Henderson (1970)Maize leaf elongation: Continuous measurement and close dependence on plant water status.,Science 168:590-591-
26. Huffaker, R. C. (1970) Effect of mild water stresson enzymes of nitrate, assimilation and of the carboxylative phase of photosynthesis in barley. Crop Sci. 10:471-478.
27. Itai, C. and Y. Vaadia (1968) The role of root cyto-kinins during water and salinity stress. Isr. J. Bot. 17:187-195.
28. Itai, C. and Y. Vaadia (1971) Cytokinin Activity inwater-stress shoots. Plant Physiol. 47:87-90,
29. Jordan, ¥. R., P. ¥. Morgan and T. L. Davenport (1972)¥ater stress enhance ethylene-mediated leaf abscission in cotton. Plant Physiol. 50:756-758.
30. Kahane, I. and.A. Poljakoff-Mayber (1968) Effect ofsustrate salinity on the ability for protein synthesis in pea roots. Plant Physiol. 43:1115- 1119 -
31- Klein, S. and B. M. Pollock (1968) Cell fine structure of developing lima bean seeds related to seed desiccation. Amer. J. Bot. 55:658-692.
32. Knipling, E. B. (1967) Measurement of leaf waterpotential by the dye method. Ecology, V. 48>No. 6:1038-1040.
33- Kozlowski, T. T. '(1972) ¥ater deficits and plant .growth. Academic Press, Inc., New York, New York 10003, pp. 177-216; 255-275.
5734. Kramer, P. P. (1967) Water absorption, conduction,
and transpiration 320-336 in irrigation of agricultural lands, ed. by R. M. Hogan, H. R. Raise, and T. W. Edminster, Amer. Soc. Agron. 6l:ll80- 1196.
35- Krebs, H. A. (1964) The croonian lecture, 1963Gluconegenesis. Proc. Roy. Soc., London, Ser. B, 159:545-565.
36. Lin, C. Y. and L. K. Foe (1967) Dissociation andreassembly of polyribosomes in relation to protein synthesis in soybean root. J. Mol. Biol. 26:237- 247.
37. Mattas, R. E. and A. W. Pauli (1965) Trends in 'nitrate reduction and nitrogen fractions in young corn plants during heat and moisture stress.Crop Sci. 5 :181-187.
38. Miller, R. J., D. T. Bell and D. E. Koeppe (1971)The effects of water stress on some membrane characteristics of corn mitochondria. Plant Physiol. 48:229-231.
39. Nieman, R.. H. (1962) Some effects of sodium chlorideon growth, photosynthesis and respiration of twelve crop plants. Bot. Gaz. 123:279-285-
40. Nir, I., S. Klein and A. Poljakoff-Mayber (1969)Effect of moisture stress on submicroscopic structure of maize roots. Aust. J. of Biol. Sci. 22: 17-33.
41. Nir, I. and A. Poljakoff-Mayber (1967) Effect ofwater stress on the photochemical activity of chloroplasts. Nature (London) 231:481-487.
42. Nir, I., A. Poljakoff-Mayber and S. Klein (1970) Theeffect of water stress on polysome population and the ability to incorporate amino acids' in maize root tips. Isr. J. Bot. 9 :451-463.
43. Nir, I., A. Poljakoff-Mayber and S. Klein (1970) Theeffect of water stress on mitochondria of root cells. Plant Physiol. 45:173-178.
44. O'Leary, J. W. (1969) The effect of salinity onpermeability of roots to water. Isr. J. Bot. 18:1-9.

58
45. Salisbury, P. B. and C. Ross (1969) Osmosis and thecomponents of water potential. Plant Physiol., pp. 52-74.
46. Shah, C. B. and R. S. Loomis (1965) Ribnucleic acidand protein metabolism in sugar beet during drought. Plant Physio1. 18:240-254.
47. Skardakov, V. S. (1948) New field method for thedetermination of the suction pressure of plants. Dokl. Akad. Naud SSSR 60:169-172). (In Russia).
48. Slatyer, R. 0. (1962) Plant-water relationships,pp. 273-308. Academic Press, London and New York.
49. Slatyer, R. 0. (1962) Internal water relations ofhigher plants. An. Rev. Plant Physiol. 13:351- 378.
50. Stanley, P. E. and S. G. Williams (1969) Use of theliquid scintillation spectrometer for determiningadenosine triphosphate by the luciferase enzyme. Anal. Biochem. 29:381-392.
51. Strechler, B. L. (1968) Bioluminescence assay:principles and practice, pp. 99-l8l. In D. Glick (ed.) methods of bichemical analyses.
52. Umbarher, H. E. (1958) Evidence for a negative-feedback mechanism in the biosynthesis of isoleucine. Science 123:848.
53- Wright, S. T. C. (1969) An increase in the inhibitor-Bcontent of detached wheat leaves following a period of wilting. Planta. 86:10-20.
54. Yates, R. A. and A. B. Pardee (1956) Control of pyrimidine biosynthesis in E. Coli. by a feedback mechanism. J. Biol. Chem. 221:757-770.
55* Zholkevich, V. N. and A. Y. Rogacheva (1968) P/0ratio in mitochondria isolating from wilting plant tissue. Piziol. Rast. 15:450.

76 83