y-str profile frequency estimation - strbase · issues with y-str profile frequency estimation jack...
TRANSCRIPT

Issues with Y-STR Profile
Frequency Estimation
Jack Ballantyne University of Central Florida
John M. Butler NIST Applied Genetics Group
Scientific Working Group on DNA Analysis Methods
SWGDAM January 17, 2012 – Fredericksburg, VA chr Y
q p
heterochromatin

Selection of 11
U.S. Core Loci:
January 2003
DYS19,
DYS385 a/b,
DYS389I/II,
DYS390,
DYS391,
DYS392,
DYS393,
DYS438,
DYS439
Committee Members Not all were present for all meetings
July 2002 – Jan 2008
Jack Ballantyne (UCF) – chair
Mecki Prinz (NYC) – co-chair
John Butler (NIST)
Ann Gross (MN)
Bruce Budowle (FBI)
Jill Smerick (FBI)
Sam Baechtel (FBI)
John Hartmann (Orange Co., CA)
Jonathan Newman (CFS)
Phil Kinsey (ORMT)
Gary Sims (CA DOJ)
Demris Lee (AFDIL)
Carl Ladd (CT)
Charles Barna (MI)
Debbie Figarelli (Phoenix PD)
SWGDAM Y-STR Committee
http://www.fbi.gov/about-us/lab/forensic-science-communications/fsc/july2004/standards/2004_03_standards03.htm
These 11 loci were part of the Y-PLEX 6 and Y-PLEX 5 kits available at
the time from Reliagene and encompassed the 9 loci in the European
minimal haplotype (established in 1998) plus DYS438 and DYS439

Some Background on the
Previous Y-STR Committee
• SWGDAM had a functional Y-chromosome committee from July 2002 to January 2008 – Many of the committee members came from the prior validation
committee and later became part of the mixture committee
– Not much happened from July 2005 to Jan 2008 waiting for a decision on subpopulation correction and USYSTR database
– Mixture committee started in January 2007 and ran in conjunction with the Y-STR committee for three meetings (Jan 2007, July 2007, Jan 2008)
• Two primary accomplishments: 1. Selection of core Y-STR loci (January 2003)
2. SWGDAM approval (July 2008) and publication (January 2009) of Y-STR interpretation guidelines

What has happened in the past decade…
• Selection of core Y-STR loci (SWGDAM Jan 2003)
• “Full” Y-chromosome sequence became available in June
2003; over 400 Y-STR loci identified (only ~20 in 2000)
• Commercial Y-STR kits released
– Y-PLEX 6,5,12 (2001-03), PowerPlex Y (9/03), Yfiler (12/04)
• Many population studies performed and online databases
generated with thousands of Y-STR haplotypes
• Forensic casework demonstrations showing value of Y-STR
testing along with court acceptance
• Some renewed interest in Y-STRs to aid familial searching
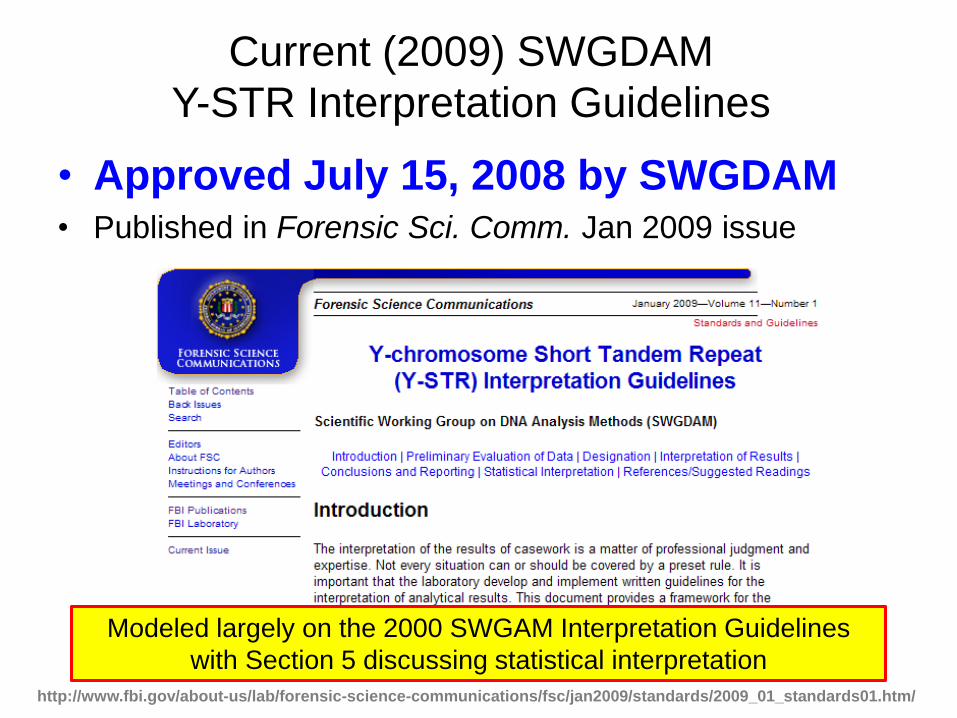
Current (2009) SWGDAM
Y-STR Interpretation Guidelines
• Approved July 15, 2008 by SWGDAM • Published in Forensic Sci. Comm. Jan 2009 issue
Modeled largely on the 2000 SWGAM Interpretation Guidelines
with Section 5 discussing statistical interpretation
http://www.fbi.gov/about-us/lab/forensic-science-communications/fsc/jan2009/standards/2009_01_standards01.htm/

Presentation Outline
• Elements of Haplotype Frequency Estimates – Differences between Y-STRs and mtDNA
– Y-STR loci and kits available
– Databases: YHRD and USYSTR
– Approaches to profile frequency estimation • Counting method
• 95% confidence interval (normal & Clopper-Pearson)
• [Bayesian predictor used in YHRD]
• [Brenner rare haplotype estimation]
• Current SWGDAM Guidelines – Section 5 point-by-point
• Produced language to adjust to Clopper-Pearson
– Points for discussion • Population substructure correction
• Mixtures
• Combining Y-STR data with autosomal STR information

Y-STRs vs. mtDNA
• Y-STRs are easier to analyze – STR typing at 12 or 17 loci in a single multiplex PCR compared to
sequence analysis across at least 610 nucleotides (and multiple strands) and often multiple amplifications with difficult samples
– Fewer labs are doing mtDNA analysis
• Y-STRs have larger population databases – Samples are easier to analyze; more labs are doing Y-STR analysis
– YHRD ~100,000 samples; EMPOP ~16,000 samples
• Y-STRs offer finer resolution – Effectively more “alleles” (haplotypes)
– Leads to better separation of unrelated samples (and possibly related ones) due to a higher mutation rate with Y-STR loci

DNA Profile (with specific alleles)
Rarity estimate
of the specific
DNA profile
Appropriate
genetic
formulas
Population allele or
haplotype frequencies
Elements Going into the Calculation
of a Rarity Estimate for a DNA Sample
1
2
3
There are different ways to
express the profile rarity
Jo
hn
M. B
utle
r (2
01
0)
Fu
nd
am
en
tals
of F
ore
nsic
DN
A T
yp
ing
, F
igu
re 1
1.1
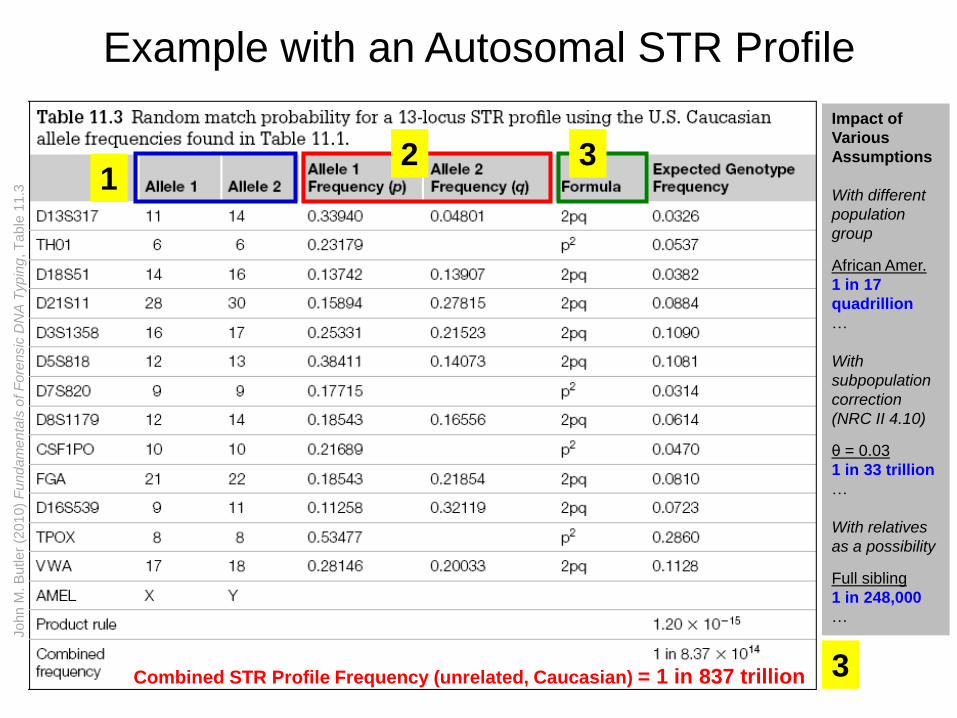
Example with an Autosomal STR Profile
Combined STR Profile Frequency (unrelated, Caucasian) = 1 in 837 trillion
Jo
hn
M. B
utle
r (2
01
0)
Fu
nd
am
en
tals
of F
ore
nsic
DN
A T
yp
ing
, T
ab
le 1
1.3
1 2 3
3
Impact of
Various
Assumptions
With different
population
group
African Amer.
1 in 17
quadrillion
…
With
subpopulation
correction
(NRC II 4.10)
θ = 0.03
1 in 33 trillion
…
With relatives
as a possibility
Full sibling
1 in 248,000
…

22 pairs of autosomes
(passed on in part,
from all ancestors)
Y-Chromosome (passed on complete,
but only by sons)
Mitochondrial (passed on complete,
but only by daughters)
Lineage Markers
Different Inheritance Patterns
13 CODIS STR Loci 12 or 17 Y-STRs mtDNA control region
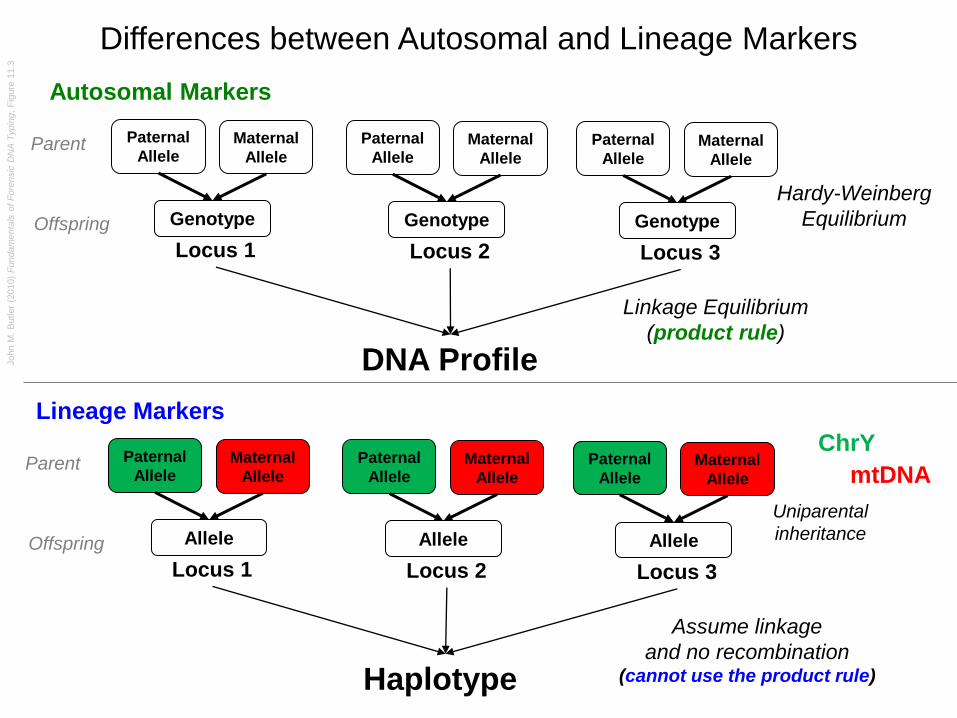
Autosomal Markers
Paternal
Allele Maternal
Allele
Genotype
Locus 1
DNA Profile
Paternal
Allele Maternal
Allele
Genotype
Locus 2
Paternal
Allele Maternal
Allele
Genotype
Locus 3
Hardy-Weinberg
Equilibrium
Linkage Equilibrium
(product rule)
John M
. B
utler
(2010)
Fundam
enta
ls o
f F
ore
nsic
DN
A T
ypin
g,
Fig
ure
11.3
Autosomal Markers
Lineage Markers
Paternal
Allele Maternal
Allele
Allele
Locus 1
Haplotype
Paternal
Allele Maternal
Allele
Allele
Locus 2
Paternal
Allele Maternal
Allele
Allele
Locus 3
Assume linkage
and no recombination (cannot use the product rule)
ChrY
mtDNA
Parent
Offspring
Parent
Offspring
Uniparental
inheritance
Differences between Autosomal and Lineage Markers

Generating a
Y-STR Profile
DNA Profile (with specific alleles)
Rarity estimate of the
specific DNA profile
Appropriate
genetic formulas
Population allele or
haplotype frequencies
1
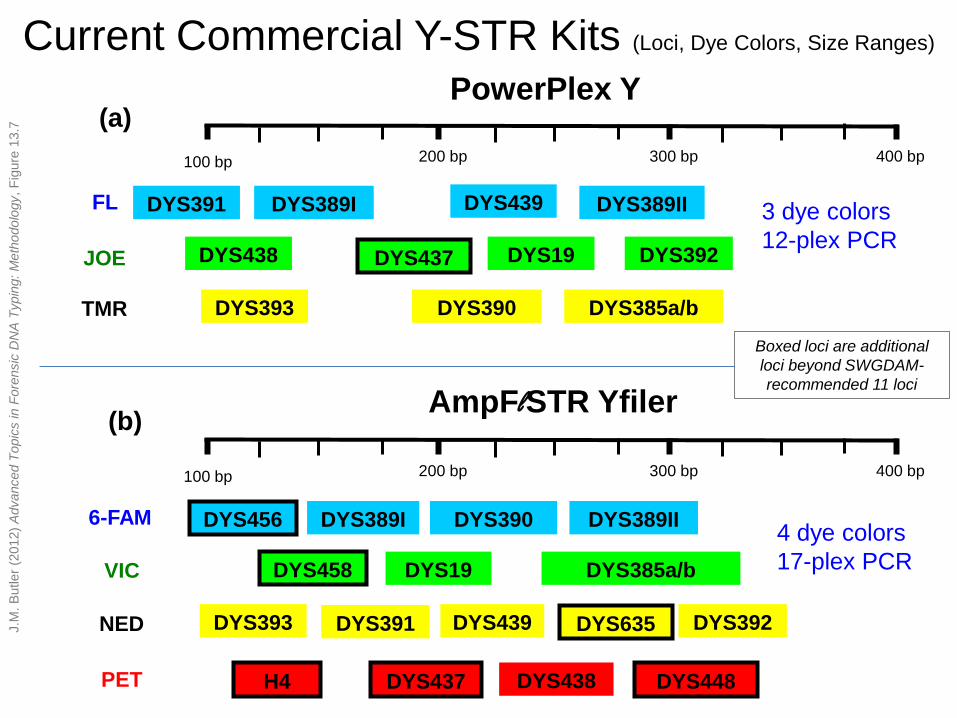
100 bp 400 bp 300 bp 200 bp
DYS391
PowerPlex Y
DYS389I DYS439 DYS389II
DYS438 DYS437 DYS19 DYS392
DYS393 DYS390 DYS385a/b
AmpFlSTR Yfiler
DYS437 DYS448 H4
100 bp 400 bp 300 bp 200 bp
DYS456 DYS389I DYS390 DYS389II
DYS458 DYS19 DYS385a/b
DYS393 DYS439 DYS392
DYS438
DYS391 DYS635
FL
JOE
TMR
6-FAM
VIC
NED
PET
(a)
(b)
3 dye colors
12-plex PCR
4 dye colors
17-plex PCR
J.M
. B
utler
(2012)
Advanced T
opic
s in F
ore
nsic
DN
A T
ypin
g: M
eth
odolo
gy, F
igure
13.7
Current Commercial Y-STR Kits (Loci, Dye Colors, Size Ranges)
Boxed loci are additional
loci beyond SWGDAM-
recommended 11 loci
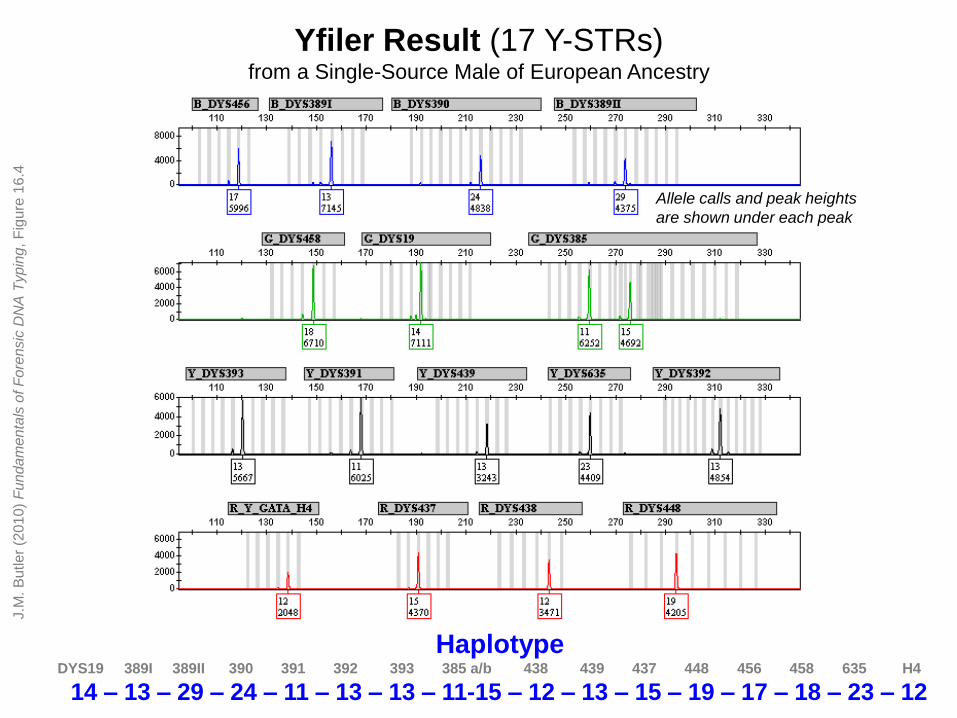
Yfiler Result (17 Y-STRs) from a Single-Source Male of European Ancestry
J.M
. B
utler
(201
0)
Fun
da
me
nta
ls o
f F
ore
nsic
DN
A T
ypin
g, F
igu
re 1
6.4
Allele calls and peak heights
are shown under each peak
Haplotype DYS19 389I 389II 390 391 392 393 385 a/b 438 439 437 448 456 458 635 H4
14 – 13 – 29 – 24 – 11 – 13 – 13 – 11-15 – 12 – 13 – 15 – 19 – 17 – 18 – 23 – 12
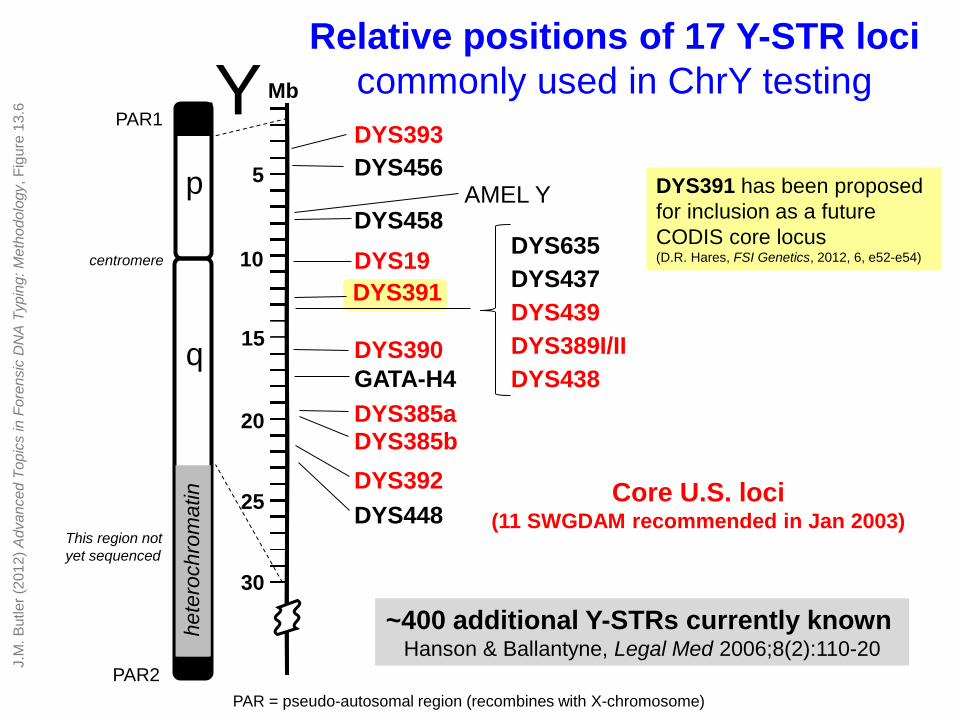
DYS391 has been proposed
for inclusion as a future
CODIS core locus (D.R. Hares, FSI Genetics, 2012, 6, e52-e54)
STR Marker Position (Mb)
DYS393 3.19
DYS456 4.33
DYS458 7.93
DYS19 10.13
DYS391 12.61
DYS635 12.89
DYS437 12.98
DYS439 13.03
DYS389 I/II 13.12
DYS438 13.38
DYS390 15.78
GATA-H4 17.25
DYS385 a/b 19.26
DYS392 21.04
DYS448 22.78
J.M
. B
utler
(201
2)
Ad
van
ced
Top
ics in
Fo
ren
sic
DN
A T
ypin
g: M
eth
od
olo
gy, F
igu
re 1
3.6
Relative positions of 17 Y-STR loci
commonly used in ChrY testing
Core U.S. loci (11 SWGDAM recommended in Jan 2003)
DYS19
Mb
5
10
15
20
25
30
p
q
DYS393
DYS392
Y DYS456
DYS458 AMEL Y
DYS391
DYS635 centromere
hete
rochro
matin
PAR1
PAR2
DYS448
DYS385a DYS385b
GATA-H4
DYS390
DYS437
DYS439
DYS389I/II
DYS438
~400 additional Y-STRs currently known Hanson & Ballantyne, Legal Med 2006;8(2):110-20
PAR = pseudo-autosomal region (recombines with X-chromosome)
This region not
yet sequenced

DYS385 a/b
a = b a b
DYS389 I/II
(a)
(b) I
II
F primer F primer
R primer
a b
Duplicated regions are
40,775 bp apart and facing
away from each other
F primer
R primer
F primer
R primer
DYS389I DYS389II
Multi-Copy (Duplicated) Marker
Single Region but Two PCR Products
(because forward primers bind twice)
J.M
. B
utler
(201
2)
Ad
van
ced
Top
ics in
Fo
ren
sic
DN
A T
ypin
g: M
eth
od
olo
gy, F
igu
re 1
3.5
Single Primer Sets Produce Multiple PCR Products

Characteristics of the
17 Commonly Used Y-STR Loci STR Marker Position (Mb) Repeat Motif Allele Range Mutation Rate*
DYS393 3.19 AGAT 8-17 0.10 %
DYS456 4.33 AGAT 13-18 0.42 %
DYS458 7.93 GAAA 14-20 0.64 %
DYS19 10.13 TAGA 10-19 0.23 %
DYS391 12.61 TCTA 6-14 0.26 %
DYS635 12.89 TSTA 17-27 0.35 %
DYS437 12.98 TCTR 13-17 0.12 %
DYS439 13.03 AGAT 8-15 0.52 %
DYS389 I/II 13.12 TCTR 9-17 / 24-34 0.25 % / 0.36 %
DYS438 13.38 TTTTC 6-14 0.03 %
DYS390 15.78 TCTR 17-28 0.21 %
GATA-H4 17.25 TAGA 8-13 0.24 %
DYS385 a/b 19.26 GAAA 7-28 0.21 %
DYS392 21.04 TAT 6-20 0.04 %
DYS448 22.78 AGAGAT 17-24 0.16 %
*Mutation rates are from as many as 15000 meioses described in a YHRD summary of 23 publications in Jan 2011 (see (http://www.yhrd.org/Research/Loci/)
J.M
. B
utler
(201
2)
Ad
van
ced
Top
ics in
Fo
ren
sic
DN
A T
ypin
g: M
eth
od
olo
gy, T
able
13.2
17 PCR products
15 primer sets

Recent Developments with Y-STR Typing
• Promega Corporation announced at their Oct 2011
ISHI meeting that they were working on a Y-STR 23plex
which will enable further resolution of Y-STR haplotypes
– Hopefully a kit will be released in 2012 but population databases
will need to be developed with the new extended haplotypes
• Manfred Kayser‟s group has developed a set of rapidly
mutating (RM) Y-STR loci that have the capability to
resolve fathers and sons in many instances
– An international collaboration is currently on-going to study these
RM Y-STRs in more detail (14 RM Y-STRs in 3 multiplexes)

The Meaning of a Y-Chromosome Match…
Conservative statement for a match report:
The Y-STR profile of the crime sample matches the Y-STR profile of the suspect (at xxx number of loci examined). Therefore, we cannot exclude the suspect as being the donor of the crime sample. In addition, we cannot exclude all patrilineal related male relatives and an unknown number of unrelated males as being the donor of the crime sample.
From Peter de Knijff‟s Oct 2004 presentation “Presenting Y-chromosome DNA evidence in court” at the International Symposium on Human Identification:
http://www.promega.com/~/media/files/resources/conference%20proceedings/ishi%2015/oral%20presentations/deknijff.ashx?la=en
de Knijff, P. (2003). Son, give up your gun: presenting Y-STR results in court. Profiles in DNA, 6(2), 3-5. Available at
http://www.promega.com/resources/articles/profiles-in-dna/2003/son-give-up-your-gun-presenting-ystr-results-in-court/
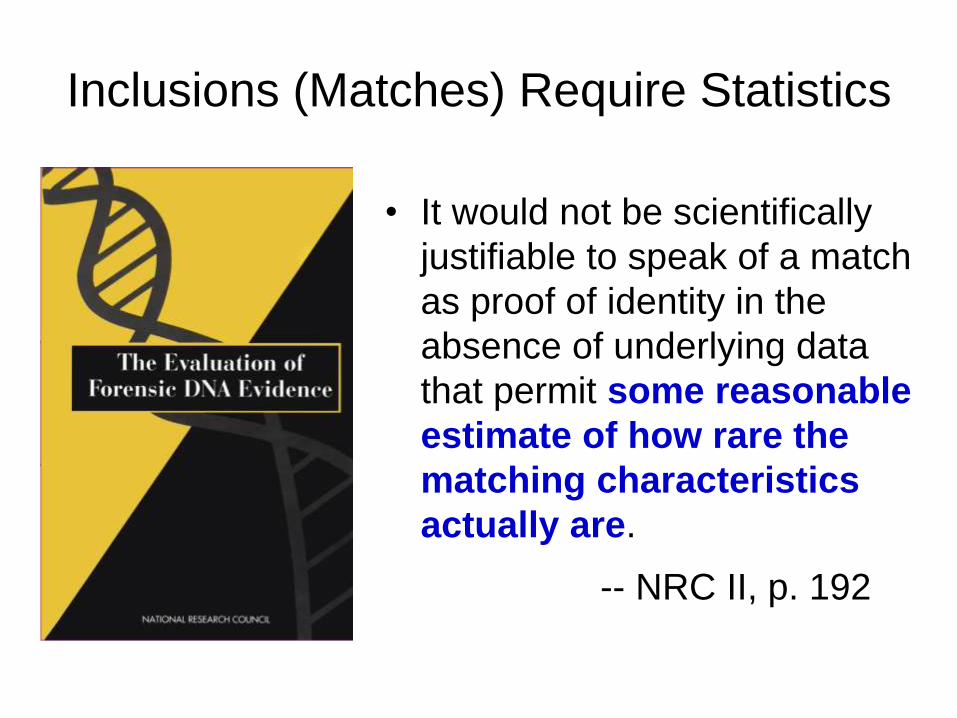
Inclusions (Matches) Require Statistics
• It would not be scientifically
justifiable to speak of a match
as proof of identity in the
absence of underlying data
that permit some reasonable
estimate of how rare the
matching characteristics
actually are.
-- NRC II, p. 192

Y-STR Population
Haplotype Frequencies
DNA Profile (with specific alleles)
Rarity estimate of the
specific DNA profile
Appropriate
genetic formulas
Population allele or
haplotype frequencies
2

Update
d fro
m J
.M. B
utler
(2012)
Advanced T
opic
s in F
ore
nsic
DN
A T
ypin
g: M
eth
odolo
gy, F
igure
13.1
0
On-line Y-STR Population Databases
Missouri has
>40,000 offender
samples typed
with PPY
US YSTR
17 Yfiler
12 PPY
11 SWGDAM
# Loci in Haplotype
# S
am
ple
s in
Da
tab
as
e
18719 samples
8548 samples
15395 samples
http://www.usystrdatabase.org
6998 Caucasian (US, Canada, Europe)
6301 African American
3429 Hispanic
1008 Asian (Chinese, Filipino, Oriental, S. Indian, Vietnamese)
983 Native American (Apache, Navajo, Shoshone, Sioux)
Release 2.6
Focus is on U.S. samples
Launched
Dec 2007
Jan 3, 2012
As of Jan 6, 2012
YHRD
11 SWGDAM
9 MHL
# Loci in Haplotype
# S
am
ple
s in
Da
tab
as
e
70997 samples
98084 samples
39339 samples
http://www.yhrd.org
99881 samples
51454 samples
17 Yfiler
12 PPY
Release 38
750 Populations (109 countries)
Launched
Feb 2000
Dec 30, 2011
4.6 x larger
3.7x larger
3.3x larger

13906
17215
17864
18199 18448
18547
18658
18719
13000
14000
15000
16000
17000
18000
19000
20000
USYSTR
Y-STR Haplotype Database Growth
65165
68108
72082
72055
74742
79147
81099
84047
86568
89237
91601 93290
97575
99881
60000
65000
70000
75000
80000
85000
90000
95000
100000
YHRD
Detailed YHRD data not available on their website below Release 25
Reaching a plateau?
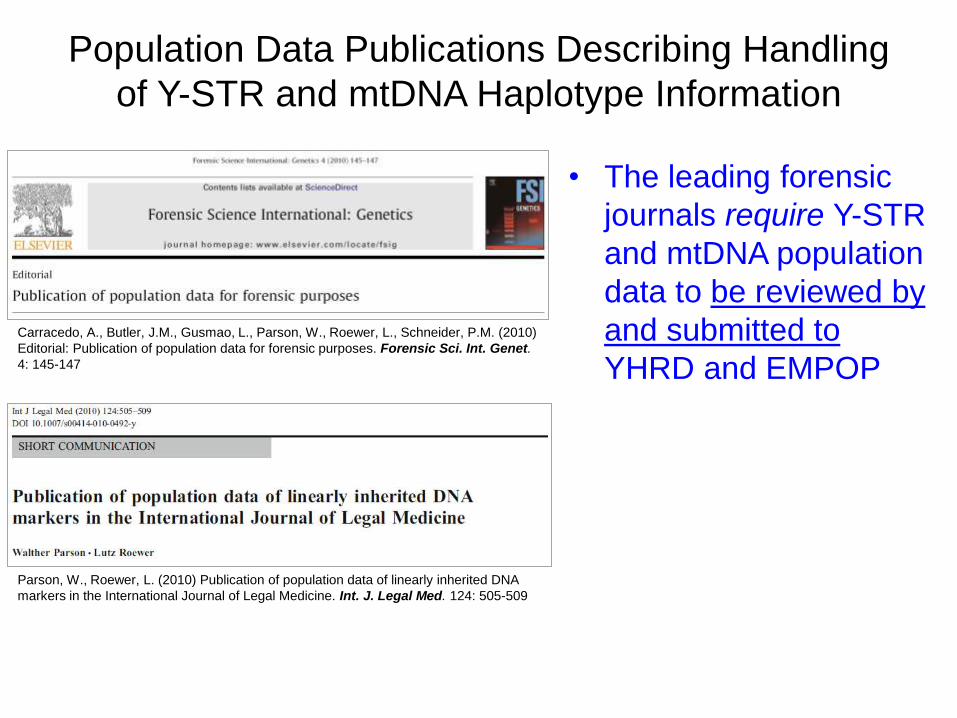
Population Data Publications Describing Handling
of Y-STR and mtDNA Haplotype Information
• The leading forensic
journals require Y-STR
and mtDNA population
data to be reviewed by
and submitted to
YHRD and EMPOP
Carracedo, A., Butler, J.M., Gusmao, L., Parson, W., Roewer, L., Schneider, P.M. (2010)
Editorial: Publication of population data for forensic purposes. Forensic Sci. Int. Genet.
4: 145-147
Parson, W., Roewer, L. (2010) Publication of population data of linearly inherited DNA
markers in the International Journal of Legal Medicine. Int. J. Legal Med. 124: 505-509

US YSTR Contributions
Contributor to US YSTR # Samples % of Database
Applied Biosystems (includes UNTHSC, NIST samples, …) 6,159 33%
Promega 3,800 20%
ReliaGene 3,037 16%
University of Arizona 2,462 13%
NCFS (University of Central Florida) 2,440 13%
Illinois State Police 398 2.1%
Santa Clara Co. CA Crime Lab 143 0.6%
Marshall University 113 0.6%
Washington State Patrol Crime Lab 40 0.2%
San Diego Sheriff‟s Regional Crime Lab 39 0.2%
CA DOJ 32 0.2%
Orange County CA Coroner 30 0.2%
Richland County Sheriff‟s Dept. 7 0.04%
18,719 Release 2.6 (Jan 3, 2012) 8548 17-locus profiles

US YSTR Database Search Results (with 17 loci)
0 matches in 8548 Yfiler profiles
US YSTR Database: www.usystrdatabase.org Search conducted Jan 6, 2012
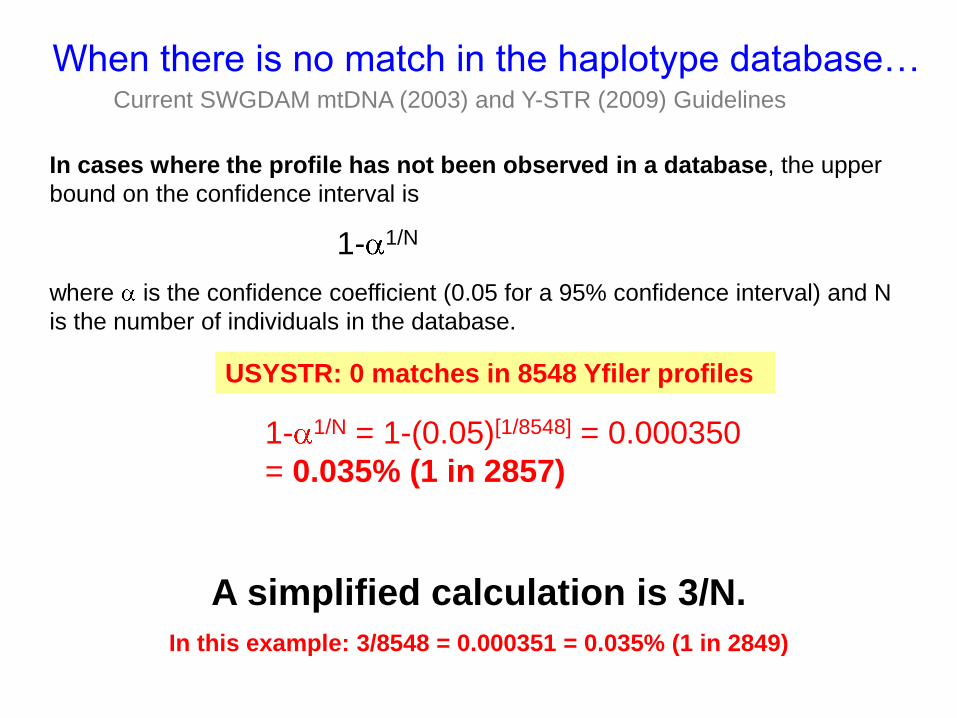
When there is no match in the haplotype database…
In cases where the profile has not been observed in a database, the upper
bound on the confidence interval is
1- 1/N
where is the confidence coefficient (0.05 for a 95% confidence interval) and N
is the number of individuals in the database.
1- 1/N = 1-(0.05)[1/8548] = 0.000350
= 0.035% (1 in 2857)
A simplified calculation is 3/N.
In this example: 3/8548 = 0.000351 = 0.035% (1 in 2849)
USYSTR: 0 matches in 8548 Yfiler profiles
Current SWGDAM mtDNA (2003) and Y-STR (2009) Guidelines
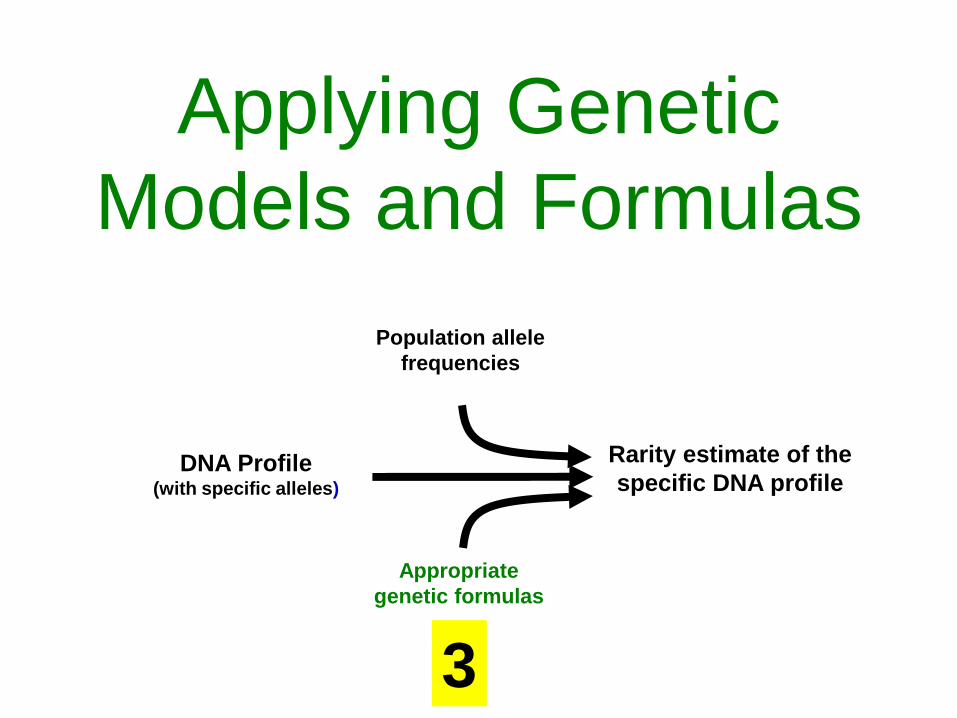
Applying Genetic
Models and Formulas
DNA Profile (with specific alleles)
Rarity estimate of the
specific DNA profile
Appropriate
genetic formulas
Population allele
frequencies
3

New Lineage Marker Interpretation Information
This article reviews and discusses a number of highly relevant topics:
• Normal vs. binomial (Clopper-Pearson) sampling distributions
• Theta corrections
• Handling rare haplotypes (Charles Brenner approach)
• Combination of lineage and autosomal markers
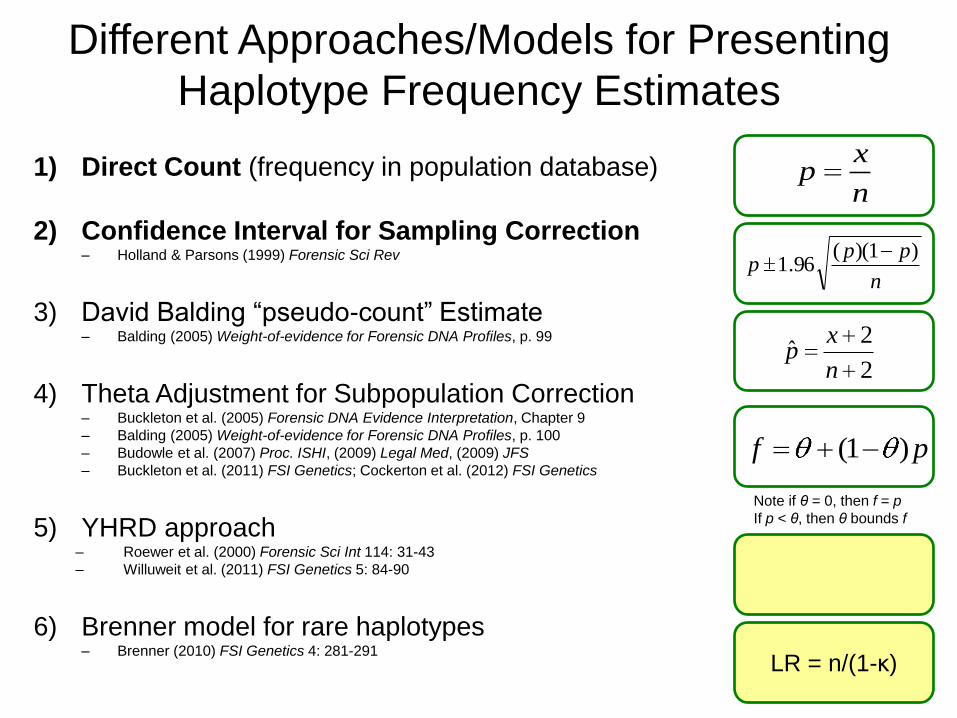
Different Approaches/Models for Presenting
Haplotype Frequency Estimates
1) Direct Count (frequency in population database)
2) Confidence Interval for Sampling Correction – Holland & Parsons (1999) Forensic Sci Rev
3) David Balding “pseudo-count” Estimate – Balding (2005) Weight-of-evidence for Forensic DNA Profiles, p. 99
4) Theta Adjustment for Subpopulation Correction – Buckleton et al. (2005) Forensic DNA Evidence Interpretation, Chapter 9
– Balding (2005) Weight-of-evidence for Forensic DNA Profiles, p. 100
– Budowle et al. (2007) Proc. ISHI, (2009) Legal Med, (2009) JFS
– Buckleton et al. (2011) FSI Genetics; Cockerton et al. (2012) FSI Genetics
5) YHRD approach – Roewer et al. (2000) Forensic Sci Int 114: 31-43
– Willuweit et al. (2011) FSI Genetics 5: 84-90
6) Brenner model for rare haplotypes – Brenner (2010) FSI Genetics 4: 281-291
n
ppp
)1)((96.1
n
xp
2
2ˆ
n
xp
pf )1(
Note if θ = 0, then f = p
If p < θ, then θ bounds f
LR = n/(1-κ)
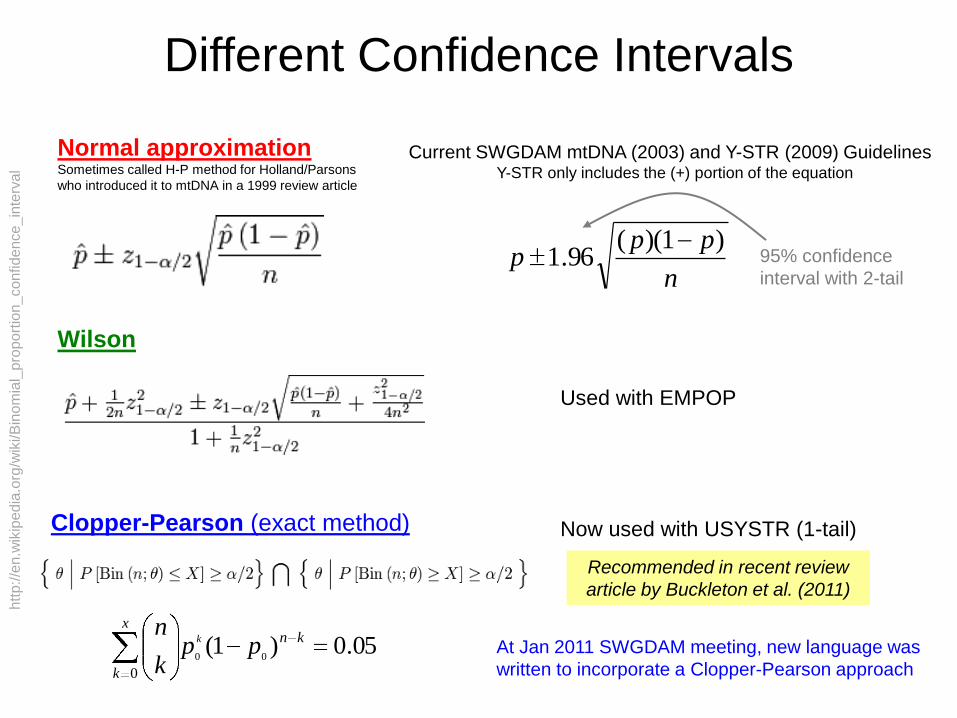
Different Confidence Intervals
Normal approximation Sometimes called H-P method for Holland/Parsons
who introduced it to mtDNA in a 1999 review article
Wilson
Clopper-Pearson (exact method)
htt
p://e
n.w
ikip
ed
ia.o
rg/w
iki/B
inom
ial_
pro
po
rtio
n_
con
fide
nce
_in
terv
al
n
ppp
)1)((96.1
Current SWGDAM mtDNA (2003) and Y-STR (2009) Guidelines Y-STR only includes the (+) portion of the equation
Used with EMPOP
where n =
database size, x
= the number of
observations of
the haplotype in
the database, k =
0, 1, 2, 3 … x
observations,
and p = the
haplotype
frequency at
which x or fewer
observations are
expected to
occur 5% of the
time.
05.0)1(00
0
knx
k
ppk
nk
Now used with USYSTR (1-tail)
95% confidence
interval with 2-tail
Recommended in recent review
article by Buckleton et al. (2011)
At Jan 2011 SWGDAM meeting, new language was
written to incorporate a Clopper-Pearson approach

Comparison of Clopper-Pearson to Normal (Standard)
Confidence Intervals (C.I.)
http
://e
n.w
ikip
ed
ia.o
rg/w
iki/F
ile:C
om
pa
riso
nC
on
fid
en
ce
Inte
rva
ls.p
ng
Higher value is more conservative (favors the defendant)
Database size of 40 Database size of 400
≈0.175
Clopper-
Pearson
≈0.125
Normal
(standard)
With two matches in a database of 40
Note that the Wilson
upper bound interval
is very close to the
Clopper-Pearson

n x P (=x/n) HP
(1-tail) HP
(2-tail) CP
100 1 0.01 0.026 0.029 0.047
2 0.02 0.043 0.047 0.062
10 0.10 0.149 0.159 0.164
1,000 1 0.001 0.0026 0.0029 0.0047
2 0.002 0.0043 0.0048 0.0063
10 0.010 0.0152 0.0162 0.0169
10,000 1 0.0001 0.0003 0.0003 0.0005
2 0.0002 0.0004 0.0005 0.0006
10 0.0010 0.0015 0.0016 0.0017
Exact vs. Normal Confidence Intervals
HP: Holland, M.M., & Parsons, T.J. (1999). Mitochondrial DNA sequence analysis - validation and use for forensic casework. Forensic Science Review, 11, 21-50.
CP: Clopper, C.J., & Pearson, E.S. (1934). The use of confidence or fiducial limits illustrated in the case of the binomial. Biometrika, 26, 404-413.

US Y-STR Database versus YHRD
US: Advantages
• Relevance: US population data mainly
• Direct community involvement
• Customer service (e.g., ad hoc searches)
• SWGDAM responsiveness
• Accepted in US Courts (2 Frye hearings)
US: Disadvantages
• Cost of maintenance
• Smaller database size
• Limited number of
ancestral populations
• Difficulty in obtaining
samples/data from US
community
– Low rate of growth
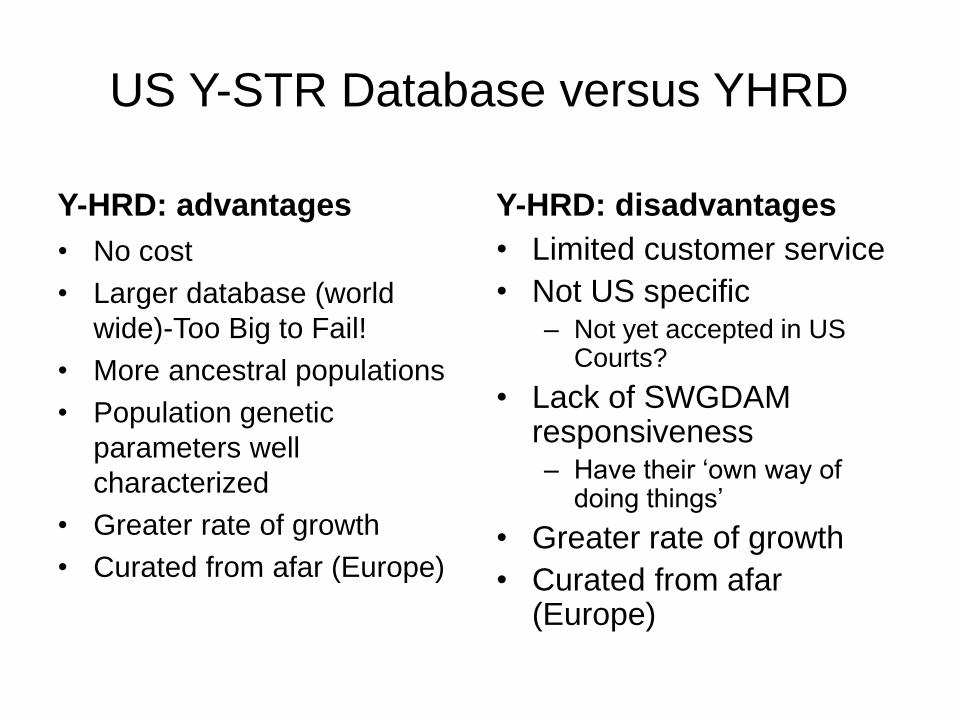
US Y-STR Database versus YHRD
Y-HRD: advantages
• No cost
• Larger database (world
wide)-Too Big to Fail!
• More ancestral populations
• Population genetic
parameters well
characterized
• Greater rate of growth
• Curated from afar (Europe)
Y-HRD: disadvantages
• Limited customer service
• Not US specific – Not yet accepted in US
Courts?
• Lack of SWGDAM responsiveness – Have their „own way of
doing things‟
• Greater rate of growth
• Curated from afar (Europe)
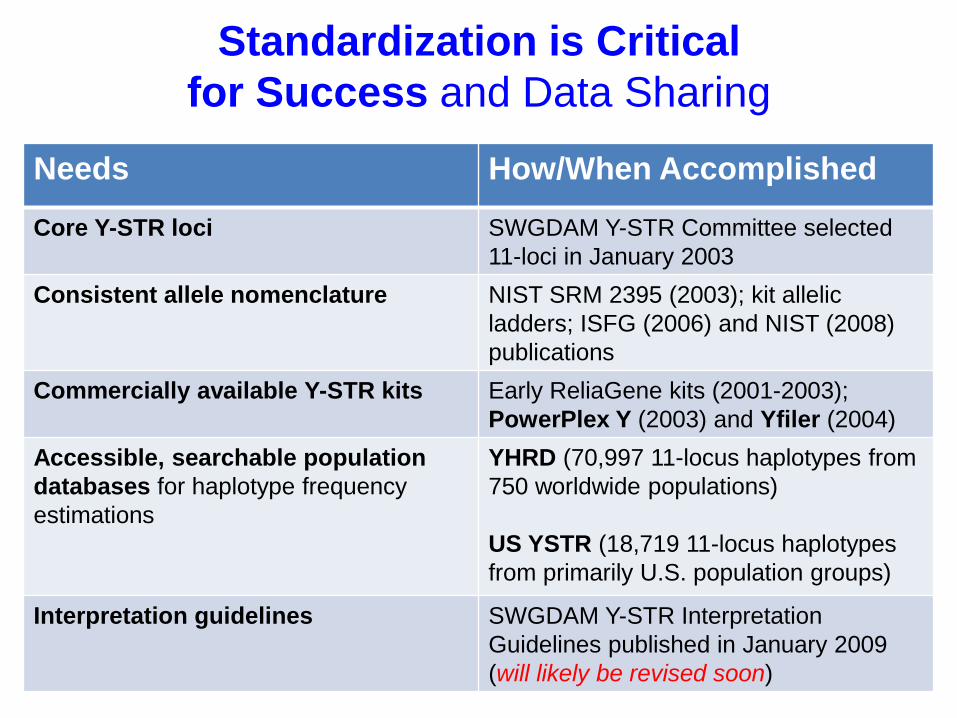
Standardization is Critical
for Success and Data Sharing
Needs How/When Accomplished
Core Y-STR loci SWGDAM Y-STR Committee selected
11-loci in January 2003
Consistent allele nomenclature NIST SRM 2395 (2003); kit allelic
ladders; ISFG (2006) and NIST (2008)
publications
Commercially available Y-STR kits Early ReliaGene kits (2001-2003);
PowerPlex Y (2003) and Yfiler (2004)
Accessible, searchable population
databases for haplotype frequency
estimations
YHRD (70,997 11-locus haplotypes from
750 worldwide populations)
US YSTR (18,719 11-locus haplotypes
from primarily U.S. population groups)
Interpretation guidelines SWGDAM Y-STR Interpretation
Guidelines published in January 2009
(will likely be revised soon)

Predictions for the Future of Y-STR Analysis
• Continued use with casework (with excess female DNA)
• Improved frequency estimates with growing Y-STR databases – YHRD now at 70,997 11-locus profiles (39,339 Yfiler)
– USYSTR has 18,719 11-locus profiles (8,548 Yfiler)
• Use with familial searching to eliminate false positives – Myers, S.P. et al. (2011) FSI Genetics 5(5): 493-500 – describes CA DOJ familial searching
• New Y-STR kits with additional loci – At the ISHI meeting, Promega announced a Y-STR 23plex was being developed
– Will take time though to grow large population databases that cover all of the new loci
• Use of fast mutating loci to help resolve paternal lineages (e.g., to separate brothers or father/son haplotypes)
– Ballantyne, K.N. et al. (2010) Am J Hum Genet 87(3): 341-353
– Ballantyne, K.N. et al. (2012) FSI Genetics (in press)
• In some cases, being able to put a lineage name to an unknown Y-STR profiles using on-line genetic genealogy information

Results of a Genetic Genealogy Search with an “unknown” profile using (14 of 17) Yfiler loci
17 of 20 full matches
are “Butlers”
Other 3 are Butlers but didn’t know it… (adoption or other happenings in the gene pool of the past!)
www.Ysearch.org Search conducted Jan 5, 2012
104,015 Records
80,143 Different Haplotypes
74,907 Surnames
Currently larger than YHRD –
but serves a different purpose
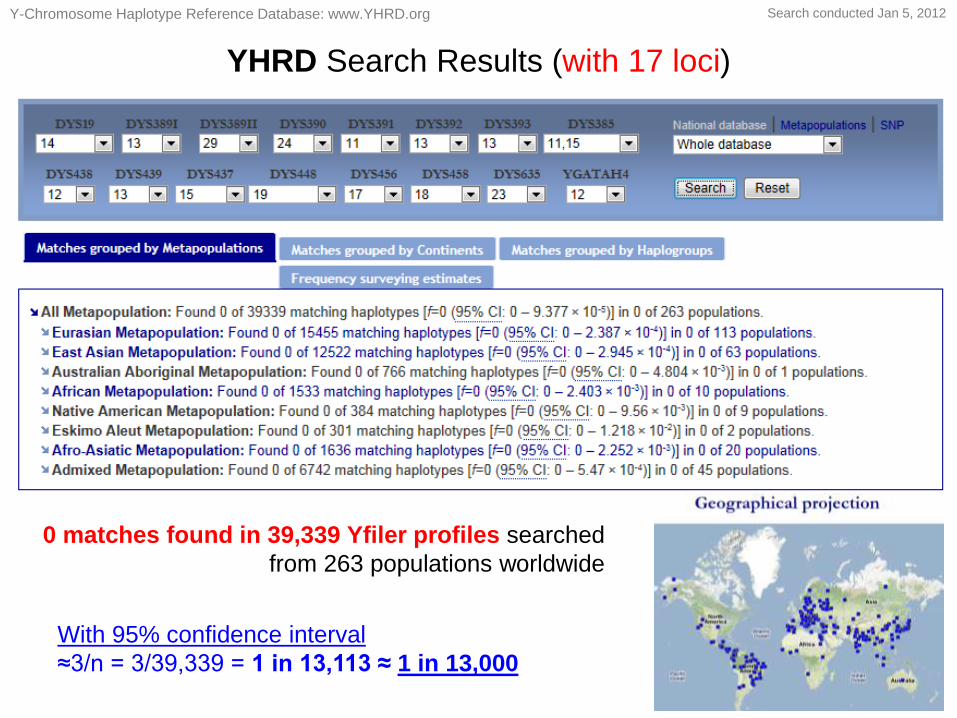
YHRD Search Results (with 17 loci)
0 matches found in 39,339 Yfiler profiles searched
from 263 populations worldwide
With 95% confidence interval
≈3/n = 3/39,339 = 1 in 13,113 ≈ 1 in 13,000
Y-Chromosome Haplotype Reference Database: www.YHRD.org Search conducted Jan 5, 2012

http://withfriendship.com/user/vinus/family-tree.php
How Many Butler Y-chromosomes Are Out There?
Katherine Butler
PhD student at George
Washington University;
Former TL of Bode
Technology Group;
Former VA DFS scientist
John Butler
Some interesting points:
1. Katherine’s father possesses an identical Yfiler 17-locus profile to John
2. The first known Butler in John‟s lineage came to Virginia in the early 1700s –
Katherine‟s family has been in Virginia since about the same time
3. Based on review of what they know from their family histories, they cannot be
closer than sixth or seventh cousins (their 5th great-grandfathers differ)
4. Potentially thousands of male Butlers have this same Yfiler haplotype – or
one very similar due to mutation at individual Y-STR loci
5. A YHRD search that results in a value of 0 out of 39,339 Yfiler profiles does
not reflect the true haplotype frequency in the world (and especially Virginia)
NIST

Summary of Issues
Forensic
Sample
population
studies
Haplotype Frequency
Estimate (of lineage not the individual)
Y-STR
Profile
mtDNA
sequence (or difference
from reference)
htt
p:/
/ww
w.p
sdgra
phic
s.c
om
/backgro
unds/w
orl
d-g
lobe-b
ackgro
und/
Real-World
Population Variation
? What the court
wants to know…
Assume pop data
representative of
real-world
PP Y
Yfiler
HV1/HV2
control region
mtGenome?
1
Online
Population
Database
EMPOP
YHRD
US YSTR
2
Can θ correction help with
this sampling issue?
Primary Steps Involved:
1 - Generate profile (Y or mtDNA)
2 - Query population database
3 - Report frequency estimate (with adjustment?)
Want good quality data
going into database

UCF Acknowledgments
Funding from …
UCF Past and Present Team Members: Erin Hanson, Lyn Fatolitis, Paulina Berdos
USYSTR Collaborators and Contributors:
ReliaGene, Promega , Applied Biosystems, University of Arizona
Illinois State Police, Orange County CA Coroner, Santa Clara County CA,
DOJ Sacramento, Marshall University, WSP Vancouver, Richland County
Sheriff SC, San Diego County Sheriff

NIST Acknowledgments
Funding from interagency agreements 2008-IJ-R-029 (and previously 1999 & 2003) between the National Institute of
Justice and the NIST Office of Law Enforcement Standards
http://www.cstl.nist.gov/biotech/strbase/y_strs.htm
NIST Past and Present Team Members: Amy Decker, Richard Schoske, Christian Ruitberg, Jill Appleby,
Mike Coble, Becky Hill, Margaret Kline, Peter Vallone, Dave Duewer
Collaborators: Mike Hammer, Alan Redd, Tom Reid,
ISFG DNA Commission, SWGDAM Y-STR Committee
http://www.cstl.nist.gov/biotech/strbase/YmtDNAworkshop.htm