y harles satterfield and nick nigro...as the passenger ev market grows in the united states, public...
TRANSCRIPT

This Photo by Unknown Author is licensed under CC BY
A Financial Analysis of Common EV Charging Business Models for Retail Site Hosts
By Charles Satterfield and Nick Nigro
This Photo by Unknown Author is licensed under CC BY-SA

As the passenger electric vehicle (EV) market grows in the United States, public charging infrastructure has not kept pace, and this gap is expected to grow as EV prices drop and vehicles sales expand into new markets. Retailers are uniquely positioned to shrink the existing public charging infrastructure gap by installing EV charging stations at their store locations. Hosting an EV charging station offers a range of potential benefits for retailers, including direct revenue from charging station use, increased sales, and improved corporate branding. The Center for Climate and Energy Solutions, David Gardiner and Associates, Atlas Public Policy, and the Retail Industry Leaders Association are investigating the business models in the current market that are or could be used to make installation of charging infrastructure economically feasible for retail locations. This brief by Atlas Public Policy examines common business models employed by charging service providers and provides analysis that explores potential financial scenarios for charging infrastructure hosts.
There is a growing need for public EV charging infrastructure in the United States. As sales of electric passenger vehicles have increased over time, deployment of charging infrastructure has not kept pace. As the price of these vehicles drops and they penetrate new markets, particularly that of individuals residing in multi-unit dwellings or renting their home, the need for public charging options will only increase.
Retailers, both as places of commerce and employers, are ideal candidates to serve as site hosts for EV charging stations. Hosting EV charging stations can offer a range of benefits to retailers including:
• Increased in-store retail sales from customers spending time in stores while waiting for their vehicles to charge
• Corporate branding as environmentally conscious
• New revenue streams from direct sale of charging to customers or advertising revenue
• Customer and employee attraction
The market for EV charging site hosts is typified by two primary business models: owner-operator and third-party owned and operated. The charging station owner is responsible for installation, operation, and maintenance, but also has control over the price to charge vehicles and the overall customer experience.
When the retail site host is the owner-operator, they assume the risks associated with operation and maintenance costs but also can choose to set a pricing structure that best suits the needs of their business and customers. There are a wide range of pricing structures available, but they typically fall into one of three categories: No Fee, Nominal Fee to Cover Costs, and Profit Center. Under the No Fee pricing structure, charging is provided solely as an amenity and there is no cost to charge vehicles. Under the Nominal Fee to Cover Costs pricing structure, fees are set only high enough to recoup operational and/or installation costs and insulate the owner-operator from spikes in operational costs. Under the Profit Center pricing structure, the fee for charging is designed to turn a profit from the sale of charging services.
To investigate potential financial scenarios for retail site hosts, Atlas Public Policy performed a multivariate analysis using their EV Charging Financial Tool. The analysis objective was to evaluate the effect of factors such as retail customer in-store dwell time, charging station fee structure, charging station utilization, and expected
retail customer sales revenue on the value proposition for various EV charging station business models. The results of the analysis provided detailed estimates of potential financial scenarios for retail site hosts, insights from which are discussed in the section below
• Retail site hosts face a trade-off between limiting financial risk and maximizing profit when deciding between relying on a third-party charging station owner-operator and acting as the charging station owner-operator. Limiting a retail site hosts exposure to the risks associated with operational, installation, and maintenance costs by relying on a third party owner-operator also limited profit potential in the analysis. Scenarios that relied on a third party owner-operator were all profitable for the retail site host, but had an average net present value (NPV) of less than half that of scenarios where the retail site host was also the owner-operator of the charging stations. However, the risks associated with owning and operating a charging station should not be understated. The analysis did not include variations in operating cost, installation or equipment costs, estimates of the employee time necessary to select an appropriate equipment vendor or learn detailed information about utility rate structures and how they could impact costs, or other factors which may negatively affect station profitability.
• To optimize sales revenue, retail site hosts should design fee structures to achieve longer dwell times, but also create sufficient customer turnover, as in-store retail revenues per customer tapered off after extended dwell time. The increase in average station NPV between scenarios with a 25 and 50 minute customer in-store dwell time was over five times greater than the increase in average NPV between scenarios with a 50 and 75 minute in-store dwell time.
• Retail site hosts with lower expected customer spend per visit should focus primarily on achieving a high turnover of customers. Doubling station utilization for scenarios which had a maximum expected customer retail spend of $25 increased the number of profitable scenarios to above 90 percent.
• Retail site hosts should use information on average in-store customer revenue per minute to design fee structures that optimize dwell time for their business. Retailers with low expectations of customer spend per minute can achieve the same sales revenue as more expensive retail locations by choosing a fee structure aimed at increasing customer dwell time such as session-based fees or free charging for a set period of time.
• Ensuring high initial utilization was critical for achieving profitability. Doubling the rate of initial station utilization increased average station NPV by nearly 20 percent.
• Grant funding was important for mitigating the risk of unprofitability but had a relatively small impact on profitability in comparison to other variables. Including grant funding for station purchase and installation was an effective guard against unprofitability for station owner-operators. However, grant funding did little to raise the ceiling of station profitability for retail site hosts.
• Higher numbers of stations per site offered savings on fixed site costs. Costs for station installation like utility upgrades and charging station siting may not rise with the number of charging stations and are an important consideration for site hosts deciding on the number of charging stations to install.
• Indirect revenue sources were significantly more important than user fees for ensuring high charging station NPV, but user fees were an effective tool to mitigate the risk of unprofitability. Across all scenarios that included a user fee, charging fees accounted for roughly eight percent of the total nominal profit with the remainder being made up by advertising profit and retail sales profit. Even though user fees made up a relatively small portion of the overall station profit, they were nonetheless an effective hedge against operating costs and introducing even the smallest modeled user fee cut the number of unprofitable scenarios nearly in half.
• Advertising is a potentially important source of revenue for site hosts. Of all modeled revenue sources, advertising revenue had the largest impact on profitability. However, this revenue would be entirely dependent on where the charging station would be sited and the value advertisers would see in using it (e.g., how much foot traffic the site would experience).
As the passenger EV market grows in the United States, public EV charging stations will become increasingly important to serve the charging needs of millions of drivers. For retailers, EV charging stations offer an opportunity to produce new revenue streams or expand on existing ones while also advancing broader efforts to reduce global greenhouse gas emissions. This brief provides an overview of EV market growth and the role of public charging options, along with the potential benefits to retailers of hosting EV charging infrastructure.
Box 1. Important Terms
Some helpful definitions for the terms used in the discussion below:
• Public Charging: Charging that occurs at a location other than at a residence, similar to refueling at a public gas station
• Charging Site: A location that offers EV charging. Charging sites can have multiple charging stations, each with one or more charging ports.
• Site Host: The entity that owns the property where a charging site is located.
• Dwell Time: The time retail customers spend in stores. For this brief, dwell time refers specifically to the time customers spend in store while waiting for their vehicles to charge
• Net Present Value: The present-day value of future income. For this brief, all scenarios assume a 10-year lifetime for charging stations
• Level 2 Charging Station: A charging station that adds between 12 and 60 miles of passenger EV range per hour of charge time, depending on electricity output, with most common options adding roughly 25 miles of EV range per hour of charge time.
• DC Fast Charging Station: A charging station that adds between 60 and 100 miles of passenger EV range in 20 minutes of charge time, depending on electricity output.
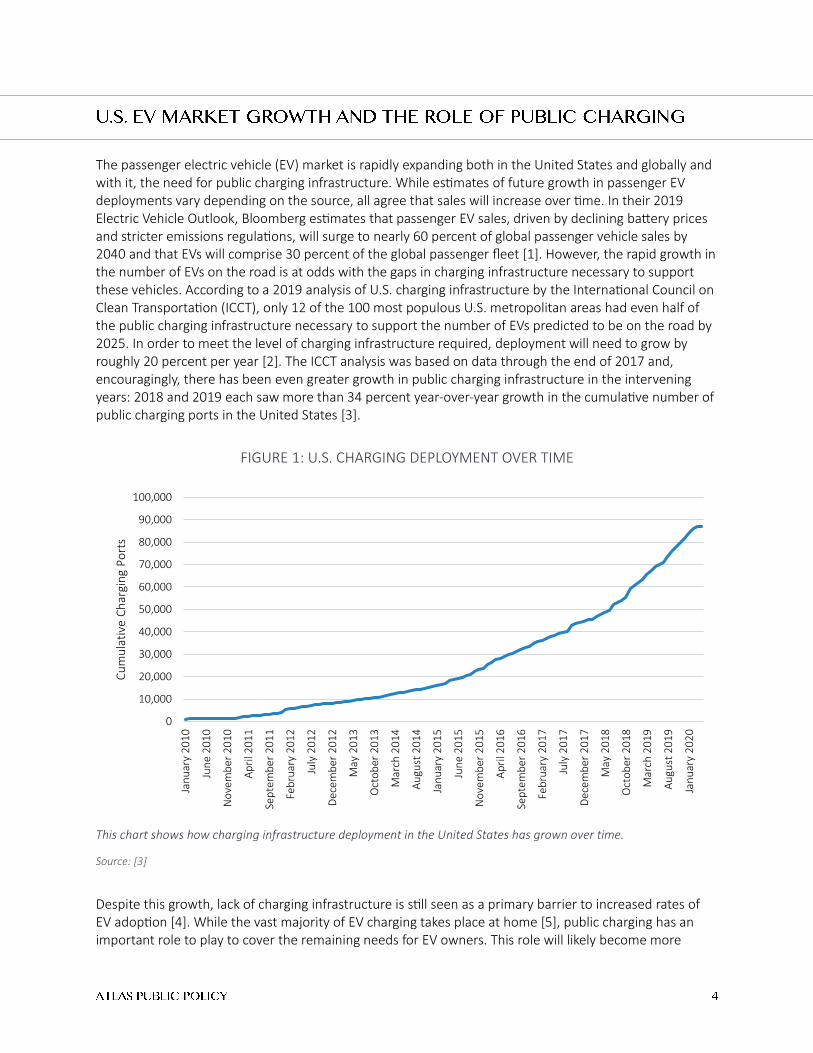
The passenger electric vehicle (EV) market is rapidly expanding both in the United States and globally and with it, the need for public charging infrastructure. While estimates of future growth in passenger EV deployments vary depending on the source, all agree that sales will increase over time. In their 2019 Electric Vehicle Outlook, Bloomberg estimates that passenger EV sales, driven by declining battery prices and stricter emissions regulations, will surge to nearly 60 percent of global passenger vehicle sales by 2040 and that EVs will comprise 30 percent of the global passenger fleet [1]. However, the rapid growth in the number of EVs on the road is at odds with the gaps in charging infrastructure necessary to support these vehicles. According to a 2019 analysis of U.S. charging infrastructure by the International Council on Clean Transportation (ICCT), only 12 of the 100 most populous U.S. metropolitan areas had even half of the public charging infrastructure necessary to support the number of EVs predicted to be on the road by 2025. In order to meet the level of charging infrastructure required, deployment will need to grow by roughly 20 percent per year [2]. The ICCT analysis was based on data through the end of 2017 and, encouragingly, there has been even greater growth in public charging infrastructure in the intervening years: 2018 and 2019 each saw more than 34 percent year-over-year growth in the cumulative number of public charging ports in the United States [3].
FIGURE 1: U.S. CHARGING DEPLOYMENT OVER TIME
This chart shows how charging infrastructure deployment in the United States has grown over time.
Source: [3]
Despite this growth, lack of charging infrastructure is still seen as a primary barrier to increased rates of EV adoption [4]. While the vast majority of EV charging takes place at home [5], public charging has an important role to play to cover the remaining needs for EV owners. This role will likely become more
0
10,000
20,000
30,000
40,000
50,000
60,000
70,000
80,000
90,000
100,000
Jan
uar
y 2
01
0
Jun
e 2
01
0
No
vem
ber
20
10
Ap
ril 2
01
1
Sep
tem
ber
20
11
Feb
ruar
y 2
01
2
July
20
12
Dec
em
ber
20
12
May
20
13
Oct
ob
er 2
01
3
Mar
ch 2
01
4
Au
gust
20
14
Jan
uar
y 2
01
5
Jun
e 2
01
5
No
vem
ber
20
15
Ap
ril 2
01
6
Sep
tem
ber
20
16
Feb
ruar
y 2
01
7
July
20
17
Dec
em
ber
20
17
May
20
18
Oct
ob
er 2
01
8
Mar
ch 2
01
9
Au
gust
20
19
Jan
uar
y 2
02
0
Cu
mu
lati
ve C
har
gin
g P
ort
s

crucial as the price of EVs drops and these vehicles begin to penetrate new markets, particularly individuals who rent rather than own their home. As of 2018, homeowners are more than three times more likely to own an EV than renters, even when taking income levels and existing vehicle ownership into consideration [6]. Individuals who rent typically have limited or no access to home charging will likely rely more heavily on public charging solutions [4].
Retailers, both as places of work and commerce, have the opportunity to play an important part in expanding access to public charging infrastructure [7]. Retail stores can serve as EV charging site hosts for customers, who make billions of trips to stores annually. Relatedly, the retail industry employs nearly five million individuals [8], many of whom drive to work at a store, distribution center, or corporate headquarters building and could be regular users of workplace EV charging stations. This is particularly true for retailers in major urban areas where a higher proportion of the population resides in multi-unit dwellings, buildings which typically have more limited access to dedicated parking and charging infrastructure compared to single unit dwellings [9].
Box 2. Charging Stations Offer Multiple Benefits to Retail Site Hosts
Increased Revenue Generation Retailers can gain additional revenue from fees for charging station use when acting as the owner-operator or from leasing revenue when relying on a third party owner-operator. A unique advantage for retailers is the ability to generate retail sales revenue from customers either coming to a store for the purpose of using the charging station or spending longer in stores while waiting for their vehicle to charge. Charging stations can also bring in additional revenue by serving as a vehicle for advertising.
Corporate Branding Hosting EV charging stations can signal a retailer’s commitment to advancing sustainability goals while helping to reduce transportation greenhouse gas emissions
Customer and Employee Attraction Customers prefer to shop at, and employees prefer to work for environmentally conscious businesses. Beyond serving as an attraction to draw in customers, EV drivers are likely to return to shop at locations that offer EV charging.
Hosting EV charging stations offers a range of benefits to retailers beyond direct revenue from the equipment’s use. During an early nationwide rollout of charging infrastructure, Idaho National Laboratory reported that the chief benefit to a retail charging infrastructure site host was the opportunity to attract more customers [10], a finding echoed in a 2019 charging business model analysis by Atlas Public Policy. That analysis for the New York State Energy Research and Development Authority (NYSERDA) saw an increase in charging station profitability of over 100 percent for nearly all types of charging sites when modeling additional revenue from retail sales resulting from customers spending additional time in retail stores while waiting for their vehicles to charge. In that study, ten percent of the retail sales revenue assumed to be generated from customers either coming to a location for the charging infrastructure or staying at a store longer while charging their vehicle would be shared with charging infrastructure operators via a revenue sharing agreement [11].

TABLE 1: NET PRESENT VALUE COMPARISON OF NEW YORK CHARGING SITES WITH AND WITHOUT REVENUE SHARING FROM INCREASED RETAIL CUSTOMER SALES.
Archetype Group No Revenue Share Revenue Share NPV Improvement (%)
Hotel ($11,037) ($10,266) 7%
Leisure $4,598 $11,422 148%
Multi-Family ($3,199) $1,631 151%
NYC Garage $5,056 $9,299 84%
Parking Garage $4,485 $11,747 162%
Retail ($1,843) $2,759 250%
Transit $4,669 $11,029 136%
Workplace $5,733 $14,031 145%
This table shows the effects on average net present value over the 10-year lifespan of a charging station when
including a revenue sharing agreement. There is a noticeable improvement in the profitability of the station when
sharing ten percent of revenue from increased sales due to attracting new customers or increasing sales of existing
customers via additional dwell time in stores.
Source: [11]
Even if not attracting new EV customers, a market segment typified by high income individuals [12], retailers can increase the amount of time existing customers spend in stores while they wait for their vehicles to charge. A case study by the largest EV charging service provider in the United States (ChargePoint) found that customer dwell time increased by 50 minutes in a small scale deployment of EV charging stations at a retail location [13]. Analysis of the data from thousands of charging sessions across Columbus, Ohio; Austin, Texas; and Seattle, Washington by the National Renewable Energy Laboratory and New York State by Atlas Public Policy support this claim with average charging times of over two hours at retail locations [11, 14], a figure considerably higher than average store dwell times of 30 to 40 minutes reported by the Path to Purchase Institute for several large warehouse club chains, department stores, and grocery stores [15].
Outside of traditional revenue sources, retail site hosts for EV charging infrastructure can benefit from corporate branding, customer loyalty, and new advertising opportunities [16]. Such considerations were among those listed by commercial site hosts recruited as part of the EV Project, a project led by the Idaho National Laboratory to install EV charging infrastructure across the United States from 2011 to 2013 [10]. Major charging service providers EVgo, Blink, and ChargePoint all tout the benefits of hosting EV charging stations, citing statistics on the high percentage of customers and employees that prefer to buy or work for environmentally conscious or “green” businesses and how EV charging helps contribute to that reputation, as well as the likelihood of EV drivers to return to businesses that offer EV charging [17, 18, 19].

The market for EV charging site hosts is typified by two primary business models: owner-operator and third-party owned and operated. In the owner-operator business model, the site host owns and operates the EV charging infrastructure. The owner-operator has complete control over the price to charge vehicles but is also often responsible for working with their electric utility company, obtaining permits, coordinating station maintenance, and covering any operating costs associated with the charging infrastructure. In the third-party owned and operated business model, the site host leases space to a third-party who then installs and operates the charging infrastructure. In this case, the site host typically has limited or no control over the price for customers to charge their vehicles, but is also not responsible for station maintenance, utility coordination, or other operational costs.
In the owner-operator business model, a site host will purchase EV charging equipment from a charging service provider such as ChargePoint, SemaConnect, or Blink and then work with a separate contractor to perform construction and installation. After installation, the operation, maintenance, utility interconnection, and any other considerations for operating the charging station are the responsibility of the owner-operator, though charging service providers offer warranties that cover repair and replacement of parts and assistance with common issues encountered when coordinating with utilities. An additional service often purchased by owner-operators from EV equipment manufacturers is charging station management software. This software, referred to as network access, allows owner-operators to easily track station usage, make their station locatable via mobile app-based software, and manage pricing and customer payment.
A primary advantage of being an owner-operator of charging infrastructure is control over pricing and, more broadly, consistency and optimization of customer experience. This control comes at a price, however, as owner-operators are responsible for station maintenance and operational costs as well as coordination with utilities and having detailed knowledge of electricity rate structures. This last aspect can be particularly important if the charging station is run off the retail store’s existing electricity meter. In those cases, referred to as operating “behind the meter,” balancing the optimal pricing structure with the existing electricity demand can become highly complicated. If owner-operators locate their charging stations in unfavorable markets or pursue fee structures that negatively impact utilization or dwell time, then the costs of operating stations can exceed the benefits. Alternatively, well-sited charging stations have the potential to bring significant financial benefits to the owner-operator [5].
When choosing a fee structure, owner-operators have a wide range of options though typically fees fall into one of three categories: No Fee, Nominal Fee to Cover Costs, and Profit Center (see Figure 2).

FIGURE 2: FEE STRUCTURES FOR CHARGING STATIONS
* Depending on electric utility rate structures and collective electricity use of charging stations, station owners can
incur expensive fees from utilities for exceeding set levels of electricity use in a given period known as demand
charges. This is particularly true for charging stations which are “behind the meter” and are part of the power
demands of the retail facility as opposed to stations that have a separate meter.
The choice behind each fee structure depends on how owner-operators intend for charging infrastructure to be used. For example, charging higher fees could discourage use or limit the amount of time customers spend charging. During the EV Project, Idaho National Laboratory found that introducing user fees at Level 2 charging stations did not reduce the number of charging events, but did reduce the “connect” time at charging stations, defined as time spent at EV charging stations after energy flow had ceased [20]. Conversely, Blink DC Fast Chargers installed as part of the EV Project saw the number of charge events decrease after the introduction of per-session fees, but saw the length of time spent charging increase, presumably so customers could get the full value of the session they had paid for [5]. Each of these considerations could be important for a retail site host trying to strike a balance between additional customer dwell time and having a high customer turnover rate or trying to achieve a high station utilization while also charging a sufficient fee to turn a profit [21].
Third-party owner-operators seek to collect revenue directly from the use of the charging station and may charge fees for membership to access their network of charging stations and use of the charging station itself, either in the form of fees per unit of electricity delivered or fees per minute of connect time. However, there is at least one third-party charging service provider, Volta, who provides unlimited Level 2 charging time or 30 minutes of DC fast charging time for free and instead focuses on advertising revenue
No Fee
Charging is offered for free to customers solely as an amenity. Value is derived from alternative sources such as increased sales or corporate branding.
Nominal Fee to Cover Costs
Fees are set high enough to recoup operational and/or installation costs and insulate the owner-operator from spikes in costs from increased utilization.* Fees are typically set as a price per kilowatt-hour of electricity delivered, per unit of time, or per charging session.
Profit Center
The fee for charging is designed to turn a profit from the sale of charging services. Fees are typically set as a price per kilowatt-hour delivered, per unit of time, or per charging session.
[22]. These stations show advertisements both directly to station users and to passersby via a video display on either side of the charging station, approximately the size of static displays seen at a mall or bus stop. From the perspective of a site host, these third-party charging service providers typically enter into agreements to lease space in the host’s parking lot where they install and operate charging infrastructure and remit to the site host a leasing fee or a share of revenue from the charging station.
For a site host, the advantages of relying on a third-party to own and operate charging infrastructure include limiting the site host’s exposure to operational cost overruns, unexpected maintenance, or complicated utility interconnections. Depending on the leasing agreement, the rental income from the charging stations should provide a consistent stream of revenue to the site host, regardless of the profitability of the stations. A retail site host is still able to reap the benefits of additional sales revenue from new customers or customers who spend more time in stores, though the site host may decide to subsidize the charging station by offering discounts on leasing space, sharing installation costs, or in an alternative manner.
The disadvantages of relying on a third-party charging service provider are that the site host may relinquish control over the customer experience and give up the opportunity to realize the full amount of revenue from the charging station’s operation. For a retailer, it is important to ensure consistency of customer experience, but third-party charging service providers typically maintain control over relevant factors like station maintenance, appearance, uptime, and fee structures. While a lease agreement can include provisions and requirements about these factors, it is ultimately the third-party charging service provider who is in control as they are the owner of the charging station. Beyond customer experience, having control over the charging fees can allow a retail site host to optimize the behavior of charging station users and set rates that either encourage high turnover or extended customer dwell time.
Of primary concern to retail site hosts for EV charging infrastructure is the potential profitability of each of the charging business models described in the previous section. To help potential site hosts understand the circumstances under which different business models are financially viable, a multivariate analysis was completed using Atlas Public Policy’s EV Charging Financial Analysis Tool. The tool, originally developed in partnership with the Cadmus Group and available for free at https://atlaspolicy.com/rand/ev-charging-financial-analysis-tool, allows users to customize a wide range of inputs to compare the expected profitability of EV charging stations under a multitude of scenarios.
To determine the types of scenarios to examine and the EV charging factors to alter, data was gathered from published sources and interviews with industry experts from Fortune 500 retailers, utilities, and third-party EV charging service providers. The analysis objective was to evaluate the effect of factors such as retail customer in-store dwell time, fee structure, charging station utilization, and expected retail customer sales revenue on the value proposition for various EV charging station business models. The analysis consisted of more than 20,000 scenarios in order to provide an overview of what retail site hosts can expect under various circumstances (see Figure 3). For a full list of tool inputs and data sources, see Appendix A.
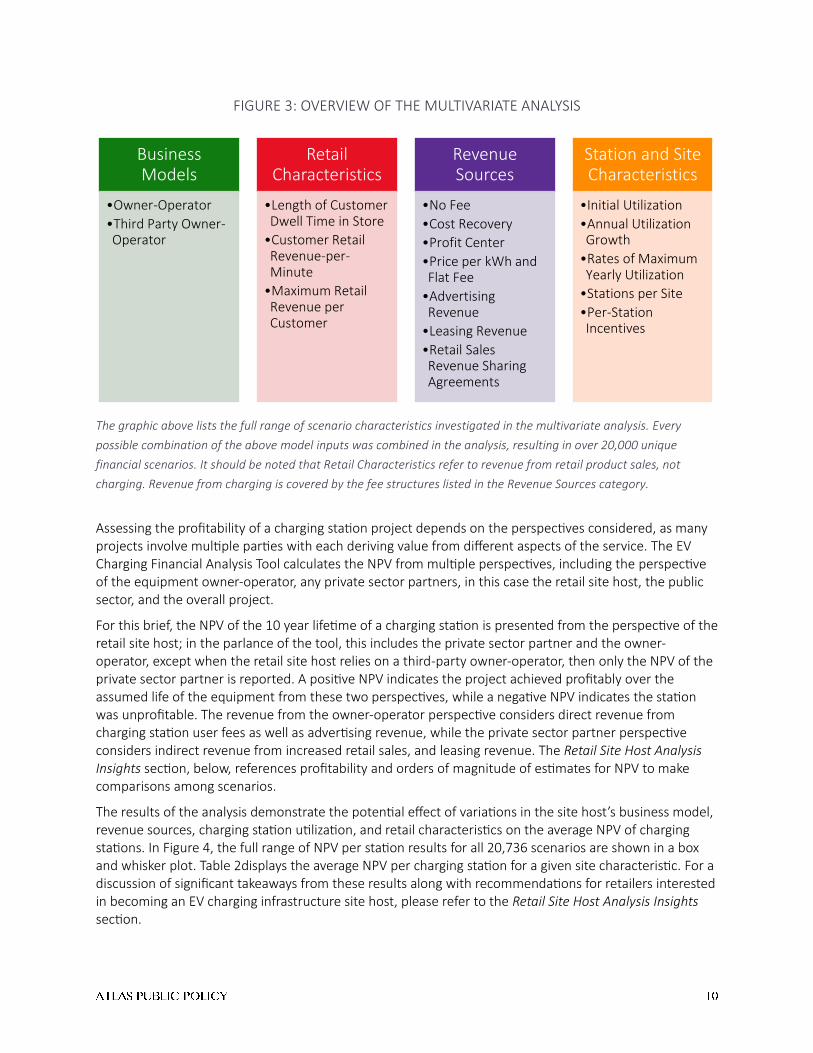
FIGURE 3: OVERVIEW OF THE MULTIVARIATE ANALYSIS
The graphic above lists the full range of scenario characteristics investigated in the multivariate analysis. Every
possible combination of the above model inputs was combined in the analysis, resulting in over 20,000 unique
financial scenarios. It should be noted that Retail Characteristics refer to revenue from retail product sales, not
charging. Revenue from charging is covered by the fee structures listed in the Revenue Sources category.
Assessing the profitability of a charging station project depends on the perspectives considered, as many projects involve multiple parties with each deriving value from different aspects of the service. The EV Charging Financial Analysis Tool calculates the NPV from multiple perspectives, including the perspective of the equipment owner-operator, any private sector partners, in this case the retail site host, the public sector, and the overall project.
For this brief, the NPV of the 10 year lifetime of a charging station is presented from the perspective of the retail site host; in the parlance of the tool, this includes the private sector partner and the owner-operator, except when the retail site host relies on a third-party owner-operator, then only the NPV of the private sector partner is reported. A positive NPV indicates the project achieved profitably over the assumed life of the equipment from these two perspectives, while a negative NPV indicates the station was unprofitable. The revenue from the owner-operator perspective considers direct revenue from charging station user fees as well as advertising revenue, while the private sector partner perspective considers indirect revenue from increased retail sales, and leasing revenue. The Retail Site Host Analysis Insights section, below, references profitability and orders of magnitude of estimates for NPV to make comparisons among scenarios.
The results of the analysis demonstrate the potential effect of variations in the site host’s business model, revenue sources, charging station utilization, and retail characteristics on the average NPV of charging stations. In Figure 4, the full range of NPV per station results for all 20,736 scenarios are shown in a box and whisker plot. Table 2displays the average NPV per charging station for a given site characteristic. For a discussion of significant takeaways from these results along with recommendations for retailers interested in becoming an EV charging infrastructure site host, please refer to the Retail Site Host Analysis Insights section.
Business Models
•Owner-Operator
•Third Party Owner-Operator
Retail Characteristics
•Length of Customer Dwell Time in Store
•Customer Retail Revenue-per-Minute
•Maximum Retail Revenue per Customer
Revenue Sources
•No Fee
•Cost Recovery
•Profit Center
•Price per kWh and Flat Fee
•Advertising Revenue
•Leasing Revenue
•Retail Sales Revenue Sharing Agreements
Station and Site Characteristics
•Initial Utilization
•Annual Utilization Growth
•Rates of Maximum Yearly Utilization
•Stations per Site
•Per-Station Incentives
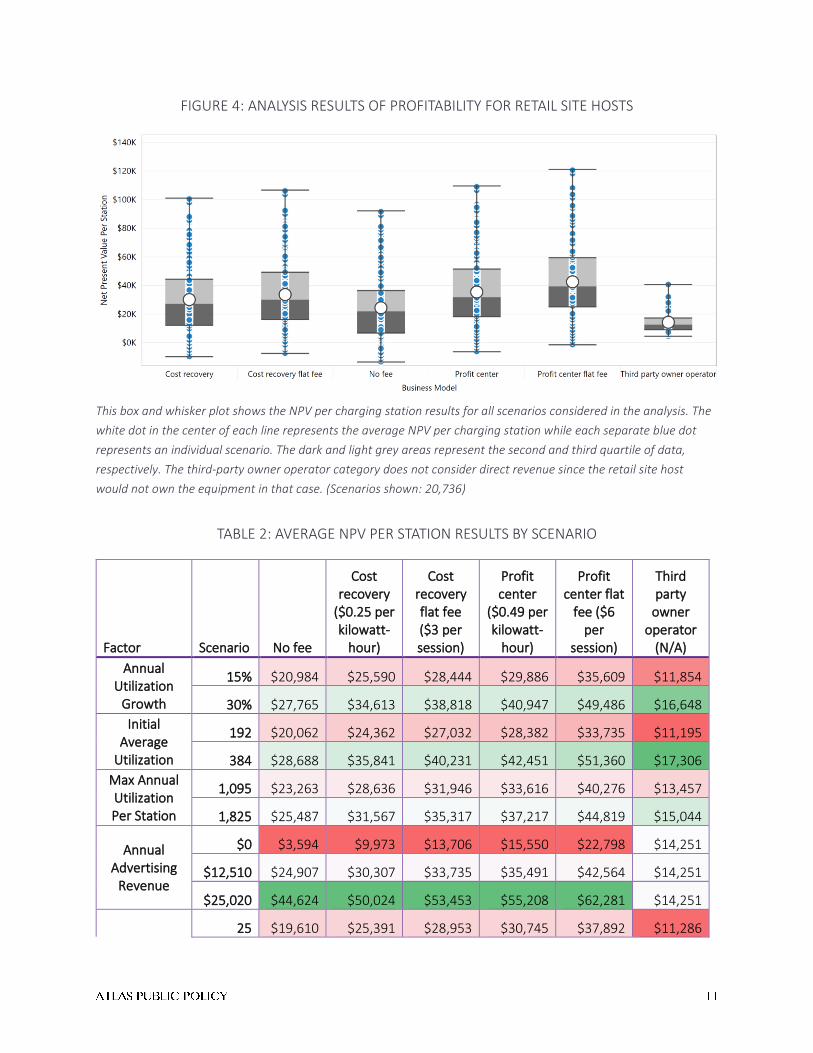
FIGURE 4: ANALYSIS RESULTS OF PROFITABILITY FOR RETAIL SITE HOSTS
This box and whisker plot shows the NPV per charging station results for all scenarios considered in the analysis. The
white dot in the center of each line represents the average NPV per charging station while each separate blue dot
represents an individual scenario. The dark and light grey areas represent the second and third quartile of data,
respectively. The third-party owner operator category does not consider direct revenue since the retail site host
would not own the equipment in that case. (Scenarios shown: 20,736)
TABLE 2: AVERAGE NPV PER STATION RESULTS BY SCENARIO
Factor Scenario No fee
Cost recovery
($0.25 per kilowatt-
hour)
Cost recovery flat fee ($3 per session)
Profit center
($0.49 per kilowatt-
hour)
Profit center flat
fee ($6 per
session)
Third party
owner operator
(N/A)
Annual Utilization
Growth
15% $20,984 $25,590 $28,444 $29,886 $35,609 $11,854
30% $27,765 $34,613 $38,818 $40,947 $49,486 $16,648
Initial Average
Utilization
192 $20,062 $24,362 $27,032 $28,382 $33,735 $11,195
384 $28,688 $35,841 $40,231 $42,451 $51,360 $17,306
Max Annual Utilization Per Station
1,095 $23,263 $28,636 $31,946 $33,616 $40,276 $13,457
1,825 $25,487 $31,567 $35,317 $37,217 $44,819 $15,044
Annual Advertising
Revenue
$0 $3,594 $9,973 $13,706 $15,550 $22,798 $14,251
$12,510 $24,907 $30,307 $33,735 $35,491 $42,564 $14,251
$25,020 $44,624 $50,024 $53,453 $55,208 $62,281 $14,251
25 $19,610 $25,391 $28,953 $30,745 $37,892 $11,286
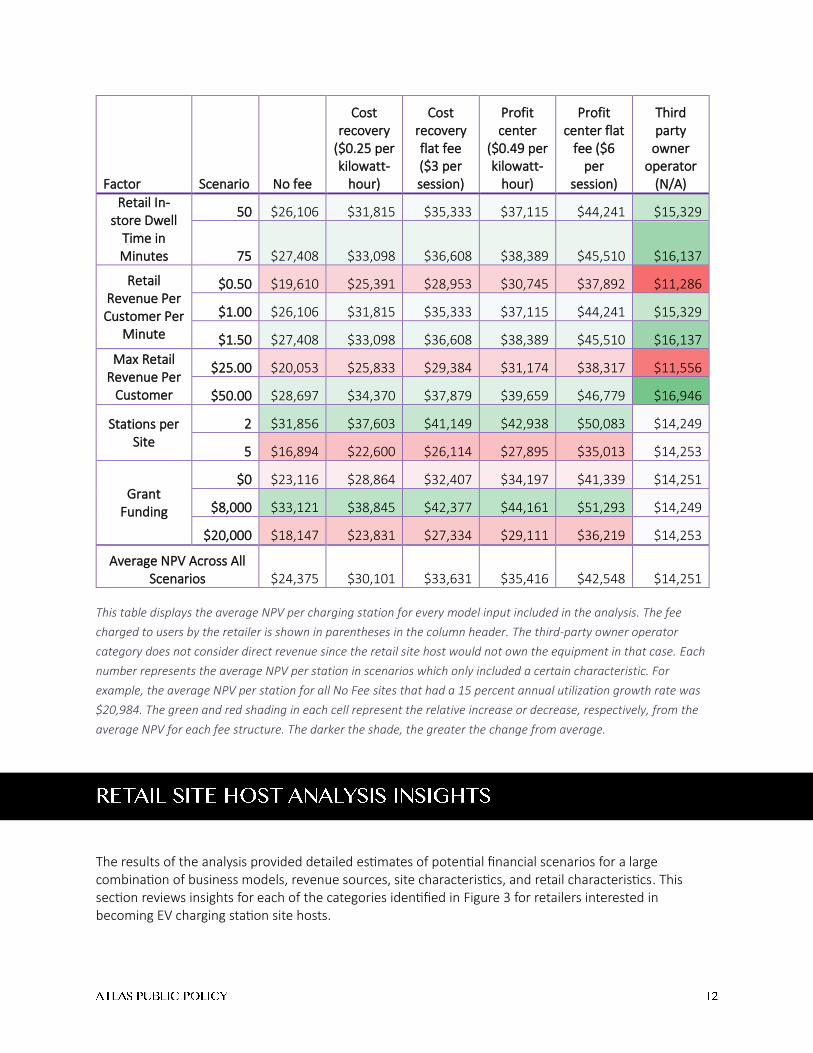
Factor Scenario No fee
Cost recovery
($0.25 per kilowatt-
hour)
Cost recovery flat fee ($3 per session)
Profit center
($0.49 per kilowatt-
hour)
Profit center flat
fee ($6 per
session)
Third party
owner operator
(N/A)
Retail In-store Dwell
Time in Minutes
50 $26,106 $31,815 $35,333 $37,115 $44,241 $15,329
75 $27,408 $33,098 $36,608 $38,389 $45,510 $16,137
Retail Revenue Per Customer Per
Minute
$0.50 $19,610 $25,391 $28,953 $30,745 $37,892 $11,286
$1.00 $26,106 $31,815 $35,333 $37,115 $44,241 $15,329
$1.50 $27,408 $33,098 $36,608 $38,389 $45,510 $16,137
Max Retail Revenue Per
Customer
$25.00 $20,053 $25,833 $29,384 $31,174 $38,317 $11,556
$50.00 $28,697 $34,370 $37,879 $39,659 $46,779 $16,946
Stations per Site
2 $31,856 $37,603 $41,149 $42,938 $50,083 $14,249
5 $16,894 $22,600 $26,114 $27,895 $35,013 $14,253
Grant Funding
$0 $23,116 $28,864 $32,407 $34,197 $41,339 $14,251
$8,000 $33,121 $38,845 $42,377 $44,161 $51,293 $14,249
$20,000 $18,147 $23,831 $27,334 $29,111 $36,219 $14,253
Average NPV Across All Scenarios $24,375 $30,101 $33,631 $35,416 $42,548 $14,251
This table displays the average NPV per charging station for every model input included in the analysis. The fee
charged to users by the retailer is shown in parentheses in the column header. The third-party owner operator
category does not consider direct revenue since the retail site host would not own the equipment in that case. Each
number represents the average NPV per station in scenarios which only included a certain characteristic. For
example, the average NPV per station for all No Fee sites that had a 15 percent annual utilization growth rate was
$20,984. The green and red shading in each cell represent the relative increase or decrease, respectively, from the
average NPV for each fee structure. The darker the shade, the greater the change from average.
The results of the analysis provided detailed estimates of potential financial scenarios for a large combination of business models, revenue sources, site characteristics, and retail characteristics. This section reviews insights for each of the categories identified in Figure 3 for retailers interested in becoming EV charging station site hosts.

• Retail site hosts relying on third-party owner-operators limit financial risks, but also limit profit potential. Utilizing third-party owner-operators may help retail site hosts to avoid the costs of operation, maintenance, and complicated utility interconnections. However, this business model also limits the profit potential of a charging station for a retail site host. While all scenarios involving a third-party owner-operator were profitable for a retail site host, the average NPV of those charging stations for the retail site host was less than half of all other business models, except when the retailer owner-operator charged no fee for station use. Only the best-case scenarios for third-party owned and operated charging stations exceeded the average NPV for other business models.
It should be noted that all scenarios involving a third-party owner-operator included a revenue sharing agreement in which the retail site host pays a portion of sales revenue generated from customers spending additional time in stores to the third-party.1 Without such an agreement, the value of these charging services to site hosts using a third-party owner-operator would be higher. However, Atlas Public Policy found that over 40 percent of stations installed by NYSERDA were not profitable when relying on user-fee revenue alone [11] and, given the opportunity for retailers to see increased sales, it may be in the best interest of the retail site host to subsidize the operation of third-party owned and operated charging stations.
• Business models where the retail site host is the owner-operator offer high profit potential but come with associated risks. The scenarios modeled in this analysis for retail site hosts as owner-operators were profitable in the overwhelming majority of cases: only six percent of these scenarios were unprofitable. However, the risks associated with owning and operating a charging station should not be understated. Removing just the possibility of advertising revenue causes the percentage of unprofitable scenarios to jump to over 16 percent. The model did not include variations in operating cost, installation or equipment costs, estimates of the employee time necessary to select an appropriate equipment vendor or learn detailed information about utility rate structures and how they could impact costs, or other factors. While retailers may already have data on expected revenue per customer or average in-store spend per minute, they will likely have less reliable information on expected charging station utilization, density of local EV adoption or nearby alternative charging options, or potential spikes in utility bills and will need to assume those risks when choosing to own and operate a charging station.
• To optimize sales revenue, retail site hosts should design fee structures to achieve longer dwell times, but also create sufficient customer turnover, as in-store retail revenues per customer tapered off after extended dwell time. The analysis assumed in-store retail sales revenues would level off after 50 minutes of customer dwell time, but the difference between 25 and 50 minutes of additional dwell
1 A revenue sharing agreement was used to model how a retail site host may subsidize a third-party station owner-operator and how that subsidy may impact the NPV for the retail site host. The EV Charging Financial Analysis Tool explicitly identifies retail sales attributed to customers spending additional time in stores and allocates a percentage of those sales to the charging station owner-operator. While this practice is easy to model, it may be more difficult to implement in real-world scenarios and retail site hosts may opt for alternative methods of subsidization.

time had a large impact on profitability for the retail site host. For scenarios with a maximum cap of $50 in retail sales per customer and no advertising revenue, there was a 175 percent increase in average charging station NPV between scenarios with 25 and 50 minutes of customer dwell time under otherwise identical circumstances. However, there was only a nine percent increase in average charging station NPV between scenarios with 50 and 75 minutes of customer dwell time. It is important to note that these results are entirely dependent on the analysis assumptions and, depending on the retail business in question, the difference between a 50 and 75 minute dwell time could be significant if the expected maximum retail spend per customer were greater than $50.
• Retail site hosts with lower expected customer spend per visit should focus primarily on achieving a high turnover of customers. Stations unsupported by advertising revenue and with a maximum retail customer spend per visit of $25 were profitable in nearly 80 percent of scenarios modeled. This rate increased to over 90 percent when maximum retail customer spend increased to $50 per visit. However, there was an even greater reduction in the percentage of unprofitable scenarios when doubling the number of times a station is used in its first year (identified in this analysis as initial station utilization).
• Retail site hosts should use information on average in-store customer revenue per minute to design fee structures that optimize dwell time for their business. Increasing the assumption for customer dwell time from 50 to 75 minutes had the exact same effect on station NPV as increasing the expected spend per minute from $1.00 to $1.50. Retail site hosts can use this information to design fee structures that target their customers most effectively; retailers with low expectations of customer spend per minute can achieve the same sales revenue as more expensive retail locations by choosing a fee structure aimed at increasing customer dwell time such as session-based fees or free charging for a set period of time.
• Ensuring high initial utilization was critical for achieving profitability. When stations had roughly one charging session per day in their initial year, a rate that was double the average initial utilization seen at retail and parking garage charging stations installed by NYSERDA [11], their average NPV increased by nearly 20 percent. When limiting scenarios to only those that did not pursue advertising revenue and were more reliant on retail customer sales revenue, the NPV of stations with an initial annual utilization of greater than one session per day was 50 percent higher. This finding echoes a similar analysis on the business case for charging stations in New York that found a utilization rate of at least one charging session per day was necessary to achieve a high chance of profitability [11].
For stations that had low rates of initial utilization at approximately 0.5 charging sessions per day, annual utilization growth was key for charging station profitability. Under the low initial utilization scenario, having an annual utilization growth rate of 30 percent as opposed to 15 percent increased average station NPV by more than eight times.
• Grant funding was important for mitigating the risk of unprofitability but had a relatively small impact on profitability in comparison to other variables. Including grant funding2 for station purchase and installation was an effective guard against unprofitability for station owner-operators and reduced the number of unprofitable scenarios by over 44 percent. However, the overall impact of grant
2 Figures for grant funding were calculated on a per-station basis based upon the funding amounts offered by NYSERDA as part of their ChargeReady program.

funding on charging station NPV was minor when compared to other factors such as dwell time, initial station utilization, or maximum spend per customer; the effect of doubling initial station utilization was nearly nine times greater than obtaining grant funding. Grants for charging infrastructure could be a more important consideration for owner-operators who primarily rely on revenue from the use of the charging station, but for retailer owner-operators who are instead focused on retail sales revenue, the grant funding did little to raise the ceiling of station profitability.
• Higher numbers of stations per site offered savings on fixed site costs. The NPV per station increased by over 13 percent for sites that hosted five stations compared to sites that hosted two stations. This increase in NPV per station resulted from savings on per-site costs like utility upgrades and charging station siting. These costs did not scale with the number of charging stations and are an important consideration for site hosts deciding on the number of charging stations to install.
FIGURE 5: AVERAGE NOMINAL PROFIT BY CATEGORY
The pie charts above demonstrate the makeup of total nominal profit by category for all scenarios that included a
user fee and only scenarios which included the highest user fee, Profit Center – Flat Fee.
• Indirect revenue sources were significantly more important than user fees for ensuring charging station profitability. This analysis sought to investigate not only the effect of different charging station fee structures, but also the relative importance of charging station user fees compared to the indirect revenue sources of increased retail sales and charging station advertisements. As mentioned previously, the calculation of NPV included the value derived from direct as well as indirect sources of revenue. Across all scenarios that included a user fee, charging fees accounted for roughly eight percent of the total nominal profit. Even in the case with the highest user fee of $6.00 per charging session, profit from fees accounted for less than 24 percent of total nominal profit on average.
Nominal Operating
Profit8%
Nominal Advertising
Profit41%
Nominal Sales Profit
51%
Average Gross Nominal Profit for All User Fee Scenarios
Nominal Operating
Profit24%
Nominal Advertising
Profit34%
Nominal Sales Profit
42%
Average Gross Nominal Profit for Profit Center - Flat Fee

• However, user fees were an effective tool to mitigate the risk of unprofitability. Adding a user fee of $0.25 per kilowatt-hour to cover operational costs reduced the number of likely unprofitable scenarios by over 44 percent. While this fee may seem high compared to the price of residential electricity, it still did not cover the average installation and operating costs of the charging stations. The cost-recovery session-based fee of $3.00 did cover average operating costs, but this was due to the assumption that the difference between a kilowatt-hour-based fee and session-based fee would not have an impact on station utilization. Given this information, site hosts should consider the likely amount of electricity usage at a station and gauge whether a session-based fee may be more favorable.
• Advertising is a potentially important source of revenue for site hosts. Of all modeled revenue sources, advertising revenue had the largest impact on profitability. However, this revenue would be entirely dependent on where the charging station would be sited and the value advertisers would see in using it (e.g., how much foot traffic the site would experience). Because the number of people interacting with the charging station would be low, the charging station would likely need to experience a high volume of general foot traffic to attract advertisers. If, for example, charging stations were in a high traffic area like the entrance to a shopping mall and could act in a similar manner to existing billboards, then the charging station owner could anticipate higher revenue from advertising. Including even a modest estimate of annual advertising revenue for a charging site, roughly equivalent to the revenue from two stationary backlit displays at a shopping mall [23], increased average NPV of charging stations by more than 150 percent. All scenarios that included this advertising revenue were profitable.
It should be noted that advertising revenue estimated for this analysis was based on a per-site rate, meaning that revenue from advertising did not scale with the number of charging stations. This caused scenarios with more charging stations to appear less favorable on a value-per-station basis as the revenue from advertising was spread out over more stations.
Although the gap between passenger EV adoption and the deployment of charging infrastructure in the United States is closing, there remains much work to be done. Retailers have an opportunity to not only fill that gap, but also enhance their existing businesses in the process. As demonstrated in the results of this analysis, retailers are ideal EV charging station site hosts since they can leverage their ability to generate additional sales revenue to significantly boost the value proposition for hosting EV charging stations. These benefits are independent even of EV stations’ contributions to meeting corporate sustainability goals, supporting low or no emission transportation, or improving reputation with customers and employees.
However, hosting an EV charging station is not necessarily a turn-key operation. Interested retailers should carefully consider the characteristics of their business and customer base, as well as their risk tolerance before deciding on whether to own charging infrastructure or rely on a third party and to what degree. If retailers are able to use existing information on expectations of average in-store revenue per customer or average in-store customer spend per minute, they should be able to design a charging station experience that optimizes the revenue generated from new or existing customers and greatly enhances their existing business.

Atlas Public Policy would like to thank the Heising-Simons Foundation for its generous support of this work. Atlas would also like to thank the Center for Climate and Energy Solutions, David Gardiner and Associates, and the Retail Industry Leaders Association, for their work to gather information, provide valuable feedback, and edit this report. It is through collaborative efforts with organizations such as these that Atlas is able to pursue its mission to arm businesses and policymakers with the information necessary to make strategic, informed decisions and encourage the use of new technologies and products along with changes in consumer behavior. Atlas is an independent organization and is solely responsible for the thoughts and opinions expressed in this work.

Market
EV Charging Financial Analysis Input Field
Values Source
Market Assumptions
EV fuel economy [miles per kilowatt-hour]
N/A Not applicable for this analysis
Conventional vehicle replacement fuel economy [mpg]
N/A Not applicable for this analysis
Energy security benefit [$per gasoline gallon displaced]
N/A Not applicable for this analysis
Electrical grid benefit [$per megawatt-hour]
N/A Not applicable for this analysis
Electrical grid emissions rate [carbon dioxide equivalent pounds per megawatt-hour]
N/A Not applicable for this analysis
Climate benefit [$per ton of greenhouse gas emissions abated]
N/A Not applicable for this analysis
Use traffic-derived values [1] or direct inputs [2]
N Disable this method for estimating utilization rate.
Direct Utilization Values
Expected annual utilization growth rate [%]
15%, 30% +/- 50% of the median value from 2016-2018 NYSERDA charging data across all locations
[Station Type 1] Initial average utilization [# of charging sessions per station per year]
192 to 384 Average utilization from 2016-2018 NYSERDA charging data at retail and parking garage locations and +100% of average utilization

Owner-Operator
EV Charging Financial Analysis Input Field
Values Source
Expected equipment lifespan [years] 10 Atlas assumption confirmed by NESCAUM for newer charging stations
Charging Station Capital Cost
Charging station equipment cost per type 1 station [$]
$4,238 Average equipment cost from NYSERDA data for retail and parking garage locations
Construction and equipment installation cost per type 1 station [$]
$3,750 Average installation cost from NYSERDA data for retail and parking garage locations
Energy storage cost per type 1 site [$] N/A Not applicable for this analysis.
Photovoltaic energy system cost per type 1 site [$]
N/A Not applicable for this analysis.
Electric utility upgrades and grid interconnection cost per type 1 site [$]
$876 Average cost of utility upgrades from NYSERDA data for retail and parking garage locations
Lease and property transaction costs per type 1 site (one-time fee) [$]
- Atlas assumption; no fee would be paid if retailers were the owner-operator
Host site identification and screening and design per type 1 site [$]
$1,000.00 Assumption based on input from NESCAUM and verified by charging provider.
Total number of type 1 stations [#] 2 to 5 Atlas assumption
Total number of type 1 sites [#] 1 Assume only one site
Charging Station Utilization
Maximum number of charging sessions per type 1 station [sessions/year/station]
1,095 to 1,825
Assumed maximum based on charging sessions and charging time data from NYSERDA charging data across all locations; 40% reduction from NYSERDA maximum
Energy Usage
Average charging energy per type 1 session [kWh/session]
7.34 Average from 2016-2018 NYSERDA charging data for retail and parking garage locations.

Maximum power draw (type 1 station) [kW/session]
19 Maximum from Level 2 standard
Average time of charging session (type 1 station) [minutes]
25 to 75 +/- 50% of ChargePoint retail case study https://www.chargepoint.com/files/casestudies/cs-retail.pdf; verified by average charging session length at retail and parking garage locations from 2016-2018 NYSERDA charging data and average customer dwell time reported by the Path to Purchase Institute
Charging Station Revenue [Operating Revenue - Direct]
Per-energy user fee (type 1 station) [$/kWh]
$0 to $0.49 Atlas assumptions based on charging rates from Blink
Per-charge event user fee (type 1 station) [$/session]
$3 to $6 Atlas assumption
Electricity
Electricity retail price in first year (type 1 station) [$/kWh]
$0.094 2019 EIA National average electricity rates.
Monthly electricity fixed charges (type 1 site) [$]
$25 Average of New York State electricity costs. Estimated by Atlas.
Annual compounded growth rate in electricity price (type 1 station) [%]
0.25% Atlas assumption from the EIA.
Share of onsite energy generation (type 1 station) [%]
N/A Not applicable for this analysis.
Demand charge (type 1 station) [$/kW/month]
- Assume no demand charge for Level 2 charging stations.
Demand charge threshold (type 1 station) [kWh/month]
- Assume no demand charge for Level 2 charging stations.
Maximum load at site excluding charging stations (type 1 station) [kW]
0 Atlas assumption.
Maintenance cost

Annual maintenance cost (type 1 station) [$]
5% Assumption as 5 percent of equipment cost based on input from NESCAUM and verified by charging provider.
Communications cost
Annual communications cost (average per type 1 site/year) [$]
$663 Average from NYSERDA data for retail and parking garage locations
Warranty Cost
Annual warranty cost (type 1 station) [$]
$700 Estimate based on input from NYSERDA and review of ChargePoint offerings
Host site lease or access cost
Host site lease or access cost (average per type 1 site/year) [$]
$0 to $2500
Assumption of $500 per station based on input from EVgo
Additional Revenue Assumptions
Number of subscribers in first year [subscribers/year]
- Atlas assumption. Use in model only if appropriate.
Annual growth rate in number of subscribers [%]
- Atlas assumption. Use in model only if appropriate.
Subscription fee [$/subscriber/year] - Atlas assumption. Use in model only if appropriate.
Annual advertising revenue (In-station advertising) [$]
$0 to $25,020
Atlas assumption based on conversations with advertising representatives; assumed price of approximately $700 for a four-week video advertising campaign per site and 1 to 3 successful ad buys per month.
Owner-operator share of energy security benefit [%]
0% Atlas assumption
Owner-operator share of electrical grid benefit [%]
0% Atlas assumption
Owner-operator share of climate benefit [%]
0% Atlas assumption
Additional Cost Assumptions
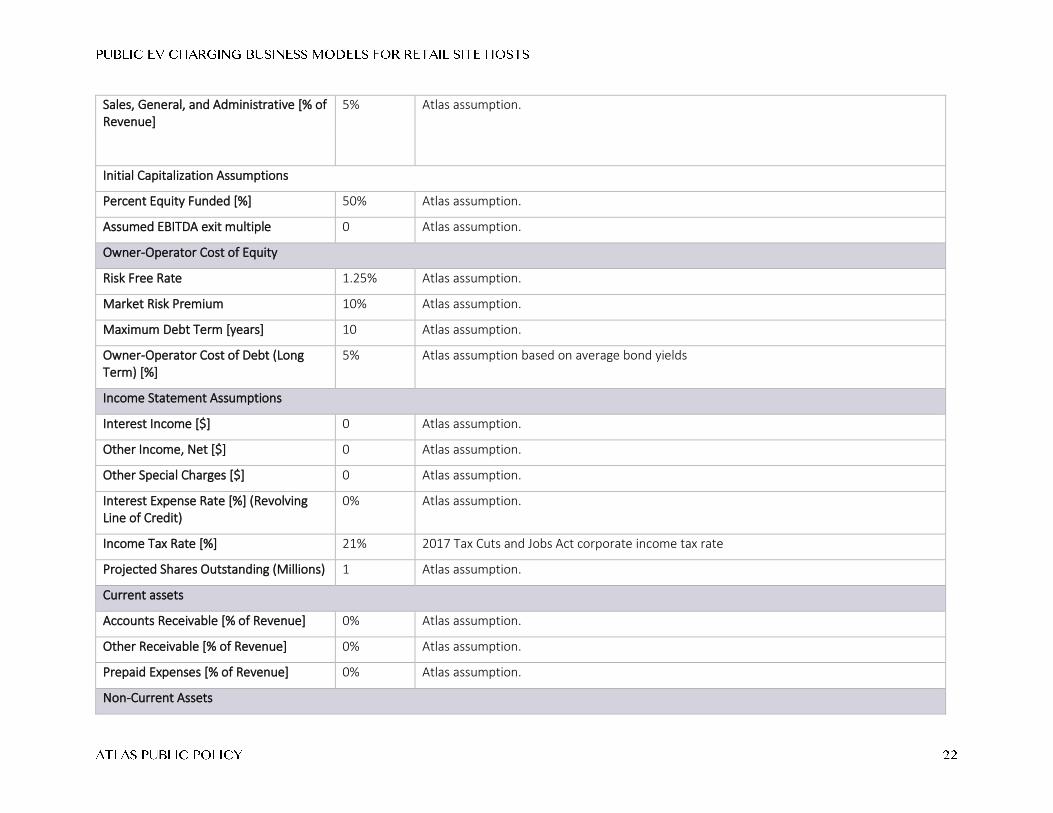
Sales, General, and Administrative [% of Revenue]
5% Atlas assumption.
Initial Capitalization Assumptions
Percent Equity Funded [%] 50% Atlas assumption.
Assumed EBITDA exit multiple 0 Atlas assumption.
Owner-Operator Cost of Equity
Risk Free Rate 1.25% Atlas assumption.
Market Risk Premium 10% Atlas assumption.
Maximum Debt Term [years] 10 Atlas assumption.
Owner-Operator Cost of Debt (Long Term) [%]
5% Atlas assumption based on average bond yields
Income Statement Assumptions
Interest Income [$] 0 Atlas assumption.
Other Income, Net [$] 0 Atlas assumption.
Other Special Charges [$] 0 Atlas assumption.
Interest Expense Rate [%] (Revolving Line of Credit)
0% Atlas assumption.
Income Tax Rate [%] 21% 2017 Tax Cuts and Jobs Act corporate income tax rate
Projected Shares Outstanding (Millions) 1 Atlas assumption.
Current assets
Accounts Receivable [% of Revenue] 0% Atlas assumption.
Other Receivable [% of Revenue] 0% Atlas assumption.
Prepaid Expenses [% of Revenue] 0% Atlas assumption.
Non-Current Assets

Intangibles (Goodwill) 0% Atlas assumption.
Other Non-Current Assets 0% Atlas assumption.
Current Liabilities
Accounts Payable [% of Revenue] 0% Atlas assumption.
Revolving Line of Credit [% of Revenue] 0% Atlas assumption.
Private Sector
EV Charging Financial Analysis Input Field
Values Source
Private Sector Partner Inputs
Private Sector Weighted Average Cost of Capital (WACC)
10.3% Atlas assumption.
Private Sector Cost of Goods Sold [% of Revenue]
80% Atlas assumption.
Private Sector Marginal Tax Rate 21% 2017 Tax Cuts and Jobs Act corporate income tax rate
Revenues
Private sector captures host site lease/access fees?
N, Y Atlas assumption. Use if applicable
Average expected revenue per customer per minute [$]
$0.50 to $1.50
+/- 50% of ChargePoint retail case study https://www.chargepoint.com/files/casestudies/cs-retail.pdf
Type 1 stations capture customer traffic revenue
Y Atlas assumption. Use if applicable
Maximum retail revenue per customer per session (type 1 station) [$]
$25 to $50 Atlas assumption based on figures reported by VendHQ 2019 Retail Benchmarks Report
Capture the electrical grid benefits Y Atlas assumption.
Costs

Annual customer revenue sharing agreement (from sales) [% of revenue]
5% to 10% Atlas assumption.
Per station subsidy (type 1 station) [$] $0 Atlas assumption
Annual flat fee (paid to owner-operator) [$]
- If applicable.
Public Sector
EV Charging Financial Analysis Input Field
Values Source
Public Sector Cost of Capital [%] 5% Atlas assumption. Use if applicable.
Public sector funded portion of debt [% of debt needed]
0% Atlas assumption. Use if applicable.
Term [years] 10 Atlas assumption. Use if applicable.
Rate (APR) [%] 5% Atlas assumption. Use if applicable.
Public sector funded portion of equity investment [% of equity needed]
0% Atlas assumption. Use if applicable.
Public sector equity has capped annual returns?
N Atlas assumption. Use if applicable.
Annual equity return cap [%] 5% Atlas assumption. Use if applicable.
Non-shareholder contribution to capital (grants, etc.) [% of equity needed]
0% Atlas assumption. Use if applicable.
Other annual non-revolving support (grants, etc.) [$]
$0 to $4,000 per station
NYSERDA Charge-ready grant amount

[1] BloombergNEF, "Electric Vehicle Outlook 2019," Bloomberg, New York City, 2019.
[2] M. Nicholas, D. Hall and N. Lutsey, "Quantifying the electric vehicle charging infrastructure gap across
U.S. markets," The International Council on Clean Transportation, 2019.
[3] Atlas Public Policy, "Atlas EV Hub," March 2020. [Online]. Available: https://www.atlasevhub.com.
[Accessed March 2020].
[4] McKinsey, "Charging ahead: Electric-vehicle infrastructure demand," August 2018. [Online]. Available:
https://www.mckinsey.com/industries/automotive-and-assembly/our-insights/charging-ahead-electric-
vehicle-infrastructure-demand#. [Accessed 18 March 2020].
[5] Idaho National Laboratory, "Plugged In: How Americans Charge Their Electric Vehicles," September
2015. [Online]. Available: https://inldigitallibrary.inl.gov/sites/sti/sti/7323604.pdf. [Accessed August
2018].
[6] L. Davis, "Evidence of a homeowner-renter gap for electric vehicles," Applied Economics Letters, vol. 26,
no. 11, pp. 927-932, 2019.
[7] Idaho National Laboratory, "Publicly Accessible Charging During the EV Project," July 2015. [Online].
Available:
https://avt.inl.gov/sites/default/files/pdf/EVProj/PubliclyAccessibleChargingSiteHostRecruitmentDuringT
heEVProject.pdf. [Accessed March 2020].
[8] Bureau of Labor Statistics, "Occupational Outlook Handbook," 4 September 2019. [Online]. Available:
https://www.bls.gov/ooh/. [Accessed March 2020].
[9] GreenBiz, "As EV adoption grows, charging infrastructure needs to do the same," 11 December 2019.
[Online]. Available: https://www.greenbiz.com/article/ev-adoption-grows-charging-infrastructure-needs-
do-same. [Accessed March 2020].
[10] Idaho National Laboratory, "Publicly Accessible Charging Site Host Recruitment During the EV Project,"
July 2015. [Online]. Available:
https://avt.inl.gov/sites/default/files/pdf/EVProj/PubliclyAccessibleChargingSiteHostRecruitmentDuringT
heEVProject.pdf. [Accessed March 2020].

[11] Atlas Public Policy, "Assessing the Business Case for Hosting Electric Vehicle Charging Stations in New
York State," June 2019. [Online]. Available: https://atlaspolicy.com/wp-content/uploads/2019/09/19-31-
Business-Case-for-Hosting-Charging-Stations.pdf. [Accessed March 2020].
[12] A. Farkas, H. Shin and A. Nicckar, "Environmental Attributes of Electric Vehicle Ownership and
Communting Behavior in Maryland: Public Policy and Equity Considerations," 31 August 2018. [Online].
Available:
https://www.morgan.edu/Documents/ACADEMICS/CENTERS/NTC/Environmental%20Attributes%20of%
20Electric%20Vehicle%20Ownership%20and%20Commuting%20Behavior%20in%20Maryland%20-%20P
ublic%20Policy%20and%20Equity%20Considera.pdf. [Accessed March 2020].
[13] Chargepoint, "Leading Retailer Partners with ChargePoint to Attract and Retain Loyal Customers," 2015.
[Online]. Available: https://www.chargepoint.com/files/casestudies/cs-retail.pdf. [Accessed March
2020].
[14] E. Wood, C. Rames, M. Muratori, S. Raghavan and S. Young, "Charging Electric Vehicles in Smart Cities:
An EVI-Pro Analysis of Columbus, Ohio," February 2018. [Online]. Available:
https://www.nrel.gov/docs/fy18osti/70367.pdf. [Accessed March 2020].
[15] Path To Purchase Institute, "Q1 2019 Snapshots," 2019. [Online]. Available:
https://p2pi.org/sites/default/files/attached_file/P2Pi%20Report_04.08.19.pdf. [Accessed March 2020].
[16] National Renewable Energy Laboratory, "Plug-In Electric Vehicle Handbook for Public Charging Station
Hosts," April 2012. [Online]. Available: https://afdc.energy.gov/files/pdfs/51227.pdf. [Accessed March
2020].
[17] ChargePoint, "Five Ways Retail Stores Can Boost Sales with EV Charging," 13 February 2017. [Online].
Available: https://www.chargepoint.com/blog/five-ways-retail-stores-can-boost-sales-ev-charging/.
[Accessed March 2020].
[18] Blink Charging Company, "Electric Vehicle Charging Stations: Blink Charging Solutions," 2019. [Online].
Available: https://49360769-d546-4026-9a30-
327648e220cc.filesusr.com/ugd/7d5220_cce9147513ad4cd58895e135fde68bb7.pdf. [Accessed March
2020].
[19] EVgo, "Host a Fast Charging Station," 2020. [Online]. Available: https://www.evgo.com/ev-charging-
business/retail/. [Accessed March 2020].
[20] Idaho National Laboratory, "The EV Project Price/Fee Models for Publicly Accessible Charging,"
December 2015. [Online]. Available:
https://avt.inl.gov/sites/default/files/pdf/EVProj/PriceFeeModelsForCommercialChargingUsedByTheEVP
rojectDec2015.pdf. [Accessed March 2020].

[21] New York State Energy Research and Development Authority, "NYSERDA Case Studies," 2018. [Online].
Available: https://www.nyserda.ny.gov/All-Programs/Programs/ChargeNY/Charge-Electric/Best-
Practices. [Accessed March 2020].
[22] Volta Charging, "Charging FAQ," 2020. [Online]. Available: https://voltacharging.com/faq/. [Accessed
March 2020].
[23] Universal Media, "Backlit Display Advertising Cost," 2020. [Online]. Available:
https://universalmediaus.com/cost/. [Accessed March 2020].