y grass silage fo r dai ry and beef p rodu ct io n syste ms · soil ph analysis – the first step...
TRANSCRIPT

Quality Grass Silage for Dairy and Beef Production SystemsA Best Practice Guide

Quality Grass Silage for Dairy and Beef Production�Systems
1
page
Introduction ...........................................................................................................2
Dry Matter Yield- Effect on Silage Cost...............................................................3
Silage quality-what difference does it make?....................................................4
Planning your silage strategy...............................................................................5
Example silage plan- dairy herd..........................................................................7
Example silage plan- beef herd ...........................................................................8
Should I graze silage ground in spring?..............................................................9
How will spring grazing affect forage yield? ....................................................10
Fertilizer for first cut silage................................................................................11
How does grass growth stage at cutting affect silage quality? ......................13
Soil fertility effects on silage yield and quality................................................14
Achieving good silage preservation...................................................................15
The silage fermentation process .......................................................................16
To use an additive or not? ..................................................................................17
How do wilting duration and swath treatment affect silage DM?.................18
page
Tips for making quality round bale silage........................................................19
Fertilizer for second cut silage...........................................................................20
Reseed to improve silage yield and quality ......................................................21
Checklist for successful reseeding ....................................................................22
Soil P and K fertility index – key to yield and quality .....................................23
Soil pH Analysis – the first step to quality silage.............................................24
Silage sampling and analysis.............................................................................25
Interpreting silage analysis ................................................................................26
Key measures of silage nutritional value explained .......................................27
Key measures of silage preservation explained...............................................28
Silage mineral analysis .......................................................................................29
Managing silage losses in the pit and at feeding .............................................31
Think safety at silage time.................................................................................32
Monthly checklist for silage management .......................................................33
Fodder budget worksheet ...................................................................................35
Table of Contents

Quality Grass Silage for Dairy and Beef Production�Systems
2
Most livestock farmers in Ireland operate a grazing system based on maximising grazedgrass in the diet. Across dairy and beef systems, the benefit of maximising grazed grassas a proportion of the total diet is very clear. However, seasonal patterns of grass growthmeans that there is practically no growth in winter, limited growth in early spring andearly winter, with peak growth in May and June. Grass supply is in surplus during thispeak growth and consequently grass silage is made to match supply and demand,maintain grass quality and provide winter feed when grass growth is at its lowest.
Grass silage thus accounts for 20-25% of total annual feed per cow on well-run dairyfarms, and up to 30% of total feed on beef farms depending on the production systemsin place. Over 85% of farms in Ireland make silage each year, and the estimated cost ofharvesting over 1 million ha of grass silage exceeds €500 million annually. Clearly thisis a significant cost component of our ruminant production systems.
At the field level, the single biggest factor contributing to the cost of producing silage isthe yield of the crop. The primary challenge for farmers is to maximise silage yield whileat the same time achieving target silage quality for production system on the farm.There is a balancing act in silage production, between maximising yield and maintainingfeed quality (DMD). During the milk quota area, many spring calving dairy farms movedto a low DMD/high bulk first cut silage system, which suited low stocking rates, earlydry-off and long winter dry periods. This strategy may need to be adjusted for the post-
quota era to account for increased spring/autumn feed demand and shorter dry perioddurations. Based on surveys of silage analysis results over recent seasons, it is clear thatsilage quality on beef farms also needs to be addressed. Mean silage quality on beeffarms sits at 66 DMD, which is adequate for dry suckler cows in good body conditionbut is a low grade feed for growing and finishing cattle.
Soil P & K concentrations as well as pH (lime requirement) have been depleted in recentyears. This is reflected in sub-optimal grass growth and consequently light yields attarget harvest dates. The consequence of this is later cutting dates to maximise yieldswhich results in poorer quality silage. It is imperative that soil fertility is optimised andthe correct fertiliser regime is applied to allow farmers to achieve target silage quality.Understanding optimal time of harvest, the role of additives, and the benefits ofreseeding silage areas are also important.
As a stand alone feed silage is expensive to produce. But looking at silage as part of anintegrated grassland management system, grazed grass + grass silage are competitivefeeds and over 2.5 timed cheaper than concentrate feeds. The objective of thispublication is to provide farmers, students and advisers with a template for cost-effective production of good yields of grass silage, at the optimum feed quality for farmsystem.
Introduction

Quality Grass Silage for Dairy and Beef Production�Systems
3
Grass silage costs approximately 2.0 to 2.5 times grazed grass per tonne of DM fed. Mostof the additional cost is incurred through harvesting and fixed charges, plus feed-outcosts.
Dry matter yield is the most important factor affecting cost per tonne of silage fed. Firstcut silage tends to be less expensive than subsequent cuts. The relative cost of baledsilage depends on DM yield -lighter crops make bales a more viable option. On a feedcost per ha basis, well-managed grass-plus-silage systems compare favourably withalternative forage options.
The capacity to maximize DM yield per cut is limited by effect of stage of growth on grass quality. Delaying harvest to 'bulk up' crops will increase DM yield. Howeverdigestibility declines sharply after grass heading date such that total yield of digestiblefeed in the crop does not increase further - removal of the crop is necessary to promotenew growth. It is important therefore to factor in effects on annual DM yield per ha(grazing plus all silage crops) when planning silage cuts, rather than solely focussingon yield per individual harvest.
Dry matter yield- effect on silage cost
First cut grass DM yield (t/ha)
Cost € per tDM silage
Relative cost per t DM grown
3.0
240
1.63
4.0
182
1.24
5.0
147
1.00
6.0
124
0.84
7.0
107
0.73
Digestible yield is limited by changes to grass quality post heading
kg p
er h
a
10000900080007000600050004000300020001000
0
Digestible DM Yield
Crop DM Yield
Digestible yield is limited by changes to grass quality post heading
kg p
er h
a
10000900080007000600050004000300020001000
0
Digestible DM Yield
Crop DM Yield
Cost breakdown per tonne utilisable DM for different feed crop options
10000
9000
8000
7000
6000
5000
4000
3000
2000
1000
0
Sundry
Land charge
Fixed costs
Feed out
Harvesting
Fertilizer, sowing,sprays
Grazedgrass
1st cutgrass silage
2nd cutgrass silage
Baled silage
Maize Wholecropwheat
Kale
Cos
t €
per t
DM

Quality Grass Silage for Dairy and Beef Production�Systems
4
Over a number of studies at Teagasc Grange, leafysilage with higher dry matter digestibility (DMD)resulted in resulted in better feed intakes andliveweight gains for finishing cattle. The benefitsinclude shorter days to finish (lower total silage DMrequired), lower daily concentrate intakes to achievetarget daily gains, and lower fixed costs (slurry, labour,overheads etc.) Similar benefits are incurred withhigher DMD silage fed to weanling cattle. Dry sucklercows in good BCS require lower DMD (66-68) silage.
For milking cows, the benefits of higher DMD silageare improved forage intake, more milk solids and milkfrom forage, better rumen health and lowerconcentrate feeding levels. Cows fed high qualitysilage (75+ DMD) require 3-4kg less concentrate toachieve similar milk solids output than cows fedaverage quality (69 DMD) silage. Dairy heifers fed >70DMD silage have improved daily gains during theirfirst winter. Silage DMD for dry cows depends on BCSat drying off and duration of dry period.
Silage quality -what difference does it make?
Silage Quality
Beef Cattle– Weight gain
75
20 May
4.6
9.0
0.83
70
2 Jun
6.0
8.3
0.66
65
15 Jun
7.0
7.6
0.49
60
28 Jun
7.7
7.0
0.31
DMD %
Harvest date
Silage tDM per ha
Intake (kg/day)
Liveweight gain (kg/day)
Concentrates (kg/cow/day)
Dairy Cattle– Milk yield
0
23.6
4
29.1
27.1
24.7
8
32.8
29.3
27.3
12
32.0
28.8
30.1
Silage DMD
79
75
69

Quality Grass Silage for Dairy and Beef Production�Systems
5
A good management plan will deliver on the 3 main objectives for quality silage:
• Good yield for 1st cut silage with high annual grass tonnage per hectare
• A clean, well-preserved feed with good palatability
• The appropriate nutritional quality (DMD)
The objectives of high dry matter yield & good preservation remain consistent across farming systems. OptimumDMD will vary depending on the type of stock being fed, e.g. freshly calved dairy cows versus dry suckler cows.
The main factor affecting DMD is crop maturity at harvesting. Assuming good early season management, ryegrassswards and correct soil fertility, target cutting date should be dictated by the type of silage required.
Most farms carry more than one class of stock over the winter, so more than one type of silage may be required. Thisshould be factored into the silage plan.
Planning your grass silage strategy
l. Reduced concentrate feeding
2. Improved milk solids yield
3. Improved cow condition at calving
4. Better herd fertility
5. Replacement heifers at target weight
6. Improved daily gain
7. Shorter finishing period
8. Higher annual grass yield
Benefits of Good Silage Planning
Where high DMD silage is part ofyour plan, talk to your contractorearly about planned cutting from15th to 25th May

Quality Grass Silage for Dairy and Beef Production�Systems
6
Planning your grass silage strategy
Step 1 Define the highest quality silage type required on the farm first
Step 2 Estimate the quantity of this silage quality needed
Step 3 Calculate area of first (and subsequent) cuts required to produce this silage
Step 4 Mark this area on the farm map and set the target cutting date(s)
Step 5 Manage the remaining area to produce silage of standard quality
75+ 74 72 70 68 66
Target Silage DMD for Different Classes of Stock
Fresh Autumn-Calving dairycows
Spring-calvingcows in milk
Finishing cattle
Dairy youngstock
Growing cattle
Dry dairycowpoor BCS
Suckler cow inmilk
Dry dairy cowgood BCS
Dry Suckler cows
Guideline Silage Dry Matter Intake (kg DM/day}
Suckler cows-Dry 8-9-Calved 10-12
Dairy Cows-Dry 10-12-Milking* 12-14
Weanlings 4.5-6Cattle (18-20 months) 7-9
*For dairy herds, target a further 400-600kg DM percow of good quality silage to supplement the milkingherd during spring and autumn grazing if necessary.
Adjust this target depending on stocking rate, landtype etc.

Quality Grass Silage for Dairy and Beef Production�Systems
7
Example Silage Plan- Dairy Herd
Stock
• 108 spring-calving dairy cows
• 26 weanling dairy heifers
• 2 breeding bulls
Land Available
• 44 dairy grazing ha
• 12 ha out-farm for silage/heifers
Details Action Plan
Step
1. • Good quality silage-72-74 DMD for milking herd and weanling heifers
4. • Standard silage- 68 DMD adequate for dry cows in good condition, stock bulls
5. • 110 (dry cows plus bulls) * 125 days* 11kg DM = 151 t DM 151t DM of 68 DMD silage
3. Require 14 ha @ 4.5t DM for high quality silage
• Close outside block {12ha) plus 12ha milking block for silage
• Bale 7ha of closed milking block area on May 20th {35t quality silage)
• Target 130 bales from grass surpluses Jun-Aug {30t quality silage)
2.• 108 cows @ 400kg DM = 43.5t DM 65t DM of 74 DMD silage
• 26 heifers * 150 days@ 5.5kg DM = 21.5t DM
6.• 17ha {12 ha outside block plus 5ha) cut in early June at 7.5t DM = 127t DM
• Close 7ha of external block for 2nd cut silage in late July= 35t DM

Quality Grass Silage for Dairy and Beef Production�Systems
8
Example Silage Plan- Suckler Herd
Stock
• 40 suckler cows
• 40 weanling calves
• 20 finishing steers
Land Available
• 37 hectares grassland
Details Action Plan
Step
1. • Good quality silage- 74 DMD for finishing steers
6. • 13ha cut in early June at 6.0t DM = 78t DM
4. • Standard quality silage- 68 DMD
• Restrict feeding to dry suckler cows
• Ad-lib silage plus meals to weanlings
5. • 40 dry cows * 125 days * 8.5kg DM = 43t DM 78t DM of 70 DMD silage
• 40 weanlings * 125 days * 6kg DM = 30t DM
3. Require 4.5 ha @ 4.5t DM for high quality silage
• Close 4.5 ha for baling in mid-May
2. • 20 steers * 120 days * 8kg DM = 20t DM 20t DM of 74 DMD silage

Quality Grass Silage for Dairy and Beef Production�Systems
9
Should I graze silage ground in spring?
Fig 1. Clean leaf at base
Fig 2. Dead material at base
• If milking herd can walk to silage ground- always graze in Feb/March before closing
• A clean, green base in March is essential for high quality silage in May (Fig 1)
• Graze to <4cm residual in Feb/Mar before applying fertilizer for silage
• Can also be achieved by tight grazing with young stock in late autumn
• Swards with yellow/dead material at base (Fig 2) in spring must be grazed off
• Silage DMD will be 6-8 points lower if this material is not removed before closing
• Graze all re-seeded silage ground at least twice before cutting to promote tillering
Graze some of the grazing ground first, before grazingthe silage ground. This is to ensure that there is grassavailable for grazing in early April.
Aim to have silage fields grazed off by mid-late Marchwhere good yields of high DMD silage are needed.
Be flexible in which areas are closed forfirst cut silage each year. Silage areas alsoused for grazing should have goodroadways and water supply to facilitateearly/late season grazing management

Quality Grass Silage for Dairy and Beef Production�Systems
10
How will spring grazing affect forage yield?
Effect of grazing on forage UFL harvested Feb-Jun
5000
4500
4000
3500
3000
2500
2000
1500
1000
500
0
Grazed
Silage
Not GrazedGrazed once
Fora
ge E
ner
egy
(UFL
) uti
lise
d p
er h
a
spring grazing reduced silage yield but increased total forage yield per ha
• Grazing once in spring (mid-March) reduces 1st cut silage yield by 0.5 to 1.2t DM per ha
• Earlier grazing/closing (mid-late March) and later cutting (late May to early June) reduce relative loss in 1st cut yield
• Intermediate heading swards grazed in spring have lower relative losses for May harvesting
• Late heading swards grazed in spring can be harvested 6-8 days later while retaining crop quality (DMD)
• Grazing spring grass before closing can improve total forage (grass plus silage) DM utilised per ha
• Total silage demand also decreases as spring grass displaces silage from the spring diet
• Grazing silage ground twice in spring significantly reduces 1st cut silage yield. However, it but may be necessary to graze a small percentage of area at the start ofthe second rotation if grass recovery is slower than normal.

Quality Grass Silage for Dairy and Beef Production�Systems
11
• Apply fertiliser and/or slurry evenly and as early as feasible
• Slurry should only be spread on bare stubble or very short grass
• 20% of the value of fertiliser spread on silage ground in Jan/Feb is retained for the silage
• Don't overestimate the quality of slurry. Good cattle slurry will have a DM of 7%, watery slurry could beas low as 3-4%
• A slurry hydrometer can be used to assess the DM% of slurry, helping to predict the nutrient content more accurately
• Trailing shoe increases N availability by 3 units
• Where cattle slurry is applied, delay the top-up fertiliser applications for 1 week
• In very deficient ground use 15 units of sulphur per acre for silage ground but avoid high application rates as it will tie up trace elements
• In wetter soil conditions fertiliser N can be split 50:50 for example 50% in late March I early April and theremainder 2 weeks later to reduce the risk of N losses
• Old swards will need 25% less N than that outlined in the tables (p12 and p20)
• A crop of grass silage will remove approximately 4kg P and 25kg K /tonne of grass DM
Fertilizer for First Cut Silage
High Potassium (K) silage increases risk of milk fever and related health problems in dairy herds.Target <2.0% K in silage fed for 2-3 weeks pre-calving. Where problems exist, reserve 150-200kgDM per cow of clean silage cut from areas with low K index/low slurry application (See p30)
A useful guide for fertilizer N is that grass crop usesup 2.5kg N (2 units) per day on average.
Apply fertilizer approximately 50 days before plannedcutting date.
However, the crop may still be harvested soonerdepending on nitrate and sugar levels.
Therefore if conditions are otherwise suitable, it isadvisable to test the grass crop rather than delayingcutting based solely on the '2-unit' rule.

Quality Grass Silage for Dairy and Beef Production�Systems
12
Assumes a target 5.5t DM per ha first cut crop- reduceN:P:K by 25:4:25 kg per ha on older swards with lowgrowth potential.
Reduce N requirement to 100kg/ha if field was grazednot cut last year.
Treat P and K requirements separately- many silagefields are have high K index but are low in P.
*values in parentheses show total slurry NPK value per hectare where approx. 33m3 per ha (3000 gallons/acre) is applied.
Fertilizer for First Cut Silage
Soil Index 1 2 3 4
40
175
30
155
125
12-14 (10% of N applied)
20
125
0
0
P Required kg/ha
K Required kg/ha
N Required kg/ha
Sulphur Required kg/ha
kg per tonne
Guideline values for organic fertilizers- spring application
0.7 (21)*
0.6 (17)
3.3 (105)
0.6 (17)
0.3 (10)
1. 7 (52)
2.1 (66)
0.8 (25)
2.2 (70)
1.4
1.2
6
Cattle Slurry7% DM
Cattle Slurry3% DM
Pig Slurry
FarmyardManure
N
P
K

Quality Grass Silage for Dairy and Beef Production�Systems
13
How does grass growth stage at cutting affect silage quality?
Quality Grass Silage for Dairy and Beef Production�Systems
14
Soil Fertility - Effects Silage on Yield and Quality
82
6000
5000
4000
3000
2000
1000
0
82
Good Soil Fertility
Date
Poor Soil Fertility
8078 76
6864
Silage DMD
72
62
Gra
ss Y
ield
tDM
per
ha
24-M
ar
31-M
ar
7-A
pr
14-A
pr
21-A
pr
28-A
pr
5-M
ay
12-M
ay
19-M
ay
26-M
ay
16-J
un
2-Ju
n
9-Ju
n
23-J
un
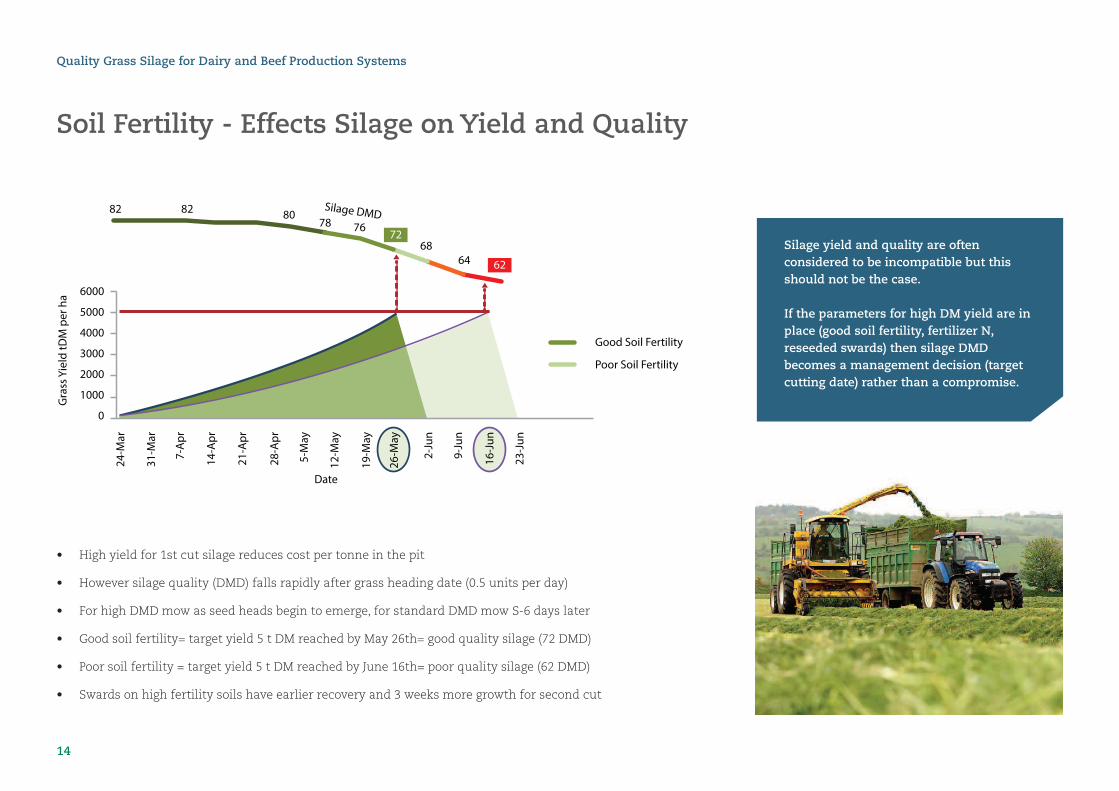
Silage yield and quality are oftenconsidered to be incompatible but thisshould not be the case.
If the parameters for high DM yield are inplace (good soil fertility, fertilizer N,reseeded swards) then silage DMDbecomes a management decision (targetcutting date) rather than a compromise.
• High yield for 1st cut silage reduces cost per tonne in the pit
• However silage quality (DMD) falls rapidly after grass heading date (0.5 units per day)
• For high DMD mow as seed heads begin to emerge, for standard DMD mow S-6 days later
• Good soil fertility= target yield 5 t DM reached by May 26th= good quality silage (72 DMD)
• Poor soil fertility = target yield 5 t DM reached by June 16th= poor quality silage (62 DMD)
• Swards on high fertility soils have earlier recovery and 3 weeks more growth for second cut

Quality Grass Silage for Dairy and Beef Production�Systems
15
Achieving Good Silage Preservation
Grass Sugars are converted to acidduring the anaerobic fermentationprocess. This acid preserves feedvalue of the crop in the sealed pit.The target sugar content to ensuregood fermentation is 3% or higher.This can be tested using arefractometer.
Optimum conditions for high sugarsare ryegrass swards, dry sunnyweather, cool nights and mowingin the afternoon when levels havebuilt up. Very leafy grass has lowersugars. Wilting will help to increaseDM content.
Refractometer- to test sugars
Fill and pit quickly, seal immediately
Buffering capacity measures theresistance to a drop in pH. Cropswith high buffering capacity mayhave a poor initial fermentation.
High nitrate in grass increasesbuffering capacity. This can bechecked using nitrate test strips.
However, nitrates are of secondaryimportance to sugar levels. Grasswill ensile correctly with up to800ppm nitrate provided sugars are adequate.
Wilting the crop to >28% DM helpsto overcome effects of high nitrate.
Test Strips- to test nitrate (NO3 ) content
Anaerobic conditions are essential for initial fermentationand to prevent subsequent spoilage. Fill the silo quicklyand roll well to exclude air. Chop length of 1.0 to 1.2cmpromotes good compaction. Cover with 2x0.125 mmpolythene sheets. Use vertical sheets along silo walls.Check for 3-4 days to ensure seal remains intact as the pit settles. Prevent bird damage.
Air FreeConditions
Air FreeConditions
Air FreeConditions
GoodPreservation

Quality Grass Silage for Dairy and Beef Production�Systems
16
Silage Fermentation Process
LAB
pH
Sugars
Clostridia
Protein
Ammonia
LAB
pH
Sugars
Clostridia
Protein
Ammonia
A. Good Fermentation B. Poor Fermentation
Fermentation begins after oxygen in the pit is depleted during the initial aerobicensilage phase. Under good conditions, lactic acid bacteria (LAB), which are presenton the grass, multiply rapidly and convert available sugars to lactic acid. This causespH to decline quickly- the optimum end point depends on silage dry matter. Somenutrient losses and protein degradation to ammonia occur during this phase, howeveronce target pH is reached, a clean forage with good intake potential is the result. Thenutrient value of this silage is preserved until re-exposure to air at feed-out.
In contrast, a poor silage fermentation occurs where one or more of the necessaryconditions (high sugars, low buffering capacity, air-free conditions) is not met. In theexample shown, low initial available sugars restricts the growth of LAB, causing aninsufficient drop in pH. This allows clostridia bacteria, also present on the crop butincreased with soil contamination, to begin a secondary fermentation . Ammonia levelsrise as protein is broken down. Clostridia bacteria convert residual sugars, lactic acidand protein to butyric acid, which results in a dark, foul-smelling silage with low feedvalue and poor intake characteristics.
Dry Matter% 18-20 20-24 24-26 26-30 30+
3.8 4.0-4.1 4.2 4.3-4.4 4.8Target silage pH
Fermentation time Fermentation time

Quality Grass Silage for Dairy and Beef Production�Systems
17
To Use an Additive or Not?
High quality silage can often be madewithout additives
No one additive is ideal in all circumstances
Make an informed decision based on current conditions
Additive Type Mode of Action When to use Molasses Rate per tonne fresh grass
Grass Sugar % 0-1 1-2 2-3
Litres/tonne 20 15 10
Molasses Increase fermentable sugars Low grass sugars, poor weather. Direct supply of available sugar
Acid Accelerates drop in pH Low sugars, poor weather
Absorbent Retain effluent, increase sugars Wet conditions. 50-100kg of pulp or hulls per tonne fresh silage
lnoculants Increase favourable lactic acid High DMD targeted. Requires good conditions & high availablebacteria (LAB) population sugars. LAB population not limiting in many situations
Wilting not an option
Test grass sugars & nitrate
(Plus Elevated Nitrate >600ppm)
Wilt to above 28% DM
Sugars >3%Sugars <2%
Additive Required
No Additive Required
Sugars 2-3%
Risk factors for poor ensilability
1) High Leaf content
2) Short N application Interval
3) Lack of sunshine

Quality Grass Silage for Dairy and Beef Production�Systems
18
How do wilting duration and swath treatment affect DM?
Wilting Hours
DM% of crop
6 metres per row
3 metres per row
Tedded Out
0
17
17
17
24
19
23
30
48
23
31
50
The change to grass dry matter content due to wilting is affected by duration of wilt and mechanical treatment of the swath. Dry matter of grass cut into large rows will change little in a 48 hour period. Tedded swaths wilted for >24 hours may becomeexcessively dry. Pit silage DM over 33% will not improve animal performance and may have poor aerobic stability at feed -out
Cutting silage in difficult weather conditions
• Delay mowing until it is very likely the harvest can be completed once commenced.
• Check sugar content and apply additive if necessary
• Reduce soil contamination- multiple field access points, keep concrete apron clean of soil
• Part fill trailers, work downhill on steep slopes, low ground pressure tyres {<1.0 bar pressure)
• Postpone harvesting the very steepest or wettest areas to a later bale cut if necessary
• Be prepared to handle high effluent outflow from wet crops

Quality Grass Silage for Dairy and Beef Production�Systems
19
Tips for Making Round Quality Bale Silage
Research at Teagasc Grange has shown
the most effective pattern for prevention
of bird damage is an 'eye' - circle with dot
at the centre-using white paint. Netting
should also be used if possible
• Mow when dew has evaporated and wilt to a target of 30 to 35% DM
• The aim is for dense, well-shaped bales with over 220kg DM per bale. Baler choppers increase DM per bale by 10-15%
• Use a slow tractor speed to produce well-packed bales. Adjust the baler density setting to a high/maximum position
• Avoid rough handling of unwrapped bales as this can cause them to lose shape. A bale lifter is preferable to a spike fortran sport
• Use a recommended plastic wrap sourced from a reputable supplier
• At least 4 layers of plastic are required for adequate preservation. Under good management conditions the benefits of 6 layers is small
• If bales are to be stored for a prolonged period (9 months+) then 6 layers is advised
• Ideally transport bales to final storage area before wrapping. Damage to wrap during transport is a significant source of DM loss
• Bales made from low DM or very leafy grass will lose shape when stacked, increasing spoilage losses. Store on ground level instead
• Check for damage and repair plastic on a regular basis
• Aim to have bales consumed within 2 days at feed-out. Do not feed mouldy bales or parts of bales to livestock
Quality Grass Silage for Dairy and Beef Production�Systems
20
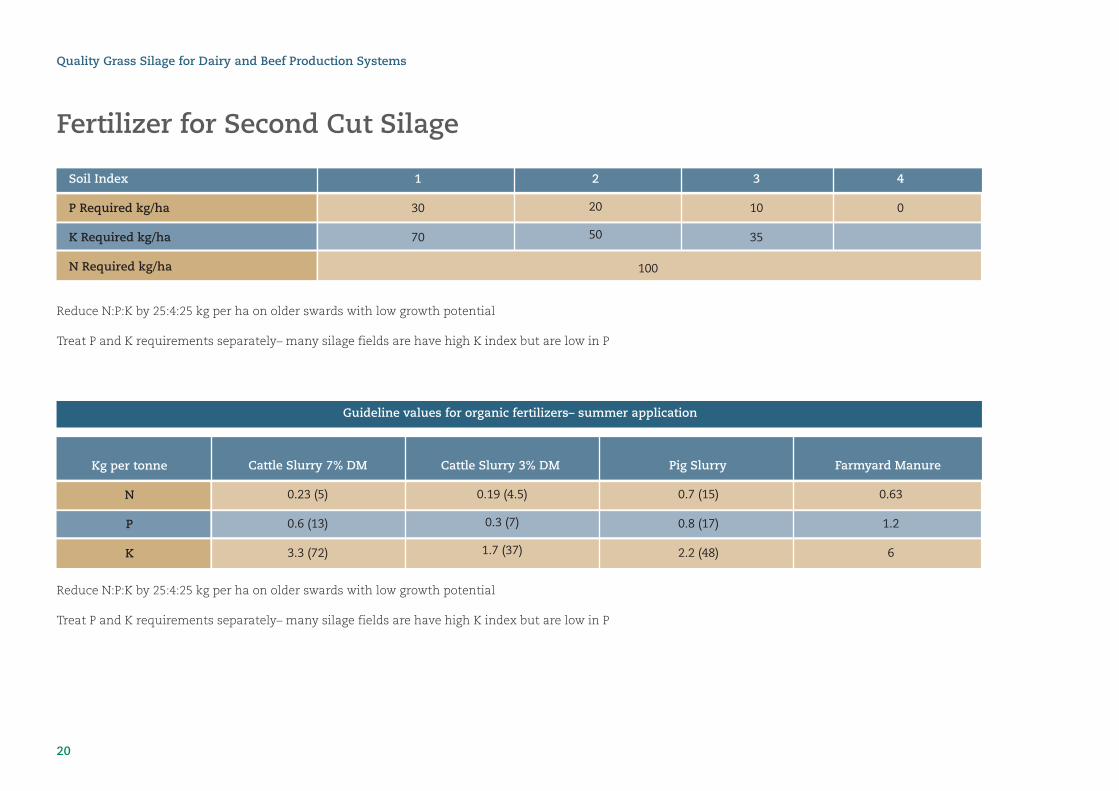
Fertilizer for Second Cut Silage
Soil Index
P Required kg/ha
K Required kg/ha
N Required kg/ha
1
30
70
2
20
50
3
10
35
4
0
100
Kg per tonne
N
P
K
0.23 (5)
0.6 (13)
3.3 (72)
0.19 (4.5)
0.3 (7)
1.7 (37)
0.7 (15)
0.8 (17)
2.2 (48)
0.63
1.2
6
Cattle Slurry 7% DM Cattle Slurry 3% DM Pig Slurry Farmyard Manure
Reduce N:P:K by 25:4:25 kg per ha on older swards with low growth potential
Treat P and K requirements separately– many silage fields are have high K index but are low in P
Reduce N:P:K by 25:4:25 kg per ha on older swards with low growth potential
Treat P and K requirements separately– many silage fields are have high K index but are low in P
Guideline values for organic fertilizers– summer application

Quality Grass Silage for Dairy and Beef Production�Systems
21
Reseed to Improve Silage Yield and Quality
Productive silage ground must have perennialryegrass swards. Old permanent pasture is lessresponsive to fertilizer nutrients for first cut crops,leading to delayed harvest and poor DMD. Lowersugar content also make preservation more difficult.
The decision to reseed should be based on potentialeconomic return, sward composition and performance.A rule of thumb is silage ground should be reseededevery 8-10 years (5-6 years for multiple cut systems).Many farms do not reach this target, especially if silageground is rented or on external blocks. A whole-farmreseeding plan should be put in place which includesilage areas.
DMD
Yield & spring growth Excellent spring growth and first cut yield essential Select high silage yield as the main trait
Heading Date Intermediates tend to have higher first cut silage yieldbut DMD may decline earlier
Limit the range of heading date to 5-6 days. Use later-heading varieties on heavier soils.
Tetraploids v Diploid High DMD and DMI , but swards tend to be more open Include at 40% of seed mixture on dry land. Limit use on wetter soils.
Hybrid ryegrasses Can have excellent yield for early first cut, howevergrass quality may be poor for mid-season grazing
Best suited to multiple cut systems. Do not use in mixed silage andgrazing ground, especially for milking herds.
High>74
Low<70
Improved Animal Performance
N response High30:1
Low14:1
Higher DM yield potential
Sugars High3%
Low1.2%
Better Preservation
Spring growth Good Poor Earlier cutting and/or grazing
Perennial Ryegrass Old Pasture Benefit
Reason Guidelines
Guidelines for selecting ryegrass varieties for silage

Quality Grass Silage for Dairy and Beef Production�Systems
22
Checklist for Successful Reseeding
✓ Identify paddocks for reseeding based on performance (tonnes DM per year) and ryegrass content
✓ Test soil pH, P and K status and put a plan in place. Reseeds will not perform if soil fertility issues are not addressed. Retest in 1 year
✓ Land drainage problems should also be addressed before reseeding is carried out
✓ Timing– reseed in early autumn to allow time for post-emergence spraying and grazing twice before winter closing
✓ Spray off the old sward and perennial weeds with a glyphosphate spray
✓ Begin cultivation 7-10 days after spraying. Graze or cut low to remove trash beforehand
✓ Cultivation method depends on field-to-field conditions. Ploughing, on-pass, direct drill etc. all work well if carried out correctly
✓ Firm fine seed bed and roll after sowing
✓ Apply lime, P and K based soil test results
✓ Apply 40kg N per ha when reseeding to promote grass establishment and growth
✓ Use a post-emergence spray at 6 weeks post sowing to kill off weeds at the seedling stage
✓ Monitor and control pests (slugs, frit fly, leatherjackets) in the new ley
✓ Grazing at least twice before cutting silage to promote tillering (this is a critical step that is missed on many farms)
See Teagasc Moorepark ‘Pocket Manual for Reseeding’ for more detail on these steps

Quality Grass Silage for Dairy and Beef Production�Systems
23
Soil P and K Fertility Index – Key to Yield and Quality
1
Severe restriction on growth
Reseeds do not perform
Silage yield and quality poor
2
Nutrients limiting grass growth
Annual DM yieldreduced
Need to delay cutting-lower DMD
3
Optimum Index
Good silage yield and DMD
Ensure fertilizer replaces off-take
4
P & K not limiting growth
Reserve of nutrients in soil
Monitor and apply P&Kwhen index falls to 3
Soil Fertility Index
• Low soil P & K levels reduce yield and quality of silage
• Poor N fertilizer response on low index soils
• Optimum is Index 3 for both P and K
• Regular soil tests are very important
• Build a fertilizer plan field-by-field based on test results
Sulphur
• Important for protein formation in grass
• Light, sandy soils are more prone to deficits
• Apply 20kg/ha to silage ground
• Ratio 10:1 to N

Quality Grass Silage for Dairy and Beef Production�Systems
24
Soil pH Analysis – The First Step to Quality Silage
P
K
N
4.5 5.00 5.5 6.0 6.5 7.0 7.5
Response to Fertilizer
Liming silage ground for best yields and quality
Optimum soil pH is 6.3
Poor response to P fertilizer at low pH
Response to N & K also reduced at low pH
Excess lime can reduce P response
Apply lime based on soil test results
Do not cut silage for 4-6months after liming– mayaffect preservation

Quality Grass Silage for Dairy and Beef Production�Systems
25
Silage Sampling and Analysis
Taking a representative silage sample
• Poor sampling technique is one of the main causes of unreliable silage analysis results.
• Wait 5-6 weeks after ensiling to take the samples
• Ideally use a long core sampler to sample 3-5 points from well spaced points on or between diagonals on the pit surface as per diagram. Core to within 0.5m of the pit floor
• Alternatively sample an open pit by taking 9 grab samples in a ‘W’ pattern across the pit face. Where high performance diets are being fed (e.g. finishing cattle, fresh milking cows) it is advisable to repeat sample at 4- week intervals if using this method
• Discard the top 100mm of each core before mixing into a composite sample. The final sample should weigh approximately 500g.
• Exclude air, seal well and post immediately. Avoid posting samples late in the week.
A standard silage sample from 500-tonne pit represents about 0.0001% of fresh materialavailable– ensure that a standard procedure is followed to generate representative samples

Quality Grass Silage for Dairy and Beef Production�Systems
26
Interpreting Silage Analysis
Silage quality is a function of 3 main aspects
• Nutritional value - Measures include dry matter, energy and protein content, digestibility and fibre fractions, oil, ash, intake potential
• Preservation- Assesses efficacy of the fermentation process. Measures include pH, ammonia, lactic acid, volatile fatty acids
• Mineral profile- Measures macro minerals, anion-cation balance, trace mineral content, plus antagonists.
Summary Value Ranges for Silage Analysis Parameters
Low Hgh Quality is best when
DM% 13-17 40-55 MediumpH 3 .4-3.7 4 .5-5 .5 Medium to LowAmmonia-N (%N) 4-7 15-25 LowLactic acid (%DM) 0.5-5 9-12 HighLactic acid (as% of acids) 10-25 70-90 HighAcetic acid (%DM) 1 .0 4-6 LowPropionic acid (%DM) 0.1 1-2 LowButyric acid (%DM) 0.1 1-4 Very LowVolatile fatty acids (VFA) %DM <2 5-8 LowSugars (%DM) <2 5-12 Medium/low depending on DMPotential Acid Load (PAL) mEq/kgDM 450-700 1000-1200 Low to mediumRumen Stability Value 220-260 350-450 Medium (260 to 300)
DMD(%) 55-65 76-80 High to moderateD-value (%) 50-60 67-74 High to moderateMetabolizable energy (ME) MJ/kg DM 8-9 11-12 High to moderateFermentable ME (FME) MJ/kg DM 5-6 7.5-9 .0 High to moderateFME/ME 0.5 0.75 -0.85 HighUFL (unit/kg DM) 0.7-0.8 0.90-0 .95 High to moderateUFV (unit/kg DM) 0.6-0.7 0.89-0.96 HighNDF (% DM) 42-47 55-65 Moderate to pwADF (% DM) 29-32 35-40 LowOil (%DM) 1-2 5-8 ModerateAsh(% DM) 5-6 12-15 Low to moderate
Crude protein (% DM) 7-9 15+ Moderate to highProtein PDIE (g/kg DM) 57-60 76-90 HighProtein PDIN (g/kg DM) 65-72 82-100 Moderate to high
FIM intake (g/kg livewt .075) 70-80 105-120 High
Preservation
Nutritionalvalue
SilageQuality
MineralProfile

Quality Grass Silage for Dairy and Beef Production�Systems
27
Silage Analysis– Key Measures of Nutritional Value Explained
Parameter Why it’s important What the analysis says
Dry Matter Important determinant of intake and preservation values. Mostsilage analysis parameters are expressed on a DM basis.
Range 15-45%. Optimum for intake is 28-32%. Low values can resultin low pH, poor intake. Reduced aerobic stability at very high values
Dry Matter Digestibility (DMD) The key measure of quality. Determines intake and energy valuesper kg DM. Low if cutting is delayed beyond heading date, and/ordead material present in base of sward. D value is a similarmeasure used in some analyses.
Values of 74+ suitable for high performance animals. DMD below66 is sub-maintenance feed for most classes of stock. Silage at 68-70 DMD adequate for dry cows requiring little body condition gain .
To convert D value: DMD = (D Value – 7.32)/0.84.
Net Energy ( UFL/UFV orMetabolizable Energy (ME)
Directly linked to DMD value. Increased energy values boost animalperformance and reduce cost of supplementation
Predicted from DMD and fibre fractions. Top quality silage can be>0.90 UFL, but values close to 0.70 are more common. Value dropsquite quickly for each day delay in cutting after grass heading date.
Neutral Detergent Fibre (NDF) A measure of forage fibre, NDF affects the intake potential and 'fill-effect' of silage. Strongly influenced by growth stage at cutting.
Lower is better for high intake and performance. Typical value is50- 55% for stemmy June silage. Highest quality requires NDF <44%.
Crude Protein (CP) Measures Nitrogen as an indicator of true protein content. Gives noinformation on the quality of protein. Typical values range 9-15%.
Usually higher in leafy/higher DMD silage, but this can vary. HighCP in silage tends to be rapidly degradable, leading to poorutilisation if diet energy is lacking. CP <10% may impede rumenmicrobial growth.
Feed Protein (PDIN and PDIE) PDI measures the true feed protein value to the animal based onavailable energy (PDIE) and Nitrogen (PDIN) content.
Quality silage will have high PDIE (>75g/kg) due to better energycontent, with a good balance of PDIN (3-5 units higher). Low PDIvalues indicate that extra protein supplementation is essential.
FiM Intake Value (g DMI /kg W00.75) (Dairy cows)
Dry matter intake potential is a major limiting factor forperformance. FiM is un-supplemented silage intake potential,expressed per kg metabolic liveweight
High DM, DMD, and good preservation contribute to better FiMintake values. Silage DMI on 0-3kg concentrate can be estimatedby dividing FiM value by 8 (for Hol/Fr cows) or 9 (forJersey/Crossbred cows)
Ash High ash indicates soil contamination, may affect trace mineralabsorption. Feed quality per kg DM reduced.
Carry out mineral analysis if ash is >8% - adjust supplementation .Take steps to reduce soil contamination in cutting in wetconditions.

Quality Grass Silage for Dairy and Beef Production�Systems
28
Silage Analysis– Key Measures of Preservation Explained
Parameter Why it’s important What the analysis says
pH A primary indicator of preservation quality and fermentationefficiency, pH measures acidity of the final silage product. Veryacidic (low pH) silage has poor feed intake and rumen stability. HighpH in wet silage indicates poor preservation- ammonia is usuallyhigh in this case leading to poor intakes
Target pH depends on DM content of the ensiled crop. A pH of 3.8 to4.2 indicates good preservation at <28% DM. Dry/wilted crops (>28%DM) can be well preserved at pH up to 4.5. Wet silage with pHvalues of > 4.2 are generally poorly preserved. Where silage pH is<3.6, adjust diets to ensure correct rumen pH
Lactic Acid High lactic acid content results in clean, sweet smelling silage withgood stability and intake characteristics. Low values result in foulsmelling material with poor feed quality.
Average value is 7.5% of DM. Lactic acid at 8-10% of DM, and >75%of total acids, means excellent preservation. Dry silage can be well-preserved at 1-2% of DM lower. Values below 5% mean poor quality.
Volatile fatty acids (VFAs) Acetic, butyric and propionic acid. These are unfavourable end-products of silage fermentation.
Lower figures are better. Total VFAs (as % of DM) should be lessthan 2% and lower than total lactic acid content
Potential Acid Load (PAL) Measures the risk of acidosis. PAL estimates rumen acid load whensilage is fed, comprising i) the acid present in the silage and ii) acidproduced when the silage is fermented in the rumen.
Values below 900 indicate moderate to low risk of acidosis. Silage atPAL 900-1100 fed as the sole feed should not cause issues butcaution advised if using high concentrate feeds– replace starchwith digestible fibre. Silage at PAL >1100 may require rumen buffers
Rumen stability value (RSV) RSV is calculated from acid content and silage NDF. It estimates thepotential effect of the silage on rumen pH.
Low RSV (<200) indicates risk of rumen acidosis– may need toadjust starch levels and add buffers. Silage RSV increases withhigher NDF, however too much fibre reduced intake overall. Target220-300 RSV
Ammonia Ammonia (NH3) results from protein breakdown duringpreservation, reducing feed quality and palatability. High nitrate in grass at ensiling contributes to elevated ammonia.
Values of less than 8-10% show good fermentation with littleprotein breakdown. Silage ammonia levels above 15% indicate poorpreservation and will likely result in feed refusals

Quality Grass Silage for Dairy and Beef Production�Systems
29
Grass Silage Mineral Analysis
Macro Mineral Mean1 (SD) % DM Comments
Typical mineral requirements (as % total DM intake) for different classes of stock
Ca P K Mg S Na
Milking Cows 0.65 - 0.75 0.35 - 0.42 - 0.22 to 0.28 0.20 0.22 - 0.30
Dry cows 0.45 – 0.50 0.30 <1.9 0.40 0.20 0.18
Weanling Cattle 0.55 0.35-0.40 - 0.18 0.20 0.20
Finishing Cattle 0.55 0.32 - 0.18 0.20 0.20
Calcium 0.54 (0.110) Average value 0.54% of DM. tends to increase with sward maturity
Phosphorus 0.25 (0.423) Silage P content associated with soil P status and P fertilizer strategy. Forage P 0.30% to 0.35% optimal
Potassium 1.81 (0.531) Essential for good DM yield, but high forage K (>2.4%) is a major risk for milk fever. Highest with earlycutting, leafy grass and heavy cattle slurry applications. Reserve some low K silage for feeding to lategestation cows. Direct K toxicity is extremely unlikely under natural conditions
Chloride 0.98 (0.322) Silage Cl content is associated with use of K fertilizer (potassium chloride). Excess Cl is not usually an issue
Magnesium 0.16 (0.0324) Important for milk fever prevention in dairy cows. Supplement diet based on forage Mg content
Sulphur 0.15 (0.0305) Optimum S content of dairy and beef diets is 0.2%. Apply fertilizer S at 1:10 ratio to N
Sodium
1 Based on 320 silage samples from Teagasc client farms 2011-12
0.29 (0.193) Low Na forages (<0.24%) may have reduce feed intakes. Apply Na fertilizer in spring, supplement dietswith salt based on animal requirements

Quality Grass Silage for Dairy and Beef Production Systems
30
Silage Cation Anion Balance (CAB)
Silage cation anion balance (CAB value) describes the mineral balance between the majorcations (Na and K) and anions (Cl and S) in the silage. Lower (negative) CAB in the pre-calving diet promotes mild metabolic acidosis, which aids in the prevention of milkfever through its effects on Ca mobilization from bone. Equations describing CAB valuesfactor in the mineral content of silage and the relative atomic mass of each element:
CAB (meq/kg) = [(Na/0.23) + (K/0.39)] - [(Cl/0.355) + (S/0.16)]
Example: A silage with 0.28% Na, 1.99% K, 0.95% Cl, and 0.15% S has a calculated CAB of[(0.28/0.23) + (1.99/0.39)] - [(0.96/0.355) + (0.15/0.16)] = 267meq/kg
Grass silages with CAB <180meq/kg reduce milk fever risk, while CAB >350meq/kg isassociated with significant increases in milk fever incidence. Forage K levels in grass silageare usually the main driver of high CAB values. Anionic salts can be fed to reduce CAB,however these tend to be unpalatable and may cause issue with low feed intake. The mostappropriate strategy is often to remove high K silage from late gestation diets, or dilutecation content by feeding 2-3kg DM of haylage/straw from 2-3 weeks pre-calving.
Grass Silage Mineral Analysis
Silage Mineral Content
Na %
K %
Cl %
S %
CAB meq/kg
‘Low milk fever risk’
0.17
1.78
0.90
0.16
134
‘High milk fever risk’
0.22
2.83
0.96
0.16
450
Micro (Trace) Minerals
Selenium (Se)
Manganese (Mn)
Copper (Cu)
Cobalt (Co)
Zinc (Zn)
Iron (Fe)
Aluminium (Al)
Molybdenum (Mo)
Mean ppm (SD)
0.073 (0.0432)
102 (60.2)
6.16 (1.822)
0.15 (0.153)
51 (262.3)
261 (319.1)
149 (145.4)
1.59 (1.182)
Silage micro mineral content varies with soil type.Soil contamination at harvest can result in highIron (>500ppm) and Aluminium (>700ppm),reducing availability of micro minerals (e.g. Cu, Znand Se). High Mo (3.5 ppm) also reduces Cuavailability. Effects may be exacerbated aftersulphur and lime applications. Analyze silage CABand micro-mineral profiles where animalperformance and metabolic health issues haveoccurred previously.

Quality Grass Silage for Dairy and Beef Production�Systems
31
Reducing DM losses at harvest and feed-out is often overlooked as a potential means ofimproving silage value. High losses add significantly to the cost per tonne of silage fed, andincrease requirement for purchased feed. The main sources are poor aerobic stability (poorfermentation), failure to seal pits fully, excessive pit face exposure to air and waste at thefeed barrier. Silage moulds can be dangerous to cattle, adding to losses. To control losses:
1) Fill pit quickly, exclude air and seal fully
2) Don’t over-wilt. Very dry silage may heat in air
3) Minimize pit face time exposure to air
4) Manage losses at barrier– feed silage 3 times weekly at a minimum. Remove silage refusals regularly.
5) Pit silage losses can be high in warm weather. If possible, use high DMD bales when summer buffer feeding is required
Managing silage losses in the pit and at feeding
Grass DM loss –field to barrier High 35%
Avg.25%
Low15%
€155 €135 €120Cost per tonne silage DM fed
High pit face losses
• Poorly sealed edges
• Pit face too wide
• Loose pit face- air
• Heating– high pH
• Physical losses
• Mould
Low pit face losses
• Sealed at edges
• Narrow pit 3-4 days across
• Shear-grab cut face
• Clean stable silage

Quality Grass Silage for Dairy and Beef Production�Systems
32
Attention to Farm Safety is essential at silage making. There is considerable high risk activity, often under timepressure, so safety control is needed to prevent serious or fatal accidents.
Safety at silage making requires a lot of organisation and co-operation between contractors and farmers. Everyworkplace has a duty to produce a Safety Statement or safety plan. For workplaces with three or less employees(97% of farms) completion of a Risk Assessment document is accepted as an alternative to preparing a SafetyStatement.
• The majority of fatal accidents now occur when a person gets struck or crushed by a farm vehicle in or around afarmyard. Older farmer and children are particularly at risk. Control access to high risk areas
• Children should be well supervised at all times during silage making. The farmyard should be a ‘no go area’ for children without supervision. No exceptions.
• Yards should be free of obstructions to allow the free flow of equipment. Good visibility is necessary at access points to public roadways. Warning signs and bollards should be used on road verges.
• As industrial loaders put enormous pressure on silage pit walls especially when grass is wet. Walls should be checked in advance for soundness and drainage pipes need to used when grass is wet. Fit sighting rails to walls.
• Blockages and breakdowns lead to high injury risk. Turn off the PTO and stop the engine before attempting to unblock a machine.
• As toxic gases are produced during silage making time, there should always be good air circulation. Never go under the polythene sheet.
Further information of Farm Health and Safety is available at the following Web sites:http://www.hsa.ie/eng/Your_Industry/Agriculture_Forestry/ http://www.teagasc.ie/health_safety/
Think Safety at Silage Time!

Quality Grass Silage for Dairy and Beef Production�Systems
33
January
February
March
April
May
June
Month Task Decisions
• Plan your silage strategy (p6 & p7)
• Manage pit face and feed barrier to reduce DM losses (p32)
• Soil Test silage area (p24 & 25)
• Graze silage ground on milking block (P10)
• Slurry areas requiring P & K (p12 & 13)
• Fertilizer NPK plus S (p12 & 13)
• Roll fields
• Close silage ground (p11)
• Talk to contractor about early silage cut if required (p6)
• Monitor grass growth stage (p14)
• Check sugars plus nitrates in grass crop (p16-18)
• Silage safety plan (p33)
• Manage silage effluent
• Lime post silage cut (p25)
• Fertilizer NPK for 2nd cut (p21)
• Bale surplus grass paddocks (p20)
Monthly Checklist for Silage Management

Quality Grass Silage for Dairy and Beef Production�Systems
34
July
August
September
October
November
December
• Check silage covers for bird damage (p16)
• Bale surplus grass paddocks (p20)
• Second silage cut (p16-19)
• Reseed to improve sward quality (p22 and 23)
• Final surplus grass bales harvested (p20)
• Soil test silage area (p25 and 25)
• Complete an outline fodder budget (p35)
• Silage sampling & quality analysis (p26-29)
• Silage mineral analysis (p30 & 31)
• Formulate winter diets using test results
• Review silage quality results – note potential changes to management for next season (p6 and 7)
• Manage pit face and feed barrier to minimize losses (p32)
• Monitor animal performance (daily weight gain/ milk yield) and review diet formulations
• Repeat silage quality analysis for high-performance systems e.g. winter milk/ finishing cattle (p26 & 27)
Monthly Checklist for Silage Management
Month Task Decisions

Quality Grass Silage for Dairy and Beef Production�Systems
35
Section 1. What forage is needed on the farm?
Calculate SilageBudget Balance
Silage Balance
% Deficit (Balancedivided by X or Y)
Pit and bales( F—X)
Bales only(C—Y)
A B C A x B x CAnimal Type Number Months Pit silage* tonnes Total tonnes
per head/month required
Dairy cow 1.6
Suckler cows 1.4
0-1 weanlings 0.7
1-2 year old 1.3
2+ years old 1.4
Total pit silage needed*( at 22% DM) X
or
Total bales needed (tonnes multiplied by 1.1) Y
Section 2. What forage is available on the farm?
Farms with pit silageand bale silage
Farms with bale silage only
A
B
C
D
E
F
A
B
C
Pit silage in yard
Pit silage to be cut (acres * 7t/ac)
Total pit silage (A + B)
Bales in yard
Silage tonnes in bales(multiply bales by 0.9)
Total silage (C + E) stocks
Bales in Yard
Bales to be cut
Total Bales (A + B) stocks
Silage Budgeting Worksheet
Pit silage: (Length x Breadth x Height metres) /1.35 = tonnes equivalent
Act early if deficits are likely. Plan ahead– a range of measures may be needed. Secure at least 60% ofsilage requirement before looking at other options. Reduce demand from low value stock. Selling 12 cullcows early saves 100 tonnes of silage (110 bales). Sell store cattle and/or put finishers on high graindiets. 2-3kg straw plus meals can bridge shortfalls, so too soya hulls and other high fibre products.Purchase alternatives on a per unit energy plus protein basis. Always check that the final diet isbalanced for energy, protein, fibre and minerals. Consult Teagasc advisory for feed budget analysis andthe relative value of feeds. Copies of this worksheet are available at www.teagasc.ie/advisory

Quality Grass Silage for Dairy and Beef Production�Systems
36
Case studies– Quality Silage for Dairy and Beef Systems
Trevor Minion, Wicklow
I run a spring-calving suckler to finish system, a dairy calfto beef system, plus some tillage, on a mainly dry farmoutside Wicklow town. Steers are finished at 24 monthsold (370 -380kg carcass weight) with heifers at 23 months(348kg carcass weight). Along with high quality silage Ifeed 5-6 kg of concentrate during the finishing period. Thetarget is to average lkg per day liveweight gain in thefinishing period, and 0.6kg gain per day for weanlings inwinter on very little meal fed.
Good quality silage is essential for reducing meal costs over the expensive winter period.I aim for silage at 72 DMD or higher on a consistent basis. I harvest early as possible,generally around the last week of May to ensure maximum leaf content in the swardand to avoid stemmy material.
Silage ground is grazed with yearlings in early spring to remove any dead material fromthe base of the sward. Silage fields are closed in early April and fertilizer applied basedon recent soil test results. Reseeding plays a big role in maximising grass growth andquality for silage and grazing.
Silage area is managed as part of the farm reseeding programme to ensure high contentof perennial ryegrass and to control weeds and docks.
Harvest
28th May
NH3
7.6
pH
3.9
DM%
24.8
Cr Protein
11.7
DMD
73
UFL
0.82
UFV
0.78
Silage quality results (2015 average)
Denis and Christy Nulty, Rathkenny, Co. Meath
We operate a block autumn-calving herd on the home farmand a spring calving herd on a separate unit 2 miles away.Last year combined milk sales were 6820kg per cow @487kg milk solids per cow. About 30% of annual milk is soldduring the winter period. All heifers are reared on the farm.
First cut silage is taken from land outside the milkingplatform. This ground is grazed bare by heifers inNovember, with any remaining covers grazed off beforethe end of February. Fertilizer N and slurry are applied by
15th March to set up for a target cutting date of 10th to 15th May. Around 100 units/acreN in total is applied. We use 18:6:12 to top up slurry P&K, based on soil test results.
For high DMD first cut, we mow grass at high leaf content well before heading date. Itis usually wilted for 24 hours. No additive is used unless conditions are poor. First cutsilage is used for the winter milking diet, for buffer feeding when grass is scarce, andfor weanling heifers in their first winter. High DMD gives a significant saving on meal,and we are less reliant on alternative forages.
While first cut yield is generally lighter, the sward has a long interval to second cutwhich improves yield and quality. This silage is fed to dry and late lactation cows. Wefeed a high fibre silage with low K content for 2 weeks before calving to control milkfever. The average reseeding interval for silage ground here is 8-10 years.
Harvest
14h May
NH3
6.1
pH
3.8
DM%
26.7
Cr Protein
12.5
DMD
82
UFL
36.9
UFV
0.86
Silage quality results (2015 average)

Quality Grass Silage for Dairy and Beef Production SystemsA Best Practice Guide