y. 7, © — sp eat
TRANSCRIPT
“4
INVESTIGATION OF OPERATING CONDITIONS IN STIRRED BALL MILLING OF COAL %
by
Michael J. Mankosa,, \\
Thesis submitted to the Faculty of the Virginia Polytechnic Institute and State University
in partial fulfillment of the requirements for the degree of
MASTER OF SCIENCE
in
Mining and Minerals Engineering
APPROVED:
Y. 7, © — SP eat 7 “© ~
G. T. Adel, Chairman R. H. Yoon
/ 4 OO J. R. Lucas WM. E. Foreman
June, 1986 Blacksburg, Virginia
“ a

Lys Sass V§5SSo.
19 Sle NS bur4 Cra
ACKNOWLEDGEMENTS
The author wishes to express his gratitude and
appreciation to Dr. Greg Adel and Dr. Roe-Hoan Yoon for
their guidance and support throughout the course of this
project. He is also grateful to Dr. W. E. Foreman, Dr. J.R.
Lucas and the Department of Mining and Minerals Engineering
for the financial support provided.
Acknowledgements are also extended to Beth Dillinger and
Wayne Slusser for their technical assistance. Special thanks
are given to his fellow graduate students in the department
for their friendship and support.
Special acknowledgements are expressed to Jerry Luttrell
and Waverly Hale for their constant assistance. This work
would not have been possible without the help of their late
night discussions and invaluable suggestions. They truely
define the word friendship.
Finally, the author wishes to express his deepest
appreciation to his parents, and especially to his wife,
Cathy, for their endless support, understanding and love.
TABLE OF CONTENTS
ACKNOWLEDGEMENTS
TABLE OF CONTENTS.
LIST OF FIGURES.
LIST OF TABLES
INTRODUCTION . I. se e * CJ e e es
1.1 General . ....e «© e
1.2 Literature Reveiw...
1.2.1. Particle Size 1.2.2. Fine Grinding 1.2.3. 1.2.4.
1.3 Objectives. .....e.
II.
PARTICLE SIZE DISTRIBUTIONS PARTICLE SIZE ANALYZER.
2.1 Introduction .........
2.2 Theory . . « « « © «© «© «© © @ 2
2.2.1. Data Blending. .... 2.2.2. Mass Balancing... .
2.3 Experimental . .....s«.e.e-s
2.3.1. General Sizing 2.3.2. Sizing a Coal Sample .
2.4 Results. . . 2. 2. 2 2 © © © «@
2.4.1. 2.4.2. 2.4.3.
Analysis. Techniques.
The Development of Stirred Ball Past Studies on Stirred Ball Milling.
Milling
s se e e s e * e e e e e
A PROCEDURE FOR BLENDING AND MASS BALANCING OF FINE USING THE ELZONE
and Analysis Procedure.
Effect of Blending and Mass Balancing. Reproducibility. Sensitivity Analysis .
Page
ii
iii
vi
ix
23
23
26
26 30
32
32 35
38
38 38 40
Itt.
IV.
2.4.4. Comparison with other Sizing Techniques . ..... e
2.5 Discussion .....« « «© ec e ee
2.5.1. Error due to Particle Characteristics. 2.5.2. Statistical Error Analysis .
2.6 Summary and Conclusions. ....
2.7 Nomenclature .......e..s.e.
EFFECT OF MEDIA SIZE IN STIRRED BALL GRINDING OF COAL .......+.«-s
3.1 Introduction. .......e..
3.2 Experimental. .......e.es
3.2.1. Samples ......e... 3.2.2. Experimental Apparatus. 3.2.3. Experimental Procedure.
3.3 Results e e a e e e e a ® * e e
3.3.1. Rate of Breakage. ... 3.3.2. Energy Consumption. .. 3.3.3. Media Type. ......
3.4 Discussion. . ...... «es
3.4.1. Effect of Particle Size Rate. 2. 2. 2 2 «© « «© «
3.4.2. Angle of Nip Analysis .
on Breakage
e
3.4.3. Normalization of Breakage Rate.
3.5 Summary and Conclusions ....
EFFECT OF OPERATING PARAMETERS IN STIRRED MILL GRINDING OF COAL ....... .
4.1 Introduction .......e. .
4.2 Experimental . ......2.e-.
4.2.1 Samples. . . 2. « «© « « e« 2.2. Reagents ....... - -2.3. Experimental Procedure .
BALL
40
46
46 47
49
51
52
52
54
54 54
60
60 63
71
71 72 75
81
82
82
83
83
83

4.3 ResultS. . . 2. « «© © © «© © «© © © © © © «© «© « «© 85
4.3.1. Effect of Stirring Speed ....... 85 4.3.2. Effect of Pulp Density ........ 88 4.3.3. Effect of Grinding Aids. ....... 91
4.4 Discussion . ...... 6 «© © © © © © «© © « « 93
Stirring Speed . . . 2. « « «© « « «© «© « 93 Percent Solids . .......-e.e«-.e 95 Grinding Aids .........e« ss 98 &
&
& ~4.1
24.2 4.3
4.5 Summary and Conclusions. .......e... 101
i
V. GENERAL CONCLUSIONS AND RECOMMENDATIONS FOR FUTURE WORK e * e e e * e “ e a e ° e . e e ° » ® e e 10 3
5.1 General . . .. 2. © » © © © © © «© © «© © © © © 0 LOB
5.2 Recommendations for Further Work ...... e105
REFERENCES es es e @ e . e s e 0 s e es e e e e s s e ® e e 107
APPENDIX I: Calculation of Specific Energy Input. .. .113
APPENDIX II: Example of Charge Calculation for Batch Stirred Ball Mill. .........-.. 6.115
APPENDIX III: Angle of Nip Theory for Different Ball Sizes. . 2. 2. 2. 2 «© © © «© «© © «© w e ell
VITA 2. 2 2 6 ew ew ew ew ww we ew wt ew ww ww we ew: A L283
ABSTRACT

Figure
Figure
Figure
Figure
Figure
Figure
Figure
Figure
Figure
Figure
Figure
Figure
Figure
Figure
2.2.
2.3.
LIST OF FIGURES
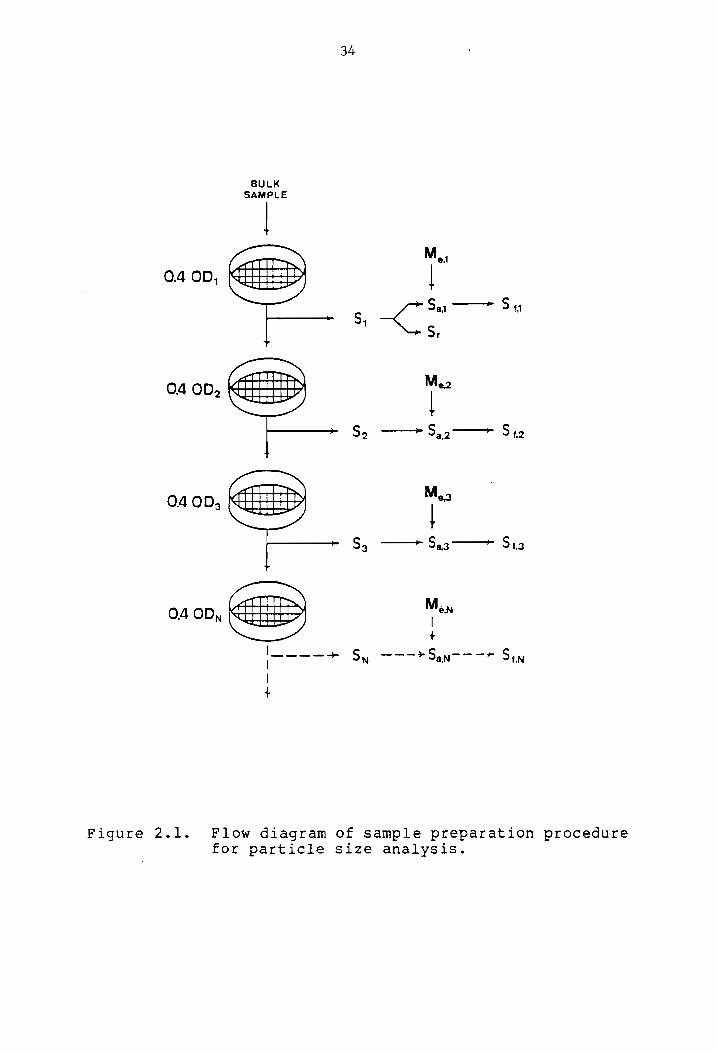
Flow diagram of sample preparation procedure for particle size analysis. ...
Sample display of input data required for mass balancing a particle size distribution
Effect of blending and mass balancing on particle size distribution ..... the
Demonstration of Reproducibility using the 380, 76 and 24 micron orifice tubes and
mass balancing. .
Particle size distributions for an Elkhorn seam coal sample attrition ground for 15, 30 and 45 minutes
Comparison of the size distribution for a Minus 20 micron Elkhorn seam coal sample uSing the Elzone 80XY and Micromeritics Sedigraph particle size analyzers .....
Comparison of the size distribution for a minus 150 mesh silica sample using the Elzone 80XY and the Andreason Pipette...
Schematic diagram of the batch attrition mill. 2 s
Schematic diagram of the mill assembly...
Feed disappearance plots for attrition milling of Elkhorn seam coal. ......
Grinding rate vs. mean feed size for attrition milling of Elkhorn seam coal. .
Grinding rate vs. ball size for attrition Milling of Elkhorn seam coal. ......
Effect of ball diameter on product size distribution at constant energy input for attrition milling of Elkhorn seam coal. .
Effect of ball diameter on Charles' law for attrition milling of Elkhorn seam coal...
Vi
Page
34
37
39
41
42
44
45
55
56
61
62
64
65
67

Figure
Figure
Figure
Figure
Figure
Figure
Figure
Figure
Figure
Figure
Figure
Figure
Figure
3.8.
3.9.
3.10.
3.11.
4.2.
4.3.
Effect of media type on grinding rate for attrition milling of Elkhorn seam coal... 69
Schematic representation of the angle of nip between grinding media in a stirred ball mill . 2. 2.2. 2. 2 2 «ww ew ewe ew ew we FB
Breakage rate vs. normalized ball diameter for attrition milling of Elkhorn seam coal. 76
Specific breakage rate vs. normalized ball diameter for attrition milling of Elkhorn seam coal e * e se e e e e e e es e e * e e e 78
Effect of stirring speed on product size distribution at constant energy input of 65 (kwh/ton) for attrition milling of Elkhorn seam coal . . . 2. 2 «© «© «© © © «© © © © © 2 ee 86
Effect of stirring speed on product size distribution at constant energy input of 94 (kwh/ton) for attrition milling of Elkhorn seam coal . . 2. 2 « «© «© © © @ © © e ew ew ew ew 87
Effect of percent solids on product size distribution at constant energy input of 94 (kwh/ton) for attrition milling of Elkhorn seam coal ... 2. « © «© «© © © © ee we ew ew ew 89
Effect of percent solids on product size distribution at constant energy input of 280 (kwh/ton) for attrition milling of Elkhorn seam coal ......+.+-2++2.6-+2. 9D
Effect of grinding aid addition on mean product size at constant energy input of 94 (kwh/ton) for attrition milling of Elkhorn seam coal ..... 2 «© «© «© «© © «@ © 92
Effect of stirring speed on torque draw in attrition milling ........2.+.4e2+2.2e 94
Effect of percent solids on torque draw in attrition milling e e e e e * « e e « e * e 96
Effect of grinding aid addition on torque draw in attrition milling ......... 99
Schematic representation of the angle of nip between different size grinding media in a stirred ball mill .......... 4118
vii

Figure 2
Figure 3
Figure 4
Simplified geometry for balls having different diameters ......e.e....e .119
Calculated coefficient of friction required for grinding. . . 2. 2. 2. «© «© «© © © @ @ © © CL 2d
Calculated feed diameter versus optimum ball size for different values of coefficient of friction . ...... « «© -1L22
viii

LIST OF TABLES
Page
Table 2.1 Data for Blending of Two Orifice Tubes. ... 29
Table 3.1 Ball Particle Diameter Ratio. ........ 79
Table A.1l Torque Data . ....... .« « «© « « « « « oLl4

CHAPTER I
Introduction
1.1.-General
Grinding is an important step in the production of most
minerals. It results in the production of particles of the
required size and shape, the liberation of valuable material
from the gangue for further concentration and an increase in
available surface area. Unfortunately, grinding is also the
most energy intensive process in mineral processing. It has
been estimated that 1% of the total U.S. steel consumption
and 2% of the total U.S. energy consumption can be attributed
to comminution (National Materials Advisory Board, 1981).
These facts coupled with the depletion of higher grade ore
deposits and a need to process more finely disseminated ores
have produced a drive towards developing more energy
efficient methods of fine grinding.
Aside from mineral liberation, however, ultrafine
grinding is used in numerous applications, for example to
produce fillers in the plastics industry, to produce fillers
and extenders in the paint industry, and to produce fillers
and coating grade pigments in the paper industry. More
recently, the grinding of coal to micron sizes in order to
liberate pyrite and other mineral matter has been extensively
studied. Once this material is liberated, advanced

separation techniques, such as microbubble flotation, can be
employed to produce a super-clean coal containing less than
one or two percent ash and less than one percent sulfur
(Luttrell et al, 1985).
The production of coal-water and coal-oil slurries also
requires the particle size to be reduced to 70 to 80% minus
200 mesh in order to reduce the errosion of pumps, valves and
pipes, as well as, to improve the stability of the slurry.
Long term stability requires the use of chemical additives or
very fine pulverization of the coal to about 15 microns or
less (Freedman, Porter and Jamgochian, 1978). Micronized
slurries reduce errosion problems, are more manageable and
improve combustion efficiencies (Sepulveda, 1981). The
Single drawback encountered is a reduction of the maximum
solids loading to about 50% by weight (Davis, 1986).
Conventional ball milling techniques require long
retention times and tremendous energy input in order to
produce micronized coal. For this reason several new
techniques have been developed over the past years to reduce
the energy consumption when grinding to fine sizes. These
include vibratory milling, impact milling and stirred ball
milling. Of these techniques, stirred ball milling appears
to be the most promising, producing a finer product with a
lower specific energy input (Sepulveda, 1981).

1.2.-Literature Review
1.2.1.-Particle Size Analysis
The primary objective of particle size analysis is to
determine the size and distribution of particles in a given
sample. The particle size distribution is the most
fundamental characterization of a mass of granular material
(King, 1984). However, a true representation of particle
Size is often difficult to obtain due to irregularities in
the shape of the particle. A spherical particle can be
accurately described by its diameter, whereas an irregularly
shaped particle may require several dimensions to approximate
its shape. For this reason, equivalent diameters are
frequently used to report the size of an irregularly shaped
particle. An equivalent diameter refers to the diameter of a
sphere which behaves similarly to an irregularly shaped
particle when subjected to a given influence. For example,
the Stokes' diameter corresponds to the diameter of a
spherical particle with the same settling velocity as an
irregularly shaped particle. The effect of shape on the
determination of particle size is one of the most difficult
problems encountered with any technique of particle
measurement.
Numerous methods have been developed over the past
decades for accurately determining the particle size
distribution of a powder. These include decantation,
centrifugal sedimentation, elutriation, photo- and X-ray
sedimentation, laser diffraction and electrical resistance.
Each method is applicable over a certain range of particle
size. The range depends upon the physical parameter which is
used to measure particle size. For instance, sedimentation
techniques are influenced by the density of the particle and
the suspending fluid. Photo, x-ray and laser techniques are
limited to the sensitivity of the detector.
Most techniques also have a lower detection limit. This
limit is usually a function of the physical parameter which
is being used to size the material. For instance,
centrifugal processes, such as the cyclosizer, are limited to
the maximum fluid velocity which can be generated. Sieving
has no limit in theory, however construction of screens
smaller than 5 microns is extremely impractical. Optical
microscopy is also limited to about 1 micron due to the
resolution of the microscope.
Electrical sensing techniques also have lower detection
limits. The limits are usually a function of the signal to
noise ratio generated by the device. For instance, the
Coulter Counter can easily recognize a 40 micron particle
when using a 100 micron orifice. However, the resistance
generated by a 0.1 micron particle while passing through the
Same orifice may be indistinguishable from the background
noise.
The current attention focused on grinding to ultrafine
sizes makes it necessary to have an understanding of the
various fine sizing techniques, including the capabilities
and limits of these techniques. The following is a review of
the various techniques which have been used for determining
particle size distributions of fine powders.
Sieving
Laboratory sieving is one of the oldest methods of
particle size determination. The use of punched plate sieves
is recorded in early Egyptian drawings. Agricola had
illustrated woven wire sieves in 1556. Sieving is carried
out by placing a known quantity of material through a series
of screens having successively smaller apertures. The
Material retained on each screen is weighed to determine the
percent of the original mass in each size interval. Although
used extensively, several problems can be encountered when
applying sieving techniques to irregularly shaped particles.
For instance, the presence of near size material can cause
blinding of the screen and result ina reduction of the
available screen surface. Additional considerations
affecting screen performance are wire diameter, aperture
shape, screen motion, depth of particle bed and moisture.
Sieving can be performed either wet or dry. Wet
screening is considered to be more accurate due to a tendency
to remove fines which adhere to the coarser particles. The

smallest particle size which can be effectively measured
using conventional laboratory sieves is 25 microns. This
lower limit can be extended to 5 microns with the use of
mMicromesh sieves.
Sedimentation
Sedimentation techniques are based on the principle of
Stokes' settling. This method is quick and cheap, but can be
far too time consuming for ultrafine particles. One of the
Simplest devices available is the Andreason pipette. This
apparatus consists of a calibrated, graduated cylinder and a
pipette connected to a 10 ml reservoir. A dilute suspension
is placed into the cylinder and allowed to settle. Samples
are periodically withdrawn through the pipette. The particle
size corresponding to the appropriate time and settling
distance is calculated using Stokes’ equation. A practical
lower limit for the Andreason pipette is about 5 microns.
Below this, the effect of Brownian motion becomes highly
significant compared with the systematic motion due to
gravity settling (Chung and Hogg, 1985).
Elutriation, also governed by Stokes' equation, utilizes
the upward current of a fluid for sizing particles.
Particles which have settling velocities less than that of
the fluid velocity will report to the overflow, while
particles with higher velocities sink to the underflow. The
Blythe elutriator operates according to this principal. It

consists of several beakers having gradually larger
diameters. The increase in diameter provides a corresponding
decrease in the fluid velocity. As the feed material passes
through the system, different size fractions are captured in
each beaker. This process becomes impractical for particle
sizes below 10 microns.
Time constraints involved with sedimentation techniques
can be overcome by taking advantage of centrifugal forces
generated by a rotating fluid. The Warman cyclosizer is one
of the best examples of this type of particle sizer. It uses
a series of inverted cyclones having a successive decrease in
inlet area and vortex outlet diameter. This results in an
increase in fluid velocity which creates a larger centrifugal
force and produces a finer particle separation in each
cyclone. A typical range of application for material with a
specific gravity of 2.7 is 8 to 50 microns.
Several of the most advanced particle size analyzers
utilize the principle of sedimentation in combination with
light extinction and x-ray detection. The light extinction
process is used to determine the concentration of sedimenting
particles. It directly plots the projected area of a |
particle versus Stokes' equivalent spherical diameter.
Results are obtained in minutes with better than + 2%
reproducibility. The measureable particle size range is 0.1
to 100 microns. This procedure is applicable to organics and
low density powders, such as coal (Micromeritics, 1980).
The second type of advanced sedimentation technique
utilizes a finely collimated beam of low energy x-rays to
measure the concentration of particles. It measures the
sedimentation rates, according to Stokes' law, and
automatically plots these data as cumulative mass percent
versus equivalent spherical diameter. Analysis can be
performed on any material which is capable of absorbing x-
rays. The effective particle size range for this type of
particle size analyzer is also 0.1 to 100 microns.
Three general criteria must be satisfied in order to
analyze a powder with the x-ray sedimentation techniques: 1)
the particles must be more dense than the liquid in which
they are dispersed so they will settle, 2) the particles must
absorb more light or x-rays than the liquid in which they are
dispersed so that there is enough contrast to detect them,
and 3) the particles should disperse in the sedimentation
liquid (Micromeritics, 1980).
Centrifugal particle size analyzers have been developed
to increase the measureable size range of sedimentation
techniques. These analyzers are capable of detecting
particles as fine as 0.01 microns. Centrifugal analyzers use
a combination of high-speed centrifugation and photo- or x-
ray sedimentation to determine particle size. They have been
used for measurement of paint pigments, carbon black,
metallic powders, ceramics and various other agricultural,

chemical and medical materials (Horiba Instruments, 1983).
Microscopy
Microscopy is the only method in which individual
particles are observed and measured. It permits the
examination of shape and composition with a sensitivity far
greater than other techniques. Optical microscopy is
capable of accurately determining particle sizes from 0.8 to
150 microns. This range can be extended down to 0.001
microns with the addition of an electron microscope.
Difficulties encountered in microscopy are (1)
preparation of a uniformly dispersed sample which is
representative of the powder and (2) counting enough
particles to be statistically representative of the bulk
material. The latter problem can be overcome by the use of
automated image analysis. This procedure removes the tedious
operator dependency of particle sizing with microscopy.
Image analysis uses a television camera to scan a
particle bed and display the image on a console. Electrical
information describing the sample is passed to a detector.
Measureable parameters include count, size distribution by
area Or statistical diameter, cord size distribution, etc.
(Allen, 1981).
Light Detection
Perhaps the most widely used and versatile particle size
analyzers are based on the principle of light diffraction.

10
These techniques have been applied to a variety of materials
including cement, ceramics, minerals, coal, pharmaceuticals,
pigments and toners, as well as, various chemical
precipitates and catalysts. The principle of operation is
based on the phenomenon of low-angle forward-scattering of
light. Quantities of light scatter through precise angles as
a function of particle size. The scattered light is focused
onto a photocell detector. The detector output can be
directly correlated to particle size. By combining two
particle size analyzers atotal size range of 0.12 to 1000
microns can be measured (Leeds & Northrup, 1984;
Malvern,1985).
Several new particle size analyzers have been developed
which extend the range of measurement down to 0.001 microns.
These analyzers detect the amount of light which passes
through a suspension of colloid particles. The amount of
light is a function of the varying patterns generated as the
particles undergo random thermal or Brownian movement. This
information can be related to a number of parameters
including molecular weight, particle size and diffusion
coefficients (Malvern, 1985; Hiac/Royco, 1984; Coulter
Electronics, 1983).
Light detection analyzers have also been developed which
are capable of sizing individual particles over a range of
0.25 to 9000 microns. This is achieved by passing single

11
particles through a detection zone which is perpendicular to
a collimated light source. Particles interrupting this beam
cause a reduction in the amount of light reaching a
photodetector. The resulting voltage pulse is directly
proportional to the maximum projected area of each individual
particle (Hiac/Royco, 1981).
Electrical Sensing
The last type of particle sizing technique to be
discussed is the electrical sensing zone method or Coulter
principle. In the Coulter principle, particles are suspended
in an electolytic solution having a higher conductivity than
the material to be measured. The particles are allowed to
pass through a small orifice which has electrodes located on
either side. As particles pass through the orifice an equal
volume of fluid is displaced. This results in a change in
the electrical current which is proportional to the volume of
the particle (Coulter Electronics, 1983). The technique was
Originally developed to count blood cells (Coulter, 1956;
_ Morgan, 1957).
It was quickly pointed out, however, that this principle
could be applied to the measurement of cell volume
distributions as well as number counting (Kubitschek, 1958;
1960). This led to the development of modified machines
which are capable of measuring the number and size of
particles. A number of different machines are available,

12
which are capable of measuring particle diameters in the size
range of 0.3 to almost 1000 microns (Coulter, 1983; Particle
Data, Inc., 1980).
13
1.2.2.-Fine Grinding Techniques
Several techniques are currently available for producing
ultrafine particles. These include tumbling ball mills,
vibratory mills, fluid energy mills, the Szego mill and
stirred ball mills. Tumbling ball mills are most commonly
used for achieving products in the size range of 1/4 inchto
a few microns. However, long retention times and excessively
high energy inputs are required in order to obtain products
below 2 microns. Throughputs in the range of several tons
per hour have been produced by vibratory milling, but its
applicability to grinding below 10-20 microns has not been
demonstrated (Vogeno, 1969).
Fluid energy milling was first developed for producing
particles less than 100 microns in diameter and having a high
degree of purity (Andrews, 1936). Its main initial use was
for milling sulphur, although it has since been used for
dyes, pigments, cosmetics, antibiotics and other
pharmaceutical products (Skelton, Khayyat and Temple, 1980).
The typical fluid energy mill design incorporates a
horizontal, cylindrical grinding chamber having fluid jets
which enter tangentially. Feed material enters by way of a
venturi arrangement. Comminution is achieved by multiple
particle/particle interaction (Dobson and Rothwell, 1970).
This process has the distinct advantage of having removed the
use of media inthe mill. The problem of contamination of

14
the material to be ground is therefore eliminated. One major
disadvantage of this process is the low capacity.
The Szego mill consists of a cylindrical vessel with a
series of helically grooved rollers connected to a central
shaft with flexible rope supports. The feed material is
repeatedly crushed between the rotors and the cylinder
(Trass, 1980). The mill has several design variables
including number, size and shape of rotors. It has a high
capacity, modest power consumption and can be operated either
wet or dry.
Compared to the above mentioned techniques, stirred ball
milling is capable of producing a finer product with a
smaller energy input. It has been shown that, for energy
inputs exceeding 200 kwh/t, the stirred ball mill continues
to grind into the submicron range when other mills have
almost stopped (Sepulveda, 1981). In addition, the
throughput of the stirred ball mill is relatively high as
compared to other devices. This is due to exceptionally high
power input per unit volume of the grinding chamber.

15
1.2.3.-The Development of Stirred Bal] Milling
Past studies have indicated that stirred ball milling
is capable of producing micronized material. This
technology has been used quite successfully in the ceramic
and paint industries. A stirred ball mill consists of a
water cooled grinding chamber, charged with media and
agitated with a central impeller. The material to be ground
is usually in a slurry form and fills the void volume of the
media. Impact and attrition grinding is thought to occur by
collision of the media with itself and the mill wall.
One of the earliest types of stirred ball mill was the
shot mill. This mill utilized 0.5-2.0 mm media, set into
motion by rotating discs mounted on a central shaft. The
United States Bureau of Mines (USBM) followed in the late
1930's with the development of the Szegvari attritor system
(Szegvari, 1956). Originally developed for the removal of
surface contaminents prior to flotation, this technique
proved to be an efficient grinding device (Norman and
Ralston, 1939).
The USBM attritor consisted of a cage-like rotor-stator
arrangement located inside of a water cooled vessel. The
Szegvari attritor, simpler in design, was eventually
developed from the original USBM attritor. This system
closely resembles the mill used in this study. It consists
of a branched central shaft for fluidizing the media-and a water
16
cooled grinding chamber.
The tower mill, developed in Japan, is similar to the
Szegvari mill. This design uses a screw shaped impeller and
is lined with abrasion-proof rubber (Koppers Company, Inc.).
This mill has been used for both wet and dry grinding.
More recently, attrition mills developed and marketed
by Draiswerk and Union Process dominate in the area of
industrial fine grinding. The Drais mill is similar to the
Szegvari mill in construction, with the addition of pins
mounted perpendicularly to the inside of the mill wall. The
mill is equipped with a self-contained feed pump for
operating on a continous basis. The Drais mill has been
used extensively for the production of coal water slurries
(Draiswerke, Inc., 1983).
The attritor type mills use various types of media
including steel and ceramic balis as well as sand and
gravel. The media usually varies in size from1/2 mmto1/2
inch.
17
1.2.4.-Past Studies on Stirred Bal] Milling
A great deal of literature concerning the stirred ball
mill has been published by the USBM. The first study
involving the use of the USBM attritor as a grinding device
was reported in 1960 (Feld, McVay, Gilmore and Clemmons,
1960). This study demonstrated that coarse kaolin (13%
passing 2 microns) could be successfully ground to a product
which is 88% passing 2 microns. The work was carried out in
5- and 10-inch batch mills.
Later work defined the influence of operating parameters
on a 5~-inch USBM attritor (Stanczyk and Feld, 1968). It was
concluded that several parameters were important in governing
comminution efficiency and energy consumption requirements.
These were type, size and shape of grinding media, grinding
media to clay weight ratio, rotor speed, pulp density, degree
of pulp dispersion and arrangement of rotor and stator bars.
Variables having the least influence on efficiency were pulp
temperature, rotor cage design, rotor clearance, rotor-stator
bar interval and chamber liners. Grinding media was found to
have the greatest affect on abrasion of mill parts. It was
determined that spherical shaped media is most efficient in
consumption, mill wear and grinding efficiency. This study
was further extended to involve industrial minerals such as
mica, pyrophyllite, talc, marble, barite and flourite
(Stanczyk and Feld, 1974).
A study involving large scale continuous grinding of kaolin
18
(dgg=l5 microns) was conducted in 1973 (Davis, Collins and
Feld, 1973). A 20-inch USBM attritor was used to perform
Single and multi-stage open circuit grinding, as well as,
closed circuit grinding with a 6-inch solid bowl centrifuge.
It was concluded that multi-stage grinding was more efficient
than single-stage grinding for equivalent feed rates.
Early attempts at modeling a stirred ball mill were
made while studying attrition milling of ceramic oxides ina
5~inch USBM attritor (Stanley, Sadler, Brooks and Schwartz,
1974). The effects of operating variables such as rotor
speed, grinding media and ultrafine grinding performance
between different mills were studied. It was determined that
the milling rate constant, for a 45 x 50 mesh dolomite, is
proportional to the cube of the rotational speed up to speeds
of 1600 RPM. A linear relationship was found to exist
between the mill power requirement and the cube of the
impeller speed, which increases with slurry density and is
independent of viscosity in the turbulent range.
A later study using the USBM attritor found that the
breakage rate function is first order and that it increases
linearly with power input to the mill (Sadler, Stanley and
Brooks, 1975). More recently, a summary of the different
solid materials which have been studied using the USBM
attritor has been presented (Davis, Hansen and Sullivan,
1980).

19
Few results are available on the operating
characteristics of the Szegvari attritor, other than what is
obtainable through the patents. Three examples of typical
applications were presented in the first patent (Szegvari,
1956). The first study reports the grinding of paint
pigments from 60 microns to 4 microns over a period of 2 to 4
hours. A 130 gallon attritor was used with 900 pounds of
5/16-inch rounded flint media. The material was ground at
50% solids by weight using a stirring speed of 80 RPM.
The second test involved grinding a zinc oxide slurry in
a 75 gallon attritor with 600 pounds of 1/2-inch flint
pebbles. The material was reduced to less than 0.5 microns
in less than 5 hours. It was claimed that a conventional
pebble mill would require 90 hours to achieve the same size.
In the last test a laboratory size attritor, with 3/16-
inch stainless steel balls, was used to grind a 50% titanium
dioxide paste to 6.25 microns. A grinding time of 20 to 30
Minutes was necessary as compared to 24 to 48 hours in a
conventional pebble mill.
Since the development of the Szegvari attritor, many
improvements have been suggested by its inventor, Andrew
Szegvari. These include a multiple agitator design, tear
drop shaped impellers and a continuous grinding process.
The use of multiple agitators was suggested in order to
create zones of increased turbulence, which would result ina
higher degree of grinding activity in the mill (Szegvari,

20
1961). Tear drop shaped impellers were developed to increase
the acceleration of the media toward the rear of the impeller
blade, thus resulting in better agitation of the media
(Szegvari, 1964).
A continuous version of the Szegvari attritor was
developed for coarse and fine grinding of feed sizes ranging
from 45 microns to 1/4 inch and product sizes ranging from
0.5 to 5 microns (Szegvari, 1964). Contrary to the present
findings, the author reported that feed and product particle
size is not critical to the performance of the mill.
Union Process, founded by Andrew Szegvari in 1946,
currently supplies a number of stirred ball mills, both batch
and continuous, ranging from small scale laboratory size
attritors to full scale industrial mills. The most recent
development is a circulation attritor in which the material
to be ground is recycled through the media. It is claimed
that the fines pass quickly through the grinding zone while
the coarse material is retained for further grinding. Slurry
is repeatedly passed through the grinding chamber until the
desired particle size is reached, resulting in a narrow
particle size distribution (Union Process, 1984).
A detailed study of stirred ball milling has been done
at the University of Utah (Sepulveda, 1981). Three Union
Process attritors were used to evaluate the mill performance
in grinding chalcopyrite, limestone, quartz, pyrite,

21
sphalerite, coal, a synthetic cupric oxide and nickel matte.
It was found that the grinding rate of the stirred ball
mill has no dependence on the operating condition for a fixed
specific energy input, although slight advantages were seen
with a reduction of speed and ball size. A change from 30%
to 70% solids by weight had no effect on the efficiency of
the mill. It was further shown that a form of Charles'
equation was able to predict the median particle diameter for
different energy inputs to the mill with an accuracy of + 5%.
An increase in viscosity resulted in a corresponding increase
in the slope and intercept of the Charles' plot.
Sepulveda suggested that different grinding mechanisms
operate in the mill as grinding proceeds. It was proposed
that the kinetics, which are initially first order, become
non-linear due to a buildup of fines inthe mill. This
build-up results in an increase in the slurry viscosity which
impedes grinding.
Finally, several mathematical models were developed by
Sepulveda which predict the product size distribution
obtained from a stirred ball mill. Models were developed
based on three different types of breakage mechanisms which
are thought to occur in the mill. These include models for
the combined effect of attrition and impact breakage,
attrition breakage exclusively and fragmentation breakage.
This study indicated that attrition did not play an important
role in the description of stirred ball mill grinding.

22
1.3.-QObjectives
The objectives of this investigation will be 1) to
optimize the operating conditions associated with stirred-
ball milling of coal, and 2) to develop a reliable method of
analyzing the product size distributions. To meet these
objectives, the investigation will be conducted in three
different stages.
The first stage will be concerned with the development
of a procedure to more accurately determine the product
particle size distribution using an Elzone 80XY particle
Size analyzer. Based on this procedure a computer program
will be developed in order to expedite the size analysis.
The second phase will involve determining the effect
which the ball and particle diameter has on the kinetics of
the grinding process in the stirred ball mill. To meet this
goal, feed disappearance plots will be generated for a wide
range of monosize feeds and ball diameters. An attempt will
be made to develop a relationship between the ball and
particle diameter based on the energy specific breakage
rates determined from these tests.
In the final stage, other fundamental operating
parameters involved with stirred ball milling will be
examined. This will include determining the effect which
stirring speed, percent solids and grinding aids has on the
mill energy consumption.

CHAPTER II
A Procedure For Blending and Mass Balancing of Fine
Particle Size Distributions Using the Elzone
Particle Size Analyzer
2.1.-Introduction
In recent years, a great deal of interest and effort has
been devoted to the development of new comminution techniques
for producing micron-sized particles. Devices such as
stirred ball mills, vibratory mills and ultrasonic mills have
been employed for this purpose with mixed success (Sepulveda,
1981; Grimshaw and Albus, 1983; Herbst and Sepulveda, 1979).
Typically the results from tests conducted in these various
grinding devices are reported on the basis of product size
distribution and energy consumption. In theory, this should
make it possible to compare any of the grinding devices and
determine which is the most efficient. Unfortunately, many
of the size distributions being presented are suspect because
they have not been properly mass balanced.
It is well known that many particle size analyzers have
a lower detection limit below which particles are simply
ignored by the analyzer. Thus, the mass of the missed
particles is not included when the instrument computes the
Size distribution. Depending on the fineness of the sample
and the value of the lower detection limit, failure to
23

24
include this missed material can result in a difference of
several microns in the mean particle size of the
distribution. Although this difference may not seem
Significant, it can be very important when dealing with the
production of micron-sized particles. For example, it has
been shown that for the stirred ball mill grinding of Elkhorn
seam coal, a change in the mean product size from 5 to 4
microns may require as much as 25 additional kwh/ton of
energy input (Mankosa, Adel and Yoon, 1986). This clearly
illustrates the importance of having mass balanced size
distributions when comparing various fine grinding techniques
on an equal basis.
The electrical sensing zone method (Coulter principle)
has long been recognized as a rapid and reproducible method
for determining accurate particle size distributions (Lines,
1973). The Coulter principle determines the number and size
of particles which are suspended in an electrolyte. This is
accomplished by forcing the individual particles through a
small orifice located between two electrodes. The change in
resistance as a particle passes through the orifice is
directly proportional to the volume of the particle. The
Size distribution for the suspended particles is derived
from these pulses (Allen, 1981). This method has been shown
to agree quite well with other techniques, such as sieves and
cyclosizers (Napier-Munn, 1985).
25
As with most size analysis techniques, the Coulter
principle also suffers from its inability to recognize fine
particles. The practical lower limit for this technique is
about 0.5 microns. Particles in a given sample which are
smaller than this size will pass through the orifice tube
undetected. This will bias the resulting distribution
towards the larger particle sizes.
The purpose of this chapter is to present a procedure
and computer program developed for mass balancing and
blending size distribution data obtained with an Elzone 80XY
particle size analyzer. Emphasis has been placed on
developing a simple, standardized procedure which is
reproducible and compares favorably with other size analysis
techniques.

26
2.2.-Theory
2.2.1.-Data Blending
In the electrical sensing zone sizing technique, each
Orifice tube is valid over a range of 0.5% to 40% of the
Orifice diameter. Particles larger than the upper limit may
block the orifice and particles smaller than the lower limit
May not be detected by the analyzer. As a result, a series
of orifice tubes may be required to cover the entire size
range for a given Sample.
Each orifice tube in the series is used to analyzea
portion of the original sample from which all particles
larger than the upper limit for a given tube have been
removed. Only the largest orifice tube in the series is
exposed to the entire sample. The remaining tubes analyze
size fractions which may be prepared by a variety of
techniques including sieving, centrifuging and sedimentation.
Furthermore, the orifice tubes in the series are usually
selected so that a slight overlap in the size analysis data
will exist between two sequential tubes.
Now consider an ideal situation. If the original sample
presented to the largest orifice tube could be cut such that
only those particles larger than the upper limit of the next
orifice tube were removed, than the number of particles
counted in the overlap region for each tube would be the
Same. This would then make reconstruction of the complete
27
size distribution a simple matter. Unfortunately, laboratory
separation processes do not provide a perfect cut.
Furthermore, it is virtually impossible to present the same
concentration of particles to each orifice tube. As a
result, the particle counts for two tubes in the overlap
region are not identical. It is possible, however, to make
them identical by normalizing one to the other. This is the
basis for the blending of size distribution data.
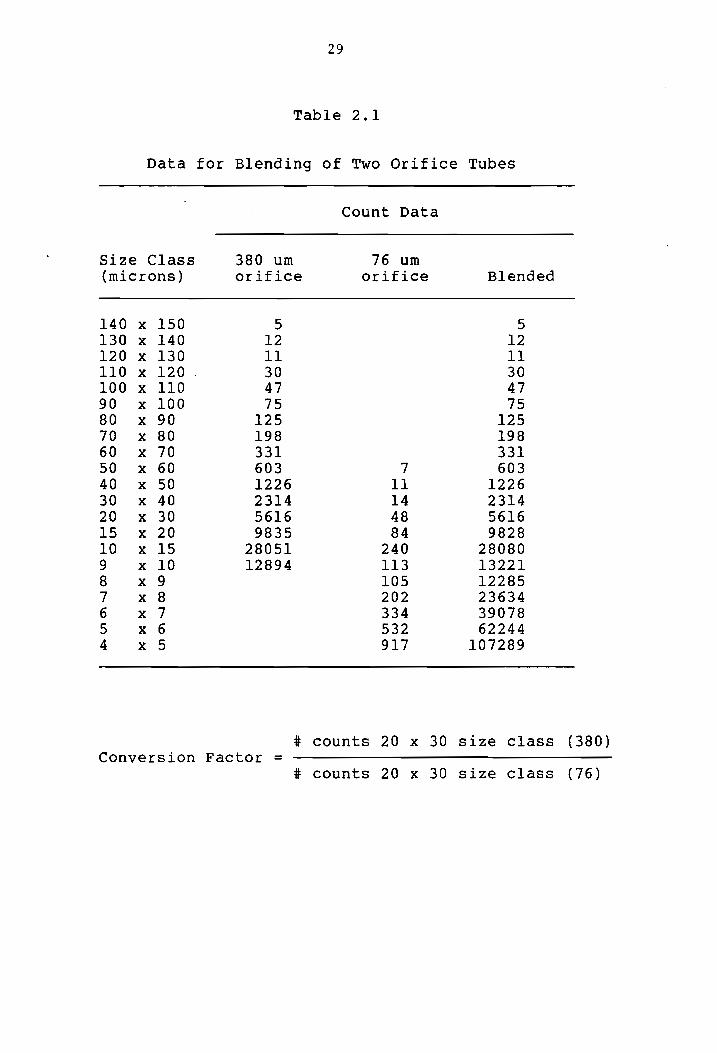
An example of the data blending procedure is illustrated
in Table 2.1. Here, particle count data from a 76 micron
orifice tube are being blended with particle count data from
a 380 micron orifice tube by using a normalization factor
determined from the overlap region. The normalization factor
is calculated for a particular size class in the overlap
region by dividing the number of counts for the larger
orifice by the number of counts for the smaller orifice. Care
must be taken, however, in selecting the size class to be
used for normalizing the data. As mentioned earlier, sieving
and centrifuging are not perfect separation techniques, and
the size classes immediately surrounding the cut size will
reflect a certain amount of error due to misplaced material.
For this reason, the normalization factor is calculated for a
Size class which is far enough below the cut size to have an
unbiased representation in the smaller orifice tube, but
large enough to remain above the lower detection limit of the
28
larger orifice tube.
Finally, the combined size distribution is determined by
uSing the data from the larger orifice tube down to the size
class selected for the normalization, and then using the
data from the smaller orifice tube multiplied by the
normalization factor. This procedure is illustrated in Table
2.1. The process is then repeated for each orifice tube used
in the analysis.
29
Table 2.1
Data for Blending of Two Orifice Tubes
Count Data
Size Class 380 um 76 um (microns) orifice orifice Blended
140 x 150 5 5 130 x 140 12 12 120 x 130 11 ll 110 x 120. 30 30 100 x 110 47 47 90 x 100 75 75 80 x 90 125 125 70 x 80 198 198 60 x 70 331 331 50 x 60 603 7 603 40 x 50 1226 11 1226 30 x 40 2314 14 2314 20 x 30 5616 48 5616 15 x 20 9835 84 9828 10 x15 28051 240 28080 9 x 10 12894 113 13221 8 x 9 105 12285 7 x 8 202 23634 6 x 7 334 39078 5 x 6 532 62244 4 x 5 917 107289
# counts 20 x 30 size class (380) Conversion Factor =
# counts 20 x 30 size class (76)

30
2.2.2.-Mass Balancing
Having blended all of the data, a certain amount of
material will still exist which has passed the smallest
measureable size. This material must be accounted for
in order to determine an accurate representation of the
particle size distribution. The distribution can then be
corrected for the mass fraction of material missed.
The mass of material missed by the largest orifice is
simply the difference between the mass presented to the
Orifice for analysis, Mp: and the mass counted by the
analyser, Mc. The mass counted by the analyzer is determined
by N
T Mc = p> din; (2.1)
6 i=1
where d,; = the equivalent spherical diameter for each size class,
n; = the number of particles in each size class,
p = the specific gravity of the material being Sized, and
N = the total number of size classes.
The mass presented to the analyzer is calculated from
Mp = CQt (2.2)
where C = the concentration of solids in the electrolyte being analyzed,
Q = the volumetric flow rate through the orifice, and

31
t = the analysis time.
In Equation (2.2), Q and t are known parameters which
are fixed by the equipment and the operator. The
concentration of solids in the electrolyte, C, however, must
be determined experimentally.
Once Mp and Mc have been determined, the mass fraction
of material in any size class, given by
can be corrected for the missed material by using the
following relationship:
£.M 1c £;(c) Mp
(2.3)
(2.4)
where f£,(c) is the corrected mass fraction in a given size
class.

32
2.3.-Experimental]
2.3.1.-Genera] Sizing and Analysis Procedure
A general procedure for sizing, blending and mass
balancing an entire size distribution has been developed for
the Elzone particle size analyzer manufactured by Particle
Data, Inc. The procedure described here, however, should be
valid for any electrical sensing zone technique.
All samples are initially prepared as a suspension in
water to facilitate handling and allow for more
accurate sampling in subsequent steps. The largest particle
size in the distribution is then determined by finding the
sieve size for which 100% of the sample will pass. The first
Orifice used inthe analysis is chosen so that this sieve
size corresponds to 40% of its diameter. A sub-sample is
removed using a pipette and diluted with doubly distilled
water. This sub-sample, S, in Figure 2.1, is dispersed with
the proper reagents and placed on a magnetic stirrer until
needed for analysis.
The samples for the remaining orifice tubes are then
screened at the appropriate sieve size. For example, a 100
mesh sieve is used for preparing samples for the 380 micron
orifice tube. This provides a top size of 150 microns,
which closely corresponds to the 152 micron upper limit for
this orifice. The undersized material is sampled and the
oversized material is discarded. The series of orifice tubes

33
is chosen so that an overlap range occurs which meets the
previously mentioned requirements for blending.
For the extremely small aperture orifice tubes,
screening becomes impractical. Therefore a centrifuge is
employed to make the appropriate separation for these
samples. The cut size is calculated using Stokes' law,
based on the experimentally determined gravitational force
generated in the centrifuge. In this case, the decant is
removed and collected as sample. The settled solids are
repeatedly dispersed and centrifuged until all fines are
removed.
Following the sample preparation procedure, a size
analysis is carried out on each of the samples. Before
conducting the size analysis, however, two sub-samples are
removed from S), as shown in Figure 2.1. The solid/liquid
ratio in Sir is determined from sub-sample Sree while the
analysis sample, S is added to a known weight of a’
electrolyte, M This final sample, Sr, is then analyzed e-
with the appropriate orifice tube and the resulting size and
count data are stored on diskette.
Following the analysis of all samples, the size and
count data are retrieved from the diskette and entered into
an interactive computer program which blends the results and
mass balances the distribution based on the series of weights
recorded for the first analysis. The corrected particle size
distribution is then stored and either displayed on screen or
34
BULK SAMPLE
| a.l
0.4 OD,
Sai 344
S;
04 OD,
04 0D,
— Sa3————_ St a3
04 OD N M eN
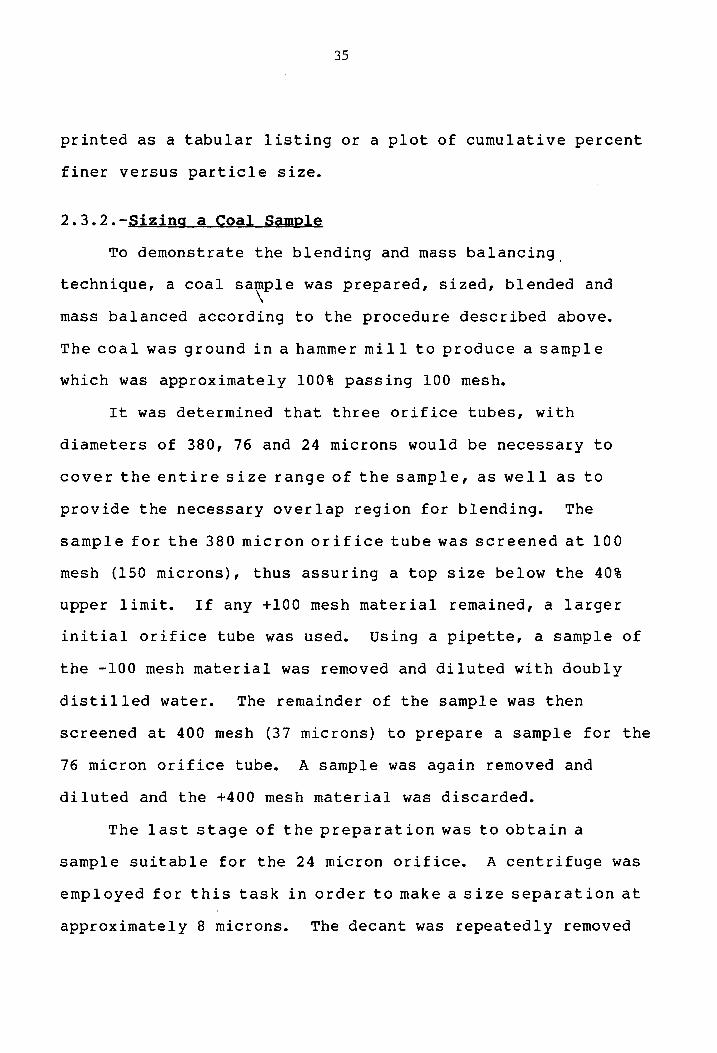
——-—*Sen-— > Sun Figure 2.1. Flow diagram of sample preparation procedure
for particle size analysis.
35
printed as a tabular listing or a plot of cumulative percent
finer versus particle size.
2.3.2.-Sizing a Coal Sample
To demonstrate the blending and mass balancing.
technique, a coal sample waS prepared, sized, blended and
mass balanced according to the procedure described above.
The coal was ground in ahammer mill to produce a sample
which was approximately 100% passing 100 mesh.
It was determined that three orifice tubes, with
diameters of 380, 76 and 24 microns would be necessary to
cover the entire size range of the sample, as well as to
provide the necessary overlap region for blending. The
sample for the 380 micron orifice tube was screened at 100
mesh (150 microns), thus assuring a top size below the 40%
upper limit. If any +100 mesh material remained, a larger
initial orifice tube was used. Using a pipette, a sample of
the -100 mesh material was removed and diluted with doubly
distilled water. The remainder of the sample was then
screened at 400 mesh (37 microns) to prepare a sample for the
76 micron orifice tube. A sample was again removed and
diluted and the +400 mesh material was discarded.
The last stage of the preparation was to obtaina
sample suitable for the 24 micron orifice. A centrifuge was
employed for this task in order to make a size separation at
approximately 8 microns. The decant was repeatedly removed
36
and collected as sample for the 24 micron orifice. All
samples were kept continuously mixed until the sizing was
completed.
As described earlier, two sub-samples were removed from
the sample prepared for the 380 micron orifice tube and the
proper weights recorded. Electrolyte was added to the
analysis sample which was then analyzed using the 380 micron
orifice tube. The resulting size and count data were stored
on an IBM PC. The two remaining samples were then analyzed
with their respective orifice tubes and the size and count
data also stored.
Having completed the analysis for each orifice, the
Size and count data, along with the previously recorded
weights, were entered into a program called BLENDBAL which
was developed for this work to blend and mass balance
particle size distributions. The BLENDBAL program is part of
a software package developed at Virginia Tech to provide an
interface between an IBM-PC and the Elzone 80XY particle size
analyzer. This package allows all sizing operations, data
logging and data manipulation to be controlled from the IBM-
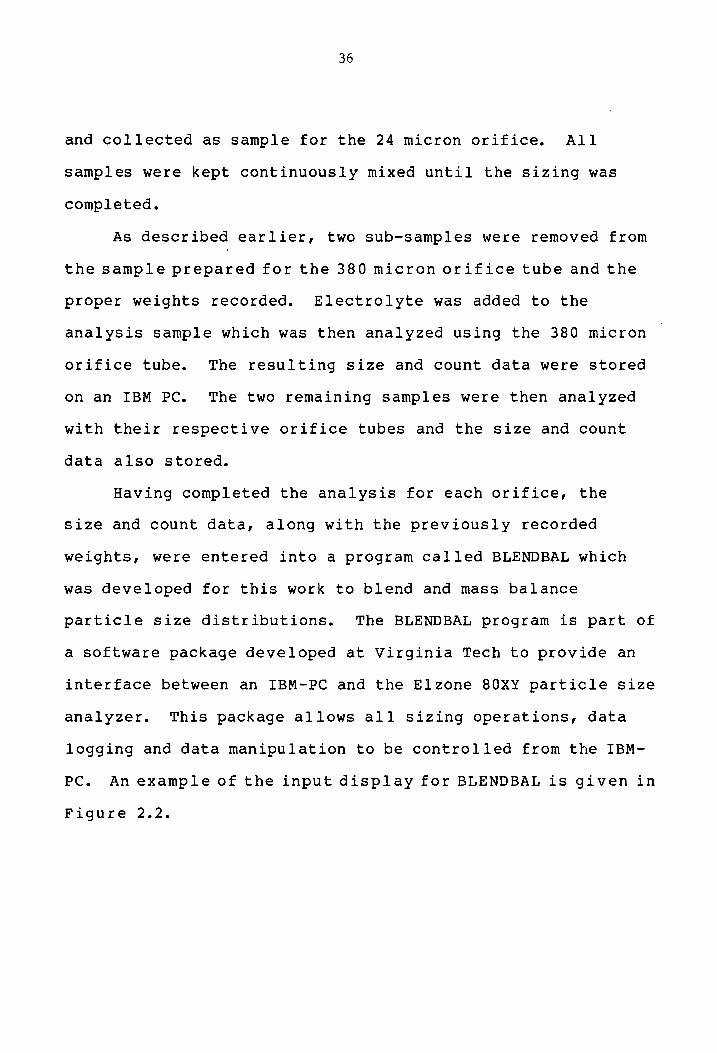
PC. An example of the input display for BLENDBAL is given in
Figure 2.2.
37
v Enter Size of First Orifice Tube in Analysis
~) Enter Analysis Time (seconds)
Enter Beaker Weight (grams) ?
+ Enter Beaker Plus Sample Weight (grams)
Enter Beaker Plus Solid Weight (grams) ?
Enter weight of Electrolyte Used (grams) ?
Enter Specific Gravity of Solid ?
Enter Specific Gravity of Liquid ?
Enter Weight of Electrolyte Used for Specific Gravity Determination (grams) ?
Enter Weight of Analysis Sample (grams) ?
Are These Values Correct (Y/N) ?
Figure 2.2 Sample Display of Input Data Required for Mass Balancing a Particle Size Distribution.

38
2.4.-Results
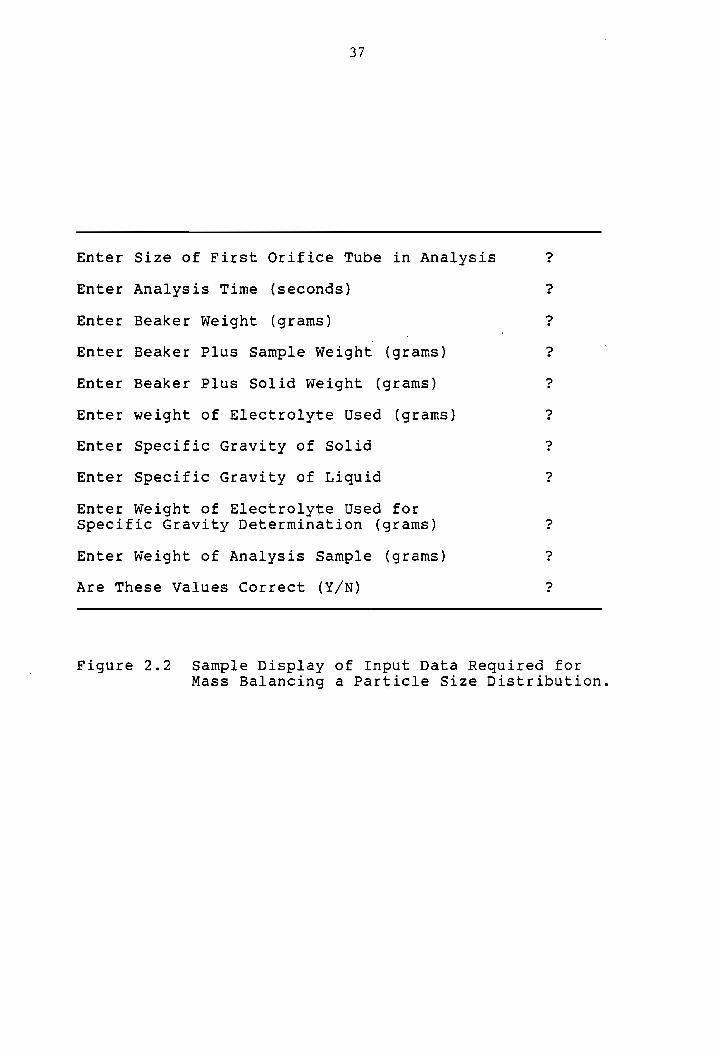
2.4.1.-Effect of Blending and Mass Balancing
Figure 2.3 shows the effect of blending and mass
balancing on the size distribution of a finely ground coal
sample prepared and analyzed as discussed in section 2.3.
The drop in the tail of the distribution sized with the 380
micron orifice tube is a clear indication that fine material
has been missed in the analysis. As more material is
included in the analysis by blending the data from the 76
micron orifice and the 24 micron orifice, the drop in the
tail becomes less pronounced; however, material is still
missed. Finally, when the fraction missed by the 24 micron
Orifice tube is included in the analysis, the tail is raised
further and the distribution is mass balanced.
2.4.2.-Reproducibility
One of the problems often cited in using mass balancing
and blending procedures is the difficulty in obtaining
reproducible size distributions (Sepulveda, 1983). This is
often the case when the amount of sample slurry, electrolyte,
etc. is measured on the basis of volume. In this procedure,
however, all measurements were made on the basis of mass
which is usually more accurate.
To demonstrate the reproducibility of this technique,
two separate size analyses were conducted on an Elkhorn seam
39
"uOTINGTAASTp
aZTs
aToTAIed
ayy uo
butoueTeq
ssew
pue butpuatq
jo yoassq
“E°z
ainbtg
(wi!) YSLAWNVIG
3701LYWd
OOOL
OOL
OL L
LO THEE
GT
i peery
i ct
i
geet jo
t gota
iyo 4
L
: |
r OSE
2 9L'bz a"
r O8€
29 7
= 7+
1 ose
i G3ONV
Iva _
r SSVIN
7
E J
OL
i "
iting
fo litttp
pt 4
“tu Lt
4001
AAILVIANWND YSNIA %

40
coal hammer milled to produce a -400 mesh product. Both
analyses were performed using the 76 and 24 micron orifice
tubes, and the resulting size distributions were blended and
mass balanced. As shown in Figure 2.4, the two distributions
are virtually identical. The slight deviation at very fine
sizes is well within normal experimental error. The
reproducibility of this procedure has been checked quite
frequently with similar results.
2.4.3.-Sensitivity Analysis
The sensitivity of the blending and mass balancing
procedure to small changes in the particle size distribution
is illustrated in Figure 2.5. A slight variation in the size
distribution was achieved by attrition grinding a coal sample
for periods of 15, 30 and 45 minutes. Although the mean
particle size of the distrbutions changes by no more thana
few microns, the procedure is clearly capable of showing the
decrease in product size distribution as grinding time
increases.
2.4.4.-Comparison with Other Sizing Techniques
In order to compare the results obtained using the
Elzone to other particle size analysis methods, a -20 micron
coal sample was analyzed with a Micromeritics Sedigraph L
particle size analyzer. This process uses photosedimentation
to determine the particle size distribution. The results

4l
*butouereq
Ssew
pue Ssaqn}
soTJTIO
UOTOTW
FZ puUe
OL ‘O8€
ayq butrsn
AAr{[tqtonpoiday
Jo uotAeAAsuowsaq
*p'z
aanbry
(wr) YaLaWVIG
ATDILYVd ool
Ol t
ro
TTT TTT
ne ee
a
ee L
i 4
{ L
(9) isal ley y yf
Trt Tt
Ol
(v) iS3L
=
{ |
Per Ti
ti tt
bpryp
yy 7 |
1 ool
YSNIS % SAILVINWNO

42
*saqznutTw
Gp pue
‘oe ‘ST
1045 punoib
uot yti4qze
atTdues
[rood
weas
ulOouyT_A ue
JOJ suotyNnqtayAstp
92TS
spToTzAed
°G°t
aanbty
(wo) uaLaWvId
31D1LYVd
oot
OL i
to
TTT TTT
TTT
TTT ttt
b
7 ‘NIW
SP 7
7 ‘NIN
Of — —
7
i Gl
a -
“NIW
_—— -4
Zz /
“
7 a
— =
o1
|
=
Litt tt
TUR dd
Lt
| Loe
fipgy
yy] jf
yf yy
|
frig
yp y
| |
| ool
YANIS &% SAILVINIWNOD

43
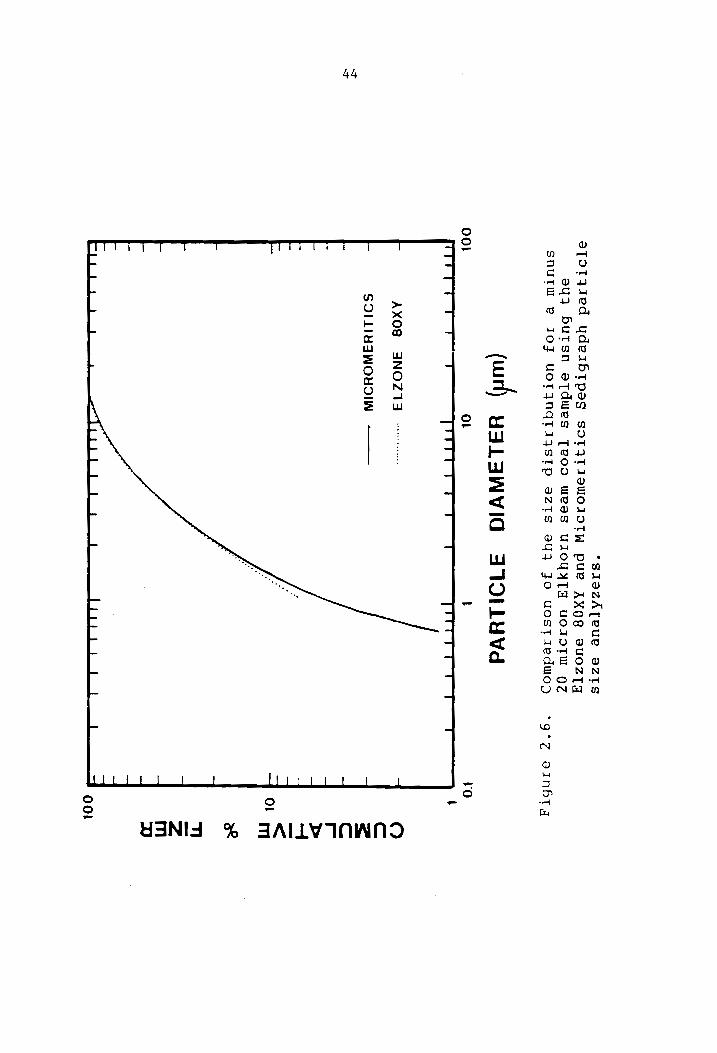
shown in Figure 2.6 compare favorably with the Sedigraph L;
however, it can be seen fromthe drop in the tail of the
distribution that this technique also has a lower detection
limit.
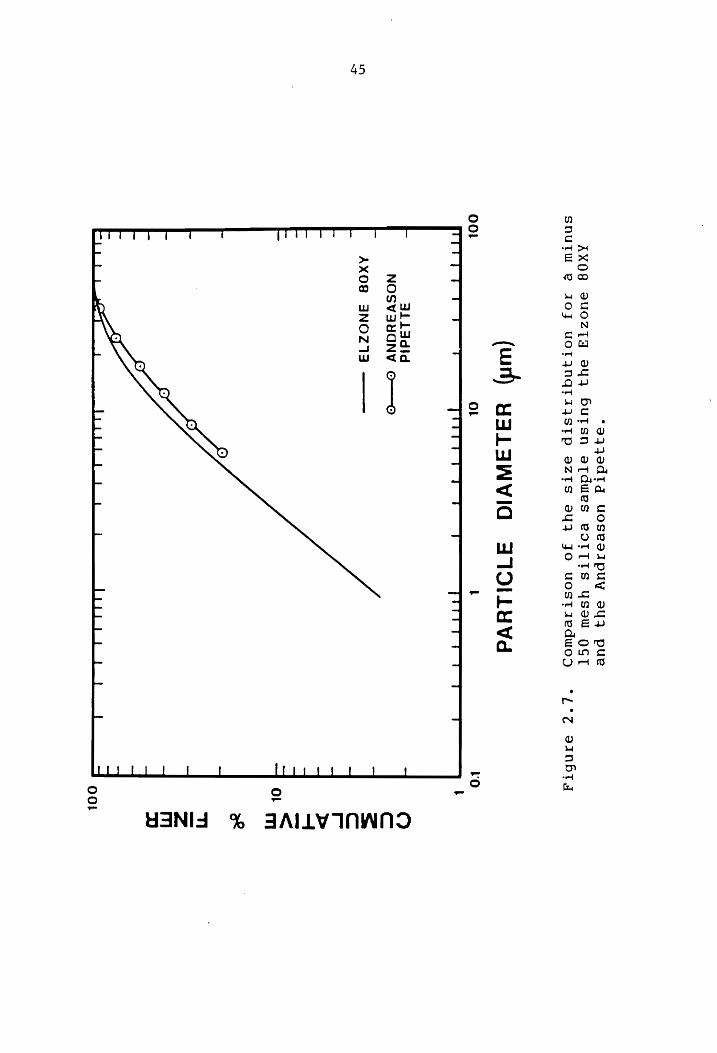
A Similar comparison was made between an Andreason
pipette and the Elzone 80XY using a -150 mesh silica sample.
The results, shown in Figure 2.7, also indicate a close
agreement between these techniques. It should be noted that
the distribution obtained using the Andreason pipette does
not drop off for the fine sizes since this technique mass
balances itself.
44
*szazATeue
azts
aTotzied
ydeibtpag
sotTqytsswojotTW
pue AXQg
suUOzZTA a4}
butsn
atTdwes [Teoo
weas
uzoyYyTY uorotw
oz Snutw
8 JOJ
UOTINGTIASTP
azTts ayy
Jo uostaeduo)
(url) YALAWVIG
ATIDILYVd
°9°Z arnbtg
Ool ol
L 0)
ee ee
Prt
TT tT
ee
I
~ AXO8
ANOZ149
4
im SOILIMSWOUOIW
4
- 7
L.. ~
E -
C +
on
|. 4 4
- a
ba
YANNIS % SAILVINAWND
45
*aqq3adtq
uosealpuy
ay
pue
AXQOG BuozTWA
ayQ Gbutsn
atdues
eor[ts
ysau
QscT snutu
e@ IOJ
UOTANCTAASTp
azts
ay
Jo uostredwuog
(wnt) YaLAWVIG
31O1Luvd
"2°@ aanbrg
ool
OL l
ro
TOT
TT
nt ptt
TT tt
ee
ee ee
I
= 3iLladid
7 NOSVSYGNV
O-—O
| =AxXog
ANOZ1a "|
a _|
— 4
on
z
—
C q
1)
1 Lisp
py 7
ff |
ool
YANIA & SAILVINWNO
46
2.5.-Discussion
2.5.1.-Error due to Particle Characteristics
The results presented in section 2.4 indicate that the
blending and mass balancing procedure provides an accurate
and reproducible means of measuring fine particle size
Gistributions. It is important to remember, however, that
most sizing techniques possess several sources of error in
addition to the error caused by missed material. These
sources include errors due to the nature of the material
being analyzed, errors due to sample size, and errors due to
Sample preparation. Methods of minimizing the errors due to
sample preparation, caused by the non-ideal splitting,
screening or centrifuging of samples, have already been
discussed.
Consider now the errors due to the nature of the
material being analyzed. Many materials exhibit compositions
Or porosities which vary widely with particle size. Asa
result, the specific gravity of these materials will vary
with particle size. Equation (2.1), however, shows that the
mass balancing procedure requires a single value for specific
gravity. This may be considered a mean specific gravity for
the sample. If there is any tendency for particles ina
given size range to deviate significantly from the mean
specific gravity, error will be introduced in the mass
balancing procedure. Thus, one would expect the likelihood

47
of this error to increase for more heterogeneous materials.
Particle shape is another material characteristic which
can have a bearing on the size distribution. Most particle
size analyzers report particle size on the basis of an
equivalent spherical diameter. For example, the Elzone
measures the true particle volume and reports size on the
basis of the diameter of a sphere having the same volume. If
a material is sized which has a shape widely differing from
spherical, than the size analyzer may produce misleading
results. Fortunately, since the Elzone measures the true
particle volume, a shape correction can be made provided the
particle shape can be properly quantified.
2.5.2.-Statistica] Error Analysis
The other source of error mentioned previously, i.e.
errors due to sample size, refers to the number of particles
which are counted and sized to produce statistcally
meaningful data. Since the concentration of particles
presented to the analyzer is usually controlled by the
requirements of the equipment (e.g. to keep particle
coincidence errors low), the number of particles to be sized
determines the length of time for the analysis.
An examination of Gy‘'s theory for sampling can be used
to determine the error involved in sampling, as well as, the
sample size necessary to minimize the standard deviation

48
(Gy, 1982). The variance on the cumulative size
distribution can be calculated as follows:
Vo
v? N 1 -2y; I Var (Y¥;) ={—— ) Xs OV. + ——) Xs OV.) } (2.5) jv *5 2 pa NG
Ms |x Yi j=1
where Xs is the weight fraction of material in a particular
Size class Y,; is the cumulative weight fraction finer than
size i, PP is the specific gravity of the sample, M, is the
sample mass and V5 is the mean volume of material ina
particular size class, represented as:
d.3 + a3, +
V. = 0.5 * 2 itt (2.6) 2
Using equation (2.5), the sample mass required to
maintain the relative error under 2%, for the cumulative
distributions shown in Figure 2.3, was determined to be 7.0
x 1074 grams. The actual mass presented to the orifice for
analysis was 8.35 x 1074 grams, which produced a total
relative error of 1.89% on the cumulative distribution. This
error analysis procedure has been included as part of the
software package discussed earlier.

49
2.6.-Summary and Conclusions
The purpose of this study was to develop a procedure and
computer software for providing an accurate representation of
a particle size distribution determined through the use of an
Elzone 80XY particle size analyzer. The following summarizes
the results of this work.
1) A computer software package was developed to aid in
blending the data from any number of consecutively
smaller orifice tubes used with an Elzone 80XY particle
Size analyzer. A variety of subroutines were included in
this package to assist in the manipulation of particle
Size distribution data.
2) A mass balancing procedure was developed to determine
the amount of material passing the lower detection limit
of the Elzone 80XY particle size analyzer. This
procedure was incorporated into the software package to
correct the original particle size distribution.
3) An error analysis procedure was included in the software
package to determine the sample size necessary to
maintain the relative error less than a specified value.
The results from this work indicate that an accurate
and reproducible representation of fine particle size
distributions can be obtained using the procedure described
here. In addition, it is expected that the software package

50
could be extended to size analyzers other than the Elzone
80XY with only slight modifications.

51
2.7.-Nomenclature
concentration of solids in electrolyte being analyzed
particle diameter in size class i
mass fraction in size class i
corrected mass fraction in size class i
mass of solids counted by a particular orifice tube; calculated from size and count data obtained from particle size analyser
mass of electrolyte added to S,
mass of solids presented to a particular orifice tube for analysis
Sample mass for error analysis
specific gravity of solids to be analyzed
total number of size classes
number of particles in size class i
Orifice volumetric flow rate
Original sample to be sized by first orifice tube
sub-sample for size analysis
final sample for analysis consisting of S, and M,
sub-sample for determining solid/liquid ratio in 8,
sample analysis time (sec)
volume of size class i
discrete weight fraction in size class i
cumulative weight percent finer in size class i

CHAPTER III
Effect of Media Size in Stirred Ball
Mill Grinding of Coal
3.1.- oduction
In producing Ssuper-clean coal by any physical cleaning
process, it is necessary to liberate the mineral matter from.
the coal prior to separation. Recent investigations, for
example, have shown that microbubble flotation can be an
effective method for producing coals containing less than 1%
ash and very little sulfur provided that the feed coal has
been micronized (Yoon and Miller, 1982; Yoon, 1984; Luttrell
et al, 1985; Yoon and Luttrell, 1986) Microscopic
examination of many of the United States' coals, however,
reveals that sufficient liberation may not occur until the
coal is ground finer than ten microns, and sometimes finer
than a few microns. Although conventional ball milling is
the most widely used technique for producing fines, it is
difficult to grind coal to below-10 um without requiring
excessively long retention times and correspondingly high
energy inputs. Other techniques such as fluid energy
milling and vibratory milling are capable of micronizing
coals, but they also tend to be energy intensive and are of
low throughput capacity as well (Grimshaw and Albus, 1983;
Herbst and Sepulveda, 1978).
52
53
Previous studies on mineral systems have indicated that
stirred ball milling may be a promising method of producing
micronized material (Herbst and Sepulveda, 1978; Stanczyk
and Feld, 1968,1972; Sadler, Stanley and Brooks, 1975;
Davis, Hansen and Sullivan, 1980; Sepulveda, 1981. In this
technique, a large number of small grinding media (1/16- to
1/4-inch) are agitated by a pin-shaped impeller in a
cylindrical vessel. Breakage Occurs mainly by attrition and
shearing as particles are captured between balls. The
system is water-cooled to remove the excess heat generated
by the attrition. Recently, Sepulveda (1981) has shown that
when grinding a Lower Freeport coal to a median size of 8-
Mm, an energy savings of approximately 60% can be achieved
by using a stirred ball mill over a conventional ball mill.
Greater energy savings should be expected for finer
grinding.
Because of the importance of fine grinding in the
production of super-clean coal, improvments in the
efficiency of the grinding operation are of primary concern.
This investigation deals specifically with the production of.
micronized coal using the stirred ball mill. The objective
of this study has been to investigate the effect of various
operating conditions, particularly that of media size, on
the breakage rates and energy requirements of the process.

54
3.2.-Experimental
-3.2.1.-Samples
The sample used in this investigation was prepared from
a run-of-mine coal, Elkhorn seam, Virginia, containing 14%
ash. The coal was passed through a roll crusher to produce
a -1/4 inch product, which was then screened at 20 mesh.
The ~1/4-inch x 20 mesh fraction was cleaned ina heavy
media bath (magnetite suspension) at a specific gravity of
1.3 to produce a clean coal product containing 6.5% ash.
The clean coal was then hammer-milled to reduce the size to
a suitable level for stirred ball milling. Size analysis
showed that the hammer mill product had a 70-um mean Size.
A portion of the hammer mill product was screened to obtain
monosized feeds.
3.2.2.-Experimenta]l Apparatus
Batch grinding experiments were conducted using a
homemade 5-inch diameter mill with a 6-inch height, as shown
in Figure 3.1. The mill included a double wall of 1/8-inch
thick stainless steel, which acted as a water jacket. A
five-level impeller made up of 4-inch pins was held in place
by a sealed bearing. The rotation of the impeller was
provided by a variable-speed drill press (Figure 3.2)
equipped with a one-horsepower drive motor. A series of

55
S
Figure 3.1. Schematic diagram of the batch attrition mill (Brown, 1986).

36
|
It THP, 60 HZ. | *— 16a, MOTOR
l
OISPLAY UNIT
I
| cue” 110 A.C. SENSOR
OQ} swore TIMER
SHAFT COUPLING
IMPELLER SHAFT q
MuL—-— |
TiLiT TUTE
rrryryyr rrr yrriryriii
|
ADJUSTABLE f PLATEN
isi
Figure 3.2. Schematic diagram of the mill assembly.

57
belts and pulleys enabled stirring speeds to be varied from
200 to 3500 rpm, while a moveable support platform allowed
the mill to be raised or lowered for ease in loading and
unloading of the mill charge. A Teledyne Model A-05 torque
sensor, mounted on the drive shaft between the motor and the
mill, provided an indication of the power input to the mill.
The grinding media used in this investigation included
carborm steel and stainless steel balls of 1/4-, 1/8-, 3/32-,
and 1/16-inch diameters, and glass beads of various sizes.
Both monosized balis and ball mixtures were studied in this
investigation.
Particle size distributions were determined uSing an
Elzone 80XY particle size analyzer manufactured by Particle
Data, Incorporated. This device uses the electrical sensing
zone method for particle sizing in a manner similar to the
Coulter Counter. With a given probe, the largest
measureable size is limited to approximately 40% of the
orifice diameter, while the smallest detectable size is
about 1% of the orifice diameter. Therefore, several probes
having different orifice diameters may be required for a
complete size analysis.
3.2.3.-Experimenta]l Procedure
Three series of tests were conducted to determine ii)
the effect of ball size on grinding kinetics, ii) the

58
effect of ball size on energy consumption, and iii) the
effect of media type on stirred ball mill performance. The
media loading for each test was held constant at 50% of the
total mill volume. For those tests involving a ball
mixture, the media charge was made from equal weights of
1/8-, 3/32-, and 1/16-inch balls. Slurry was added to the
mill in a quantity sufficient to fill the void volume of the
ball charge. Operating conditions for the tests varied from
asolids loading of 30% to 43% by weight and froma stirring
speed of 200 to 330 rpm. Torque readings were recorded at
regular intervals during each test, and the area under the
torque vs. time curve was used to give a measure of the
total energy input to the mill.
Particle size analysis was conducted on all products
generated in this investigation. However, since the size
analysis technique used in this investigation had an
inherent problem of missing particles finer than some finite
limit, it was necessary to mass balance the size analysis
data in order to get accurate results. It was also
necessary to blend the size analysis data from several
orifice tubes in order to get a complete size distribution.
As a result, a computer program was developed to assist in
both the blending and the mass balancing of size
distribution data. An interface and the appropriate
software were also developed to connect the Elzone 80XY tec
an IBM personal computer. Thus, all size analysis, blending

59
and mass balancing procedures were controlled from the
computer.
60
3.3.-Results
3.3.1.-Rate of Breakage
The effect of ball size on the breakage kinetics ina
Stirred ball mill was studied by following the disappearance
of monosized feed with time. These tests were carried out
at 43% solids and 330 rpm. A typical set of disappearance
plots for the grinding of a series of monosized feeds with
1/4-inch stainless steel balls is shown in Figure 3.3. As
indicated by this figure, grinding rates were found to be
very high. In fact, the grinding rates observed in this
study were, in some cases, ten times higher than those
reported for conventional ball mill grinding of similar
coals (Klimpel, 1982). This necessitated the use of very
short grinding times for conducting the tests. Note that
first order breakage behavior was observed over the time
period studied. A similar finding was also reported by
others (Herbst and Sepulveda, 1978; Stanczyk and Feld, 1968,
1972; Sadler, Stanley and Brooks, 1975).
The breakage rates determined from Figure 3.3 are
plotted in Figure 3.4 as a function of feed size. This
figure shows that as the feed size increases, the grinding
rate increases to a peak value at approximately 350-ym, and
then decreases rapidly. The decrease in grinding rate above
350-um indicates that the 1/4-inch balls are too small te
nip the particles and break them.

61
100 t t i a
r 43% SOLIDS . i 330 RPM a
i”
LL a 4 SALLS
OS = =
—
> 4 < = k, Woo F . - e& =
-_
pa O =—
Q +F : i i a Li .
-—
mf : 32 © 20 X 28 MESH MONOSIZE FEED
5 @® 28 x 35 a 0 35 x 48 @ 48 x 65
7 Q& 65 X 100 4 & 100x 150 © 180X 200
1 | j {
0 15 30 45 60
TIME (sec)
Figure 3.3. Feed disappearance plots for attrition milling of Elkhorn seam coal.

62
2.5
T rT | 1 T T TOT SY T ] Co TT
1” gq BALLS
~ , 330 RPM
& 43% SOLIDS
—
cc
o 10 = <x
< < LJ ce
a 0.5 —_ —_
0 tot yy yy | Poy
10 100 1000
PARTICLE DIAMETER (um)
Figure 3.4. Grinding rate vs. mean feed size for attrition milling of Elkhorn seam coal.

63
Thus, there appears to be an optimum ball size/feed
size ratio for stirred ball mill grinding. Figure 3.5 shows
the results obtained using stainless steel grinding media of
different sizes for four different sizes of feeds. It shows
that the breakage rate decreases with decreasing particle
size and, more importantly, that there is an optimum ball
size for each feed size which decreases with decreasing feed
size.
3.3.2.-Energy Consumption
Several tests were conducted at a constant specific
energy input of 94 kwh/ton to determine the effect of ball
size on the final product size distribution. These tests
were carried out using the hammer mill product (70-ym mean
Size) as the feed at a pulp density of 43% solids and a
stirring speed of 200 rpm. The results given in Figure 3.6
show. that the product size distribution becomes finer as the
media size is reduced. For example, 1/4-inch balls produced
a mean size of 6- pm, while 1/16-inch balls produced a mean
size of 3-ym. It should be noted that at these fine sizes,
even a small change in product size is significant. Also
shown in Figure 3.6 is the product size distribution
obtained using a mixture of 1/8-, 3/32-, and 1/16-inch balls
prepared using equal weights. It is interesting to note
that this curve lies where one would expect based on the

64
2.0 j ] j T
J 18 +
43 % SOLIDS —~ 16h 330 RPM
t
& = 14}
~et
Wy 12 lan < Cc 10k
Lu
O osk <{
= 06 - Ly ce
M o4 - © 48 X 68 MESH MONOSIZE FEED _ & 65 xX 100 © 100X 150
02 @ 150Xx 200 7
0 | | | |
005 0.10 0.15 0.20 0.25
BALL DIAMETER (in)
Figure 3.5. Grinding rate vs. ball size for attrition milling of Elkhorn seam coal.

65
*Teoo
weas
UuTOyYy[TA JO
Hurl{ {tw
uot xTIW
We 1oj
yndut
Abiaua
Jyueysuod
ye UOTANGTIASTp
azTs yOnpoid
uo Jayzawetp
T Teq
Jo 30aegJJq
“Q°E DINbTY
(wit) HaLAWNVIG
3701LYVd
ool Ol
' 10
mrrrTrT_t
[rriT TT
Tt
port
TT Td
'
- XIN
-—-—-— 7
= Bn.
= 4
i
- CE
7 —
| "
€
—_
- 8
+ —
7
b “i
_
C sta
2% /
+ _
CF] b
/
7
ol
—
—
- NOL/HMY
6 =3 7
- SGilos
%ep 7
- Wd
002 7
LC fo
a pijy
¢ 2
a
Digit tpn
1 a
ool
AAILVINWND YANId %

66
number mean diameter (.07 inches) of the ball mixture.
Utilizing the same operating conditions as previously
described, i.e., 43% solids and 200 rpm, a similar series of
tests was conducted over a range of energy inputs. These
results are shown in Figure 3.7 in which the mass mean
diameter of each product distribution is plotted as a
function of specific energy input. Previously, Herbst and
Sepulveda (1978) have shown that these types of plots can be
described by Charles' equation which, for the case where
feed size is much larger than product size, is given by
E = A(d_ 7%), (3.1) mM, Pp
in which E represents the specific energy input and On,p is
the mean product size. According to Herbst and Sepulveda,
there exists a single energy-product relationship for a
given material regardless of operating conditions and mill
sizes. The results obtained in the present study show,
however, that separate energy-product relationships exist
for different media sizes. It can be seen that, as ball
Size decreases, significantly less energy is required to
produce a given product size. For example, an energy input
of approximately 100 kwh/ton is required to produce a 5- m
mean product size with 1/8-inch grinding media, while the
Same product can be achieved at 45 kwh/ton with 1/1l6-inch
media. This decrease in energy requirement is manifested in
a shift in the intercept, A. The slope,@, however, appears

67
1000 = 4 qT t Cc TT vy
bk
heel
,
- SPE
CIFI
C EN
ERGY
IN
PUT
(kwh/ton)
100 + = - =
o 1° sats 4 1’
L a a 1 3 ,
& 33 16
r ° 46 7 © MIx
10 i 1 ,; yj; « » , | { po, toy py
' 10 100
MEAN PRODUCT DIAMETER (um)
Figure 3.7. Effect of ball diameter on Charles’ law for attrition milling of Elkhorn seam coal.

68
to remain constant at a value of 3 for all ball sizes for
relatively short grinding: times.
Figure 3.7 also shows that when grinding proceeds for a
long time (i.e., high energy inputs), the E vs. d, Pilot
deviates significantly from the linear relationship
predicted by Charles’ equation. In the tests conducted
under the present conditions, it does not appear possible to
generate a product having a mean size much finer than 2 pm.
Thus, care must be taken when using the data presented in
Figure 3.7 to estimate the energy requirements for product
sizes finer than those shown.
3.3.3.-Media Type
A major part of the energy requirement for stirred ball
Milling involves stirring and lifting of the ball charge
itself. Therefore, if the density of the grinding media can
be reduced without significantly affecting the grinding
performance, one might expect a lower energy consumption.
Figure 3.8 shows a comparison between the performance
of steel and glass media over a range of media sizes. In
this comparison, tests were conducted using a constant
energy input of 8.5 kwh/ton at a pulp density of 30% and a
Stirring speed of 330 rpm. The grinding performances of
each media type are compared by plotting the percent of
monosized feed remaining in the mill as a function of ball
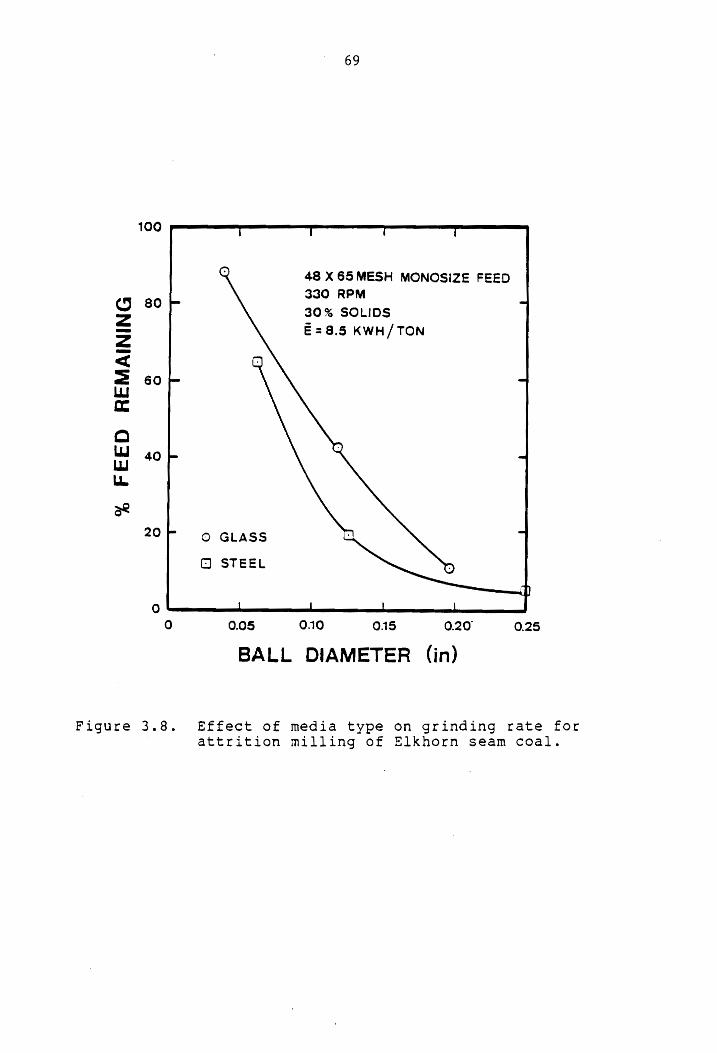
69
100 r I r
48 X 65MESH MONOSIZE FEED 330 RPM
o =
S 80 TF 30% SOLIDS = E=8.5 KWH/TON z /
<
= 60 - Lid
ec
mr 40 WW — -
LL.
ae
20F o GLASS
© STEEL
iD 0 __{ a | | L
O 0.05 0.10 015 0.20 0.25
BALL DIAMETER (in)
Figure 3.8. Effect of media type on grinding rate for attrition milling of Elkhorn seam coal.

70
diameter. Since the torque required to turn the glass
grinding media was much lower than with steel media, the
glass media required a longer grinding time to achieve the
Same energy input as the steel media. The results show that
steel balls were slightly more efficient than the glass
beads, indicating that the mass of the individual grinding
medium is important in determining the attrition force
operating in the mill. Similar results have been obtained
using other monosized feeds.

71
3.4.-Discussion
3.4.1.-Effect of Particle Size on Breakage Rate
From the results presented in Figure 3.4, it is clear
that for a given ball size, there exists an optimum feed
size for maximum breakage rate. It seems that at small feed
Sizes, the large number of particles present in the mill
results in a low probability that an individual particle
will encounter the grinding media. At large feed sizes, on
the other hand, particles become too big to be caught
between the grinding media and broken effectively.
Therefore, the maximum breakage rate occurs when particles
are large enough to have a high probability of encountering
the grinding media, but are small enough to be effectively
caught and broken by the media.
Looking more closely at the grinding behavior at fine
Sizes, it can be shown that during the course of a typical
grinding test, the mass mean particle diameter is decreased
by approximately one order of magnitude. For example, the
results: given in Figure 3.6 show a feed distribution with a
mean size of 70-ym reduced to 6-pm using the 1/4~-inch balls.
This produces an increase in the actual number of particles
in the mill by four orders of magnitude. As a result, the
probability that a given particle will be captured between
two or more balls decreases, resulting in a lower breakage
rate as grinding proceeds. In order to increase the

72
probability of particle capture, it is necessary to increase
the number of balls in the mill as the particle size
decreases. For a given mill volume, this can be
accomplished by decreasing the media size. For example, by
decreasing the ball diameter from 1/4-inch to 1/16-inch, the
number of balls in the mill is increased from approximately
3300 to 240,000, resulting in a corresponding increase in
the breakage rate and the energy efficiency, as shown in
Figure 3.6.
3.4.2.-Angle of Nip Analysis
To understand the breakage behavior of coarse
particles, it is necessary to consider the grinding action
which takes place inside a low-speed stirred ball mill.
During the course of the batch grinding tests conducted for
this investigation, it was observed that the balls in the
mill tended to roll around each other and against the wall
like thousands of tiny roll crushers. If breakage between
balls in a stirred ball mill can in fact be compared to
breakage between the rolls of a roll crusher, one important
Criterion for breakage will be the angle of nip.
In a roll crusher, the angle of nip (2a) is defined as
the critical angle at which a particle can be pulled down
between two rolls rotating in opposite directions at equal
speed. As illustrated in Figure 3.9, it is a function of

73
*T[tw
[leq
paziITys
e ut
etpow
butputsib
uaamqaq
dtu jo
aTbue
ayy jo
uotyzequUasoidal
oTyeuUsyoS
°*6°E AINHTY
+~—
Gd —+
th
|
hy
oo

74
roll diameter (or ball diameter, Dy, for the case of stirred
ball milling), particle diameter (Dp), and the distance (D)
between the rolls (or balls). By considering the
geometrical relationships and the force balance between the
balls and the particle, @ can be expressed as a function of
Dpr Dpr and D,
Dp + D @= cos~! ——— (3.2)
Dp + Dp
and also of the coefficient of friction (ph) between the
particle and the balls,
a= tantly (3.3)
as has been shown by Gaudin (1939).
If wp is known, a@ can be calculated from Equation (3.3),
which can then be substituted in Equation (3.2) to obtain a
useful parameter such as the critical ball size to particle
size ratio (Dp/Dp) c- In stirred ball mill grinding using
grinding media of uniform size, the particles that have a
Dp/Dp value less than the critical value will not be broken.
Unfortunately, the value of mw is not known for the present
system. However, it has been shown in Figure 3.4 that when
using 1/4-inch balls, the breakage rate passes through a
-maximum ata Dp/Dy value of approximately 20. As has
already been discussed, the breakage rate increases with
increasing particle size until the particles become too
75
large to be nipped. Therefore, the Dp/Dp value at the
Maximum breakage rate may be regarded as the critical value.
If this value is substituted in Equations (3.2) and (3.3), a
value of 0.32 is obtained for wp. In this calculation, the
separation distance (D) is assumed to be negligibly small
compared to Dp and Do: This value appears to be quite
reasonable considering that, typically, the coefficient of
friction between steel and most ore particles ranges from
0.2 to 0.3 (Wills, 1985).
3.4.3.-Normalization of Breakage Rate
If the angle of nipis a rate-limiting factor for
Stirred ball mill grinding, as discussed above, it follows
that the optimum Dp /Dp ratio of 20:1 should remain constant
regardless of ball size. In order to test this hypothesis,
the breakage rates shown in Figures 3.4 and 3.5 have been
replotted as a function of the Dp/Dp ratio, as shown in
Figure 3.10. This figure continues to show the existence of
separate curves for each ball size with the largest breakage
rates associated with the largest ball sizes. However, as a
result of the normalization of the x-axis, the optimum
breakage rate for all ball Sizes appears to occur at a Dp /D,
ratio of approximately 20. If the breakage rates plotted on
the y-axis in Figure 3.10 are normalized with grinding
energy, then all data can be represented by a single curve,
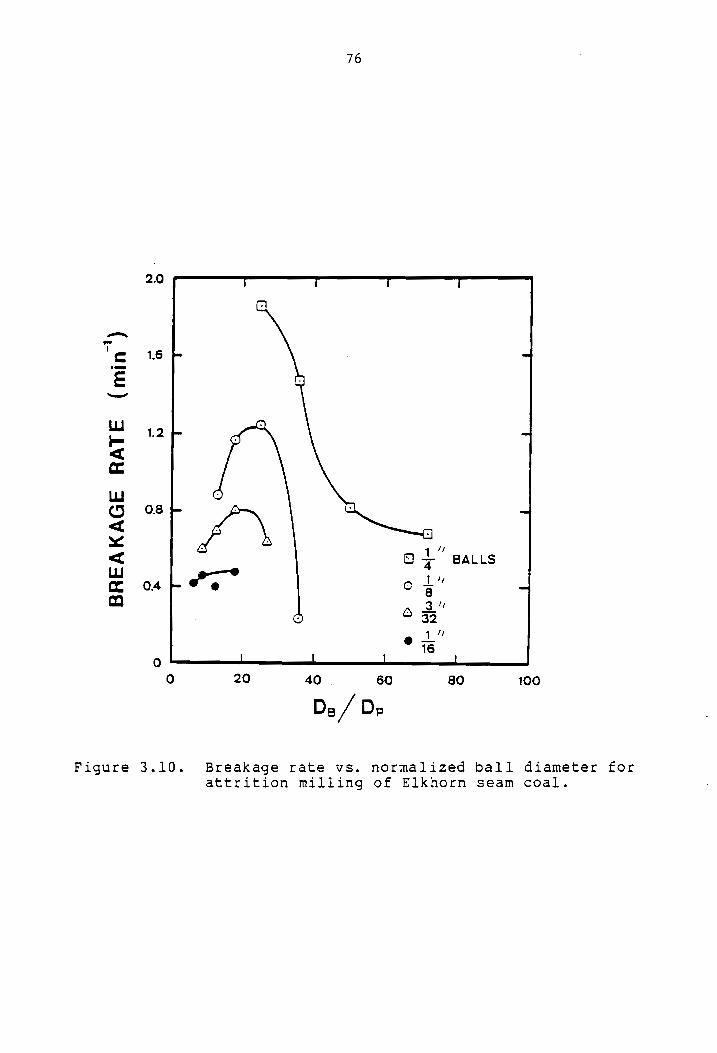
76
2.0 r r T T
a,
‘e 1.6 on onl
& wee
LL 1.2 _ ma, je
< c
Lid
< Cj x< < Of BALLS LJ ce 04 — Cc a" —_
ma B 37
32
L" ° i6
0 { | 1 _!
0 20 40 60 80 100
Ds / Dp
Figure 3.10. Breakage rate vs. normalized ball diameter for attrition milling of Elkhorn seam coal.
77
as shown in Figure 3.11. This figure shows a well-defined
optimum energy-specific breakage rate at a Dp/Dp ratio of
20:1. The steady increase in specific breakage rate with
decreasing Dp/Dp is due to the increasing probability that a
particle will encounter grinding media. Beyond the optimum
ratio of 20:1, however, the probability that a particle will
be nipped and broken between churning balls decreases
rapidly, resulting in a reduced breakage rate.
A similar analysis can be applied to Figure 3.6 in
which the performances of different size media are compared
in grinding a feed coal having a 70-pm mean size. This
figure shows that 1/l6-inch balls gave the best results on
the basis of the product size distribution. The reason that
this particular ball size gave the best results can now be
understood when the Dp/Dp ratios are compared in Table 3.1
As shown, the 1/16-inch balls gave a Dp/Dp value closest to
the optimum value of 20:1.
The angle-of-nip theory proposed here is based on the
relationship between ball size (Dp) and feed size (Dp)- One
must realize, however, that once the grinding proceeds, the
feed size decreases continuously in a batch operation. This
means that as the grinding progresses, smaller grinding
media must be used to keep the grinding operation under
optimum conditions. Therefore, allowing an excessively long
grinding time without changing the media size is an
inefficient method of producing fines. An example of this

78
0.25 i I fe i
0.20
015
SPEC
IFIC
BREAKAGE
_ RATE
(tons/kwh)
010
1" 0 t BALLS
Mt
0.05 o4 - an
S& 35 1"
* i6 0 _| _| 1 |
0 20 60 80 100 40
D3/D,
Figure 3.11. Specific breakage rate vs. normalized ball
diameter for attrition milling of Elkhorn seam
coal.

79
Table 3.1
Ball/Particle Diameter Ratios
Ball Diameter Ball/Particle Diameter
1/4-inch 84.7
1/8-inch 42.3
3/32-inch 31.8
1/16-inch 21.2

80
is given in Figure 3.6, which shows the results obtained
after extended grinding time using a mixture of 1/8-, 3/32-,
and 1/l6-inch balls. Since (Dp/Dp)¢ is a function of p, it
is also important to realize that the efficiency of stirred
ball milling can be improved by selecting the appropriate
type of grinding media.
81
3.5.- n nclu
This investigation has been concerned with the
production of micronized coal using the stirred ball mill
grinding technique. Specifically, the effects of media type
and size have been studied for the purpose of optimizing the
energy usage. As a result of this investigation, the
following conclusions can be drawn:
1) Grinding kinetics are significantly affected by the ball
diameter/particle diameter ratio in the mill.
2) The optimum ball size/feed size ratio can be related to
the angle of nip conditions required for roll crushers.
3} For the coal tested in the present work, the specific
breakage rate is maximum when the ball size/feed size
ratio is 20:l.
The results obtained in the present work show that
stirred ball milling is an efficient method of producing
micronized coal. For the coal sample used in this
investigation, an energy input of approximately 45 kwh/ton
was needed to produce a product with a mean size of 5-ym.

CHAPTER IV
Effect of Operating Parameters in Stirred
Ball Mill Grinding of Coal
4.1.-Introduction
In addition to the media size used ina stirred ball
mill, a number of other operating parameters can affect the
grinding behavior in this process. An appropriate change in
impeller speed, for example, may improve the breakage
kinetics, resulting in a lower required residence time for
material in the mill and an increased throughput. If this
increase in throughput is larger than the increase in the
energy consumption, a net energy savings may be realized.
Likewise, if the percent solids can be increased while
maintaining the same product size and the same mill residence
time, an improvement in the mill throughput per kilowatt hour
of energy consumed will also be achieved.
The purpose of this chapter is to present results
showing the effect of stirring speed and pulp density on the
energy consumed during stirred ball milling. The use of
grinding aids to improve the grinding efficiency at high pulp
densities is also explored.
82
83
4.2.-Experimental
4.2.1.-Samples
The sample used in these tests was Elkhorn seam coal
obtained from United Coal Company. The sample was prepared —
according to the procedure outlined in chapter 3. The bulk
of the -1/4-inch x 20 mesh product from the heavy media bath
was dried and stored under nitrogen. Sub-samples were
periodically removed and frozen in air-tight bags until
needed. As previously mentioned, the clean coal was hammer-
milled to produce a suitable feed for the stirred ball mill.
The natural product size distribution from the hammer mill
was used in all of the following tests.
4,.2.2.-Reagents
Three different reagents were used in the present work:
Sodium meta-Silicate, Lomar D obtained from the Diamond
Shamrock Company, and an experimental polymer emulsion (XDR-
00057-526-22B) provided by Dow Chemical Company.
4.2.3.-Experimenta] Procedure
Three series of tests were conducted to determine i)
the effect of impeller speed, ii) the effect of feed percent
solids, and iii) the effect of grinding aids on the product
size distribution from the mill. The media loading was
84
again held constant at 50% of the mill volume with 100%
Slurry filling of the media void space. Feed percent solids
varied from 20% to 60% solids by weight and impeller speed
from 200 to 750 RPM. Torque readings taken at regular
intervals for the duration of the test were used to
determine the energy input to the mill.
A representative sample was removed from the mill at
the conclusion of each test. The samples were prepared and
analyzed, using an Elzone 80XY particle size analyzer, as
described in Chapter 2.

85
4.3.-Results
4.3.1.-Effect of Stirring Speed
The effect of impeller speed on the product particle
Size distribution was determined by conducting a series of
tests at equal energy input while varying the speed of the
impeller. These tests were conducted at a constant specific
energy input of 63.5 kwh/ton using a hammer mill product
(70~micron mean size) as the feed at a pulp density of 43%
solids by weight. A 3800 gramball mixture was used which
consisted of equal weights of 1/4-, 1/8-, and 3/32-inch
balls. The results for stirring speeds of 765, 521 and 200
RPM are shown in Figure 4.1. These results show that as
stirring speed is decreased the product size distribution
becomes finer. For example, a stirring speed of 765 RPM
produced a mean size of 7 microns, while a 200 RPM stirring
speed produced a mean size of 5.8 microns. This tends to
agree with results reported by Sepulveda (1980) for the
stirred ball milling of chalcopyrite which indicates that
energy is utilized more efficiently when it is input slowly.
The same results were obtained when repeating these
tests at an energy input of 94 kwh/ton, in which the range
of stirring speeds was extended to 1200 and 1350 RPM. For
example, as shown in Figure 4.2, a stirring speed of 1350 RPM
produced amean product size of 8 microns, while a 765 RPM
Stirring speed produced a mean product size of 5 microns.

86
*Teoo
weas UIOYATY
Jo burT
TM
uotzyTAQVVe JOZF
(u0z/YMY) G9
yo 3yndut
Abiaua
Jue YSsUOD
Ye UOTANCTIASTpP
eZTSs yOonpoid
uo paads
butszitys
Jo 4OaJIG
“T*p eainbry
(we) yaLaWvia
J3701LYvd
YANIS % JAAILLVINWNO
OOoL OL
t Lo
TTITT TOTO
CT TttT
TT Tt
THT
TTT 7
T t
Wwd¥ 007
—-—
| 1
—]
| Wdu
ttS
-——
P Wd
GOL 7
— 4
Ol
: |
Z NOL/HMM
S9=3 a
SGinos
%Eer
—
-— XIN 11Va
4
C Ligy?iy
biti pp
fp |
—| OOL

87
*peoo
weas
UIOYXTA
JO bur{T
Tru uotyT3zyqe
OZ
(U0z/YMY)
76 JO
yndut
Abaaua
JueQsuod
ye uoT
INQTIASTp
aZTS
yONpord
uo paeds
Hutsaatys
Jo yOOFIG
°T°p asanbty
(uur) HALAWVIG
ATDILYVd
SAILVINANND YANIS %&
oo ol
L LO
TITT TT
T_T
prtt TT
1 Tt
ee ‘
Wid O64
——
| i
Wdu oNzt
—-—
| P
Wd¥ Osel
——
|
— +
ol
o NOL/HMy
6 =3
- SI10S
% EF |
7 sTiva
8 i
=
“
~
we jij ae
Litre tT} fj
yf }
prep
py
yf
| ool

88
Similar results were reported by Stehr and Herbst (1984) for
the grinding of coal water slurries using a Drais stirred
ball mill. Their results indicate an energy savings of
approximately 25% when grinding at a stirring speed of 562
RPM as opposed to 786 RPM, provided the energy input to the
process exceeds 20 kwh/ton. Stirring speeds higher than
1350 RPM were not possible due to equipment limitations.
4.3.2.-Effect of Pulp Density
The effect of percent solids at constant energy input
is shown in Figures 4.3 and 4.4. The previously described
ball mixture was used for each test. The tests shown in
Figure 4.3 were conducted at 94 kwh/ton and a stirring speed
of 330 RPM. It was noted that over the range of 20% to 50%
solids by weight no significant change in the product size
distribution was observed. This agrees with previous work
conducted on chalcopyrite (Sepulveda, 1980). The 60% solids
test provided only a slightly coarser product size.
For a higher value of specific energy input (280
kwh/ton), as shown in Figure 4.4, the findings were the same
for percent solids of 20% to 50%. The product size
distributions had a mean size of 3.4 microns. The test
involving 60% solids, however, produced a coarser and
somewhat broader distribution having a mean product size of
4.5 microns. This could possibly be attributed to a

89
-Teoo
weas UIOYXLTA
Jo HuL
TT Tw
uotxTaqqQe OF
(u0q/yAy) V6
Jo 3yndut
Abiaua
YueAsuod
ye uOoTtyNGT14STp
aZTS
yOnpoid
uo sprjtTos
WUuedIJed Jo
499g
(wf) yYasLaWvia
31DILYVd to
oot OL
L TTC g
fof
q t
| Tuy
& F
t { Troy Ff
t 4
a |
a saijos
x09 ——
saijos *os
- |
re Saijos
%ev —-—
/, 7
C sanos
xoz ——
Ip 7
L If
F 4
4
5 NOL/HMY
¥6 =3
7 -
XIN TI1va
_ =
Wd
O€E “
- =
re Lt
4 i
figyg yp
t ff
{ |
Ol
OOL
"e*p ainbty
YANIS % JAAILVINWNSD

90
*Teoo
weas UIOYYTA
Jo Hur
[T [tw uotqts7We
JOF (uOZ/YMY)
08z jo
yndut
Abiausa
JueAsuod
3e UOT
ANQCTIAASTIp aZTS
JZONpoId
uo sptTos
yuadiad
Jo YoazIq
(url) HYSIAWVIO
31DILYWd
oo1 OL
L LO
ori
e cof
i /
preerog
4 q
' perry
tt
FT !
| saii0s
*09 ——
SGIIOS %OG
| -
sanos %ty
—-—
7 |
§sailos %0~7
——
| |
r NOL/HM™
082 =3 7
- XIW
TIva 4
r Wd
O€e +
a 77
L _—a
oo pe
a
ee
i Lt}
I tite
td
Ll
ol
ool
"pop ainbtg
YANIS % SZAILVINWND
91
viscosity problem indicating that a viscosity modifier might
be effective for very fine grinding at high percent solids.
4.3.3.-Effect of Grinding Aids
Several tests were conducted at a constant specific
energy input of 94 kwh/ton to determine the effect of
grinding aid addition on the final product size
distribution. These tests were carried out using a ball
mixture, a feed pulp density of 50% and a stirring speed of
330 RPM. The results are plotted in Figure 4.5 as mean
product size versus grinding aid addition (lbs/ton of coal)
for three different grinding aids; sodium silicate, Dow XDR
and Lomar D. It is clear from this figure that the Lomar D
was the most effective grinding aid, reducing the mean
product size from 7.8 microns with no reagent addition to
2.8 microns at an addition of 16.5 lbs/ton. The Dow XDR
reagent produced similar results to Lomar D, although it was
not as effective until the addition reached 14 lbs/ton.
Sodium silicate appeared to show little beneficial effect
even at additions as high as 50 lbs/ton.

92
_ Oo
i tO |
Q& SODIUM SILICATE
8 ©O DOW XDR “
OQ LOMAR 0
0 _! | l |
OQ 12 4 8 16 REAGENT ADDITION (lIb/ton)
MEAN
PR
ODUC
T DIAMETER
(pm)
20
Figure 4.5 Effect of grinding aid addition on the mean
product size at constant energy input of
94 (kwh/ton) for attrition milling of Elkhorn
seam coal.
93
4.4.-Discussion
4.4.1.-Stirring Speed
The results presented in Figures 4.1 and 4.2 indicate
that slower stirring speeds tend to be more energy efficient.
This result may arise from several factors which are affected
by a change in stirring speed. The most obvious effect of a
change in speed is the change in torque requirements for the
mill. The increase in torque with grinding speed is
illustrated in Figure 4.6, for several ball sizes. This
figure also shows that the addition of slurry to the mill has
little effect on the torque requirements. This suggests that
the increase in torque with increasing stirring speed is due
to interaction between the media. Results of this type are
commonly observed when spherical particles are subjected to
Shear (Bagnold, 1954). Therefore the grinding time must be
decreased as the speed is increased in order to achieve an
equal energy input to the mill. However, the results shown
in Figures 4.1 and 4.2 indicate that lower speeds produce a
finer product size distribution. The improved efficiency in
utilization of the energy may simply be due to a longer time
of exposure of the material to the grinding process. At
higher speeds the optimum ball/particle diameter ratio,
discussed in Chapter 3, may never be achieved due to the
short grinding times. However, the longer grinding times
associated with low speed grinding will allow the breakage
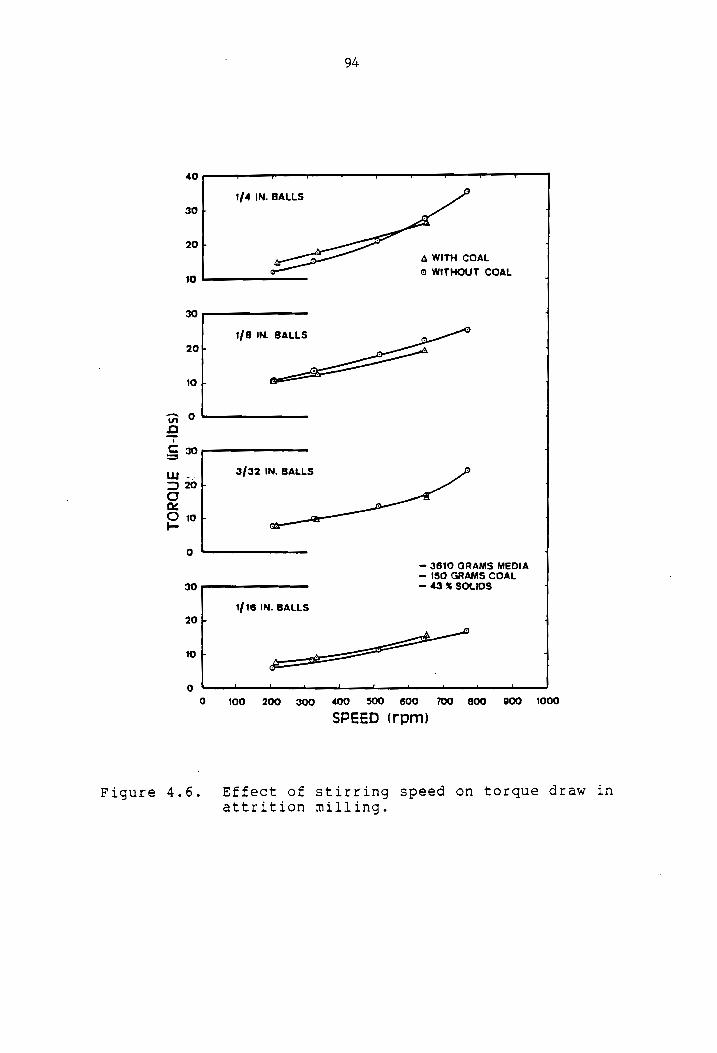
94
40 , ’ _ ™ 7 t v T T
1/4 IN. BALLS
30 7
20+
& WITH COAL
10 | © WITHOUT COAL ,
3/32 IN. BALLS
TORQUE
(in-lbs)
- 3610 GRAMS MEDIA - 180 GRAMS COAL = 43 % SOLIOS 30 |
1/16 IN. BALLS 20}
10 F-
0 100 200 300 400 500 600 $700 soo 300 = 1000
SPEED (rpm)
Figure 4.6. Effect of stirring speed on torque draw in attrition milling.

95
rate function to pass through its optimum value thus
providing a more efficient use of energy.
Another explanation may be that a different type of
breakage mechanism governs the grinding process as speed
increases. As described in chapter 3, a gentle rolling
action of the media occurs at lower speeds which appears to
resemble thousands of tiny roll crushers. However, as
stirring speed is increased this action tends to change into
a more violent atmosphere of turbulent mixing in which the
impact momentum of the balls may prove to be a more
dominating factor than the roll crusher effect. Since impact
breakage is less efficient than slow compression breakage,
this would result in amore efficient use of energy
(Schonert, 1985).
4.4.2.-Percent Solids
As with stirring speed, the torque also varies witha
change inthe mill percent solids. It can be seen from
Figure 4.7 that an increase in percent solids from 20% to 60%
raises the torque requirements of the mill nearly 2.5 times.
This large increase creates a significant impact on the total
energy input to the mill, again drastically decreasing the
length of grind at equal energy inputs.
An increase in the percent solids seems to
predominantly affect the viscosity of the slurry. As the

96
40 t 7 I I I T T
—- 3610 GRAMS MEDIA 4
— 150 GRAMS COAL
- 335 RPM
30 r 4
wn O 5 -
£
— 20F 4
Lid
— CG * ~4
~ © fH 10+ 5
Oo ee! j 1 \ | i i
Oo 20 40 60 80
PERCENT SOLIDS
Figure 4.7. Effect of percent solids on torque draw in attrition milling.

97
slurry weight percent solids was increased from 20% to 50%,
in the tests shown in Figures 4.3 and 4.4, the product from
the mill remained quite fluid. However, the product from
both of the 60% solids tests resembled a paste having no
fluidity. Work performed by Davis (1986) indicates that the
viscosity of coal water slurries produced with micronized
coal increases sharply beyond a loading of 50% solids by
weight. The increase in viscosity will tend to reduce the
lubricating effect previously mentioned and may, in fact,
contribute a resistance to the flow of grinding media.
Tangsathitkulchai and Austin (1985) have also reported that
an increase beyond 45% solids by volume (51% by weight)
Significantly reduces the first-order breakage rates for an
Upper Kittanning coal.
The difference in the product size distribution for the
60% solids test was amplified at higher energy inputs. This
is due to the fact that at higher percent solids the large
increase in viscosity causes ball/particle aggregates to
form which cling to the mill wall. The lower percent solids
samples are unaffected by viscosity problems and will
continue to grind. Once the material is attached to the
mill wall, it is removed from the grinding process. This
reduces the amount of active material inthe mill and asa
result the torque requirement decreases. This also provides
an explanation for the broader product size distribution for

98
the 60% solids test. The large amount of coarse material in
the distribution was a result of material being effectively
removed from the grinding process due to adhesion to the mill
walls.
Similar results were reported by Fuerstanau (1985) for
tumbling ball mills. After a grinding time of 55 minutes
the torque drawn by the mill decreased due to the adherance
of media to the mill walls. This prevented the cataracting
motion of the balls and produced a fly wheel effect on the
mill which caused a corresponding reduction in the power
draw. The addition of grinding aids eliminated this
condition by reducing the viscosity of the slurry.
4.4.3.-Grinding Aids
As can be observed in Figure 4.8, the addition of
grinding aids in stirred ball milling of coal can produce a
reduction in the torque draw of up to 25%. This appears to
be aresult of adecrease in slurry viscosity, rather thana
reduction of the surface free energy as put forth by the
Rebinder theory (Rebinder, 1931; 1940). An interesting
observation which can be made from these results is that the
torque readings appear to be a crude indicator of reagent
consumption. With each increase in reagent addition a
region of constant torque input is extended. As grinding
procedes the particle size in the mill is continually

99
1§
| 4 t v
0.33 LB/T O
14 _ a w
Q Tv © 43 . ——
LJ — 12 -
oS o& O
er 4
10 J t- I j
0 5 10 15 20 25
TIME (sec)
Figure 4.8. Effect of grinding aid addition on torque draw in attrition milling.

100
reduced requiring higher reagent additions in order to
Maintain the same viscosity. Beyond a certain critical
size the reagents are no longer capable of maintaining this
value and the torque readings begin to increase.
The results presented indicate that grinding aids can
reduce the mean product size by nearly 50%, but the large
reagent additions required may prove to be costly. A
comparison should most likely be made between the economic
benefits of the increased throughput associated with an
increased feed percent solids and the additional cost
of reagents.
101
4.5.-Summary and Conclusions
The results presented in this section were concerned
with the optimization of several fundamental operating
parameters in attrition grinding. It appears that proper
adjustment of the operating conditions can achieve even
lower energy requirements. A study of the effect of
stirring speed, percent solids and grinding aid addition
indicates the following:
1) A more efficient use of the energy consumed in stirred
ball milling can be achieved through the use of slower
Stirring speeds.
2) A change from 20% to 50% solids by weight has no
effect on the product size distribution. At higher
values, however, adverse viscosity conditions inhibit
grinding, producing coarser size distributions.
3) Grinding aids appear useful in maintaining lower
viscosity levels which lead to a reduction in the final
product size distribution.
The results obtained in this study indicate that mill
operating conditions can be optimized to further reduce the
energy input to the attrition grinding process. A
combination of low stirring speeds, high percent solids and
the possible use of grinding aids may provide the most

102
energy efficient method for producing micronized coal.
CHAPTER V
General Conclusions and Recommendations for Further Work
5.1.-General Conclusions
The results of the present investigation may be
Summarized as follows:
l. Material unaccounted for in size analysis was found to
significantly affect the size distributions reported for
fine grinding in a stirred ball mill. An existing
procedure has been modified to aid in blending and mass
balancing the data obtained from an Elzone 80XY particle
size analyzer to account for this missed material.
The manipulation of particle size distribution data has
been simplified by the development of numerous computer
programs. These programs allow for the addition,
subtraction, blending and mass balancing of size
distribution data, as well as, a statistical error
analysis for the distribution.
The ball to particle diameter ratio in the stirred ball
Milling of coal has been shown to significantly affect
the grinding kinetics in the mill. The specific breakage
rate is at an optimum when this ratio is 20:1. This
optimum ratio has been related to the angle of nip
concept used for roll crushers.
103
4.
104
The energy consumption in stirred ball milling was found
to be more efficient when using a combination of low
stirring speeds and high percent solids. Stirring speed
must, however, remain high enough to provide significant
input energy to the media for grinding to occur. Percent
solids are limited to a maximum of 50 to 55% solids by
weight due to adverse viscosity conditions arising at
higher values.
Grinding aids appear to be useful in providing lower
viscosity levels which lead to an increased production
of fines. The extremely fine particle sizes, however,
dictate high dosages which may not be economical. The
addition of dispersant type reagents might also hinder
further processing steps such as flotation.

105
5.2.-Recommendations for Further Work
Based on the experience and information obtained in
the present work, further work in defining the following
areas are suggested:
l. By maintaining the ball/particle diameter ratio in the
mill at 20:1 the specific energy rate is maximized.
This suggests that as grinding continues the media size
in the mill should be constantly reduced. This can be
accomplished by stage grinding. This could also be
achieved using a top fed continuous mill with a ball
mixture. When stirring begins a stratification will
take place forcing the larger balls to the top of the
mill, due to a consolidation trickling mechanism. The
thickness of each ball zone and the size of the media in
that zone can be calculated in order to maximize the
breakage rate throughout the duration of the grinding
process. This will provide for the most efficient use
of the input energy to the mill.
2. An investigation into the possibility of grinding to
sub-micron sizes may now be possible through the use of
ultrafine media. According to the optimum ratio given
above, grinding 5 micron particles will require a media
size of 100 microns to maintain an optimum breakage
rate. This may be achieved by using fine size fractions

106
of sand or even coal. Preliminary results indicate that
grinding with media finer than 1 millimeter can produce a
product size distribution having a mean size less than l
micron.
It was found that as media size is reduced, it tends to
behave almost as a slurry itself and that pin type
impellers do not provide sufficient agitation.
Preliminary tests using blade type impellers similar to
that used with Wemco flotation machines proved superior
to the pin impeller resulting in a higher degree of
mixing in the mill. An investigation into the different
types of impellers available for mixing may lead to
further reductions in energy.

REFERENCES
Allen, T., Particle Size Measurement, 3rd edition, Powder Technology Series, Chapman and Hall, New York, 1981.
Anon., "Comminution and Energy Consumption", Report of the Committee on Comminution and Energy Consumption, National Materials Advisory Board, Publication NMAB - 364, National Academy Press, Washington, D.C., 1981.
Bagnold, R.A., 1954, Proc. Roy. Soc., (A)225: 49.
Brown, M.D., 1986, "An Investigation of Fine Coal Grinding Kinetics", M.S. Thesis, Department of Mining and Minerals Engineering, Virginia Polytechnic Institute and State University, Blacksburg, Virginia.
Chung, H. and Hogg, R., 1985, "The Effect of Brownian Motion on Particle Size Analysis by Sedimentation", Powder Technology, 41, pp. 211-216.
Coulter Electronics, _Inc., Operators Reference Manual,
Coulter Counter® Model ZBI, December 1978.
Coulter Electronics, Inc., 1983, "Coulter Model N4", I.C. 4203205A, Coulter Electronics, Inc., Marketing Department, P.O. Box 2145, Hialeah, Florida, 33012-0145.
Coulter Electronics, Inc., 1983, "Industrial Particle Counting and Sizing, Coulter Counter Model TAI1I1L System", I.C. 4203103E, Coulter Electronics, Inc., 590 West Twentieth Street, Hialeah, Florida, 33010.
Coulter, W.H., 1956, Proc, Nat, Electronic Conf, 12, 1034.
Davis, E.G., Collins, E.W. and Feld, I.L., 1973, "Large Scale Continuous Attrition Grinding of Coarse Kaolins", USBM R.I, 7771.
107
108
Davis,E.G., Hansen, J.P. and Sullivan, G.V. in P. Somasundaran, ed., Fine Particles Processing, vol. l,
AIME, New York, 1980, p. 74.
Davis, P.G., 1986, "The Effect of Particle Size Distribution on the Rheology of Ultrafine Coal Water Slurries", M.S. Thesis, Department of Mining and Minerals Engineering, Virginia Polytechnic Institute and State University, Blacksburg, Virginia.
Dobson, B. and Rothwell, E., "Particle Size Production in a Fluid Energy Mill", Powder Technology, 3, 1969/70, pp. 213.
Draiswerke, Inc., Information Circular, 6 Pearl Court,
Allendale, New Jersey.
Feld, I.L., Mc Vay, T.N., Gilmore, H.L. and Clemmons, B.H., 1960, "Paper-Coating Clay from Coarse Georgia Kaolin by a New Attrition-Grinding Process", BM, RI. 5697.
Freedman, S.I., Porter, C.B., and Jamgochian, E.M., 1978, "Technical Aspects of Coal Oil Mixture Combustion", Am. Inst. Min. Eng., Annual Meeting, Denver, Colorado, Feb. 26 - March 2.
Fuerstenau, D.W., Venkataraman, K.S. and Velamakanni, B.V., 1985, "Effect of Chemical Additives on the Dynamics of Grinding Media in Wet Ball Mill Grinding",
Int. J, Miner, Process., 15, pp. 251-267.
Gaudin, A.M., Principles of Mineral Dressing, McGraw-Hill,
New York, 1939.
Grimshaw, V.C. and ALbus, J.F., 1983, "Fluid Energy Grinding and Drying for Fine Powders Production", 1983 AIME Annual Meeting, Preprint No. 83 508, Atlanta, Georgia,13 pp.
Gy, P.M., Sampling of Particulate Materials - Theory & Practice, 2nd. Ed., Elsevier, 1982.

109
Herbst, J.A. and Sepulveda, J.L. 1978, "Fundamentals of Fine and Ultrafine Grinding in a Stirred Ball Mill", Proceedings of International Powder and Bulk Solids Handling, pp. 452-470.
Hiac/Royco, 1981, "The Hiac PC-320", Bulletin No. 8001A, Hiac/Royco Instruments Division, 141 Jefferson Drive, Menlo Park, CA, 94025.
Hiac/Royco, 1984, "The NICOMP Model 270 Submicron Particle Sizer" I.C., Hiac/Royco Instruments Division, 141 Jefferson Drive, Menlo Park, CA, 94025.
Horiba, 1983, "Centrifugal Particle Size Distribution Analyzer Model CAPA500", I.C., Horiba Instruments, Inc., 3001 Hadley Road/Section 5A, South Plainfield, New Jersey, 07080.
Koppers Comp. Inc., Tower Mill, P.O. Box 312, N.Y., 17405.
King, R.P., 1984, "Measurement of Particle Size Distribution by Image Analyser", Powder Technology, 39, pp. 279-289.
Klimpel, R., 1982, Powder Technology, 32, pp. 267.
Kubitschek, H.E., 1958, Nature, 182, pp. 234-235.
Kubitschek, H.E., 1960, Research, 13, pp. 128.
Leeds & Northrup, 1984, "Microtrac Particle Size Analyzers", I.c. C4.7124-BR, Leeds & Northrup Instruments, Sumneytown Pike, North Wales, PA, 19454.
Lines, R.W., 1973, "Some Observations on Sampling for Particle Size Analysis with the Coulter Counter", Powder Technology, 7, pp. 129-136.
Luttrell, G.H., Keyser, P.M., Adel, G.T. and Yoon, R.H., Proceedings, Second Annual Pittsburgh Coal Conference, Pittsburgh, Pennsylvania, September, (1985) 43.

110
Malvern, 1985, "Laser Particle Size Analyzer, 3600E Type", I.C., Malvern Instruments Inc., 200 Turnpike Road (Rt.9), Southborough, MA, 01772.
Malvern, 1985, "System 4700", I.C. Malvern Instruments Inc., 200 Turnpike Road (Rt.9), Southborough, MA, 01772.
Mankosa, M.J., Adel, G.T. and Yoon, R.H., 1986, "Effect ofMediaSizein Stirred Bal1lMillGrindingof Coal", Powder Technology, in Press.
Micromeritics Sedigraph 5000D, 1980, I.c. 500/42703/00, Micromeritics Instrument Corporation, 5680 Goshen Springs Road, Norcross, Georgia, 30093.
Micromeritics Sedigraph-L, 1980, I.c. 550/42701/00, Micromeritics Instrument Corporation, 5680 Goshen Springs Road, Norcross, Georgia, 30093.
Morgan, B.B., 1957, Research, 10, 271.
Napier-Munn, T.J., 1985, "The Determination of the Size Distribution of Ferrosilcon Powders", Powder Technology, 42, pp. 273-276.
Norman, J.E. and Ralston, 0O.C., 1939, "Conditioning Surfaces for Froth Flotation", AIME Technical Publications 1074, 16 pp.
Rebinder, P., 1931, Z Physik, 72, pp. 191-205.
Rebinder, P., Shreiner, L.A. and Zhigach, K.F., 1940, Neftyanaya Prom, S.S.S.R., 5, pp. 54-65.
Sadler III, L.Y., Stanley, D.A. and Brooks, D.R., Powder
Technology, 12 (1975) p. 19.
111
Schonert, K., 1985, "Fundamentals and Applications of High Pressure Grinding Rolls", Engineering Foundation Conference on Recent Developments in Comminution", Hawaii.
Sepulveda, J.L., 1981, "A Detailed Study on Stirred Ball Mill Grinding," Ph.D. Thesis, Department of Metallurgy and Metallurgical Engineering, University of Utah, Salt Lake City, Utah.
Skelton, R., Khayyat, A. and Temple, R., in P. Somasundaran, ed., Fine Particle Processing, vol. 1, AIME, New York, 1980, p. 74.
Stanczyk, M.H. and Feld, I.L., "Investigation of Operating Variables in the Attrition Grinding PRocess", USBM_R, I. 7168, (1968) 28 pp.
Stanczyk, M.H. and Feld, I.L., 1972, "Ultrafine Grinding of Several Industrial Minerals by the Attrtion_Grinding Process", USBM R, I. 764l,.
Stanley, D.A., Sadler III, L.Y., Brooks, D.R. and Schwartz, M.A., 1974, "Attrition Milling of Ceramic Oxides,", Ceramic Bulletin, VOl. 53, No.ll, p. 813.
Stehr, N. and Herbst, J.A., 1984, "Energy Requirements and Grinding Kinetics for Coal-Water Slurry Preparation in High Speed Stirred Ball Mills", Department of Metallurgy and Metallurgical Engineering, University of Utah, Salt Lake City, Utah.
Szegvari, A., 1956, "Treatment of Liquid Systems and Apparatus Therefor", U.S. Patent 2,764,359.
Szegvari, A., 1961, "Ball Containing Apparatus for Finely Grinding Liquid Suspended Particles", U.S. Patent 3,008,657.
Szegvari, A., 1964, "Method of an Apparatus for Grinding a Solid in a Liquid", U.S. Patent 3,131,875.
112
Szegvari, A., 1964, "Continuous Process of Grinding Particluated Material", U.S. Patent 3,149,789.
Szegvari, A., 1964, "Agitator", U.S. Patent 3,450,356.
Tangsathitkulchai, C. and Austin, L.G., 1985. "The Effect of Slurry Density on Breakage Parameters of Quartz, Coal and Copper Ore in a Laboratory Ball Mill," Powder Technology, 42, pp. 287-296.
Trass, O., 1980, "The Szego Mill", Proceedings of the Internationa mposiu n Fine Particle Technology, AIME, Las Vegas, Nev., Feb. 24-28.
Union Process, 1984, "Circulation Grinding", I.C. Q-4-84, Union Process, 1925 Akron-Pennsula Rd., Akron, OH, 44313.
Vogeno, I.W., 1969, "Vibratory Grinding Mills", Chem, and Proc. Eng.,
Yoon, R.H., Report No. DOE/PC/30234-T3, (1984) 182 pp.
Yoon, R.H. and Luttrell, G.H., Coal Preparation, An Internationa] Journal, 2 (3) (1986) 179.
Yoon, R.H. and Miller, K.J. Proc, of the Technical Program,
International Powder and Bulk Solids Handling and Processing, Rosemont, Illinois, May, 1981, (1982) 357.
APPENDIX I
Sample Calculation of Specific Energy Input
The specific energy input for each grinding test was
calculated according to the following equation:
2.978 x 1073 x Speed(RPM) x Torgque(in-lbs) x Time(sec) E =
Sample Weight (grams)
Torque readings were recorded at equal time increments
and an average torque value calculated for each interval
based on the assumption that torque varied linearly with
time during that interval. From this value the energy input
for each time step was calculated. The energy input was
cumulated throughout the duration of the test until the
desired value was reached. Calculated values for a test
conducted at 330 RPM with 150 grams of sample are given in
Table A.l.
The same data was plotted and the area under the curve
determined by the use of a planimeter. This result was then
substituted into the above equation. The total energy input
according to this procedure is 93.6 kwh/ton. This closely
agrees with the tabular result of 93.81 indicating that the
procedure is valid.
113

114
Table A.l
Torque Data
Discrete Average Discrete Cumulative Torque Torque Energy Energy
time (min) (in-lbs) (in-lbs) (kwh/ton) (kwh/ton)
0 10.9 0 0 0 2 11.3 11.1 8.72 8.72 4 11.7 11.5 9.04 17.77 6 12.3 12.0 9.43 27.2 8 12.7 12.5 9.83 37.03
10 13.0 12.85 10.10 47.13 12 13.3 13.15 10.34 57.47 14 13.6 13.45 10.57 68.04 16 13.8 13.7 10.77 78.81 18 13.9 13.85 10.89 89.70 18.75 14.0 13.95 4.11 93.81

APPENDIX II
Example of Charge Calculation
For a Batch Stirred Ball Mill
EXPERIMENT NO. 1
Solids: Elkhorn Seam Coal
Liquid: Water
Weight Percent Solids: 30%
PHYSICAL PROPERTIES
Specific Gravity of Coal: 1.3 g/cm3
Specific Gravity of Liquid: 1.0 g/ml
Void Volume of Mill: 315 cm?
MASS BALANCING EQUATIONS:
Total Volume
Percent Solids = —— = 0.43
SOLVING THE SYSTEM OF EQUATIONS YIELDS:
X 150 Grams of coal
Y 200 mililiters of water
Therefore amill charge of 150 grams of coal and 200
milliliters of water will result in a 100% void fraction
filling of the ball charge.
115

APPENDIX III
Application of Angle of Nip Theory to Different
Ball Diameters
The concept of angle of nip derived for equal ball
(roller) sizes can also be extended to include balls with
different diameters. Figure 1 shows the case for two balls
having diameters D, and Dy. A simplified diagram of the
geometry involved for this situation is illustrated in Figure
2. This diagram allows us to develop several expressions
based solely on the geometry of the relationship between
balls.
From the law of sines we can immediately develop the
following equation:
SIN @ (Ryt+r) = SING (Rotr) (1)
Based on the trigonometric formulas for an oblique
triangle, the following relationships can be derived:
1 1 S = —— (atbtc) = —— [(Rotr) + (Rytr) + (R]+RQ)] (2)
2 2
@® is then defined as:
2[s(s-a) (s-b) (s-c) ]1/2 SIN @ = (3)
be
116
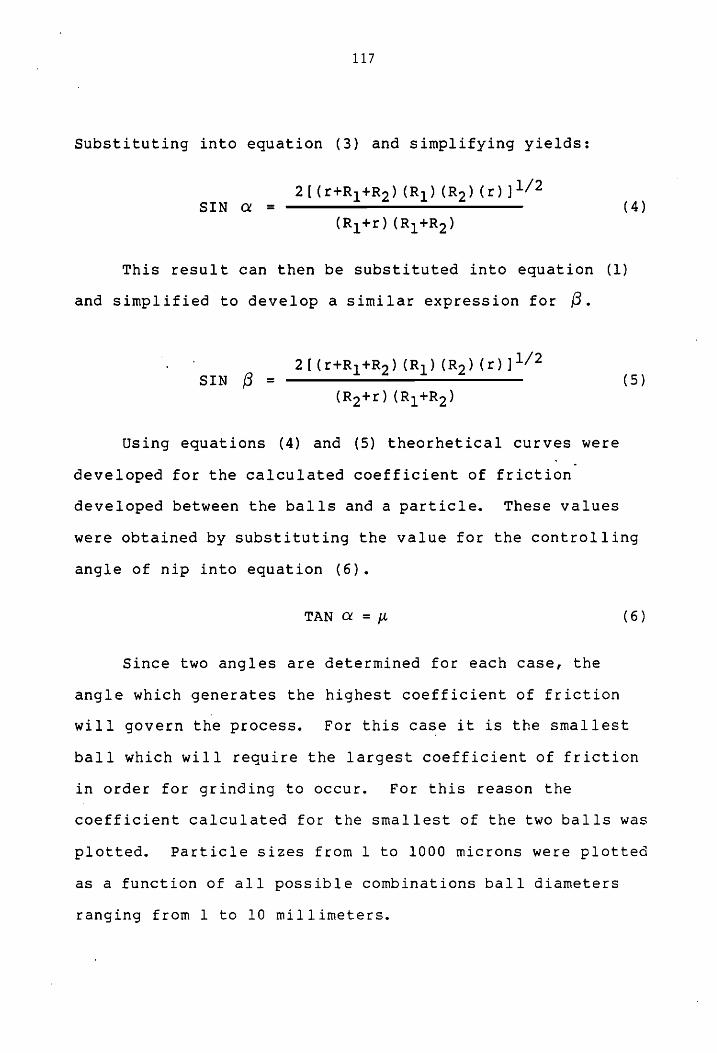
117
Substituting into equation (3) and simplifying yields:
2[ (r+R1+R5) (Ry) (Ro) (x) ]272 SIN a = te (4)
(Ry +r) (R]+Ro)
This result can then be substituted into equation (1)
and simplified to develop a similar expression for P.
: 2 (r+R1+R5) (Ry) (R5) (x) ] 272 SIN 6 = i (5)
(Ro+r) (R1 +R)
Using equations (4) and (5) theorhetical curves were
developed for the calculated coefficient of friction
developed between the balls and a particle. These values
were obtained by substituting the value for the controlling
angle of nip into equation (6).
TAN @ = pL (6)
Since two angles are determined for each case, the
angle which generates the highest coefficient of friction
will govern the process. For this case it is the smallest
ball which will require the largest coefficient of friction
in order for grinding to occur. For this reason the
coefficient calculated for the smallest of the two balls was
plotted. Particle sizes from 1 to 1000 microns were plotted
as a function of all possible combinations ball diameters
ranging from 1 to 10 millimeters.

118
Figure 1. Schematic representation of the angle of nip
between different size grinding media in a stirred ball mill.

119
Figure 2. Simplified geometry for balls having different diameters.

120
As can be seen from Figure 3, the lowest required
coefficent of friction occurs when the ball diameters are
equal. This proved to be the case for all combinations.
This tells us that the use of a ball mix does not provide
any Significant improvements in grinding. The larger balls
in the mix will simply serve to grind the larger particles
in the feed distributions which the small media cannot
grind, as pointed out in chapter 2.
An interesting observation can be made as to the affect
that an increase in the coefficient of friction between the
media and particle would have. A plot of ball diameter
versus particle diameter (Figure 4) shows us that small
balls can be used to grind larger particles if the
coefficient of friction can be increased. This would
allow the use of smaller balls which are necessary for more
energy efficient grinding of fine particles, as already
pointed out in Chapter 3.

121 |
0.15
012 F
0.09 &
0.03 f°
COEFFICIENT
OF FRICTION
0
0
Figure 3.
4 1 2 3
RADIUS BALL (1)/RADIUS BALL (2)
Calculated coefficient of friction
required for grinding.
5

N uO
122
T i i v
= 20f SF - © LL ws)
tu S = 1.5 - of “
Oo
+ o << 1.0 - 9 “
co RC s Q.
—_ S05- 4 — Oo. ©
QO 7 {| } dom |
0 20 40 60 80 100
Figure 4,
MEAN FEED DIAMETER(um)
Calculated feed diameter versus optimum ball Size for different values of coefficient of friction.
VITA
Michael J. Mankosa was born on December 20, 1960 in
Weirton, West Virginia, where he lived until graduating from
high school in 1979 in the top twenty of his class. During
this time he was actively involved in student and civic
affairs and received scoutings highest honor, eagle scout.
He declined an appointment to the United States Military
Academy in favor of enrolling in the engineering department
at Virginia Polytechnic Institute and State University in
the fall of 1979.
As a senior, he was active inthe service fraternity of
Pi Kappa Phi, the Virginia Tech Student Union, the Virginia
Tech Jhoon Rhee Martial Arts Club, as well as, president of
the Virginia Tech Judo Club and Secretary of the Student
Chapter of AIME, The Burkhart Mining Society.
Michael enrolled as a full time graduate student in the
summer of 1983 in order to pursue a Master of Science degree
in Mining and Minerals Engineering. During this time he was
inducted into the honorary society of Phi Kappa Phi. He
plans to remain at Virginia Tech for his Ph. D. after
completion of his Master of Science degree.
Michael J. Mankosa
123
OPTIMIZATION OF OPERATING CONDITIONS IN STIRRED
BALL MILLING OF COAL
by
Michael James Mankosa
Committee Chairman: Dr. Greg T. Adel Mining and Minerals Engineering
(ABSTRACT)
As a prerequisite to producing super-clean coal with
any physical coal cleaning process, such as microbubble
flotation, the feed coal must be micronized to liberate the
finely disseminated mineral matter. The stirred ball mill
is regarded as one of the most efficient devices for
micronizing coal. Using a five-inch batch mill, the optimum
operating conditions have been determined in terms of media
size, feed size, media type, stirring speed and percent
solids. The rates of breakage determined with monosized
feeds are compared on the basis of specific energy
consumption. It has been found that a 20:1 ball
size/particle size ratio gives optimum grinding conditions.
With the fine particle sizes obtained using stirred
ball milling, as weil as other fine grinding techniques, a
growing concern has been generated regarding the accuracy of
these size distributions.

An automated technique has been developed in which a
complete mass balanced size distribution can be obtained
using an Elzone® g0xy particle size analyzer. A computer
program is used to blend the data from successively smaller
Orifice tubes, as well as, to determine the weight percent
of material in a particle size distribution finer than the
lower detection limit of the analyzer. This result is then
used to correct the distribution for the missing fine
material.
Experimental results indicate that size distributions
obtained using this procedure are reproducible and compare
favorably with those obtained using other size analysis
techniques.