xx the challenges of using biodata in promotional...
TRANSCRIPT
ACM Transactions on xxxxxxxx, Vol. xx, No. x, Article xx, Publication date: Month YYYY
The Challenges of Using Biodata in Promotional Filmmaking
STUART REEVES, Mixed Reality Lab, University of Nottingham, UK
SARAH MARTINDALE, Horizon Digital Economy Research, University of Nottingham, UK PAUL TENNENT, Mixed Reality Lab, University of Nottingham, UK STEVE BENFORD, Mixed Reality Lab, University of Nottingham, UK JOE MARSHALL, Mixed Reality Lab, University of Nottingham, UK BRENDAN WALKER, Aerial, UK
We present a study of how filmmakers collected and visualised physiological data—‘biodata’—to construct a series of short promotional films depicting people undergoing ‘thrilling’ experiences. Drawing on ethnographic studies of two major advertising campaigns, we highlight key concerns for integrating sensors and sensor data into film production. Our findings address the perceived benefits of using biodata within narratives; the nature of different on-screen representations of biodata; and the challenges presented when integrating biodata into production processes. Drawing on this, we reconsider the nature of information visualisation in the filmmaking context. Further implications from our case studies provide recommendations for HCI collaborations with filmmaking and broadcast industries, focussing both on the practical matters of fitting sensor technologies into and handling data within production workflows, as well as discussing the broader implications for managing the veracity of that data within professional media production.
Categories and Subject Descriptors: H5.m. Information Interfaces and Presentation (e.g., HCI)
General Terms: Human Factors; Design.
Additional Key Words and Phrases: Physiological sensing; biodata; television; film; advertising; information visualisation; production; narrative; veracity.
ACM Reference Format:
Reeves, S., Martindale, S., Tennent, P., Benford, S., Marshall, J., Walker, B. 2015. The Challenges of Using Biodata in Promotional Filmmaking. ACM Trans. Comput.-Hum. Interact. 0, 0, Article 0 (2015), XX pages. DOI = 10.1145/0000000.0000000 http://doi.acm.org/10.1145/0000000.0000000
1. INTRODUCTION Biodata, derived from physiological sensing such as electrocardiography, electrodermal activity and respiration, is an emerging form of personal data that is of growing interest within HCI. However, although physiological sensors are now becoming readily available as cheap consumer devices, there are relatively few
This work was funded by RCUK through the Horizon Digital Economy Research grant (EP/G065802/1). Authors’ addresses: Reeves, S., Tennent, P., Benford, S., Marshall, J.: Mixed Reality Lab, School of Computer Science, University of Nottingham, NG8 1BB, UK. Email: [email protected] Martindale, S.: Horizon Digital Economy Research, University of Nottingham, NG7 2TU, UK. Email: [email protected] Walker, B.: Aerial, 258 Globe Road, London, E2 0JD, UK. Email: [email protected] Permission to make digital or hardcopies of part or all of this work for personal or classroom use is granted without fee provided that copies are not made or distributed for profit or commercial advantage and that copies show this notice on the first page or initial screen of a display along with the full citation. Copyrights for components of this work owned by others than ACM must be honored. Abstracting with credits permitted. To copy otherwise, to republish, to post on servers, to redistribute to lists, or to use any component of this work in other works requires prior specific permission and/or a fee. Permissions may be requested from Publications Dept., ACM, Inc., 2 Penn Plaza, Suite 701, New York, NY 10121-0701 USA, fax +1 (212) 869-0481, or [email protected]. © XXXXX $15.00 DOI:http://XXXXXX
XX
XX:X S. Reeves et al.
ACM Transactions on xxxxxxxx, Vol. xx, No. x, Article x, Publication date: Month YYYY
reported studies of the actual use of biodata ‘in the wild’, by which we mean studies of real-world applications that move beyond initial research demonstrations. Through this we can sensitise HCI to the distinctive opportunities and challenges of using biodata in actual professional practice.
Explorations of biodata in HCI have examined its potential for health and wellbeing, ranging from physical visualisations of physical exertion (e.g. [Khot, Hjorth and Mueller 2014]) to biofeedback systems [Hook 2008; Sanches et al. 2010] that support reflection on affect and emotion. Beyond this, biodata has been used for the control or adaptation of the user experience according to a participant’s physiological responses. Entertainment applications have proved especially popular here including controlling conventional games [Nenonen et al. 2007], ‘exergames’ that involve considerable physical exertion [Mueller et al. 2012] and also the control of amusement rides [Marshall et al. 2011]. A second use of biodata has been to enable storytelling from these experiences (rather than directly controlling them), for example capturing biodata from rollercoaster riders and then broadcasting and visualising it so that spectators can tune into their experience [Schnädelbach et al. 2008]. In this second case, the creative interpretation of biodata becomes a vehicle to support storytelling [Tennent et al. 2012].
The focus of our paper is on this second idea—using biodata to enhance storytelling—in this case in the context of film and television production. HCI is increasingly engaging in this area, and there is a growing body of studies and systems exploring a range of live and pre-recorded video production settings, as well as mobile video broadcasting [Bartindale et al. 2012; Licoppe and Morel 2009; Engstom et al. 2012; Dezfuli et al. 2012; Weilenmann et al. 2013; Perry et al. 2009; de Sa et al. 2013; Mughal and Juhlin 2013]. However, in spite of studies of how production professionals go about their work (e.g. [Engstrom et al. 2010]) there remain few studies integrating novel interactive technologies with actual professional production workflows.
We present a long-term ‘in the wild’ [Crabtree et al. 2013] study of the capture and use of biodata by promotional filmmakers. Consonant with the ‘wild’ approach, this has involved collaborating with industry professionals both to support and then study their professional practices so we might ultimately inform HCI with new insights gathered from the field. In this case, we have collaborated with two different companies making promotional films, one for a horror movie and the other for a brand of car, over a period of two years. The opportunity for undertaking this research arose as a result of these companies approaching us to engage in commercial projects following on from extensive media coverage surrounding our previous research in broadcasting biodata from rollercoaster rides [Schnädelbach et al. 2008]. They saw the potential in this approach for telling stories about how people undergo thrilling experiences that might be used to promote products. For our part, we saw a rare opportunity to follow an example of HCI research downstream and to be able to report from the field about the issues that arise when deployed by professionals in practice.
The two promotional films that we consider below were produced for the purposes of advertising and so constitute a particular form of storytelling, namely one oriented towards making a product appear attractive. However, it should also be noted that both examples present considerably longer narratives than those depicted in the standard 30-second advertisements shown on television. They are, in essence, examples of short films in which filmmakers integrate biodata with video footage as part of a professional production process. Beyond serving as examples of filmmaking,
The Challenges of Using Biodata in Promotional Filmmaking XX:X
ACM Transactions on xxxxxxxx, Vol. xx, No. xx, Article xx, Publication date: Month YYYY
we were also intrigued by the wider opportunity to engage HCI research with the advertising industry. Advertising is a commercially important sector of the creative industries (indeed, it is the demands of advertising that drives much work on profiling and personalisation underpinning popular search and social media services such as Google, Facebook, YouTube and others). Moreover, promotional filmmaking, from adverts to music videos, can serve as a ‘proving ground’ in which emerging filmmakers experiment with new ideas and techniques. In short, engaging with promotional filmmakers provided us with a unique opportunity to explore how professionals engaged with emerging biodata technologies while also sensitising HCI to some of the distinctive challenges that arise in this commercially significant—but perhaps somewhat overlooked—sector.
In the following, we present two case studies of how biodata was integrated into professional production processes, during which it was captured, edited and processed to appear on-screen alongside video of participants undergoing various experiences. As part of this we unpack our experiences of collaborative working with promotional filmmakers. We have two aims in reporting this material. Firstly, we wish to sensitise HCI research to the unusual and challenging ways in which creative practitioners in filmmaking and broadcasting both make sense of and actually seek to employ biodata in practice. Secondly, we seek to sensitise HCI research to the organisational ‘shape’ that collaborations with media production can take. In line with these aims, our study contributes to HCI in three broad ways:
1. Expanding perspectives on information visualisation, that traditionally tends to emphasise clarity, to also consider forms of presentation that convey excitement, suggest liveness and complexity, and support a spoken commentary.
2. Revealing how the capture and editing of complex physiological data needs to be deeply embedded into the entire production process spanning pre-production planning, data capture and post-production editing and presentation.
3. Raising complex questions of the nature of data ‘veracity’, particularly through the ways in which physiological data was handled during the production process as well as how it came to be re-presented on-screen. This point has broader implications for understanding relationships between research data and practitioners such as promotional filmmakers and advertisers.
We now turn to present our two case studies in detail. The rest of the paper will unpack our findings from these engagements, then discuss implications for information visualisation, production processes, and data veracity.
2. BIODATA IN SERVICE OF NARRATIVE: CASE STUDIES We begin by presenting our two example case studies. The first case study involved a documentary-style advert for a horror film in which the biodata of five selected participants (cinema audience members) was recorded, reported on and visualised alongside footage of the cinema auditorium and seated audience, with scenes from the film intercut. The second case study involved multiple short promotional films, in the form of a series of four online video advertisements for a model of car. These video adverts depicted a small number of participants (competition winners) engaging in various ‘thrilling’ experiences including skydiving simulators, driving on car racing tracks, riding off-road vehicles, and flying in a helicopter.
XX:X S. Reeves et al.
ACM Transactions on xxxxxxxx, Vol. xx, No. x, Article x, Publication date: Month YYYY
In both cases, our research methodology mirrored a ‘performance-led in the wild’ approach that has emerged from previous engagements with creative practitioners as described in [Benford et al 2013]. Following Rooksby [2013], we do not engage with ‘the wild’ as a theoretical matter of investigating ‘real’ instead of ‘artificial’ deployments of biosensing technology but rather as a site of opportunity for understanding and engaging with creative practice. Within this approach, our research team engaged in two modes. The first was as technology providers to support the creative practice of external practitioners—henceforth referred to as the ‘filmmakers’. In this mode, members of our team—henceforth referred to as the ‘biodata-wranglers’—provided various biodata related services to support the production process including supplying sensing equipment, capturing biodata during shooting, processing this data into a form that the filmmakers could work with (typically sequences of animated visualisations that they could edit with more conventional video footage during postproduction). Our relationship with the filmmakers was largely coordinated and managed by Walker, a design practitioner with whom we had collaborated previously (e.g. [Schnädelbach et al. 2008; Tennent et al. 2012]) and also a member of our research team. Beyond managing this relationship, Walker himself also acted as key talent for the filmmakers, performing as a professional thrill ‘Expert’ who appeared on-screen, describing equipment, the experimental setup, then interpreting and presenting results. In general, it was the filmmakers, supported by the Expert, who generated the creative ideas for the content of the films, including how biodata was to be used and presented within them, while the biodata-wranglers responding to their ideas with appropriate technologies.
Our second mode of engagement was as ethnographers where we documented the production process. This was delivered by different members of our research team who attended shoots and who interviewed the filmmakers, biodata-wranglers and the Expert in order to generate a rich picture of how the filmmaking processes unfolded, including running two debriefing workshops at the commissioning advertising agency and also the car manufacturer for the second film.
The following two case studies now describe how the two different promotional films were produced, focusing on the treatment of biodata and its use to support storytelling, and highlighting the activities of the filmmakers, biodata-wranglers and the Expert. We detail what biodata was captured, and how this data was subsequently handled and visualised. We provide a brief description of the final films that were produced, describing the nature and content of the films before providing salient details of the treatment of biodata in both production and post-production. We provide weblinks to the films where they are available online and strongly encourage the reader to watch the films before reading the descriptions as this will greatly help the explanations. In each case study we chart how this was very much a learning process, and one that evolved as the filmmakers learned about biodata and the biodata-wranglers learned about the ways in which they reasoned about this data and their various requirements for using it in the production process.
2.1 Case Study 1: ‘The fear factor’ for Sinister Our first case study involves a documentary-style film commissioned in order to promote a Hollywood horror movie, ‘Sinister’, in the UK1. The 5 minute featurette was distributed online at the time of the movie’s release and subsequently included on the Region 2 DVD. A 60 second version was also used to advertise the movie on
1 See http://web.orange.co.uk/p/film/home?package=2132
The Challenges of Using Biodata in Promotional Filmmaking XX:X
ACM Transactions on xxxxxxxx, Vol. xx, No. xx, Article xx, Publication date: Month YYYY
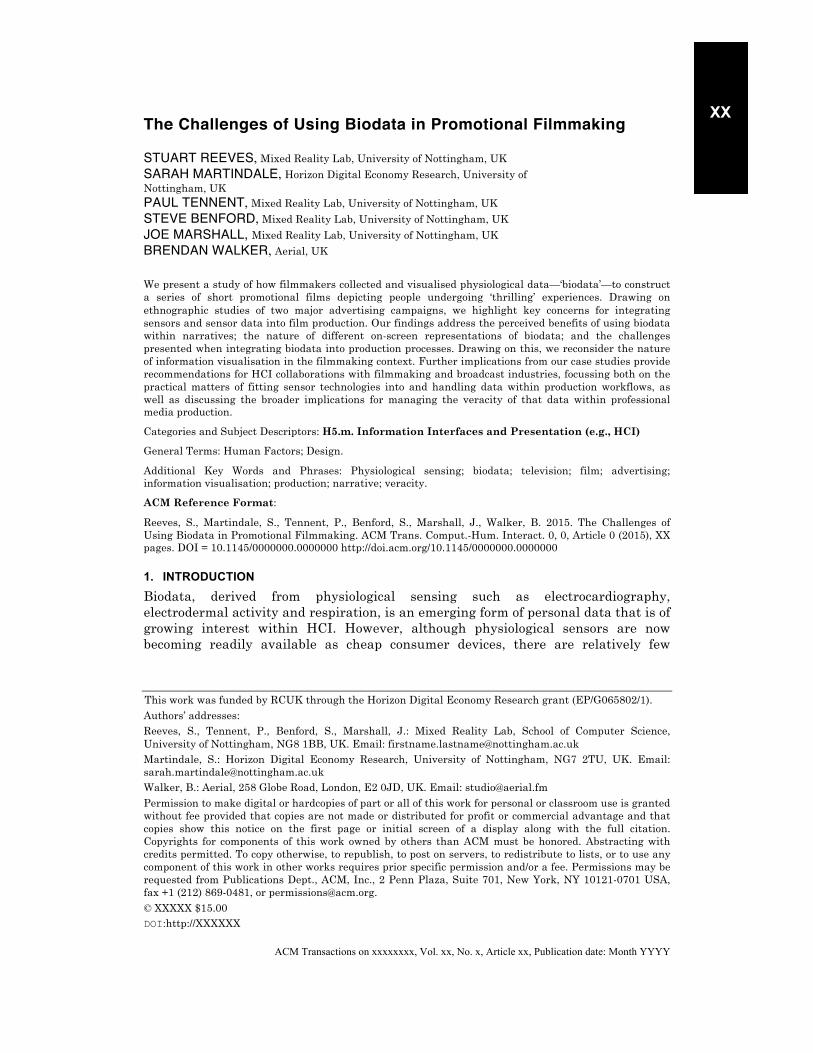
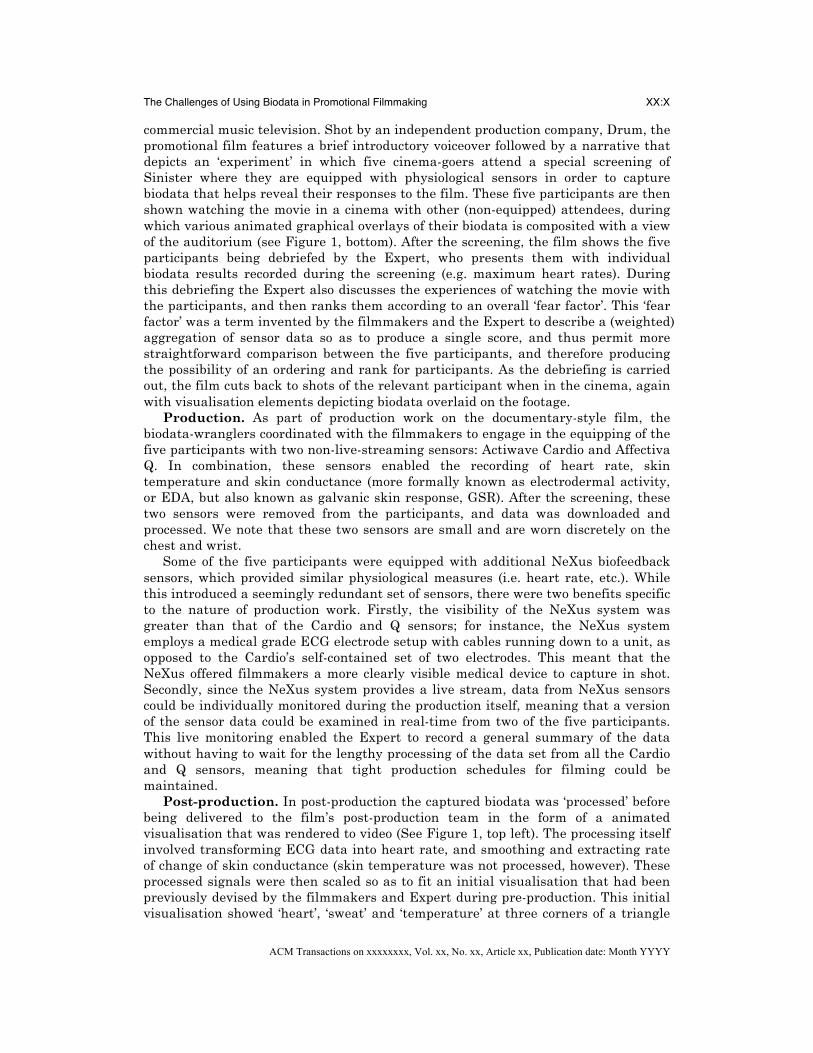
commercial music television. Shot by an independent production company, Drum, the promotional film features a brief introductory voiceover followed by a narrative that depicts an ‘experiment’ in which five cinema-goers attend a special screening of Sinister where they are equipped with physiological sensors in order to capture biodata that helps reveal their responses to the film. These five participants are then shown watching the movie in a cinema with other (non-equipped) attendees, during which various animated graphical overlays of their biodata is composited with a view of the auditorium (see Figure 1, bottom). After the screening, the film shows the five participants being debriefed by the Expert, who presents them with individual biodata results recorded during the screening (e.g. maximum heart rates). During this debriefing the Expert also discusses the experiences of watching the movie with the participants, and then ranks them according to an overall ‘fear factor’. This ‘fear factor’ was a term invented by the filmmakers and the Expert to describe a (weighted) aggregation of sensor data so as to produce a single score, and thus permit more straightforward comparison between the five participants, and therefore producing the possibility of an ordering and rank for participants. As the debriefing is carried out, the film cuts back to shots of the relevant participant when in the cinema, again with visualisation elements depicting biodata overlaid on the footage.
Production. As part of production work on the documentary-style film, the biodata-wranglers coordinated with the filmmakers to engage in the equipping of the five participants with two non-live-streaming sensors: Actiwave Cardio and Affectiva Q. In combination, these sensors enabled the recording of heart rate, skin temperature and skin conductance (more formally known as electrodermal activity, or EDA, but also known as galvanic skin response, GSR). After the screening, these two sensors were removed from the participants, and data was downloaded and processed. We note that these two sensors are small and are worn discretely on the chest and wrist.
Some of the five participants were equipped with additional NeXus biofeedback sensors, which provided similar physiological measures (i.e. heart rate, etc.). While this introduced a seemingly redundant set of sensors, there were two benefits specific to the nature of production work. Firstly, the visibility of the NeXus system was greater than that of the Cardio and Q sensors; for instance, the NeXus system employs a medical grade ECG electrode setup with cables running down to a unit, as opposed to the Cardio’s self-contained set of two electrodes. This meant that the NeXus offered filmmakers a more clearly visible medical device to capture in shot. Secondly, since the NeXus system provides a live stream, data from NeXus sensors could be individually monitored during the production itself, meaning that a version of the sensor data could be examined in real-time from two of the five participants. This live monitoring enabled the Expert to record a general summary of the data without having to wait for the lengthy processing of the data set from all the Cardio and Q sensors, meaning that tight production schedules for filming could be maintained.
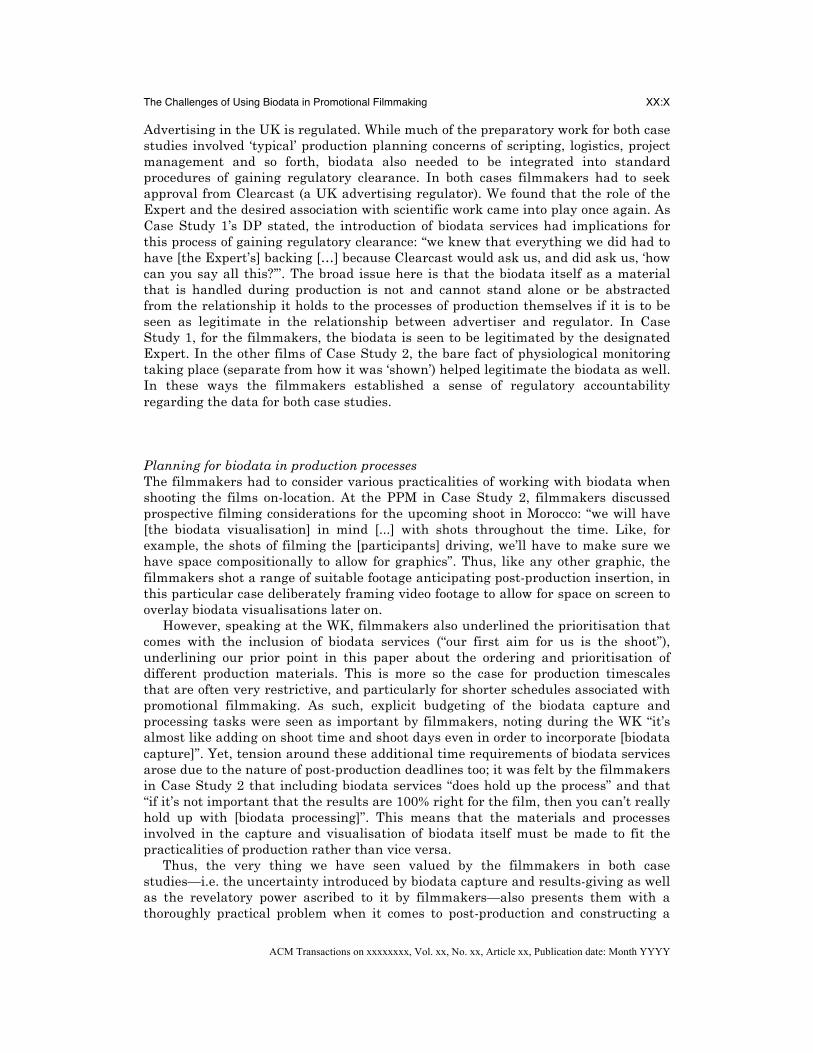
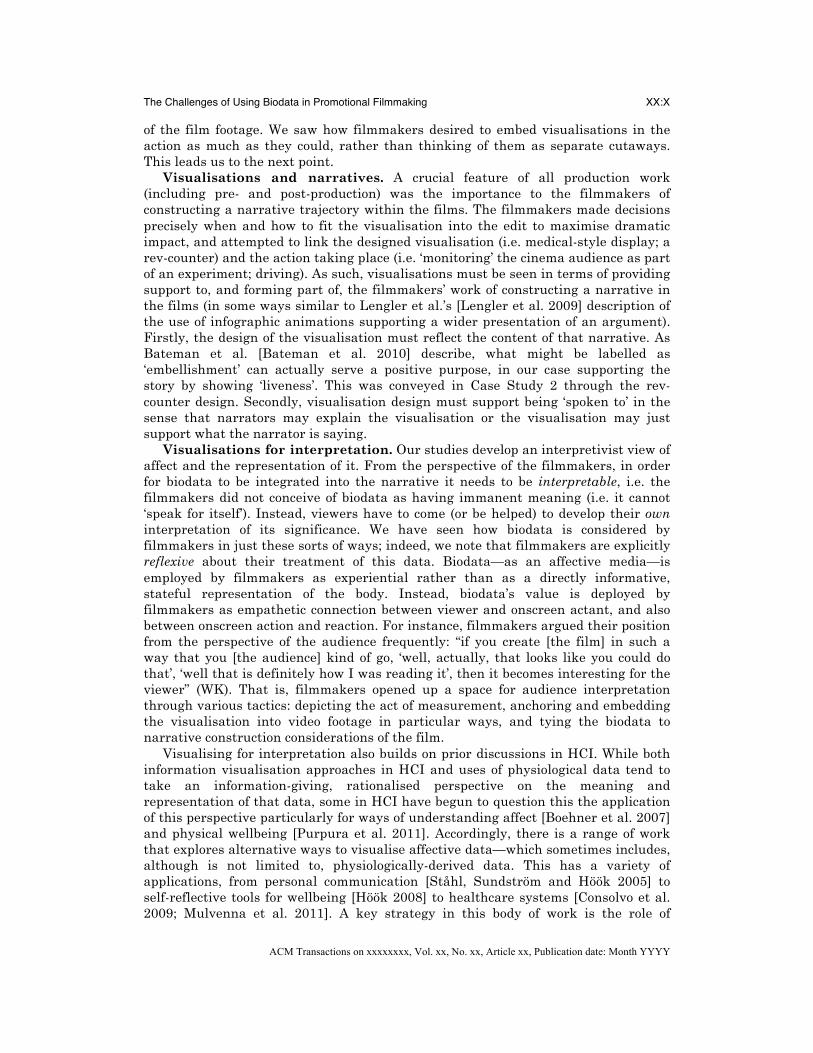
Post-production. In post-production the captured biodata was ‘processed’ before being delivered to the film’s post-production team in the form of a animated visualisation that was rendered to video (See Figure 1, top left). The processing itself involved transforming ECG data into heart rate, and smoothing and extracting rate of change of skin conductance (skin temperature was not processed, however). These processed signals were then scaled so as to fit an initial visualisation that had been previously devised by the filmmakers and Expert during pre-production. This initial visualisation showed ‘heart’, ‘sweat’ and ‘temperature’ at three corners of a triangle
XX:X S. Reeves et al.
ACM Transactions on xxxxxxxx, Vol. xx, No. x, Article x, Publication date: Month YYYY
with the ‘fear factor’ aggregate value in the centre, as well as the processed values of each (Figure 1, top left). A series of 30 second animated visualisations were produced for each participant. On the instruction of the filmmakers and Expert, these segments were selected according to two criteria: firstly, matching moments in the exiting conventional video footage where the Expert had reported numerical results; secondly segments were included so as to provide a representative range of maxima and minima of each participant’s sensor data.
The filmmakers subsequently commissioned a graphic designer to design a final visualisation (that turned out to be quite different from the initial one) to appear in the edited five minute film (Figure 1, top right and bottom). Further statistics were provided as text by the biodata-wranglers for the filmmakers so as to support a press release they were preparing.
Figure 1: Video-rendered data provided to the film’s post-production team from the biodata-wranglers (top,
left); the final visualisation as designed by filmmakers (top right); a still from the final film (bottom). [© Drum]
2.2 Case Study 2: Four online films for ‘Built to Thrill’ This second case study consisted of a longer-term and more iterative engagement than the first, resulting in four promotional films lasting between 1-3 minutes each. These four films formed part of a broader cross-media advertising campaign called ‘Built to Thrill’. This case study was more complex in terms of its arrangement than the first; a wide range of different organisations and relationships were involved. The
The Challenges of Using Biodata in Promotional Filmmaking XX:X
ACM Transactions on xxxxxxxx, Vol. xx, No. xx, Article xx, Publication date: Month YYYY
campaign was delivered by advertising agency TBWA\London and production company Connected Pictures for Nissan Europe, as part of promoting the Nissan Juke car.
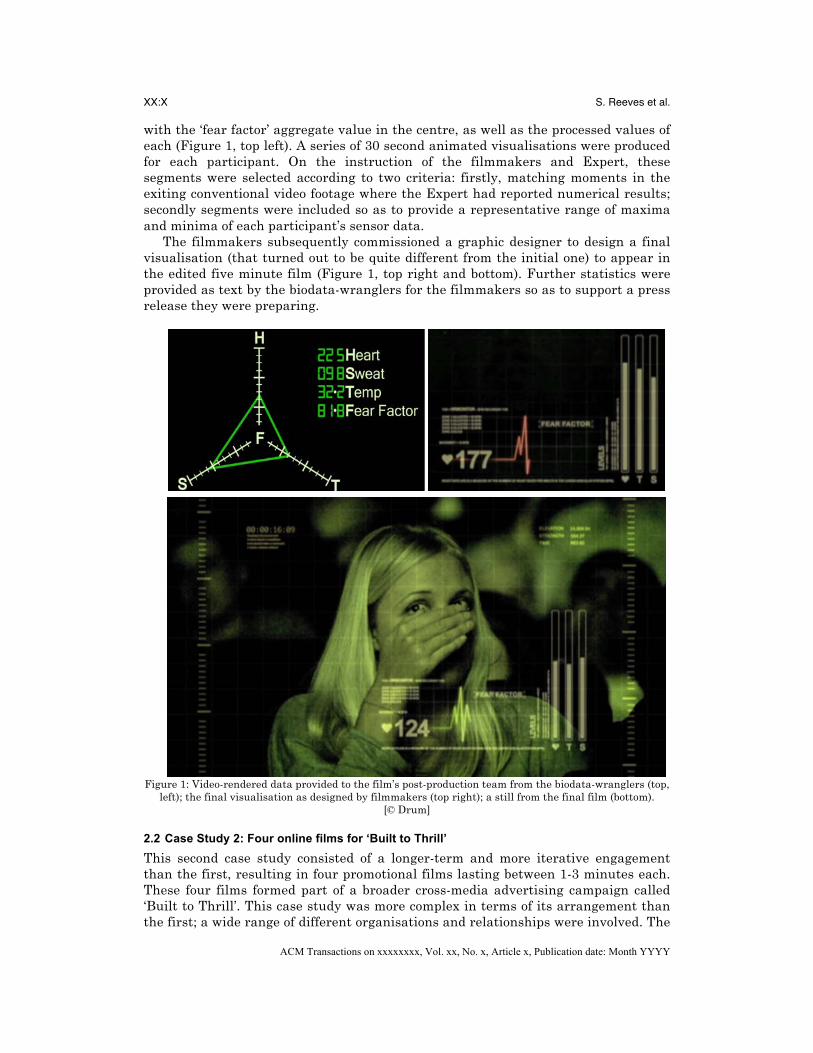
The first opening film introduced the Expert (who again featured onscreen), the product, the theme of ‘built to thrill’, and also the idea of capturing and depicting biodata. The subsequent films narrated a series of a series of ‘experiments’ to explore the nature of ‘thrill’ that involved members of the public who were recruited as participants through a series of competitions and questionnaires delivered via the campaign website. This resulted in three different sets of participants for each film, with each group taking part in the production process by being filmed as they were equipped with physiological sensors and undertook various ‘thrilling’ activities.
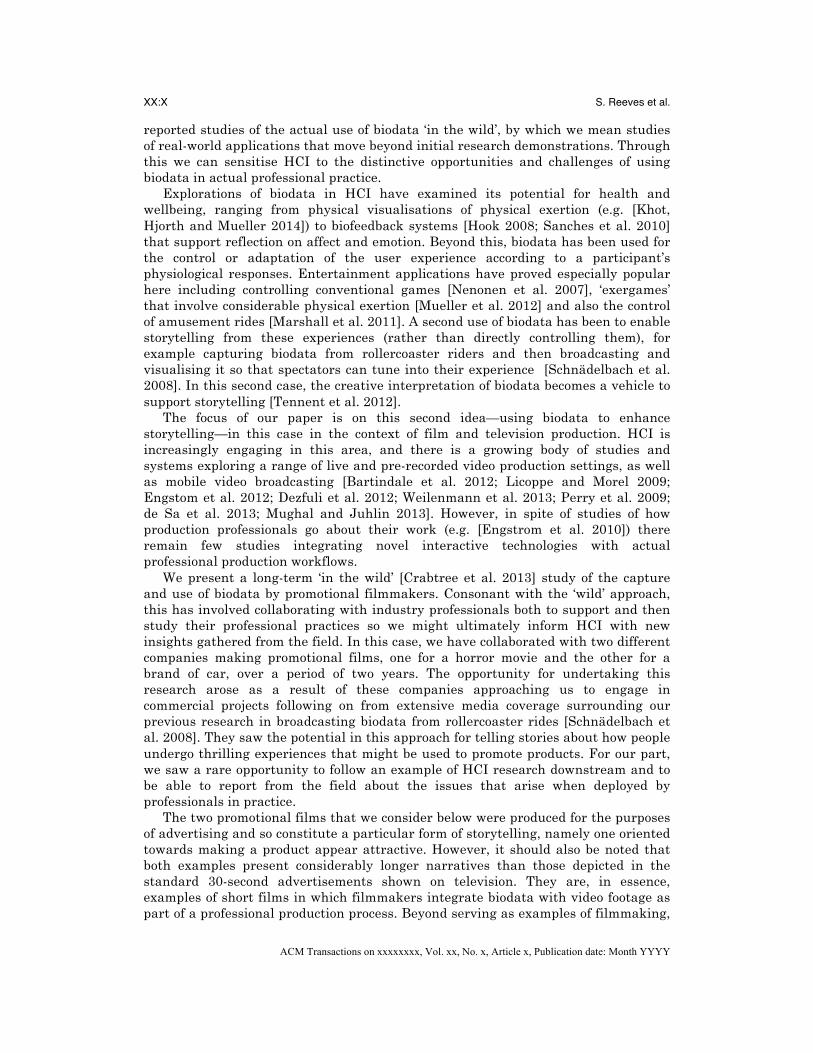
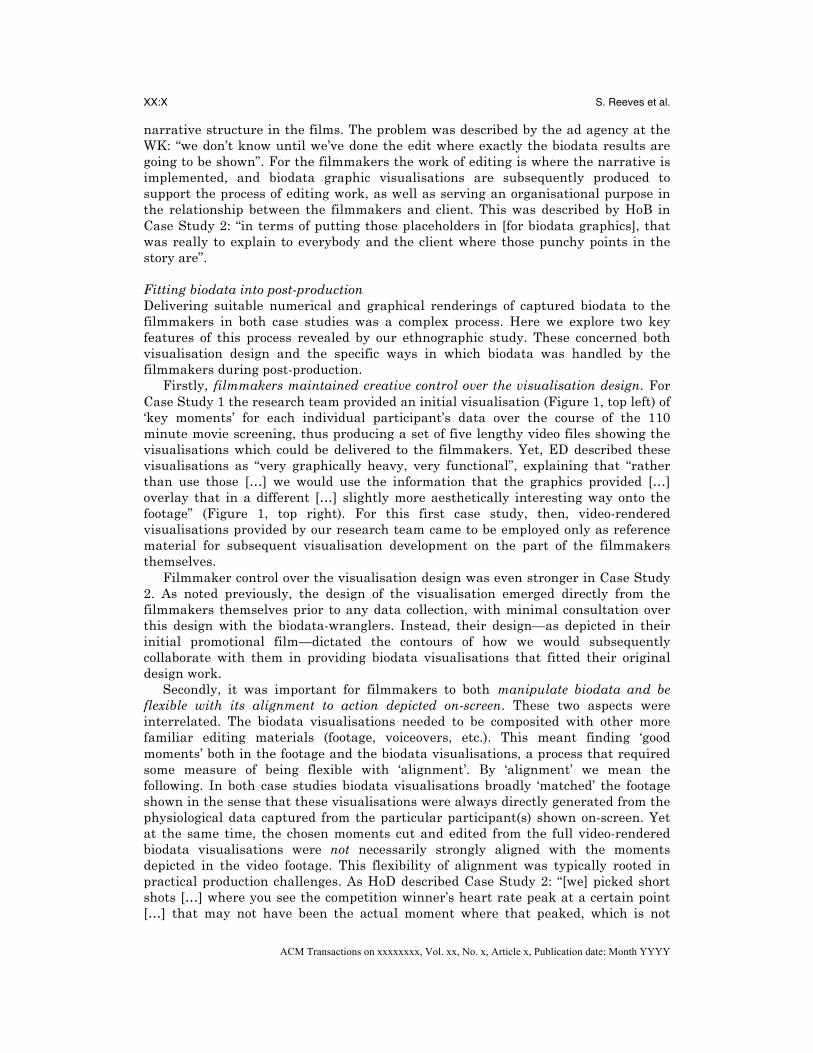
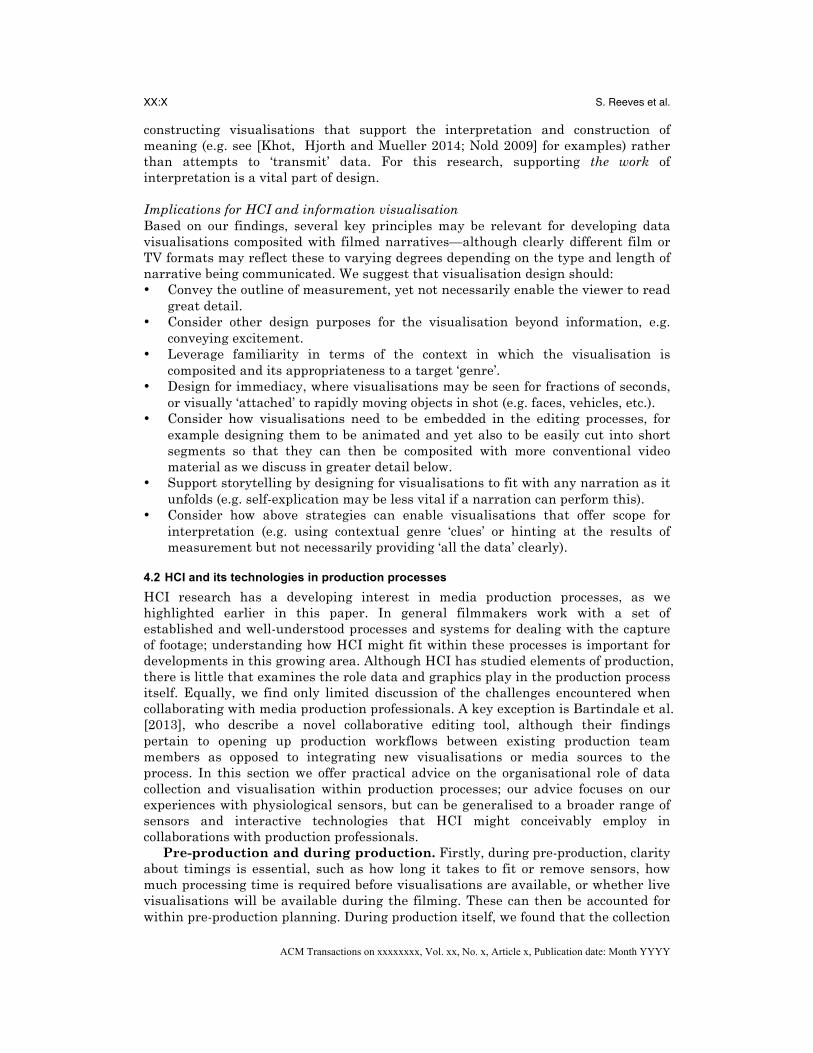
Figure 2: The timeseries visualisation delivered to the filmmakers by our research team (top left); the ‘rev-counter’ visualisation designed by the filmmakers (top right); a cropped still from the final film (bottom).
[© Nissan] Promotional film 1: Campaign introduction
Heart rate
Skin conductance
‘Thrill level’
XX:X S. Reeves et al.
ACM Transactions on xxxxxxxx, Vol. xx, No. x, Article x, Publication date: Month YYYY
As noted above, the first film served as an introduction to the series, featuring the Expert in a presenting capacity2, but with no recruited public participants. In the film, a stunt driver is shown being equipped with facial electromyography (muscle) monitors, then driving at speed around a track. The film then cuts to show a stunt performer holding onto the top of the car. During the film, a visualisation of biodata is composited into shots of the driver and the roof-top ‘passenger’ (Figure 2, bottom). These visualisations are associated with each person in shot such that they track along with the movements of the person depicted. At the end of the film, the Expert himself is also shown with a biodata visualisation during a two-wheeled driving stunt where he is a passenger.
Production. Although the participants are shown being equipped with sensors, no biodata was captured during the production of this particular film. There was little direct collaboration between the filmmakers and the biodata-wranglers at the pre-production stage for two reasons: the film was only intended by the filmmakers to promote the competition and there was a very tight production schedule that precluded the preparation time needed for technical setup. As with the Sinster example above, the first design of the biodata visualisation (Figure 2, top right) was developed independently by the filmmakers during pre-production (and then refined in post-production). The filmmakers reported that this design was inspired by the appearance of a car ‘rev-counter’, and thus was intended to be resonant with the activities depicted on-screen.
Post-production. When it came to post-production, greater interaction between the filmmakers and biodata-wranglers occurred. Although no biodata had been captured during production, the filmmakers still wished to produce this initial film with a visualisation that had a ‘realistic’ appearance. The solution that appeared to be both easy and quick to provide (two very important features for the filmmakers’ timescales) was to drive the biodata visualisation with ‘real’ physiological sensor recordings, yet using data derived from a different source. Thus, in order to generate sufficiently ‘realistic’ biodata for the purposes of the filmmakers, a member of the biodata-wranglers ‘acted out’ the recording process himself back in the lab, somewhat in the manner of a Foley artist (a sound-effects specialist who creates sounds of body movement using other materials). This was done by following a biodata ‘script’ that had been made from the film and engaging in various physical exertions which were judged to be approximations of ‘what the real biodata might look like’. From this ‘Foleyed biodata’, a series of 10 second-long video-rendered visualisations of the biodata were provided to the filmmakers in the form of timeseries line graphs (Figure 2, top left). The filmmakers then read the data from these and used it to create the graphical visualisations seen in the final film (Figure 2, top right).
2 http://www.youtube.com/watch?v=ivTP7w5bDSA
The Challenges of Using Biodata in Promotional Filmmaking XX:X
ACM Transactions on xxxxxxxx, Vol. xx, No. xx, Article xx, Publication date: Month YYYY
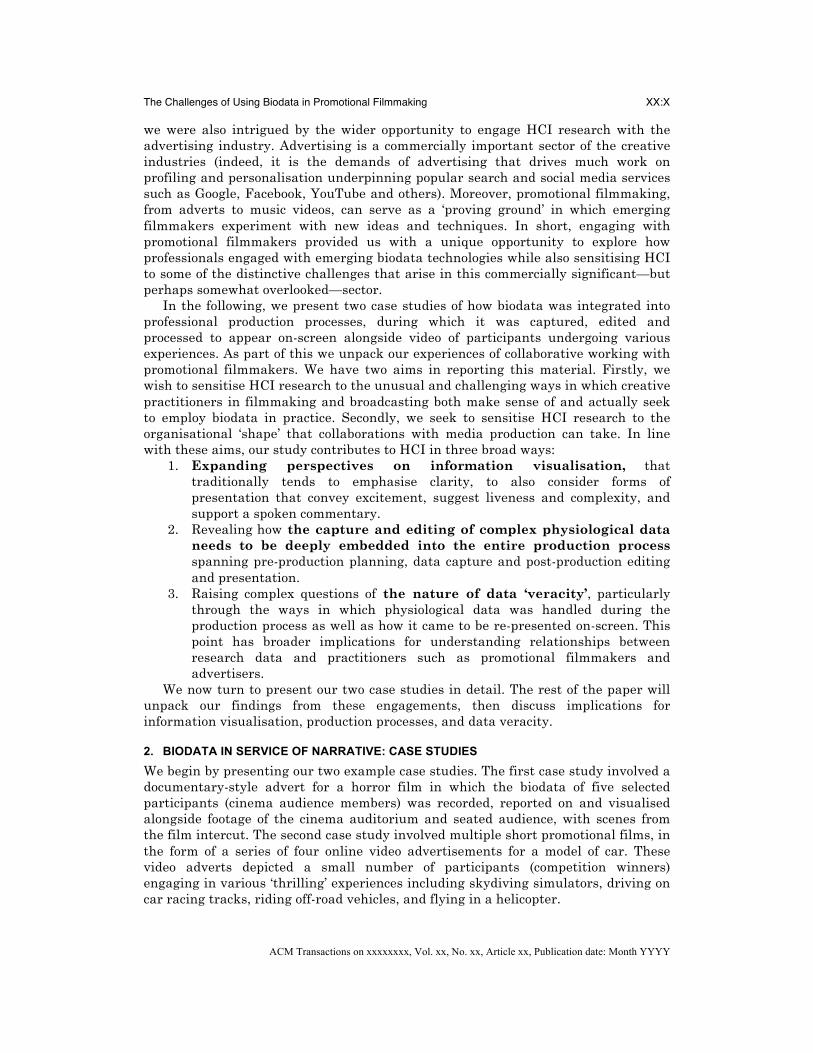
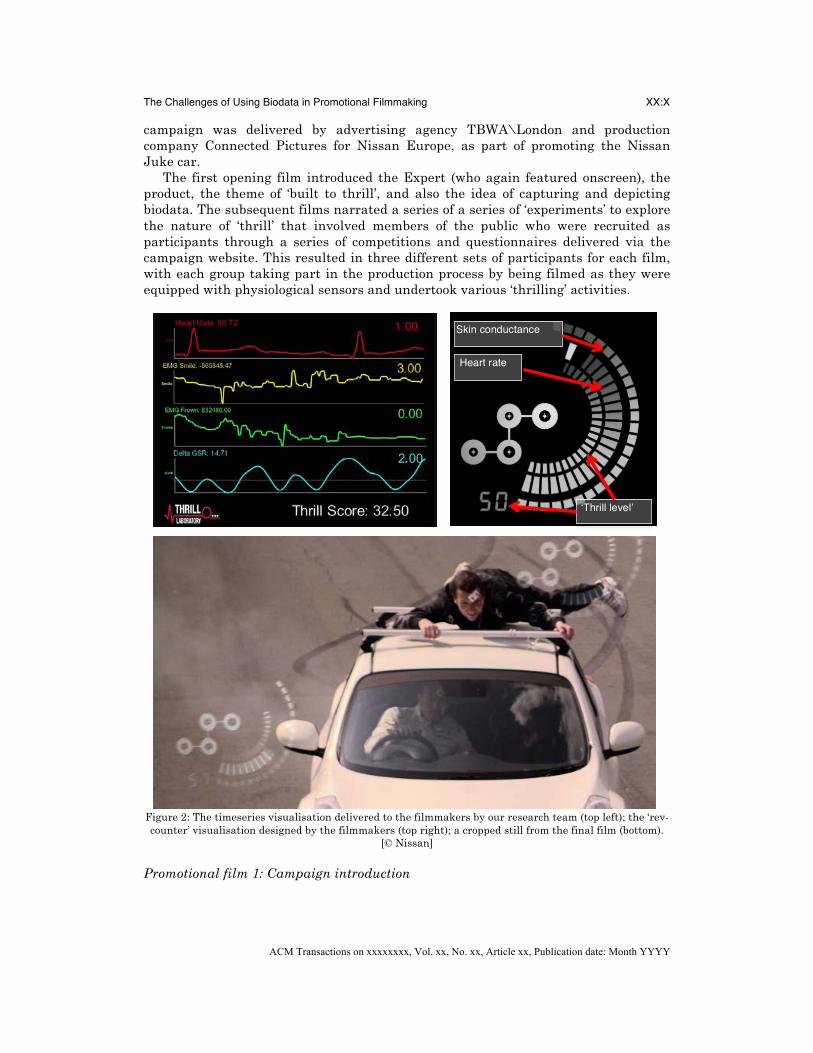
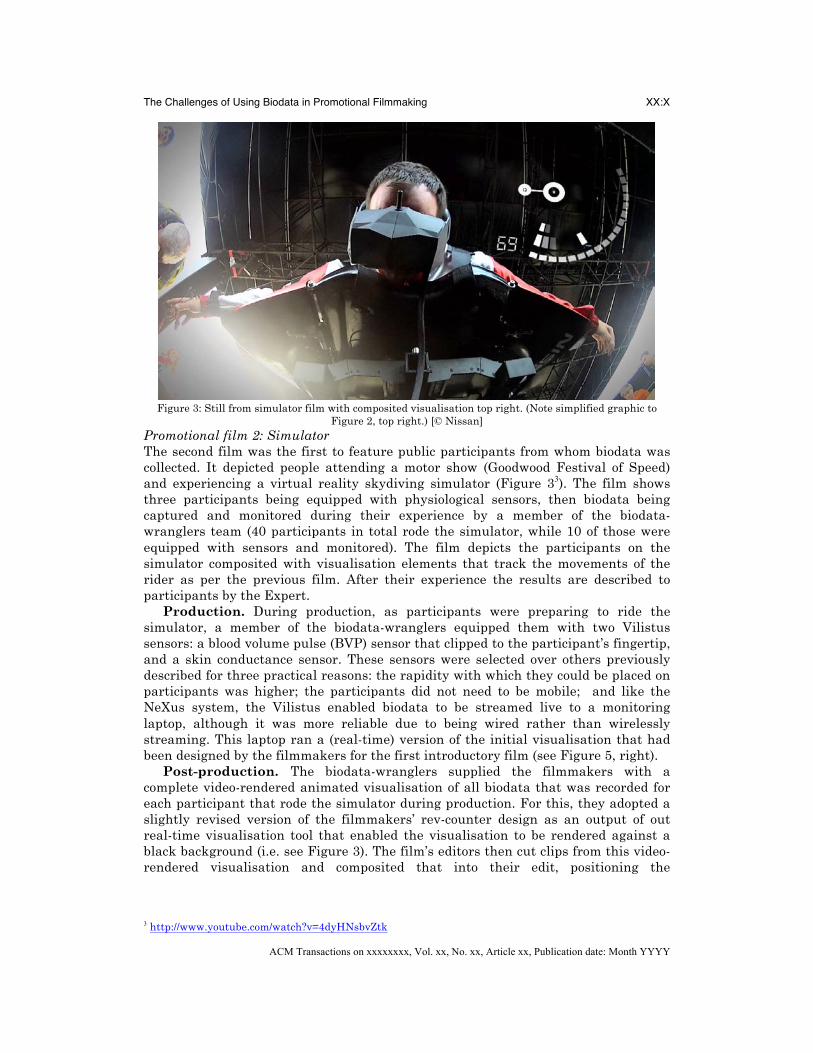
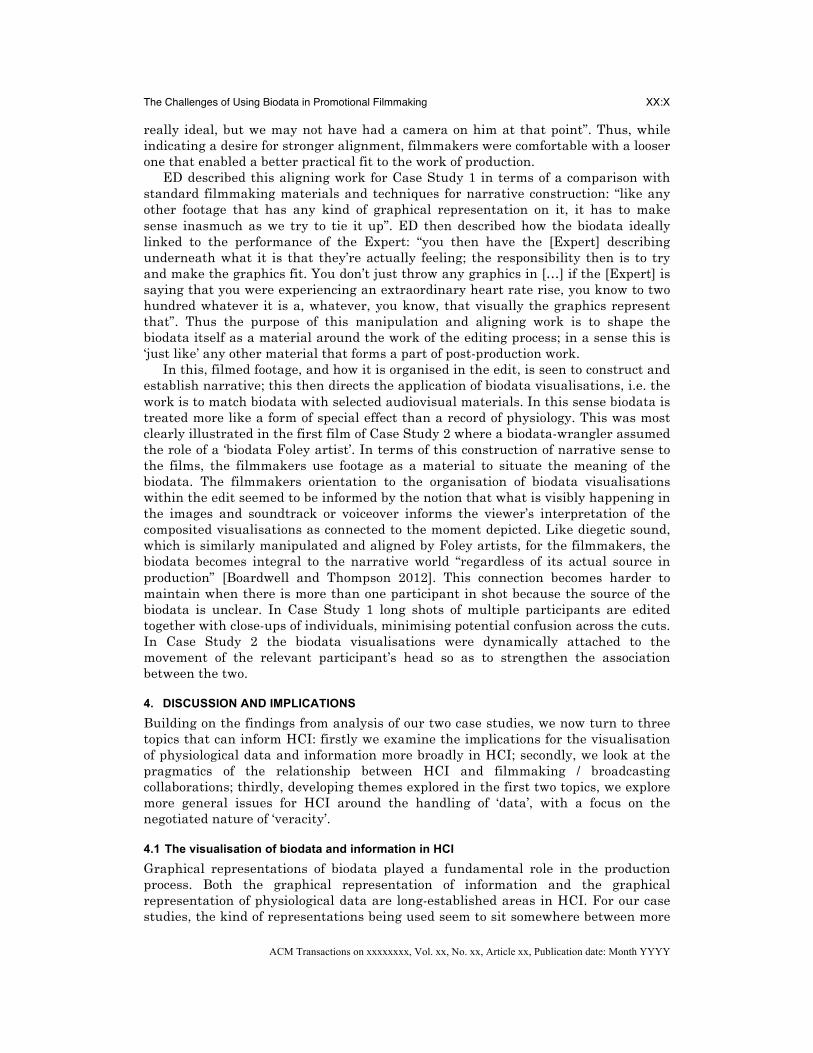
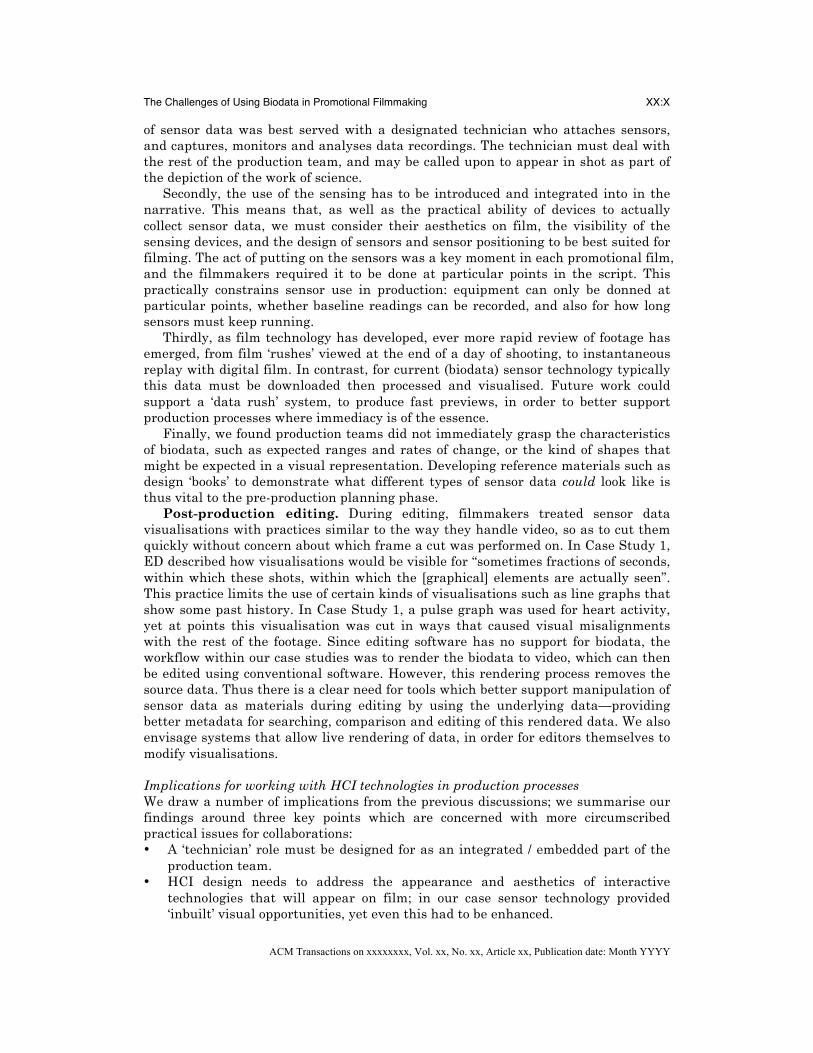
Figure 3: Still from simulator film with composited visualisation top right. (Note simplified graphic to
Figure 2, top right.) [© Nissan] Promotional film 2: Simulator The second film was the first to feature public participants from whom biodata was collected. It depicted people attending a motor show (Goodwood Festival of Speed) and experiencing a virtual reality skydiving simulator (Figure 33). The film shows three participants being equipped with physiological sensors, then biodata being captured and monitored during their experience by a member of the biodata-wranglers team (40 participants in total rode the simulator, while 10 of those were equipped with sensors and monitored). The film depicts the participants on the simulator composited with visualisation elements that track the movements of the rider as per the previous film. After their experience the results are described to participants by the Expert.
Production. During production, as participants were preparing to ride the simulator, a member of the biodata-wranglers equipped them with two Vilistus sensors: a blood volume pulse (BVP) sensor that clipped to the participant’s fingertip, and a skin conductance sensor. These sensors were selected over others previously described for three practical reasons: the rapidity with which they could be placed on participants was higher; the participants did not need to be mobile; and like the NeXus system, the Vilistus enabled biodata to be streamed live to a monitoring laptop, although it was more reliable due to being wired rather than wirelessly streaming. This laptop ran a (real-time) version of the initial visualisation that had been designed by the filmmakers for the first introductory film (see Figure 5, right).
Post-production. The biodata-wranglers supplied the filmmakers with a complete video-rendered animated visualisation of all biodata that was recorded for each participant that rode the simulator during production. For this, they adopted a slightly revised version of the filmmakers’ rev-counter design as an output of out real-time visualisation tool that enabled the visualisation to be rendered against a black background (i.e. see Figure 3). The film’s editors then cut clips from this video-rendered visualisation and composited that into their edit, positioning the
3 http://www.youtube.com/watch?v=4dyHNsbvZtk
XX:X S. Reeves et al.
ACM Transactions on xxxxxxxx, Vol. xx, No. x, Article x, Publication date: Month YYYY
visualisations as required, to arrive at the final film (Figure 3 shows a final composition with visualisations in place).
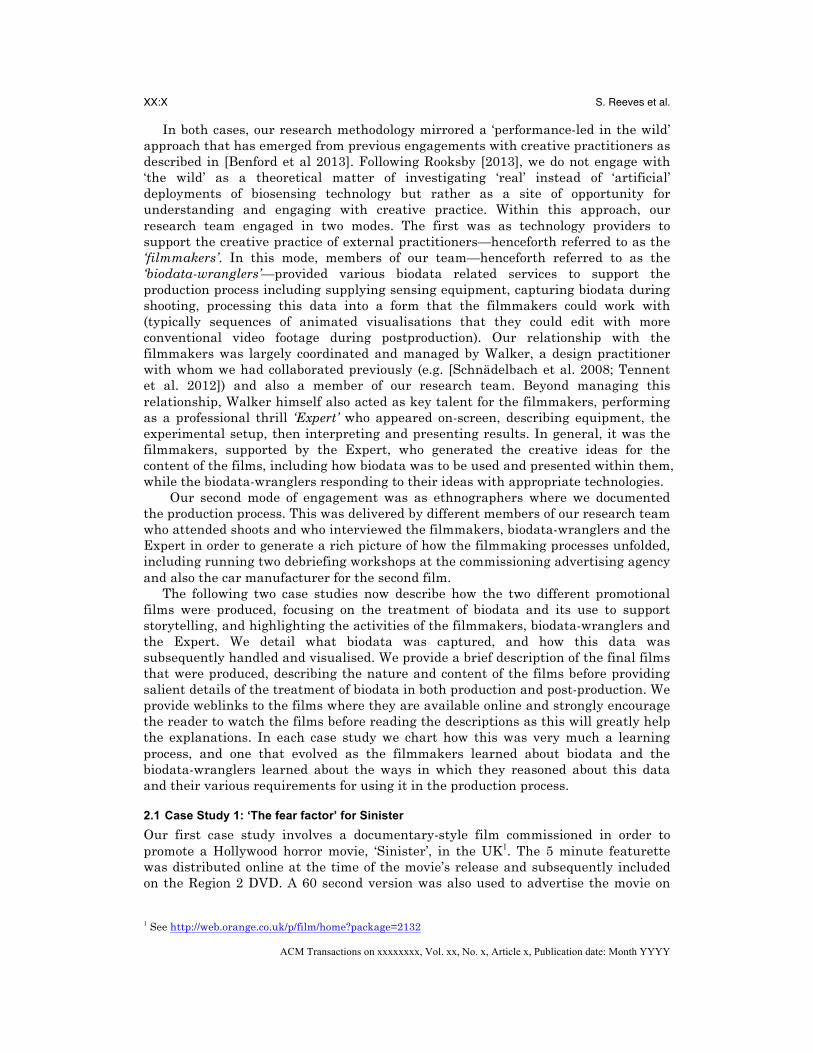
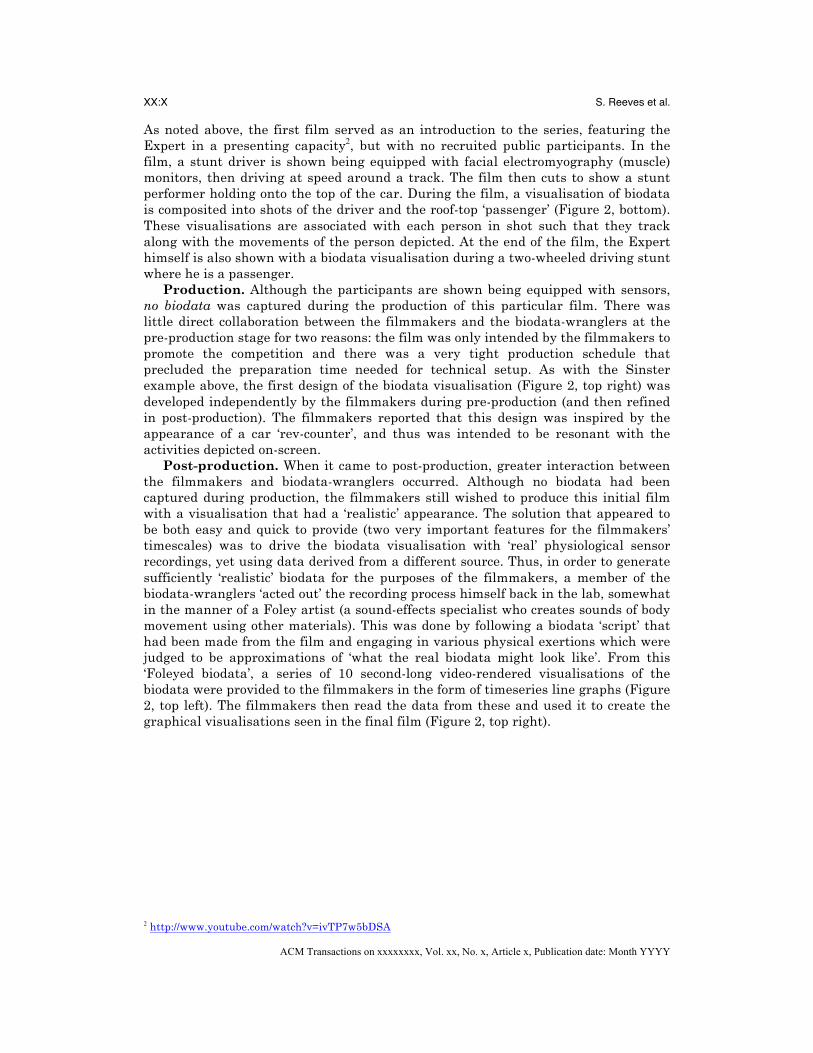
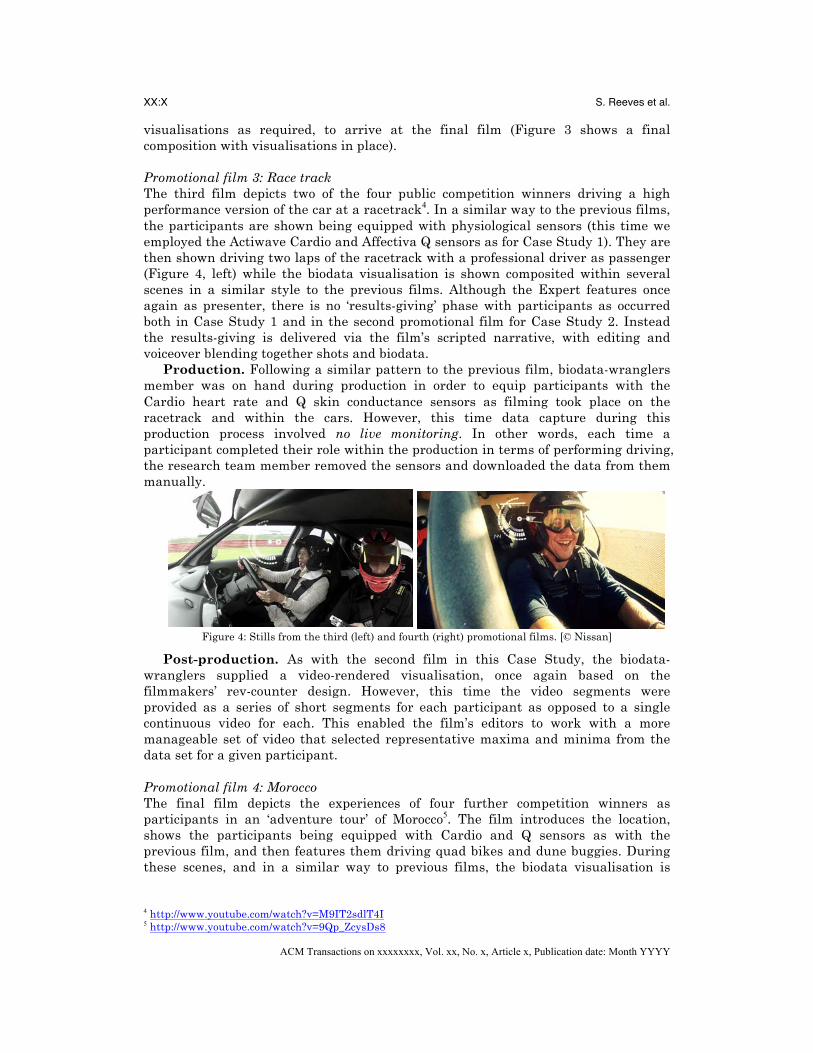
Promotional film 3: Race track The third film depicts two of the four public competition winners driving a high performance version of the car at a racetrack4. In a similar way to the previous films, the participants are shown being equipped with physiological sensors (this time we employed the Actiwave Cardio and Affectiva Q sensors as for Case Study 1). They are then shown driving two laps of the racetrack with a professional driver as passenger (Figure 4, left) while the biodata visualisation is shown composited within several scenes in a similar style to the previous films. Although the Expert features once again as presenter, there is no ‘results-giving’ phase with participants as occurred both in Case Study 1 and in the second promotional film for Case Study 2. Instead the results-giving is delivered via the film’s scripted narrative, with editing and voiceover blending together shots and biodata.
Production. Following a similar pattern to the previous film, biodata-wranglers member was on hand during production in order to equip participants with the Cardio heart rate and Q skin conductance sensors as filming took place on the racetrack and within the cars. However, this time data capture during this production process involved no live monitoring. In other words, each time a participant completed their role within the production in terms of performing driving, the research team member removed the sensors and downloaded the data from them manually.
Figure 4: Stills from the third (left) and fourth (right) promotional films. [© Nissan]
Post-production. As with the second film in this Case Study, the biodata-wranglers supplied a video-rendered visualisation, once again based on the filmmakers’ rev-counter design. However, this time the video segments were provided as a series of short segments for each participant as opposed to a single continuous video for each. This enabled the film’s editors to work with a more manageable set of video that selected representative maxima and minima from the data set for a given participant.
Promotional film 4: Morocco The final film depicts the experiences of four further competition winners as participants in an ‘adventure tour’ of Morocco5. The film introduces the location, shows the participants being equipped with Cardio and Q sensors as with the previous film, and then features them driving quad bikes and dune buggies. During these scenes, and in a similar way to previous films, the biodata visualisation is
4 http://www.youtube.com/watch?v=M9IT2sdlT4I 5 http://www.youtube.com/watch?v=9Qp_ZcysDs8
The Challenges of Using Biodata in Promotional Filmmaking XX:X
ACM Transactions on xxxxxxxx, Vol. xx, No. xx, Article xx, Publication date: Month YYYY
composited on-screen as an element that tracks with the participants when in-shot (Figure 4, right). In a final results-giving segment of the film, the Expert debriefs participants with the broad details of the recorded biodata, discussing various individual breakdowns for each participant such as heart rate peaks. During this, and similar to Case Study 1, the film cuts away to depict the relevant participant in the midst of their experience. Participants are then shown flying away in a helicopter.
Production. Throughout the production work on-location in Morocco, the participants were equipped each day with monitors for heart rate and skin conductance. As before, since these sensors did not stream data live, biodata had to be downloaded during lulls in the filming work. The biodata was initially processed in the field so as to provide results (once again, heart rate peaks, etc.) for the Expert to interpret and deliver in debrief sessions with the participants while on-location.
Post-production. Video-rendered biodata visualisations were created for each participant in the form of 30-second animated segments selected representatively (two segments per participant per day of the shoot, maxima and minima selected), once again using the rev-counter design. The film’s editors then composited these visualisations with conventional video footage (see Figure 4, right). During post-production, at the request of the filmmakers, the biodata visualisation was adapted, replacing the ‘thrill level’ aggregate score (of the kind described earlier for Sinister in Case Study 1) with a numerical indication of heart rate as explicitly discussed by the Expert in their footage (e.g. as in Figure 2, top right). One notable feature of the editing process was that the filmmakers matched up the ‘best’ moments of video footage (i.e. showing the most interesting shots of participants) with the ‘best’ biodata visualisations (i.e. featuring the highest heart rates) irrespective of whether these had strictly coincided in time during the initial capture process. As an example, Figure 4 (right) shows video of one participant composited with animated graphics that show a heart rate of 144. While a heart rate of 144 was indeed recorded for this participant and mentioned by the Expert in the footage elsewhere, it was not necessarily recorded for the participant at that particular moment shown in the video. This use of biodata reflected a more general production approach across the films, a matter that we will come to feature in our findings.
3. CASE STUDY FINDINGS We conducted ethnographic studies of the production process in order to reveal in detail how the filmmakers incorporated biodata into the film production process and how in turn, this relied on the Expert and the biodata-wranglers. We focussed in particular on the rationality of the filmmakers themselves as domain experts, exploring just how they made critical and reasoned choices that shaped the filmmaking process, especially design decisions over when to show biodata, what to show as biodata, and finally how to portray this biodata on screen.
We collected a variety of data including notes from observation work undertaken during location filming, especially for Case Study 2 (film 3), three interviews with filmmakers, a pre-production meeting, and supporting documents such as scripts and shooting schedules. We also debriefed our research team member who provided the biodata-wrangling services at all filming sites including gathering insights into his interactions with the filmakers when supplying animated visualisations during post-production. Given these materials we thus provide quite a broad-scoped ethnographic description of members’ accounts of their work practices surrounding the integration of the biodata services to the production and post-production processes. Finally, as
XX:X S. Reeves et al.
ACM Transactions on xxxxxxxx, Vol. xx, No. x, Article x, Publication date: Month YYYY
noted earlier, we staged debriefing workshops with the filmmakers in Case Study 2 during which they reflected on their use of biodata within their marketing campaign.
The following analysis of this data includes quotes from several key participants and events that are labelled throughout as follows. For Case Study 1, we conducted two interviews: with the director/producer (DP) and with the editor (ED). For Case Study 2 we captured: an interview with the ad agency’s head of broadcast (HoB); a pre-production meeting for the final film of the campaign, involving representatives of the ad agency, car manufacturer and production company (PPM); and a two hour follow-up debriefing workshop, involving representatives of the ad agency and the production company (WK).
Reflecting upon the recurrent issues arising during the collaborations, coupled with an examination of this data, our analysis reveals ways in which the filmmakers thought about, used, and were challenged by the use of biodata. We now present these under three broad, interrelated themes: 1. Reasons for using biodata, including benefits perceived by filmmakers of
capturing and displaying physiological data. 2. How biodata is integrated into narrative construction, including
audiovisual and graphical techniques employed to depict biodata within the films. 3. Using biodata in the production process, covering issues encountered on-
location and within post-production editing.
3.1 Reasons for using biodata The filmmakers were initially attracted to depicting biodata and also the work involved in its collection for a number of reasons. Broadly, these included the potential for novel ways to enhance narratives in their films, but also a desire to make an association with scientific practice.
Enhancing narrative construction in promotional filmmaking One of the key benefits reported by filmmakers was that involving biodata in production introduced potentially unexpected and surprising results that offered them the possibility of enhancing the narrative construction of their promotional films. When interviewed, DP explained for Case Study 1 how a typical narrative would be conceived and how biodata would serve to surprise within desired storytelling parameters: “if we were just making [the data] all up ourselves we would do it where you’d have sort of one big rugby playing type bloke, who loves horror films, and he would turn out to be the most frightened […] we needed to have an extra result which we weren’t expecting to see […] that was one of the reasons for doing the three different readings [i.e. heart rate, skin temperature and skin conductance], we hoped one person’s readings we could interpret as being larger than what we thought they were going to be”.
The filmmakers envisaged that the biodata would pique viewers’ curiosity and interest, coupling this with an account of the revelatory potential of biodata. At the PPM for Case Study 2, the car manufacturer marketing representative stated “I’d be interested to know what my thrill levels are like for real”, with the implication that biodata reveals information that is not otherwise available to an observer or indeed to the individual from whom it originates. Reflecting back on the films during the WK the ad agency commented on the apparently authentic reactions of competition winners when their biodata ‘results’ were revealed: “We would never have got the performance, so it wouldn’t be the same without it […] we could have faked those things; we could have put some sensors on people. We didn’t want to do that. We
The Challenges of Using Biodata in Promotional Filmmaking XX:X
ACM Transactions on xxxxxxxx, Vol. xx, No. xx, Article xx, Publication date: Month YYYY
wanted it to be credible”. This notion of credibility ties into our next topic, the depiction of and association with what filmmakers saw as ‘scientific work’.
Depiction of, and association with, scientific practice The filmmakers uniformly described a benefit in showing a (literally) visible engagement with what they saw as the practice of science. Ad agency members commented during the WK that, on presenting a concept to clients, they needed to “show that we have proper depth here? So you’re talking about ‘Built to Thrill’, we think we ought to show that we understand thrill. We found this guy [i.e. the Expert] who is the ‘Professor of Thrill’, so it would be great to link up with him”. In this respect the “proper depth” was derived from visible engagement with what they considered ‘science’ supported by the authority of accredited expertise. From their perspective the campaign represented a noteworthy commitment to ‘real’ science: “for other brands, other people, in terms of what they’re doing, you might not actually care if it looks real or not. I mean, you know, white-coated scientist on that is not science most of the time”. An important, if subtle, distinction to draw out here is that in both case studies the filmmakers were not attempting to use biodata to make direct claims about their products. The promotional films do not claim that their products deliver scientifically proven benefits or are provably better than competitors. Rather, they convey deeper, if less direct, interest in the underlying design of scary or thrilling experiences, effectively associating their brands with a scientific approach to development.
This relationship to science practice was formulated as a valuable part of the initial proposition to the clients commissioning the promotional films. For instance, DP in Case Study 1 stated that “[the trailer commissioners wanted to] bring some sort of scientific element to it”, while in Case Study 2 the car manufacturer’s marketing representative stated at the PPM “the purpose of this [campaign] for us [...] is to share that […] we are actually measuring people, we do get results and this is actually what it means”. By this account, this association benefits the clients because “to get a scientific explanation of [biodata] gives you a sense of validity, it gives you something that’s cool, something that is kind of interesting to consumers” (stated by the filmmakers at the PPM). As we will see later in this paper, establishing this “sense of validity” of the data is a key factor in the relationships between filmmakers, clients, regulators and other ad agencies.
3.2 How biodata fits into film structure In this section we explore the end product, i.e. the films themselves, leaving aside for the moment the processes followed to get there, which we consider later on. It is striking that all five films share a common narrative structure. The narrative of each broadly consists of three phases: a preparation phase that establishes the surrounding context and introduces elements of ‘biodata services’ such as sensors and initial visualisations of data; an experiment phase where an activity is engaged in that is in some way captured and shown to be captured by the biodata services; and a results phase where an interpretation of biodata is provided alongside other closing elements.
Preparation: Establishing context and displaying equipment In both case studies the various elements of ‘biodata services’ we have described, are incorporated into a complex narrative that involves a product, a promotional message about that product, a situation, and participants, in addition to the activity of data
XX:X S. Reeves et al.
ACM Transactions on xxxxxxxx, Vol. xx, No. x, Article x, Publication date: Month YYYY
collection. Consequently, biodata requires contextualisation, and is introduced as a concept using conventional audiovisual forms of communication before any data visualisations appear. This is done by means of the Expert, a specialised presenter whose role is to introduce and explain biodata in the context of the film as well as providing a proxy for the association with scientific practice. This observation is grounded in the descriptions provided by the filmmakers themselves as they offered explanations for what value they saw in the role of the Expert. For instance, in Case Study 2, at the WK, the ad agency highlighted this, saying “[the Expert] gave that authenticity massively, and it was a person speaking to a person, so you instantly got it, rather than having it as type or just data, it became very accessible very quickly”.
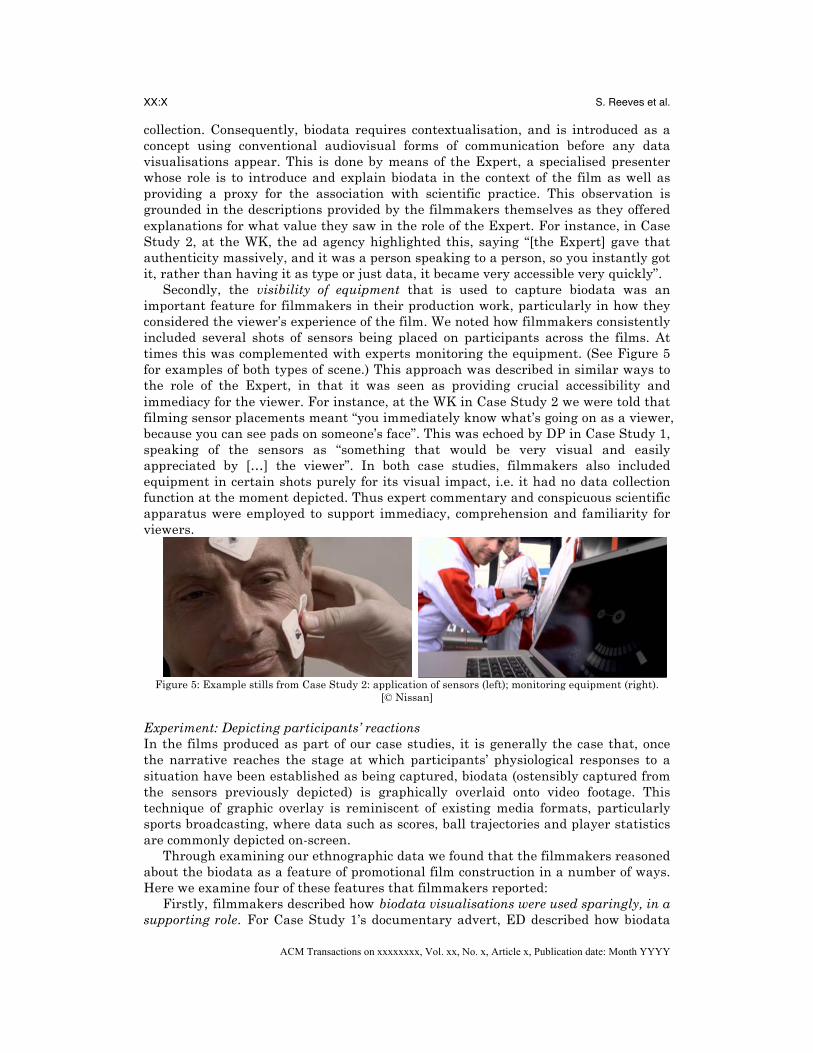
Secondly, the visibility of equipment that is used to capture biodata was an important feature for filmmakers in their production work, particularly in how they considered the viewer’s experience of the film. We noted how filmmakers consistently included several shots of sensors being placed on participants across the films. At times this was complemented with experts monitoring the equipment. (See Figure 5 for examples of both types of scene.) This approach was described in similar ways to the role of the Expert, in that it was seen as providing crucial accessibility and immediacy for the viewer. For instance, at the WK in Case Study 2 we were told that filming sensor placements meant “you immediately know what’s going on as a viewer, because you can see pads on someone’s face”. This was echoed by DP in Case Study 1, speaking of the sensors as “something that would be very visual and easily appreciated by […] the viewer”. In both case studies, filmmakers also included equipment in certain shots purely for its visual impact, i.e. it had no data collection function at the moment depicted. Thus expert commentary and conspicuous scientific apparatus were employed to support immediacy, comprehension and familiarity for viewers.
Figure 5: Example stills from Case Study 2: application of sensors (left); monitoring equipment (right).
[© Nissan]
Experiment: Depicting participants’ reactions In the films produced as part of our case studies, it is generally the case that, once the narrative reaches the stage at which participants’ physiological responses to a situation have been established as being captured, biodata (ostensibly captured from the sensors previously depicted) is graphically overlaid onto video footage. This technique of graphic overlay is reminiscent of existing media formats, particularly sports broadcasting, where data such as scores, ball trajectories and player statistics are commonly depicted on-screen.
Through examining our ethnographic data we found that the filmmakers reasoned about the biodata as a feature of promotional film construction in a number of ways. Here we examine four of these features that filmmakers reported:
Firstly, filmmakers described how biodata visualisations were used sparingly, in a supporting role. For Case Study 1’s documentary advert, ED described how biodata
The Challenges of Using Biodata in Promotional Filmmaking XX:X
ACM Transactions on xxxxxxxx, Vol. xx, No. xx, Article xx, Publication date: Month YYYY
visualisations were cut into the edit sometimes only for “fractions of seconds”. Within the genre of promotional filmmaking we were providing biodata services for, much of this relates to the constraints of telling a story in a short time (i.e. between 60 seconds and 5 minutes). DP pointed out that there wasn’t “a lot of time for people to really go into huge amounts of detail [on the biodata] […] they just want to see something has happened and a good visual representation of that”. Showing that “something has happened” is also bound up with the filmmakers’ practices of using graphics; i.e. that data visualisations do not function as standalone entities but are used to augment filmed audiovisual (primary) material. Interviewed on the use of biodata graphics in Case Study 2, HoB pointed to this augmenting, supportive role of biodata services’ inclusion in the films: “you do it visually, and you do it quickly and audibly, as well; yes, because they work hand in hand”. HoB also explained that overlaid graphical visualisations represented better integration of the biodata into the narrative sense of the films: he stated, “we wanted something that was embedded in the film, not like a separate cutaway […] because it didn’t feel like it was part of the action”.
Secondly, filmmakers in both case studies considered visualisations of biodata to form a rapid method for providing a visual account for the viewer of ‘doing measurement’. In Case Study 2, the filmmakers pointed out at the WK that “all [the graphical biodata representations] delivered was the fact that we were measuring, and in some way related to how exciting it was in general terms”. The imperative for them was that the graphics had “got to feel scientific, cool and be simple”. It is notable that in both case studies the visualisations themselves are never directly acknowledged, referred to, or explicated by the Expert. This approach to the graphic information prioritised the visual appearance of measurement over transmission of biodata results—for this is delivered verbally by the Expert.
Thirdly, when depicting participant reactions the filmmakers tended to rely on casting biodata into (what they considered to be) familiar graphical representations. For instance, the graphic used for Case Study 1 (Figure 1, top right) includes a moving heart trace (sometimes highlighted in red), about which DP explained, “we thought heart monitors would be a great one because obviously they’re going to be a quite good visual representation of something increasing, we needed something that people could just see and get the information from very, very quickly”. ED referred to “the beeping of the heart rate monitor and […] numbers moving”, pointing out “it’s a familiar image I guess […] people will know even if you didn’t explain what it was, I think people would understand what you were trying to express if they just saw that image”. This interpretability functions within the context of the sense established by the film, i.e. higher numbers means ‘greater fear’ in this instance. Similar views were held for Case Study 2’s rev-counter style visualisation (Figure 2, top right), underlined by a close-up shot of a rev-counter in the first film as a visual reference point. When discussing the ‘look and feel’ of the biodata visualisation’s development, HoD explained “it just felt quite an energetic and fun way to do it […] you read it quite quick; it’s got to be quite clear”.
Finally, the filmmakers’ intentions over the meaning of the biodata graphics take advantage of context within the film. When the graphics appear on-screen the narrative implication obvious to the filmmakers is that the graphics are tied to the moment depicted in the footage, and that viewers will have a similar interpretation. “The audience have to feel like it’s real time” is the way that this effect was described at the PPM for Case Study 2. This connection is made because the idea and mechanics of biodata have been introduced earlier in each film’s structure. In this
XX:X S. Reeves et al.
ACM Transactions on xxxxxxxx, Vol. xx, No. x, Article x, Publication date: Month YYYY
sense the biodata visualisations share some similarities with ‘diegetic’ audio, in that they could be perceived to be “issuing from the story space”, like sound that has its source in the world of a film [Bordwell and Thompson 2012]. Instead of communicating in-depth data as we might expect from more regular forms of information visualisation, the graphic visualisations of biodata were instead reported by filmmakers as primarily offering elements they saw as creating excitement, liveness and immediacy rather than the efficient delivery of detailed information.
Results: Revisiting and evaluating the experience The final phase of the common narrative involves the Expert delivering ‘results’ in some way to participants. Firstly we note that the way in which these results were presented was an important consideration for the filmmakers. For Case Study 2, at the WK the ad agency pointed to their care in calibrating how biodata was presented to intended viewers, particularly noting how viewer interest in and understanding of biodata impacted how they as filmmakers treated this data. For instance when considering the complexity of information being presented and the requirements to do more work explaining it, ad agency members set up a contrast: “Formula 1: that’s an absolute petrol-head audience. They love that kind of stuff. Take someone who is not interested in cars, has no interest in any of that stuff; they will look at that data and go I don’t know what the hell it’s telling me and what the hell is it doing on my screen”.
The filmmakers also described how they handled different materials for the films in ways that prioritised some over others, leading to an ordering to treatments of biodata where audiovisual material was prioritised over visualisations. For instance, scenes featuring the Expert and participants depicted in the films had priority over visual representations of biodata: on this point the ad agency indicated how the promotional films in Case Study 2 were “a visual story not because of what the data is doing, but what the people are saying in the film”. At the same time, verbal accounts of the biodata delivered by the Expert to participants during the results-giving phases in the promotional films were often intercut with flashbacks depicting participants’ reactions during the experience and graphic visualisations of biodata. Thus, in spite of the intentional simplicity and familiarity of the biodata visualisations, the use of biodata results was recognised by filmmakers as not necessarily self-evident or easily intelligible for viewers without also providing verbal presentation by the Expert alongside this.
3.3 Using biodata in the production process As we have seen, the films featured biodata and its supporting technologies in various ways including shots of physiological sensors being attached to participants, showing the ongoing monitoring of biodata collection, graphic visualisations of biodata overlaid on shots of participants during ‘experiments’, and finally verbal interpretations of biodata recordings. In this section we explore the production process itself, focussing on how it was conducted so as to integrate these different elements into the films. We unpack the various issues and challenges that were encountered by the filmmakers, Expert and biodata-wranglers when working together during the two case studies. In particular we examine how biodata featured in three areas: matters of regulation; production planning work; and post-production processes such as film editing.
Regulation and the use of data on-screen
The Challenges of Using Biodata in Promotional Filmmaking XX:X
ACM Transactions on xxxxxxxx, Vol. xx, No. xx, Article xx, Publication date: Month YYYY
Advertising in the UK is regulated. While much of the preparatory work for both case studies involved ‘typical’ production planning concerns of scripting, logistics, project management and so forth, biodata also needed to be integrated into standard procedures of gaining regulatory clearance. In both cases filmmakers had to seek approval from Clearcast (a UK advertising regulator). We found that the role of the Expert and the desired association with scientific work came into play once again. As Case Study 1’s DP stated, the introduction of biodata services had implications for this process of gaining regulatory clearance: “we knew that everything we did had to have [the Expert’s] backing […] because Clearcast would ask us, and did ask us, ‘how can you say all this?’”. The broad issue here is that the biodata itself as a material that is handled during production is not and cannot stand alone or be abstracted from the relationship it holds to the processes of production themselves if it is to be seen as legitimate in the relationship between advertiser and regulator. In Case Study 1, for the filmmakers, the biodata is seen to be legitimated by the designated Expert. In the other films of Case Study 2, the bare fact of physiological monitoring taking place (separate from how it was ‘shown’) helped legitimate the biodata as well. In these ways the filmmakers established a sense of regulatory accountability regarding the data for both case studies. Planning for biodata in production processes The filmmakers had to consider various practicalities of working with biodata when shooting the films on-location. At the PPM in Case Study 2, filmmakers discussed prospective filming considerations for the upcoming shoot in Morocco: “we will have [the biodata visualisation] in mind [...] with shots throughout the time. Like, for example, the shots of filming the [participants] driving, we’ll have to make sure we have space compositionally to allow for graphics”. Thus, like any other graphic, the filmmakers shot a range of suitable footage anticipating post-production insertion, in this particular case deliberately framing video footage to allow for space on screen to overlay biodata visualisations later on.
However, speaking at the WK, filmmakers also underlined the prioritisation that comes with the inclusion of biodata services (“our first aim for us is the shoot”), underlining our prior point in this paper about the ordering and prioritisation of different production materials. This is more so the case for production timescales that are often very restrictive, and particularly for shorter schedules associated with promotional filmmaking. As such, explicit budgeting of the biodata capture and processing tasks were seen as important by filmmakers, noting during the WK “it’s almost like adding on shoot time and shoot days even in order to incorporate [biodata capture]”. Yet, tension around these additional time requirements of biodata services arose due to the nature of post-production deadlines too; it was felt by the filmmakers in Case Study 2 that including biodata services “does hold up the process” and that “if it’s not important that the results are 100% right for the film, then you can’t really hold up with [biodata processing]”. This means that the materials and processes involved in the capture and visualisation of biodata itself must be made to fit the practicalities of production rather than vice versa.
Thus, the very thing we have seen valued by the filmmakers in both case studies—i.e. the uncertainty introduced by biodata capture and results-giving as well as the revelatory power ascribed to it by filmmakers—also presents them with a thoroughly practical problem when it comes to post-production and constructing a
XX:X S. Reeves et al.
ACM Transactions on xxxxxxxx, Vol. xx, No. x, Article x, Publication date: Month YYYY
narrative structure in the films. The problem was described by the ad agency at the WK: “we don’t know until we’ve done the edit where exactly the biodata results are going to be shown”. For the filmmakers the work of editing is where the narrative is implemented, and biodata graphic visualisations are subsequently produced to support the process of editing work, as well as serving an organisational purpose in the relationship between the filmmakers and client. This was described by HoB in Case Study 2: “in terms of putting those placeholders in [for biodata graphics], that was really to explain to everybody and the client where those punchy points in the story are”.
Fitting biodata into post-production Delivering suitable numerical and graphical renderings of captured biodata to the filmmakers in both case studies was a complex process. Here we explore two key features of this process revealed by our ethnographic study. These concerned both visualisation design and the specific ways in which biodata was handled by the filmmakers during post-production.
Firstly, filmmakers maintained creative control over the visualisation design. For Case Study 1 the research team provided an initial visualisation (Figure 1, top left) of ‘key moments’ for each individual participant’s data over the course of the 110 minute movie screening, thus producing a set of five lengthy video files showing the visualisations which could be delivered to the filmmakers. Yet, ED described these visualisations as “very graphically heavy, very functional”, explaining that “rather than use those […] we would use the information that the graphics provided […] overlay that in a different […] slightly more aesthetically interesting way onto the footage” (Figure 1, top right). For this first case study, then, video-rendered visualisations provided by our research team came to be employed only as reference material for subsequent visualisation development on the part of the filmmakers themselves.
Filmmaker control over the visualisation design was even stronger in Case Study 2. As noted previously, the design of the visualisation emerged directly from the filmmakers themselves prior to any data collection, with minimal consultation over this design with the biodata-wranglers. Instead, their design—as depicted in their initial promotional film—dictated the contours of how we would subsequently collaborate with them in providing biodata visualisations that fitted their original design work.
Secondly, it was important for filmmakers to both manipulate biodata and be flexible with its alignment to action depicted on-screen. These two aspects were interrelated. The biodata visualisations needed to be composited with other more familiar editing materials (footage, voiceovers, etc.). This meant finding ‘good moments’ both in the footage and the biodata visualisations, a process that required some measure of being flexible with ‘alignment’. By ‘alignment’ we mean the following. In both case studies biodata visualisations broadly ‘matched’ the footage shown in the sense that these visualisations were always directly generated from the physiological data captured from the particular participant(s) shown on-screen. Yet at the same time, the chosen moments cut and edited from the full video-rendered biodata visualisations were not necessarily strongly aligned with the moments depicted in the video footage. This flexibility of alignment was typically rooted in practical production challenges. As HoD described Case Study 2: “[we] picked short shots […] where you see the competition winner’s heart rate peak at a certain point […] that may not have been the actual moment where that peaked, which is not
The Challenges of Using Biodata in Promotional Filmmaking XX:X
ACM Transactions on xxxxxxxx, Vol. xx, No. xx, Article xx, Publication date: Month YYYY
really ideal, but we may not have had a camera on him at that point”. Thus, while indicating a desire for stronger alignment, filmmakers were comfortable with a looser one that enabled a better practical fit to the work of production.
ED described this aligning work for Case Study 1 in terms of a comparison with standard filmmaking materials and techniques for narrative construction: “like any other footage that has any kind of graphical representation on it, it has to make sense inasmuch as we try to tie it up”. ED then described how the biodata ideally linked to the performance of the Expert: “you then have the [Expert] describing underneath what it is that they’re actually feeling; the responsibility then is to try and make the graphics fit. You don’t just throw any graphics in […] if the [Expert] is saying that you were experiencing an extraordinary heart rate rise, you know to two hundred whatever it is a, whatever, you know, that visually the graphics represent that”. Thus the purpose of this manipulation and aligning work is to shape the biodata itself as a material around the work of the editing process; in a sense this is ‘just like’ any other material that forms a part of post-production work.
In this, filmed footage, and how it is organised in the edit, is seen to construct and establish narrative; this then directs the application of biodata visualisations, i.e. the work is to match biodata with selected audiovisual materials. In this sense biodata is treated more like a form of special effect than a record of physiology. This was most clearly illustrated in the first film of Case Study 2 where a biodata-wrangler assumed the role of a ‘biodata Foley artist’. In terms of this construction of narrative sense to the films, the filmmakers use footage as a material to situate the meaning of the biodata. The filmmakers orientation to the organisation of biodata visualisations within the edit seemed to be informed by the notion that what is visibly happening in the images and soundtrack or voiceover informs the viewer’s interpretation of the composited visualisations as connected to the moment depicted. Like diegetic sound, which is similarly manipulated and aligned by Foley artists, for the filmmakers, the biodata becomes integral to the narrative world “regardless of its actual source in production” [Boardwell and Thompson 2012]. This connection becomes harder to maintain when there is more than one participant in shot because the source of the biodata is unclear. In Case Study 1 long shots of multiple participants are edited together with close-ups of individuals, minimising potential confusion across the cuts. In Case Study 2 the biodata visualisations were dynamically attached to the movement of the relevant participant’s head so as to strengthen the association between the two.
4. DISCUSSION AND IMPLICATIONS Building on the findings from analysis of our two case studies, we now turn to three topics that can inform HCI: firstly we examine the implications for the visualisation of physiological data and information more broadly in HCI; secondly, we look at the pragmatics of the relationship between HCI and filmmaking / broadcasting collaborations; thirdly, developing themes explored in the first two topics, we explore more general issues for HCI around the handling of ‘data’, with a focus on the negotiated nature of ‘veracity’.
4.1 The visualisation of biodata and information in HCI Graphical representations of biodata played a fundamental role in the production process. Both the graphical representation of information and the graphical representation of physiological data are long-established areas in HCI. For our case studies, the kind of representations being used seem to sit somewhere between more
XX:X S. Reeves et al.
ACM Transactions on xxxxxxxx, Vol. xx, No. x, Article x, Publication date: Month YYYY
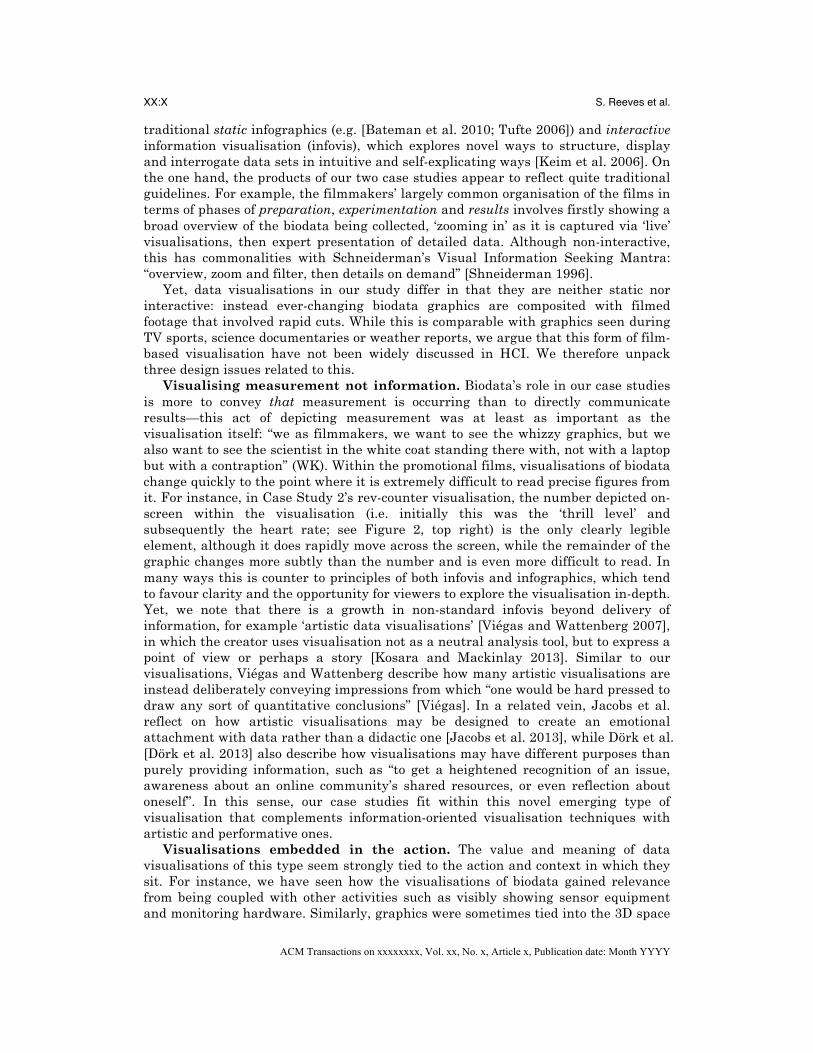
traditional static infographics (e.g. [Bateman et al. 2010; Tufte 2006]) and interactive information visualisation (infovis), which explores novel ways to structure, display and interrogate data sets in intuitive and self-explicating ways [Keim et al. 2006]. On the one hand, the products of our two case studies appear to reflect quite traditional guidelines. For example, the filmmakers’ largely common organisation of the films in terms of phases of preparation, experimentation and results involves firstly showing a broad overview of the biodata being collected, ‘zooming in’ as it is captured via ‘live’ visualisations, then expert presentation of detailed data. Although non-interactive, this has commonalities with Schneiderman’s Visual Information Seeking Mantra: “overview, zoom and filter, then details on demand” [Shneiderman 1996].
Yet, data visualisations in our study differ in that they are neither static nor interactive: instead ever-changing biodata graphics are composited with filmed footage that involved rapid cuts. While this is comparable with graphics seen during TV sports, science documentaries or weather reports, we argue that this form of film-based visualisation have not been widely discussed in HCI. We therefore unpack three design issues related to this.
Visualising measurement not information. Biodata’s role in our case studies is more to convey that measurement is occurring than to directly communicate results—this act of depicting measurement was at least as important as the visualisation itself: “we as filmmakers, we want to see the whizzy graphics, but we also want to see the scientist in the white coat standing there with, not with a laptop but with a contraption” (WK). Within the promotional films, visualisations of biodata change quickly to the point where it is extremely difficult to read precise figures from it. For instance, in Case Study 2’s rev-counter visualisation, the number depicted on-screen within the visualisation (i.e. initially this was the ‘thrill level’ and subsequently the heart rate; see Figure 2, top right) is the only clearly legible element, although it does rapidly move across the screen, while the remainder of the graphic changes more subtly than the number and is even more difficult to read. In many ways this is counter to principles of both infovis and infographics, which tend to favour clarity and the opportunity for viewers to explore the visualisation in-depth. Yet, we note that there is a growth in non-standard infovis beyond delivery of information, for example ‘artistic data visualisations’ [Viégas and Wattenberg 2007], in which the creator uses visualisation not as a neutral analysis tool, but to express a point of view or perhaps a story [Kosara and Mackinlay 2013]. Similar to our visualisations, Viégas and Wattenberg describe how many artistic visualisations are instead deliberately conveying impressions from which “one would be hard pressed to draw any sort of quantitative conclusions” [Viégas]. In a related vein, Jacobs et al. reflect on how artistic visualisations may be designed to create an emotional attachment with data rather than a didactic one [Jacobs et al. 2013], while Dörk et al. [Dörk et al. 2013] also describe how visualisations may have different purposes than purely providing information, such as “to get a heightened recognition of an issue, awareness about an online community’s shared resources, or even reflection about oneself”. In this sense, our case studies fit within this novel emerging type of visualisation that complements information-oriented visualisation techniques with artistic and performative ones.
Visualisations embedded in the action. The value and meaning of data visualisations of this type seem strongly tied to the action and context in which they sit. For instance, we have seen how the visualisations of biodata gained relevance from being coupled with other activities such as visibly showing sensor equipment and monitoring hardware. Similarly, graphics were sometimes tied into the 3D space
The Challenges of Using Biodata in Promotional Filmmaking XX:X
ACM Transactions on xxxxxxxx, Vol. xx, No. xx, Article xx, Publication date: Month YYYY
of the film footage. We saw how filmmakers desired to embed visualisations in the action as much as they could, rather than thinking of them as separate cutaways. This leads us to the next point.
Visualisations and narratives. A crucial feature of all production work (including pre- and post-production) was the importance to the filmmakers of constructing a narrative trajectory within the films. The filmmakers made decisions precisely when and how to fit the visualisation into the edit to maximise dramatic impact, and attempted to link the designed visualisation (i.e. medical-style display; a rev-counter) and the action taking place (i.e. ‘monitoring’ the cinema audience as part of an experiment; driving). As such, visualisations must be seen in terms of providing support to, and forming part of, the filmmakers’ work of constructing a narrative in the films (in some ways similar to Lengler et al.’s [Lengler et al. 2009] description of the use of infographic animations supporting a wider presentation of an argument). Firstly, the design of the visualisation must reflect the content of that narrative. As Bateman et al. [Bateman et al. 2010] describe, what might be labelled as ‘embellishment’ can actually serve a positive purpose, in our case supporting the story by showing ‘liveness’. This was conveyed in Case Study 2 through the rev-counter design. Secondly, visualisation design must support being ‘spoken to’ in the sense that narrators may explain the visualisation or the visualisation may just support what the narrator is saying.
Visualisations for interpretation. Our studies develop an interpretivist view of affect and the representation of it. From the perspective of the filmmakers, in order for biodata to be integrated into the narrative it needs to be interpretable, i.e. the filmmakers did not conceive of biodata as having immanent meaning (i.e. it cannot ‘speak for itself’). Instead, viewers have to come (or be helped) to develop their own interpretation of its significance. We have seen how biodata is considered by filmmakers in just these sorts of ways; indeed, we note that filmmakers are explicitly reflexive about their treatment of this data. Biodata—as an affective media—is employed by filmmakers as experiential rather than as a directly informative, stateful representation of the body. Instead, biodata’s value is deployed by filmmakers as empathetic connection between viewer and onscreen actant, and also between onscreen action and reaction. For instance, filmmakers argued their position from the perspective of the audience frequently: “if you create [the film] in such a way that you [the audience] kind of go, ‘well, actually, that looks like you could do that’, ‘well that is definitely how I was reading it’, then it becomes interesting for the viewer” (WK). That is, filmmakers opened up a space for audience interpretation through various tactics: depicting the act of measurement, anchoring and embedding the visualisation into video footage in particular ways, and tying the biodata to narrative construction considerations of the film.
Visualising for interpretation also builds on prior discussions in HCI. While both information visualisation approaches in HCI and uses of physiological data tend to take an information-giving, rationalised perspective on the meaning and representation of that data, some in HCI have begun to question this the application of this perspective particularly for ways of understanding affect [Boehner et al. 2007] and physical wellbeing [Purpura et al. 2011]. Accordingly, there is a range of work that explores alternative ways to visualise affective data—which sometimes includes, although is not limited to, physiologically-derived data. This has a variety of applications, from personal communication [Ståhl, Sundström and Höök 2005] to self-reflective tools for wellbeing [Höök 2008] to healthcare systems [Consolvo et al. 2009; Mulvenna et al. 2011]. A key strategy in this body of work is the role of
XX:X S. Reeves et al.
ACM Transactions on xxxxxxxx, Vol. xx, No. x, Article x, Publication date: Month YYYY
constructing visualisations that support the interpretation and construction of meaning (e.g. see [Khot, Hjorth and Mueller 2014; Nold 2009] for examples) rather than attempts to ‘transmit’ data. For this research, supporting the work of interpretation is a vital part of design.
Implications for HCI and information visualisation Based on our findings, several key principles may be relevant for developing data visualisations composited with filmed narratives—although clearly different film or TV formats may reflect these to varying degrees depending on the type and length of narrative being communicated. We suggest that visualisation design should: • Convey the outline of measurement, yet not necessarily enable the viewer to read
great detail. • Consider other design purposes for the visualisation beyond information, e.g.
conveying excitement. • Leverage familiarity in terms of the context in which the visualisation is
composited and its appropriateness to a target ‘genre’. • Design for immediacy, where visualisations may be seen for fractions of seconds,
or visually ‘attached’ to rapidly moving objects in shot (e.g. faces, vehicles, etc.). • Consider how visualisations need to be embedded in the editing processes, for
example designing them to be animated and yet also to be easily cut into short segments so that they can then be composited with more conventional video material as we discuss in greater detail below.
• Support storytelling by designing for visualisations to fit with any narration as it unfolds (e.g. self-explication may be less vital if a narration can perform this).
• Consider how above strategies can enable visualisations that offer scope for interpretation (e.g. using contextual genre ‘clues’ or hinting at the results of measurement but not necessarily providing ‘all the data’ clearly).
4.2 HCI and its technologies in production processes HCI research has a developing interest in media production processes, as we highlighted earlier in this paper. In general filmmakers work with a set of established and well-understood processes and systems for dealing with the capture of footage; understanding how HCI might fit within these processes is important for developments in this growing area. Although HCI has studied elements of production, there is little that examines the role data and graphics play in the production process itself. Equally, we find only limited discussion of the challenges encountered when collaborating with media production professionals. A key exception is Bartindale et al. [2013], who describe a novel collaborative editing tool, although their findings pertain to opening up production workflows between existing production team members as opposed to integrating new visualisations or media sources to the process. In this section we offer practical advice on the organisational role of data collection and visualisation within production processes; our advice focuses on our experiences with physiological sensors, but can be generalised to a broader range of sensors and interactive technologies that HCI might conceivably employ in collaborations with production professionals.
Pre-production and during production. Firstly, during pre-production, clarity about timings is essential, such as how long it takes to fit or remove sensors, how much processing time is required before visualisations are available, or whether live visualisations will be available during the filming. These can then be accounted for within pre-production planning. During production itself, we found that the collection
The Challenges of Using Biodata in Promotional Filmmaking XX:X
ACM Transactions on xxxxxxxx, Vol. xx, No. xx, Article xx, Publication date: Month YYYY
of sensor data was best served with a designated technician who attaches sensors, and captures, monitors and analyses data recordings. The technician must deal with the rest of the production team, and may be called upon to appear in shot as part of the depiction of the work of science.
Secondly, the use of the sensing has to be introduced and integrated into in the narrative. This means that, as well as the practical ability of devices to actually collect sensor data, we must consider their aesthetics on film, the visibility of the sensing devices, and the design of sensors and sensor positioning to be best suited for filming. The act of putting on the sensors was a key moment in each promotional film, and the filmmakers required it to be done at particular points in the script. This practically constrains sensor use in production: equipment can only be donned at particular points, whether baseline readings can be recorded, and also for how long sensors must keep running.
Thirdly, as film technology has developed, ever more rapid review of footage has emerged, from film ‘rushes’ viewed at the end of a day of shooting, to instantaneous replay with digital film. In contrast, for current (biodata) sensor technology typically this data must be downloaded then processed and visualised. Future work could support a ‘data rush’ system, to produce fast previews, in order to better support production processes where immediacy is of the essence.
Finally, we found production teams did not immediately grasp the characteristics of biodata, such as expected ranges and rates of change, or the kind of shapes that might be expected in a visual representation. Developing reference materials such as design ‘books’ to demonstrate what different types of sensor data could look like is thus vital to the pre-production planning phase.
Post-production editing. During editing, filmmakers treated sensor data visualisations with practices similar to the way they handle video, so as to cut them quickly without concern about which frame a cut was performed on. In Case Study 1, ED described how visualisations would be visible for “sometimes fractions of seconds, within which these shots, within which the [graphical] elements are actually seen”. This practice limits the use of certain kinds of visualisations such as line graphs that show some past history. In Case Study 1, a pulse graph was used for heart activity, yet at points this visualisation was cut in ways that caused visual misalignments with the rest of the footage. Since editing software has no support for biodata, the workflow within our case studies was to render the biodata to video, which can then be edited using conventional software. However, this rendering process removes the source data. Thus there is a clear need for tools which better support manipulation of sensor data as materials during editing by using the underlying data—providing better metadata for searching, comparison and editing of this rendered data. We also envisage systems that allow live rendering of data, in order for editors themselves to modify visualisations. Implications for working with HCI technologies in production processes We draw a number of implications from the previous discussions; we summarise our findings around three key points which are concerned with more circumscribed practical issues for collaborations: • A ‘technician’ role must be designed for as an integrated / embedded part of the
production team. • HCI design needs to address the appearance and aesthetics of interactive
technologies that will appear on film; in our case sensor technology provided ‘inbuilt’ visual opportunities, yet even this had to be enhanced.
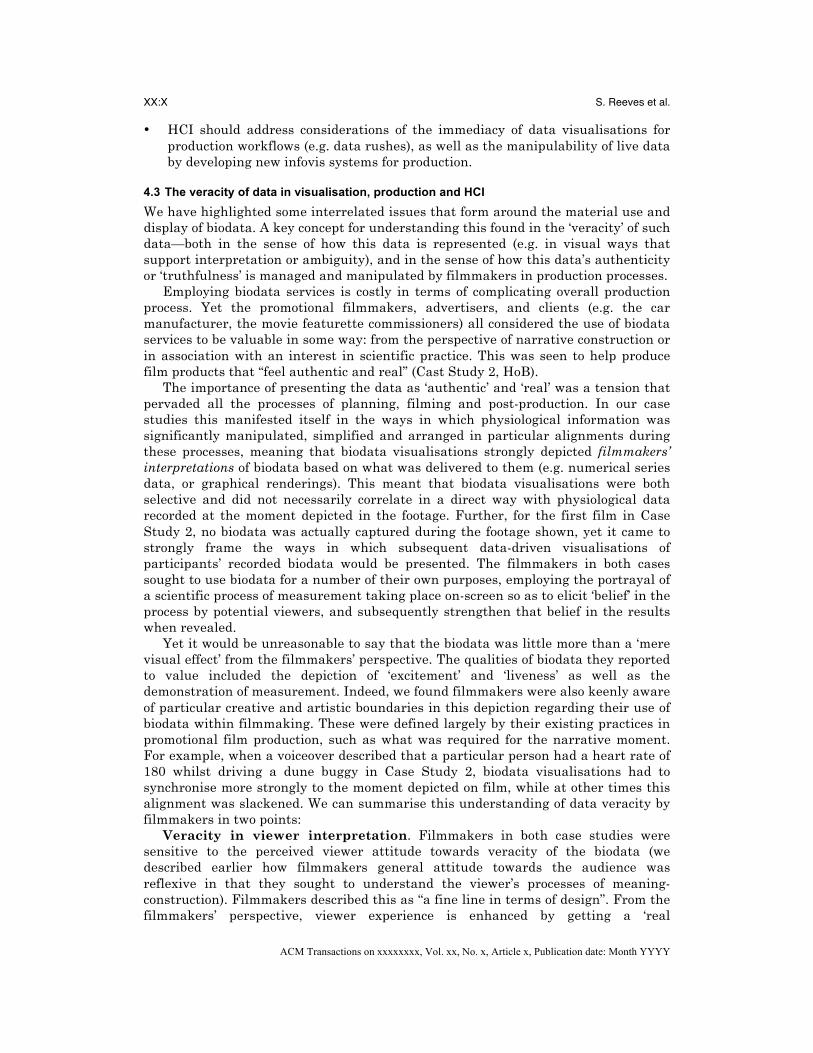
XX:X S. Reeves et al.
ACM Transactions on xxxxxxxx, Vol. xx, No. x, Article x, Publication date: Month YYYY
• HCI should address considerations of the immediacy of data visualisations for production workflows (e.g. data rushes), as well as the manipulability of live data by developing new infovis systems for production.
4.3 The veracity of data in visualisation, production and HCI We have highlighted some interrelated issues that form around the material use and display of biodata. A key concept for understanding this found in the ‘veracity’ of such data—both in the sense of how this data is represented (e.g. in visual ways that support interpretation or ambiguity), and in the sense of how this data’s authenticity or ‘truthfulness’ is managed and manipulated by filmmakers in production processes.
Employing biodata services is costly in terms of complicating overall production process. Yet the promotional filmmakers, advertisers, and clients (e.g. the car manufacturer, the movie featurette commissioners) all considered the use of biodata services to be valuable in some way: from the perspective of narrative construction or in association with an interest in scientific practice. This was seen to help produce film products that “feel authentic and real” (Cast Study 2, HoB).
The importance of presenting the data as ‘authentic’ and ‘real’ was a tension that pervaded all the processes of planning, filming and post-production. In our case studies this manifested itself in the ways in which physiological information was significantly manipulated, simplified and arranged in particular alignments during these processes, meaning that biodata visualisations strongly depicted filmmakers’ interpretations of biodata based on what was delivered to them (e.g. numerical series data, or graphical renderings). This meant that biodata visualisations were both selective and did not necessarily correlate in a direct way with physiological data recorded at the moment depicted in the footage. Further, for the first film in Case Study 2, no biodata was actually captured during the footage shown, yet it came to strongly frame the ways in which subsequent data-driven visualisations of participants’ recorded biodata would be presented. The filmmakers in both cases sought to use biodata for a number of their own purposes, employing the portrayal of a scientific process of measurement taking place on-screen so as to elicit ‘belief’ in the process by potential viewers, and subsequently strengthen that belief in the results when revealed.
Yet it would be unreasonable to say that the biodata was little more than a ‘mere visual effect’ from the filmmakers’ perspective. The qualities of biodata they reported to value included the depiction of ‘excitement’ and ‘liveness’ as well as the demonstration of measurement. Indeed, we found filmmakers were also keenly aware of particular creative and artistic boundaries in this depiction regarding their use of biodata within filmmaking. These were defined largely by their existing practices in promotional film production, such as what was required for the narrative moment. For example, when a voiceover described that a particular person had a heart rate of 180 whilst driving a dune buggy in Case Study 2, biodata visualisations had to synchronise more strongly to the moment depicted on film, while at other times this alignment was slackened. We can summarise this understanding of data veracity by filmmakers in two points:
Veracity in viewer interpretation. Filmmakers in both case studies were sensitive to the perceived viewer attitude towards veracity of the biodata (we described earlier how filmmakers general attitude towards the audience was reflexive in that they sought to understand the viewer’s processes of meaning-construction). Filmmakers described this as “a fine line in terms of design”. From the filmmakers’ perspective, viewer experience is enhanced by getting a ‘real
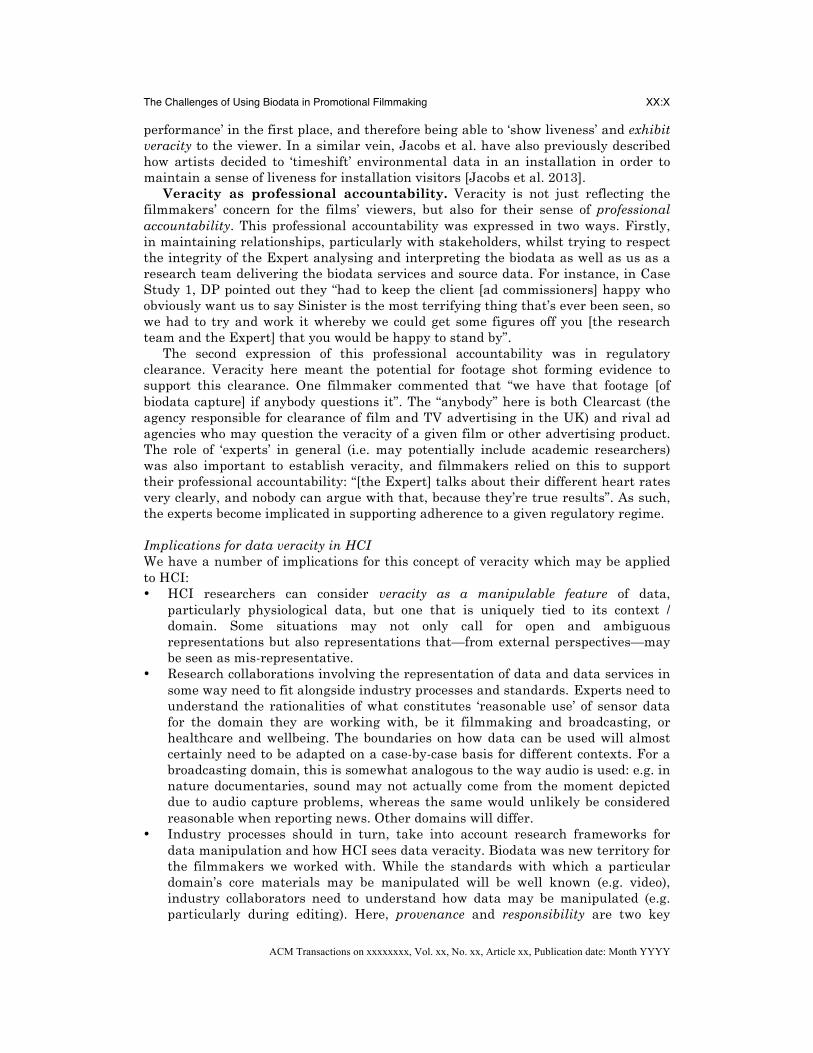
The Challenges of Using Biodata in Promotional Filmmaking XX:X
ACM Transactions on xxxxxxxx, Vol. xx, No. xx, Article xx, Publication date: Month YYYY
performance’ in the first place, and therefore being able to ‘show liveness’ and exhibit veracity to the viewer. In a similar vein, Jacobs et al. have also previously described how artists decided to ‘timeshift’ environmental data in an installation in order to maintain a sense of liveness for installation visitors [Jacobs et al. 2013].
Veracity as professional accountability. Veracity is not just reflecting the filmmakers’ concern for the films’ viewers, but also for their sense of professional accountability. This professional accountability was expressed in two ways. Firstly, in maintaining relationships, particularly with stakeholders, whilst trying to respect the integrity of the Expert analysing and interpreting the biodata as well as us as a research team delivering the biodata services and source data. For instance, in Case Study 1, DP pointed out they “had to keep the client [ad commissioners] happy who obviously want us to say Sinister is the most terrifying thing that’s ever been seen, so we had to try and work it whereby we could get some figures off you [the research team and the Expert] that you would be happy to stand by”.
The second expression of this professional accountability was in regulatory clearance. Veracity here meant the potential for footage shot forming evidence to support this clearance. One filmmaker commented that “we have that footage [of biodata capture] if anybody questions it”. The “anybody” here is both Clearcast (the agency responsible for clearance of film and TV advertising in the UK) and rival ad agencies who may question the veracity of a given film or other advertising product. The role of ‘experts’ in general (i.e. may potentially include academic researchers) was also important to establish veracity, and filmmakers relied on this to support their professional accountability: “[the Expert] talks about their different heart rates very clearly, and nobody can argue with that, because they’re true results”. As such, the experts become implicated in supporting adherence to a given regulatory regime.
Implications for data veracity in HCI We have a number of implications for this concept of veracity which may be applied to HCI: • HCI researchers can consider veracity as a manipulable feature of data,
particularly physiological data, but one that is uniquely tied to its context / domain. Some situations may not only call for open and ambiguous representations but also representations that—from external perspectives—may be seen as mis-representative.
• Research collaborations involving the representation of data and data services in some way need to fit alongside industry processes and standards. Experts need to understand the rationalities of what constitutes ‘reasonable use’ of sensor data for the domain they are working with, be it filmmaking and broadcasting, or healthcare and wellbeing. The boundaries on how data can be used will almost certainly need to be adapted on a case-by-case basis for different contexts. For a broadcasting domain, this is somewhat analogous to the way audio is used: e.g. in nature documentaries, sound may not actually come from the moment depicted due to audio capture problems, whereas the same would unlikely be considered reasonable when reporting news. Other domains will differ.
• Industry processes should in turn, take into account research frameworks for data manipulation and how HCI sees data veracity. Biodata was new territory for the filmmakers we worked with. While the standards with which a particular domain’s core materials may be manipulated will be well known (e.g. video), industry collaborators need to understand how data may be manipulated (e.g. particularly during editing). Here, provenance and responsibility are two key
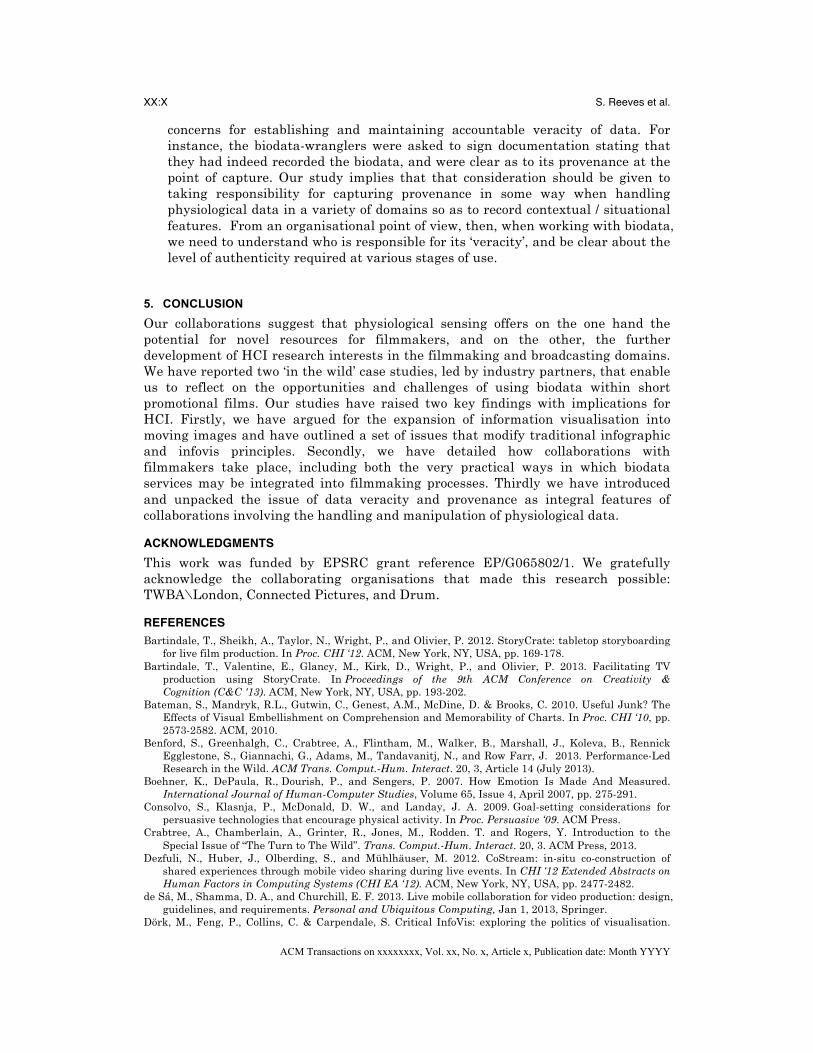
XX:X S. Reeves et al.
ACM Transactions on xxxxxxxx, Vol. xx, No. x, Article x, Publication date: Month YYYY
concerns for establishing and maintaining accountable veracity of data. For instance, the biodata-wranglers were asked to sign documentation stating that they had indeed recorded the biodata, and were clear as to its provenance at the point of capture. Our study implies that that consideration should be given to taking responsibility for capturing provenance in some way when handling physiological data in a variety of domains so as to record contextual / situational features. From an organisational point of view, then, when working with biodata, we need to understand who is responsible for its ‘veracity’, and be clear about the level of authenticity required at various stages of use.
5. CONCLUSION Our collaborations suggest that physiological sensing offers on the one hand the potential for novel resources for filmmakers, and on the other, the further development of HCI research interests in the filmmaking and broadcasting domains. We have reported two ‘in the wild’ case studies, led by industry partners, that enable us to reflect on the opportunities and challenges of using biodata within short promotional films. Our studies have raised two key findings with implications for HCI. Firstly, we have argued for the expansion of information visualisation into moving images and have outlined a set of issues that modify traditional infographic and infovis principles. Secondly, we have detailed how collaborations with filmmakers take place, including both the very practical ways in which biodata services may be integrated into filmmaking processes. Thirdly we have introduced and unpacked the issue of data veracity and provenance as integral features of collaborations involving the handling and manipulation of physiological data.
ACKNOWLEDGMENTS This work was funded by EPSRC grant reference EP/G065802/1. We gratefully acknowledge the collaborating organisations that made this research possible: TWBA\London, Connected Pictures, and Drum.
REFERENCES Bartindale, T., Sheikh, A., Taylor, N., Wright, P., and Olivier, P. 2012. StoryCrate: tabletop storyboarding
for live film production. In Proc. CHI ‘12. ACM, New York, NY, USA, pp. 169-178. Bartindale, T., Valentine, E., Glancy, M., Kirk, D., Wright, P., and Olivier, P. 2013. Facilitating TV
production using StoryCrate. In Proceedings of the 9th ACM Conference on Creativity & Cognition (C&C '13). ACM, New York, NY, USA, pp. 193-202.
Bateman, S., Mandryk, R.L., Gutwin, C., Genest, A.M., McDine, D. & Brooks, C. 2010. Useful Junk? The Effects of Visual Embellishment on Comprehension and Memorability of Charts. In Proc. CHI ‘10, pp. 2573-2582. ACM, 2010.
Benford, S., Greenhalgh, C., Crabtree, A., Flintham, M., Walker, B., Marshall, J., Koleva, B., Rennick Egglestone, S., Giannachi, G., Adams, M., Tandavanitj, N., and Row Farr, J. 2013. Performance-Led Research in the Wild. ACM Trans. Comput.-Hum. Interact. 20, 3, Article 14 (July 2013).
Boehner, K., DePaula, R., Dourish, P., and Sengers, P. 2007. How Emotion Is Made And Measured. International Journal of Human-Computer Studies, Volume 65, Issue 4, April 2007, pp. 275-291.
Consolvo, S., Klasnja, P., McDonald, D. W., and Landay, J. A. 2009. Goal-setting considerations for persuasive technologies that encourage physical activity. In Proc. Persuasive ‘09. ACM Press.
Crabtree, A., Chamberlain, A., Grinter, R., Jones, M., Rodden. T. and Rogers, Y. Introduction to the Special Issue of “The Turn to The Wild”. Trans. Comput.-Hum. Interact. 20, 3. ACM Press, 2013.
Dezfuli, N., Huber, J., Olberding, S., and Mühlhäuser, M. 2012. CoStream: in-situ co-construction of shared experiences through mobile video sharing during live events. In CHI ‘12 Extended Abstracts on Human Factors in Computing Systems (CHI EA ‘12). ACM, New York, NY, USA, pp. 2477-2482.
de Sá, M., Shamma, D. A., and Churchill, E. F. 2013. Live mobile collaboration for video production: design, guidelines, and requirements. Personal and Ubiquitous Computing, Jan 1, 2013, Springer.
Dörk, M., Feng, P., Collins, C. & Carpendale, S. Critical InfoVis: exploring the politics of visualisation.
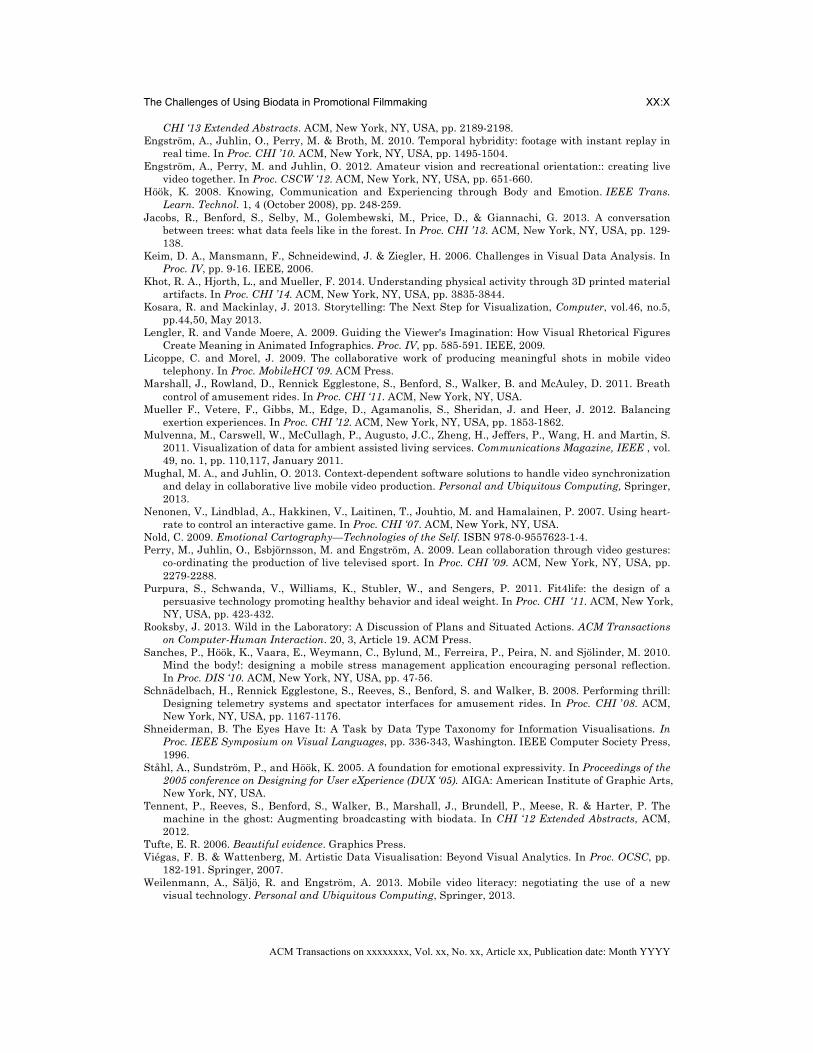
The Challenges of Using Biodata in Promotional Filmmaking XX:X
ACM Transactions on xxxxxxxx, Vol. xx, No. xx, Article xx, Publication date: Month YYYY
CHI ‘13 Extended Abstracts. ACM, New York, NY, USA, pp. 2189-2198. Engström, A., Juhlin, O., Perry, M. & Broth, M. 2010. Temporal hybridity: footage with instant replay in
real time. In Proc. CHI ’10. ACM, New York, NY, USA, pp. 1495-1504. Engström, A., Perry, M. and Juhlin, O. 2012. Amateur vision and recreational orientation:: creating live
video together. In Proc. CSCW ‘12. ACM, New York, NY, USA, pp. 651-660. Höök, K. 2008. Knowing, Communication and Experiencing through Body and Emotion. IEEE Trans.
Learn. Technol. 1, 4 (October 2008), pp. 248-259. Jacobs, R., Benford, S., Selby, M., Golembewski, M., Price, D., & Giannachi, G. 2013. A conversation
between trees: what data feels like in the forest. In Proc. CHI ’13. ACM, New York, NY, USA, pp. 129-138.
Keim, D. A., Mansmann, F., Schneidewind, J. & Ziegler, H. 2006. Challenges in Visual Data Analysis. In Proc. IV, pp. 9-16. IEEE, 2006.
Khot, R. A., Hjorth, L., and Mueller, F. 2014. Understanding physical activity through 3D printed material artifacts. In Proc. CHI ’14. ACM, New York, NY, USA, pp. 3835-3844.
Kosara, R. and Mackinlay, J. 2013. Storytelling: The Next Step for Visualization, Computer, vol.46, no.5, pp.44,50, May 2013.
Lengler, R. and Vande Moere, A. 2009. Guiding the Viewer's Imagination: How Visual Rhetorical Figures Create Meaning in Animated Infographics. Proc. IV, pp. 585-591. IEEE, 2009.
Licoppe, C. and Morel, J. 2009. The collaborative work of producing meaningful shots in mobile video telephony. In Proc. MobileHCI ‘09. ACM Press.
Marshall, J., Rowland, D., Rennick Egglestone, S., Benford, S., Walker, B. and McAuley, D. 2011. Breath control of amusement rides. In Proc. CHI ‘11. ACM, New York, NY, USA.
Mueller F., Vetere, F., Gibbs, M., Edge, D., Agamanolis, S., Sheridan, J. and Heer, J. 2012. Balancing exertion experiences. In Proc. CHI ’12. ACM, New York, NY, USA, pp. 1853-1862.
Mulvenna, M., Carswell, W., McCullagh, P., Augusto, J.C., Zheng, H., Jeffers, P., Wang, H. and Martin, S. 2011. Visualization of data for ambient assisted living services. Communications Magazine, IEEE , vol. 49, no. 1, pp. 110,117, January 2011.
Mughal, M. A., and Juhlin, O. 2013. Context-dependent software solutions to handle video synchronization and delay in collaborative live mobile video production. Personal and Ubiquitous Computing, Springer, 2013.
Nenonen, V., Lindblad, A., Hakkinen, V., Laitinen, T., Jouhtio, M. and Hamalainen, P. 2007. Using heart-rate to control an interactive game. In Proc. CHI ‘07. ACM, New York, NY, USA.
Nold, C. 2009. Emotional Cartography—Technologies of the Self. ISBN 978-0-9557623-1-4. Perry, M., Juhlin, O., Esbjörnsson, M. and Engström, A. 2009. Lean collaboration through video gestures:
co-ordinating the production of live televised sport. In Proc. CHI ’09. ACM, New York, NY, USA, pp. 2279-2288.
Purpura, S., Schwanda, V., Williams, K., Stubler, W., and Sengers, P. 2011. Fit4life: the design of a persuasive technology promoting healthy behavior and ideal weight. In Proc. CHI ‘11. ACM, New York, NY, USA, pp. 423-432.
Rooksby, J. 2013. Wild in the Laboratory: A Discussion of Plans and Situated Actions. ACM Transactions on Computer-Human Interaction. 20, 3, Article 19. ACM Press.
Sanches, P., Höök, K., Vaara, E., Weymann, C., Bylund, M., Ferreira, P., Peira, N. and Sjölinder, M. 2010. Mind the body!: designing a mobile stress management application encouraging personal reflection. In Proc. DIS ‘10. ACM, New York, NY, USA, pp. 47-56.
Schnädelbach, H., Rennick Egglestone, S., Reeves, S., Benford, S. and Walker, B. 2008. Performing thrill: Designing telemetry systems and spectator interfaces for amusement rides. In Proc. CHI ’08. ACM, New York, NY, USA, pp. 1167-1176.
Shneiderman, B. The Eyes Have It: A Task by Data Type Taxonomy for Information Visualisations. In Proc. IEEE Symposium on Visual Languages, pp. 336-343, Washington. IEEE Computer Society Press, 1996.
Ståhl, A., Sundström, P., and Höök, K. 2005. A foundation for emotional expressivity. In Proceedings of the 2005 conference on Designing for User eXperience (DUX ‘05). AIGA: American Institute of Graphic Arts, New York, NY, USA.
Tennent, P., Reeves, S., Benford, S., Walker, B., Marshall, J., Brundell, P., Meese, R. & Harter, P. The machine in the ghost: Augmenting broadcasting with biodata. In CHI ‘12 Extended Abstracts, ACM, 2012.
Tufte, E. R. 2006. Beautiful evidence. Graphics Press. Viégas, F. B. & Wattenberg, M. Artistic Data Visualisation: Beyond Visual Analytics. In Proc. OCSC, pp.
182-191. Springer, 2007. Weilenmann, A., Säljö, R. and Engström, A. 2013. Mobile video literacy: negotiating the use of a new
visual technology. Personal and Ubiquitous Computing, Springer, 2013.