x!tandem pipeline
TRANSCRIPT

X!TandemPipeline 3.3.3 (Myosine Anabolisee)
validating, filtering and grouping MSMS identifications
Olivier Langella and Benoit [email protected]; [email protected]
PAPPSO - http://pappso.inra.fr/
21 October 2014
Abstract
X!TandemPipeline is a standalone, easy to install, light and powerfull software to validate and grouppeptide/protein identifications from MS/MS mass spectra. X!TandemPipeline can read Mascot dat filesas well as X!Tandem XML result files. It features a rich graphical user interface (GUI) that helps users tobrowse their MS/MS identification results. It helps also to launch X!Tandem analysis with the full supportof all X!Tandem parameters.
X!TandemPipeline performs database searching and matching on many MS/MS runs in one shot. Itfocuses on the ease of use to select databases and identification parameters.
X!TandemPipeline also performs filtering of data according to statistical values at peptide and proteinlevels. Moreover, redundancy of protein databases are fully filtered as follows :
• proteins identified without specific peptides compared to others are eliminated;
• proteins identified with the same pool of peptides are assembled;
• proteins are grouped by function (identified with at least one common peptide), and the specificpeptides for each sub-group of proteins are indicated.
X!TandemPipeline allows to view and edit the filtered results, compute the false discovery rate, ... Theresults can be exported into TSV (Tab Separated Values) files or directly to a spreadsheet software formatusing ODS (Open Document Spreadsheet).
1

CONTENTS CONTENTS
Contents
1 Installation 5
1.1 License . . . . . . . . . . . . . . . . . . . . . . . . . . . . . . . . . . . . . . . . . . . . . . . . . . . 5
1.2 Requirements . . . . . . . . . . . . . . . . . . . . . . . . . . . . . . . . . . . . . . . . . . . . . . . 5
1.3 Third party softwares for Windows and Mac . . . . . . . . . . . . . . . . . . . . . . . . . . . . . . 5
1.4 Third party softwares for Linux . . . . . . . . . . . . . . . . . . . . . . . . . . . . . . . . . . . . . 5
1.5 Start X!TandemPipeline . . . . . . . . . . . . . . . . . . . . . . . . . . . . . . . . . . . . . . . 6
1.6 Configuration . . . . . . . . . . . . . . . . . . . . . . . . . . . . . . . . . . . . . . . . . . . . . . . 6
2 X!Tandemanalysis 7
2.1 Parameters . . . . . . . . . . . . . . . . . . . . . . . . . . . . . . . . . . . . . . . . . . . . . . . . 7
2.2 Running analysis . . . . . . . . . . . . . . . . . . . . . . . . . . . . . . . . . . . . . . . . . . . . . 7
2.3 Peak-lists . . . . . . . . . . . . . . . . . . . . . . . . . . . . . . . . . . . . . . . . . . . . . . . . . 8
2.4 Databases . . . . . . . . . . . . . . . . . . . . . . . . . . . . . . . . . . . . . . . . . . . . . . . . . 8
3 Processing the results 9
3.1 Three modes of analysis . . . . . . . . . . . . . . . . . . . . . . . . . . . . . . . . . . . . . . . . . 9
3.2 Filter parameters . . . . . . . . . . . . . . . . . . . . . . . . . . . . . . . . . . . . . . . . . . . . . 9
2
CONTENTS CONTENTS
4 View and edit the results 11
4.1 Main window . . . . . . . . . . . . . . . . . . . . . . . . . . . . . . . . . . . . . . . . . . . . . . . 11
4.2 Proteins List . . . . . . . . . . . . . . . . . . . . . . . . . . . . . . . . . . . . . . . . . . . . . . . 11
4.3 Protein Details . . . . . . . . . . . . . . . . . . . . . . . . . . . . . . . . . . . . . . . . . . . . . . 12
4.4 Peptides List . . . . . . . . . . . . . . . . . . . . . . . . . . . . . . . . . . . . . . . . . . . . . . . 12
4.5 Peptides Details . . . . . . . . . . . . . . . . . . . . . . . . . . . . . . . . . . . . . . . . . . . . . 13
5 Save and Load X!TandemPipelineproject 13
6 Exporting the results 14
6.1 Export settings . . . . . . . . . . . . . . . . . . . . . . . . . . . . . . . . . . . . . . . . . . . . . . 14
6.2 Open Document Spreadsheet (ODS) file . . . . . . . . . . . . . . . . . . . . . . . . . . . . . . . . 15
6.3 Proteins tab (Fig 11) . . . . . . . . . . . . . . . . . . . . . . . . . . . . . . . . . . . . . . . . . . . 16
6.4 Peptides tab (Fig 12) . . . . . . . . . . . . . . . . . . . . . . . . . . . . . . . . . . . . . . . . . . . 17
6.5 Spectra tab (Fig 13) . . . . . . . . . . . . . . . . . . . . . . . . . . . . . . . . . . . . . . . . . . . 18
6.6 Peptides position tab (Fig 14) . . . . . . . . . . . . . . . . . . . . . . . . . . . . . . . . . . . . . . 19
6.7 Compar spectra tab (Fig 15) . . . . . . . . . . . . . . . . . . . . . . . . . . . . . . . . . . . . . . 19
6.8 Compar specific tab (Fig 16) . . . . . . . . . . . . . . . . . . . . . . . . . . . . . . . . . . . . . . 20
6.9 Compar PAI tab (Fig 17) . . . . . . . . . . . . . . . . . . . . . . . . . . . . . . . . . . . . . . . . 21
3
CONTENTS CONTENTS
6.10 PhosphoIsland tab (Fig 18) . . . . . . . . . . . . . . . . . . . . . . . . . . . . . . . . . . . . . . . 21
6.11 PhosphoPeptides tab (Fig 19) . . . . . . . . . . . . . . . . . . . . . . . . . . . . . . . . . . . . . . 22
6.12 Phosphopeptide mode compar Spectra tab (Fig 20) . . . . . . . . . . . . . . . . . . . . . . . . . . 23
6.13 Phosphopeptide mode Spectra tab (Fig 21) . . . . . . . . . . . . . . . . . . . . . . . . . . . . . . 23
6.14 SequenceLI column . . . . . . . . . . . . . . . . . . . . . . . . . . . . . . . . . . . . . . . . . . . . 24
6.15 Files *fdr.txt . . . . . . . . . . . . . . . . . . . . . . . . . . . . . . . . . . . . . . . . . . . . . . . 25
7 Changelog 26
7.1 ”Myosine” branch . . . . . . . . . . . . . . . . . . . . . . . . . . . . . . . . . . . . . . . . . . . . 26
7.2 ”Tubuline” branch . . . . . . . . . . . . . . . . . . . . . . . . . . . . . . . . . . . . . . . . . . . . 26
7.3 ”Keratine” branch . . . . . . . . . . . . . . . . . . . . . . . . . . . . . . . . . . . . . . . . . . . . 26
4

1 INSTALLATION
1 Installation
1.1 License
Copyright (C) 2010 Olivier Langella and Benoit ValotX!TandemPipeline program is free software: you can redistribute it and/or modify it under the terms of theGNU General Public License as published by the Free Software Foundation, either version 3 of the License, or(at your option) any later version.This program is distributed in the hope that it will be useful, but WITHOUT ANY WARRANTY; withouteven the implied warranty of MERCHANTABILITY or FITNESS FOR A PARTICULAR PURPOSE. See theGNU General Public License for more details.
1.2 Requirements
X!TandemPipeline works on all platforms (Linux, Windows and Mac). Java 1.6 must be installed (it can beat : http://java.com/fr/download/index.jsp).
1.3 Third party softwares for Windows and Mac
Download and install the X!Tandem executable from the X!Tandem site (http://www.thegpm.org/tandem/).
1.4 Third party softwares for Linux
Debian or Ubuntu
• Follow instructions on how to install the PAPPSO Debian repositoryhttp://pappso.inra.fr/bioinfo/install ppa debian.php.
• Install the tandem-mass package.
• You can also install the xtandempipeline package to run X!TandemPipeline instead of using the jlnplink.
Other distributions
• Please visit the X!Tandem site, and follow instructions about getting and compile the source code.
5
1.5 Start X!TandemPipeline 1 INSTALLATION
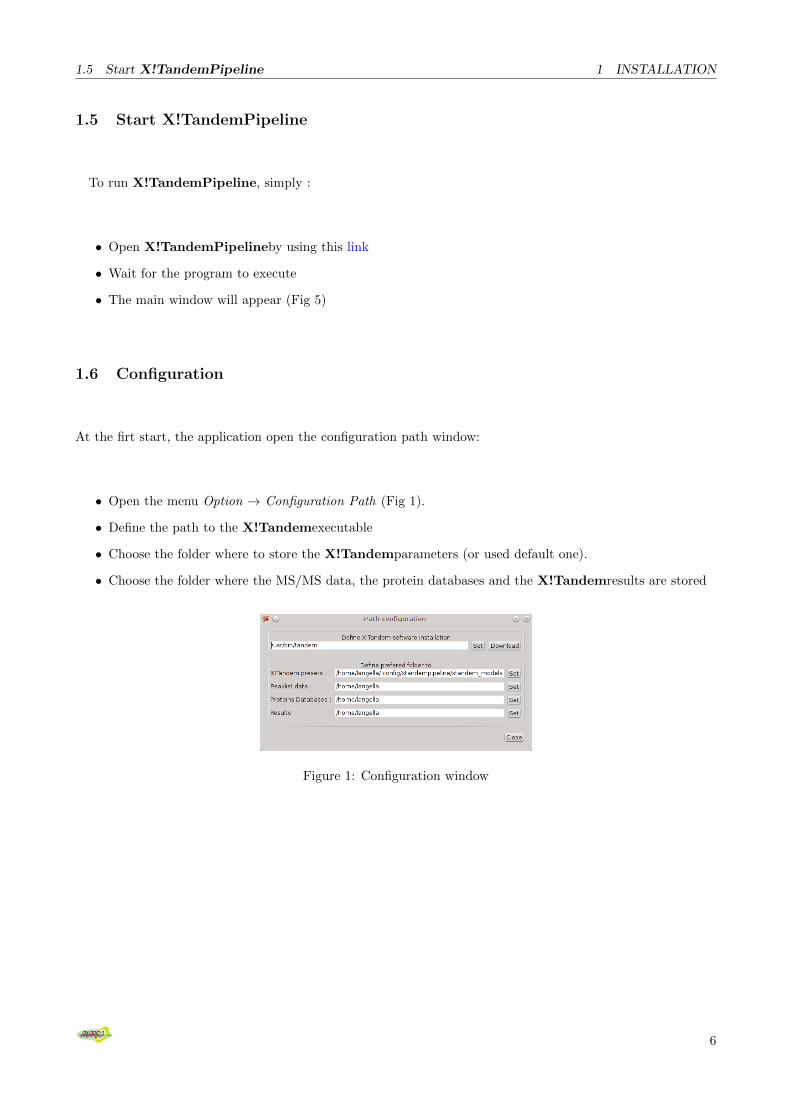
1.5 Start X!TandemPipeline
To run X!TandemPipeline, simply :
• Open X!TandemPipelineby using this link
• Wait for the program to execute
• The main window will appear (Fig 5)
1.6 Configuration
At the firt start, the application open the configuration path window:
• Open the menu Option → Configuration Path (Fig 1).
• Define the path to the X!Tandemexecutable
• Choose the folder where to store the X!Tandemparameters (or used default one).
• Choose the folder where the MS/MS data, the protein databases and the X!Tandemresults are stored
Figure 1: Configuration window
6

2 X!TANDEMANALYSIS
2 X!Tandemanalysis
X!TandemPipeline allows you to analyze peak-lists files by searching a list of protein databases using theX!Tandemsoftware. Three successive graphical boxes help you select first the mzXML files or other peak-lists,then the protein databases and finally the folder where the results will be stored. The databases must be proteinones, X!Tandemdoes not work on DNA databases.
2.1 Parameters
To perform database searching, you must create or edit a model XML file (stored in the xtandem modelsfolder). Open the menu Option → X!Tandempreset (Fig 2).
Figure 2: X!Tandempreset window
To use complete performance of your computer, specify the number of CPU in the model : spectrum →threads.
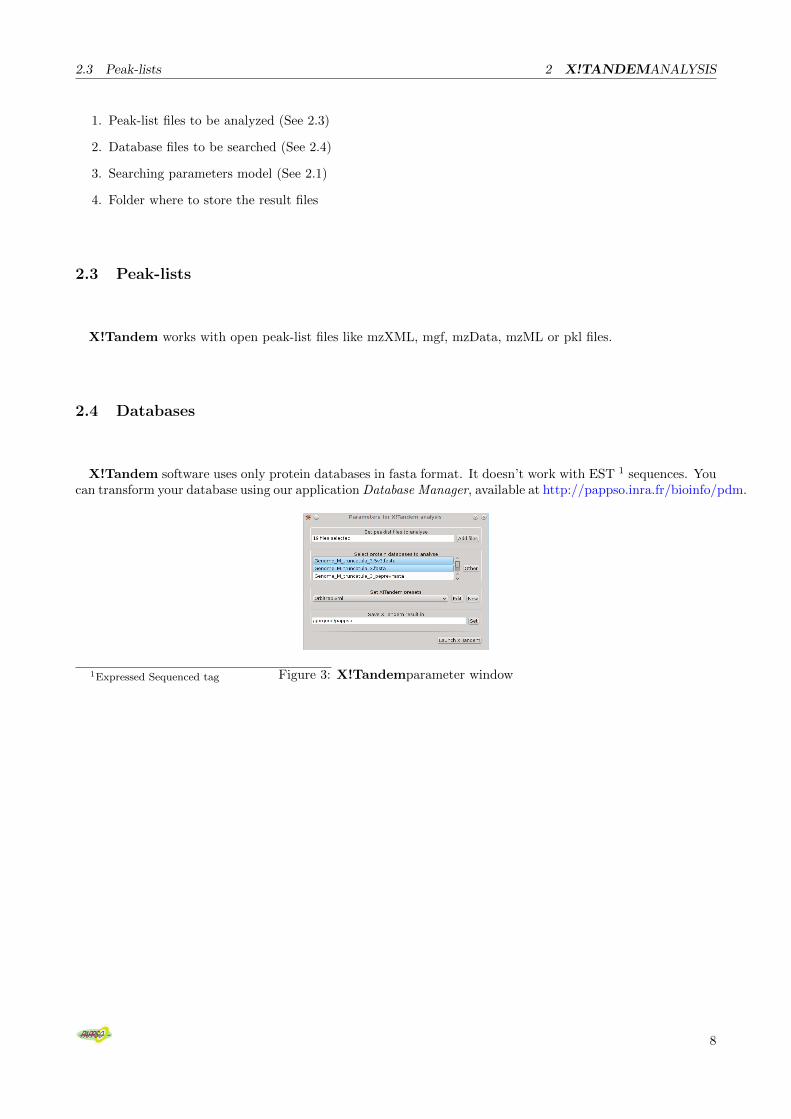
2.2 Running analysis
To perform analysis, start the menu File → X!Tandem→ Analysis. Select on the window (Fig 3) :
7
2.3 Peak-lists 2 X!TANDEMANALYSIS
1. Peak-list files to be analyzed (See 2.3)
2. Database files to be searched (See 2.4)
3. Searching parameters model (See 2.1)
4. Folder where to store the result files
2.3 Peak-lists
X!Tandem works with open peak-list files like mzXML, mgf, mzData, mzML or pkl files.
2.4 Databases
X!Tandem software uses only protein databases in fasta format. It doesn’t work with EST 1 sequences. Youcan transform your database using our application Database Manager, available at http://pappso.inra.fr/bioinfo/pdm.
Figure 3: X!Tandemparameter window1Expressed Sequenced tag
8
3 PROCESSING THE RESULTS
3 Processing the results
Warning: To process results, X!TandemPipeline needs to have X!Tandemresult files (.xml) or Mascotresult files (.dat). The names of the files are used as sample names.
3.1 Three modes of analysis
You can filter the MS/MS identification results and export them in three different modes : (menu File →Load Result)
Individual modeEach MS/MS result file is processed individually.You cannot perform comparison by using this process because each sample as its own protein/peptide list.
Combined modeThe MS/MS result files are combined in one result file, and this file is filtered / exported.This mode is useful to compare different results : there is only one protein/peptide list for all samples.
Phosphopeptide modeSame as the combined mode analysis except that only phosphopeptides are conserved and the result isoriented in order to validate phosphosites.
In all modes, you have to define the filter parameters.
3.2 Filter parameters
The filter window (Fig 4) defines the automated filtering process parameters :
Add filesAt this stage, you can add other MS/MS result files to the analysis. If two files have the same name, they arecombined in one result file. Interesting if one wants to combine X!Tandemand/or Mascot results of the sameLC-MS/MS run using different modification parameters or protein databases.
Peptide E-valueDefines the E-value above which a peptide is considered as valid.
Peptide numberDefines the number of valid unique2 peptides necessary to validate a protein.
Protein E-valueDefines the E-value above which a protein is considered as valid.
2Unique peptides are defined as peptides with different sequences. This excludes peptides with different modifications.
9

3.2 Filter parameters 3 PROCESSING THE RESULTS
• The protein E-value is the product of its valid unique peptide E-values and it is different from the proteinE-values determined by X!Tandem.
• The values are expressed in log(E-value).
Apply protein filter to all samples togetherDefines how protein filter is performed when MS/MS results are combined :
Disabled To validate a protein, the 2 parameters (peptide number and protein E-value) must be valid in atleast one result. Interesting if one wants to compare SDS-PAGE-LC-MS/MS results, where peptides from aprotein are in the same LC-MS/MS run.
Enabled To validate a protein, the 2 parameters (peptide number and protein E-value) must be valid in the sumof all results. Interesting if one wants to compare 2DLC-MS/MS results, where peptides from a protein aresplit in different LC-MS/MS runs.
ContaminantsWhen you perform an analysis using different fasta databases, you can remove the result from one database byselecting this database. Interesting because it allows you to always include the same contaminant proteins duringthe database search, and because it removes the contaminant proteins from the results.
Figure 4: Filter window
10

4 VIEW AND EDIT THE RESULTS
4 View and edit the results
After loading the results, you can select the result to view in the main window (see 4.1). After this selection,you can navigate in this result in four different windows listed in the menu Windows :
4.1 Main window
• First frame ”Identification Results” : choose the result to edit, displays the current number of samplesand groups.
• False Discovery Rate : estimates an FDR using a reverse/decoy database
• Mass precision : computes the standard deviation between theoretical and observed mass of peptides
• Filter identification results : choose criterium to validate identifications as described in 3.2
Figure 5: Main window
4.2 Proteins List
View the list of protein identified on the result. For more details on column see Fig 4.2.
• Filter the protein by description;
• Click on a protein to view the corresponding peptides list (see 4.4) and protein details (see 4.3);
• The checkbox on each protein line allow to validate or unvalidate corresponding peptides;
• Apply modification to validate the edition.
11
4.3 Protein Details 4 VIEW AND EDIT THE RESULTS
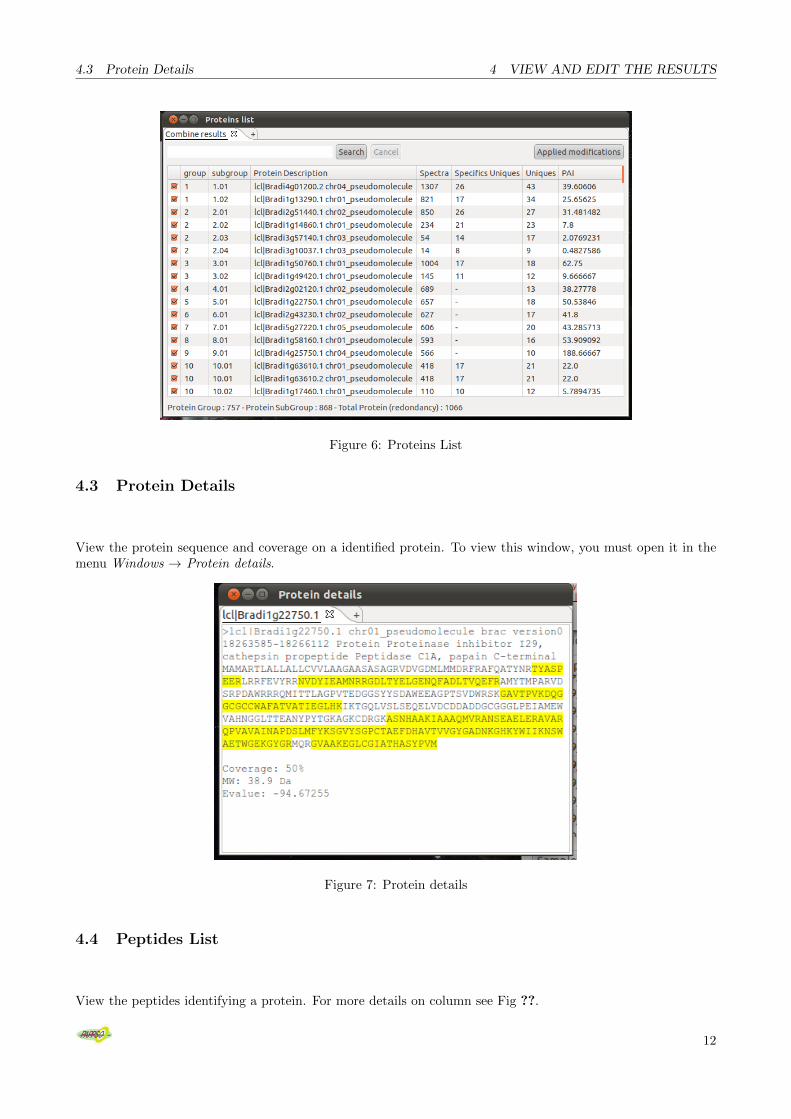
Figure 6: Proteins List
4.3 Protein Details
View the protein sequence and coverage on a identified protein. To view this window, you must open it in themenu Windows → Protein details.
Figure 7: Protein details
4.4 Peptides List
View the peptides identifying a protein. For more details on column see Fig ??.
12

4.5 Peptides Details 5 SAVE AND LOAD X!TANDEMPIPELINEPROJECT
• Filter the peptide by different options;
• Click on a peptide to view the corresponding MS/MS spectra (see 4.5);
• Uncheck peptide to unvalidate it.
Figure 8: Peptides List
4.5 Peptides Details
View the MS/MS spectra of an identified peptide.
• Click on spectra to zoom.
• Save MS/MS annotated spectra on png or svg.
5 Save and Load X!TandemPipelineproject
You can save all the current results using menu File → Save Project, or load a previous one using menu File→ Load Project. The extension of created files is *.xpip.
13

6 EXPORTING THE RESULTS
Figure 9: Peptides Details
6 Exporting the results
You can export the result in different formats in menu File → Export.
6.1 Export settings
The export window (Fig 10) shows the different types of available exports :
Open Document Spreadsheet (ODS)Produces an ODS file3 containing results depending on the chosen mode. By default, it contains only informationson proteins and peptides. You can choose the expert mode to add all detailed informations on each spectra (thiscould produce very large files).
Expert spreadsheet outputOnly available when ODS is chosen : this adds all informations on each spectra to peptide match. this couldproduce very large files.
FastaCreates a fasta file containing the validated proteins.
FDRCreates two tabulated files containing the number of valid peptides or valid proteins for the different E-values ineach database (see 6.15). Allows you to determine the E-value above which FDR value is acceptable.
PepNovoCreates a XML file containing the peptide results to be removed for an automated De Novo interpretation insequence using our DeNovo pipeline.
MassChroQCreates a MassChroQ compatible XML file, so you can perform quantitative analysis using our MassChroQsoftware.
PROTICdbCreates a PROTICdb compatible XML file, so you can store results in PROTICdb proteomic database.
3ODS is an open format, similar to xls, readable with MS Office or LibreOffice
14

6.2 Open Document Spreadsheet (ODS) file 6 EXPORTING THE RESULTS
Figure 10: Export window
6.2 Open Document Spreadsheet (ODS) file
Individual mode In this mode, the ODS report contains two tabs :
• “proteins” (see 6.3)
• “peptides” (see 6.4)
Proteins are listed for each samples. In each samples, the proteins are grouped generally by functions.If the expert output is enabled, the ODS output contains extra tabs :
• “spectra” (see 6.5)
• “peptide pos” (see 6.6)
Combined mode In this mode, the ODS report contains five tabs :
• “proteins” (see 6.3)
• “peptides” (see 6.4)
• “compar Spectra” (see 6.7)
• “compar Specific” (see 6.8)
• “compar PAI” (see 6.9)
15
6.3 Proteins tab (Fig 11) 6 EXPORTING THE RESULTS
There is a unique protein list, the same for all samples. The proteins are grouped generally by functions.If the expert output is enabled, the ODS output contains extra tabs :
• “spectra” (see 6.5)
• “peptide pos” (see 6.6)
Phosphopeptide mode In this mode, only peptides containing one or more phosphorylation site are takeninto account. These peptides are called phosphopeptides. Phosphopeptides sharing the same peptide sequence(possible overlaps) are represented by subgroups. A phospisland is a set of phophopeptides sharing the samepeptide sequence, specific to a protein. Thus PhosphoIslands in the same subgroups share the same set ofphosphopeptides. Subgroups are grouped together if they share at least one protein. In this mode, the ODSreport contains three tabs :
• “phosphoislands” (see 6.10)
• “phosphopeptides” (see 6.11)
• “compar Spectra” (see 6.12)
If the expert output is enabled, the ODS output contains extra tabs :
• “spectra” (see 6.13)
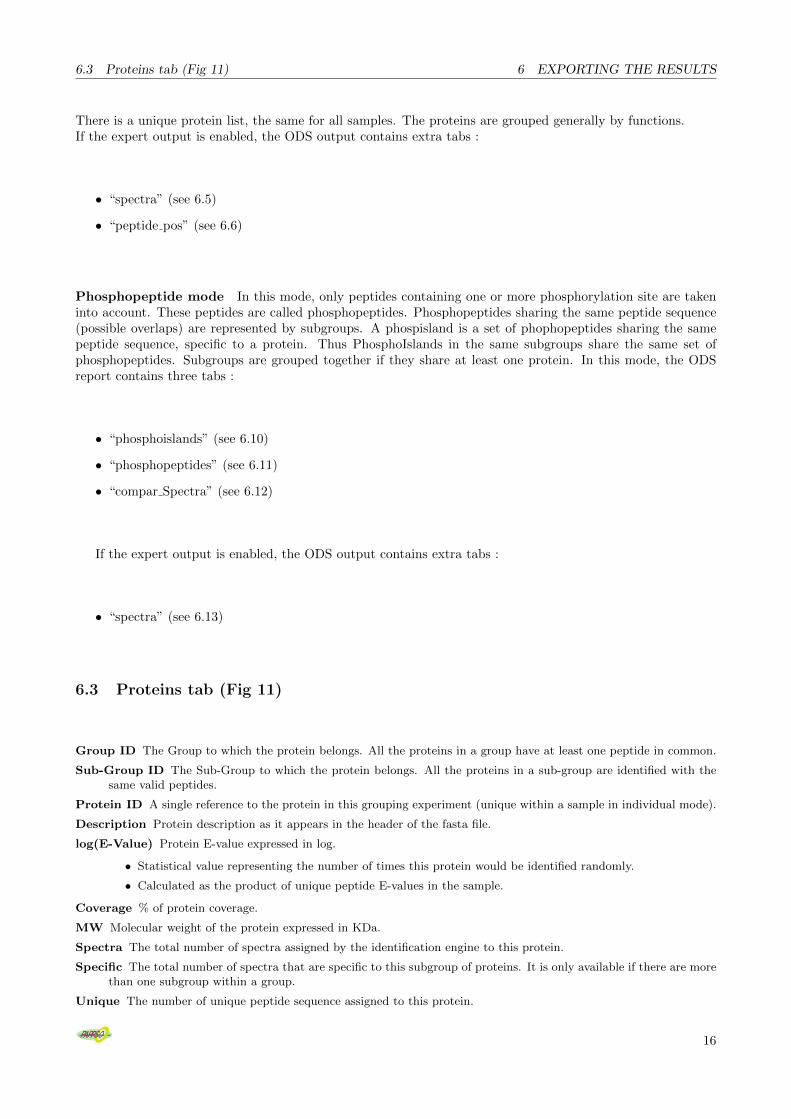
6.3 Proteins tab (Fig 11)
Group ID The Group to which the protein belongs. All the proteins in a group have at least one peptide in common.
Sub-Group ID The Sub-Group to which the protein belongs. All the proteins in a sub-group are identified with thesame valid peptides.
Protein ID A single reference to the protein in this grouping experiment (unique within a sample in individual mode).
Description Protein description as it appears in the header of the fasta file.
log(E-Value) Protein E-value expressed in log.
• Statistical value representing the number of times this protein would be identified randomly.
• Calculated as the product of unique peptide E-values in the sample.
Coverage % of protein coverage.
MW Molecular weight of the protein expressed in KDa.
Spectra The total number of spectra assigned by the identification engine to this protein.
Specific The total number of spectra that are specific to this subgroup of proteins. It is only available if there are morethan one subgroup within a group.
Unique The number of unique peptide sequence assigned to this protein.
16
6.4 Peptides tab (Fig 12) 6 EXPORTING THE RESULTS
Specific uniques The number of unique peptide sequence specific to this subgroup of proteins. It is only available ifthere are more than one subgroup within a group.
Theoretical number of tryptic peptides The theoretical number of tryptic peptides in this protein4.
PAI Protein Abundance Index :
• PAI estimates the relative abundance of the protein.
• PAI is calculated as the number of identified spectra divided by the number of theoretical tryptic peptides.
emPAI the emPAI5 is a PAI transformation such as : emPAI = 10PAI − 1.
Sub-group proteins The number of proteins in this subgroup.
number of MS samples The number of MS samples in which this protein was identified. Only usefull in the combinedmode.
Figure 11: Protein results
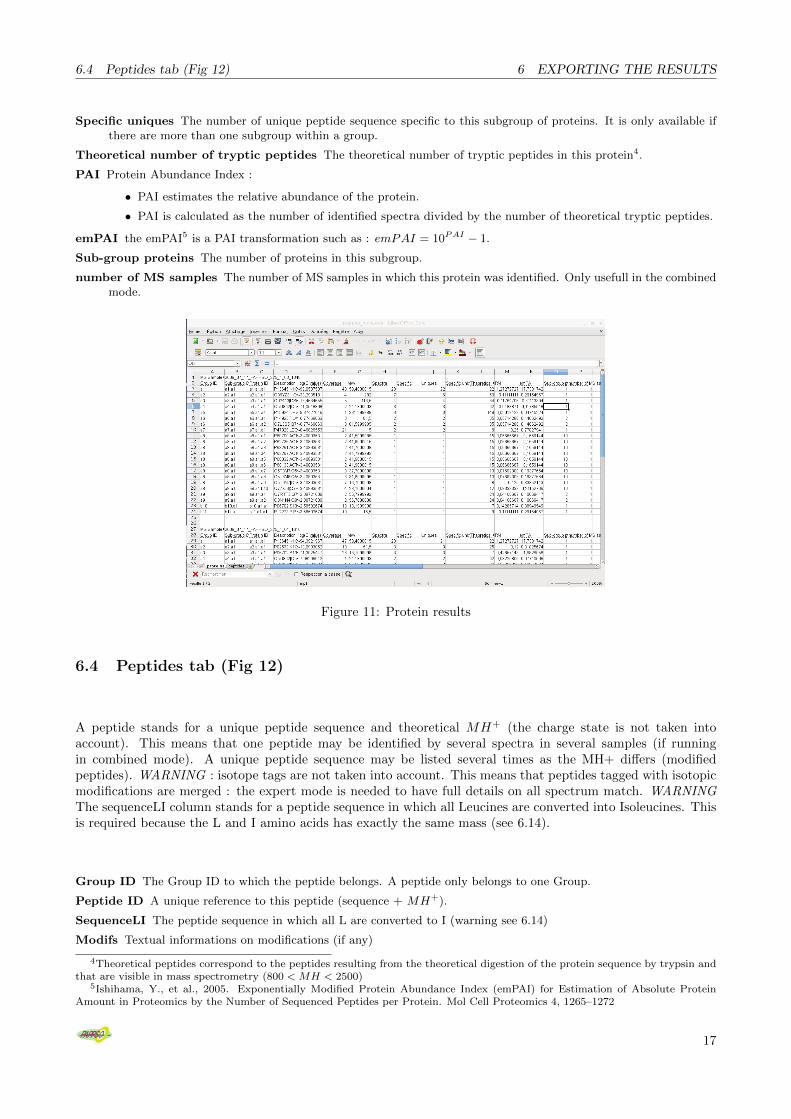
6.4 Peptides tab (Fig 12)
A peptide stands for a unique peptide sequence and theoretical MH+ (the charge state is not taken intoaccount). This means that one peptide may be identified by several spectra in several samples (if runningin combined mode). A unique peptide sequence may be listed several times as the MH+ differs (modifiedpeptides). WARNING : isotope tags are not taken into account. This means that peptides tagged with isotopicmodifications are merged : the expert mode is needed to have full details on all spectrum match. WARNINGThe sequenceLI column stands for a peptide sequence in which all Leucines are converted into Isoleucines. Thisis required because the L and I amino acids has exactly the same mass (see 6.14).
Group ID The Group ID to which the peptide belongs. A peptide only belongs to one Group.
Peptide ID A unique reference to this peptide (sequence + MH+).
SequenceLI The peptide sequence in which all L are converted to I (warning see 6.14)
Modifs Textual informations on modifications (if any)
4Theoretical peptides correspond to the peptides resulting from the theoretical digestion of the protein sequence by trypsin andthat are visible in mass spectrometry (800 < MH < 2500)
5Ishihama, Y., et al., 2005. Exponentially Modified Protein Abundance Index (emPAI) for Estimation of Absolute ProteinAmount in Proteomics by the Number of Sequenced Peptides per Protein. Mol Cell Proteomics 4, 1265–1272
17

6.5 Spectra tab (Fig 13) 6 EXPORTING THE RESULTS
Charge The charge state of the peptide identification featuring the best E-value among the same peptides (sequence +MH+).
MH+ theo The theoretical MH+for this peptide.
Number of subgroups The number of subgroups in which this peptide is present.
Subgroup ids Subgroup ID list in which this peptide is present.
Number of spectra The number of spectra (peptide spectrum match) identifying this peptide.
Figure 12: Peptide results
6.5 Spectra tab (Fig 13)
The spectra tab contains details on each spectrum match. It is only available the expert ODS output waschosen.
Group ID The Group ID to which the spectrum belongs.
Peptide ID The Peptide ID to which the spectrum belongs.
Sample The spectrum’s sample name (the MS/MS run file name).
Scan The spectrum’s scan number within this MS/MS run.
Rt The retention time in minutes.
Sequence (top) The sequence of the best peptide (best E-value) assignment for this spectrum.
Modifs (top) The modifications (if any) of the best peptide (best E-value) assignment for this spectrum.
Number of subgroups The number of subgroups in which this spectrum is present.
Sub-groups Ids The subgroup id list in which this spectrum is present.
Best E-value The E-value of the best peptide assignment for this spectrum.
Best hyperscore The hypserscore (only available for X!Tandemanalysis) of the best peptide assignment for thisspectrum.
Charge The charge state of the best peptide assignment for this spectrum.
MH+ Obs Observed MH+(Monoisotopic observed mass for the peptide + one proton) of the best peptide assignmentfor this spectrum.
MH+ theo Theoretical MH+of the best peptide assignment for this spectrum.
DeltaMH+ Error in the precursor mass between observed and theoretical data (Da)
Delta-ppm Error in the precursor mass between observed and theoretical data (ppm)
18
6.6 Peptides position tab (Fig 14) 6 EXPORTING THE RESULTS
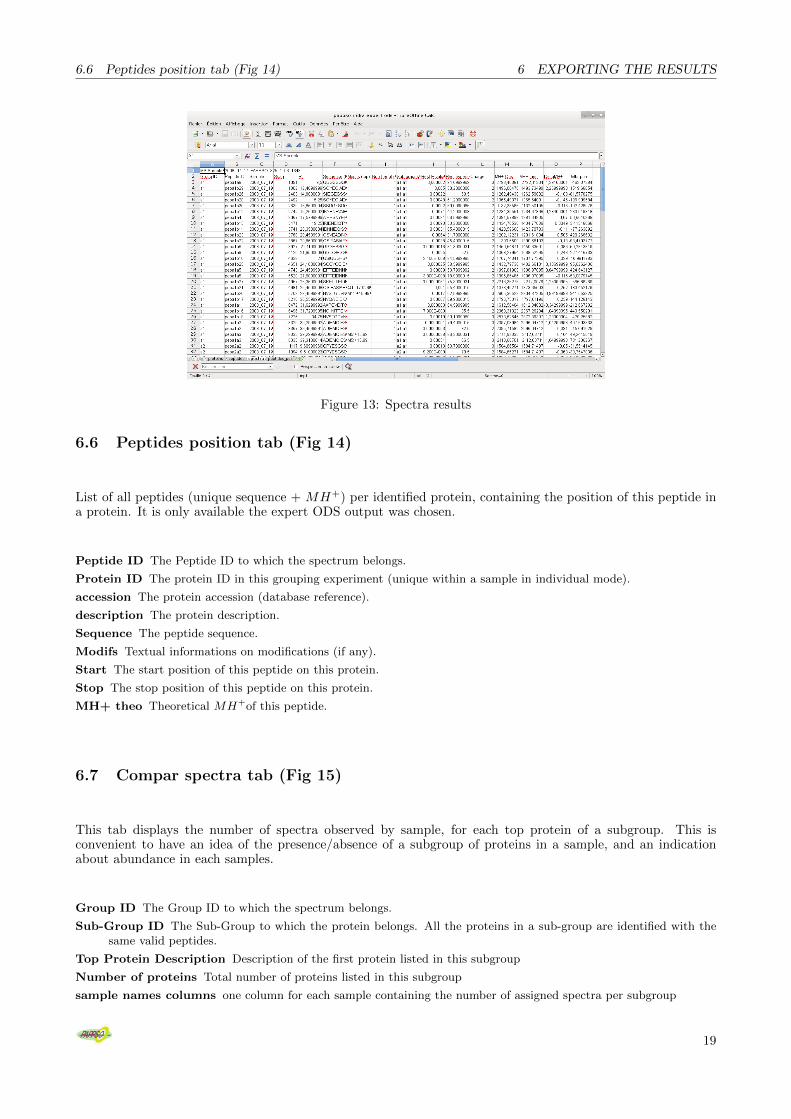
Figure 13: Spectra results
6.6 Peptides position tab (Fig 14)
List of all peptides (unique sequence + MH+) per identified protein, containing the position of this peptide ina protein. It is only available the expert ODS output was chosen.
Peptide ID The Peptide ID to which the spectrum belongs.
Protein ID The protein ID in this grouping experiment (unique within a sample in individual mode).
accession The protein accession (database reference).
description The protein description.
Sequence The peptide sequence.
Modifs Textual informations on modifications (if any).
Start The start position of this peptide on this protein.
Stop The stop position of this peptide on this protein.
MH+ theo Theoretical MH+of this peptide.
6.7 Compar spectra tab (Fig 15)
This tab displays the number of spectra observed by sample, for each top protein of a subgroup. This isconvenient to have an idea of the presence/absence of a subgroup of proteins in a sample, and an indicationabout abundance in each samples.
Group ID The Group ID to which the spectrum belongs.
Sub-Group ID The Sub-Group to which the protein belongs. All the proteins in a sub-group are identified with thesame valid peptides.
Top Protein Description Description of the first protein listed in this subgroup
Number of proteins Total number of proteins listed in this subgroup
sample names columns one column for each sample containing the number of assigned spectra per subgroup
19
6.8 Compar specific tab (Fig 16) 6 EXPORTING THE RESULTS
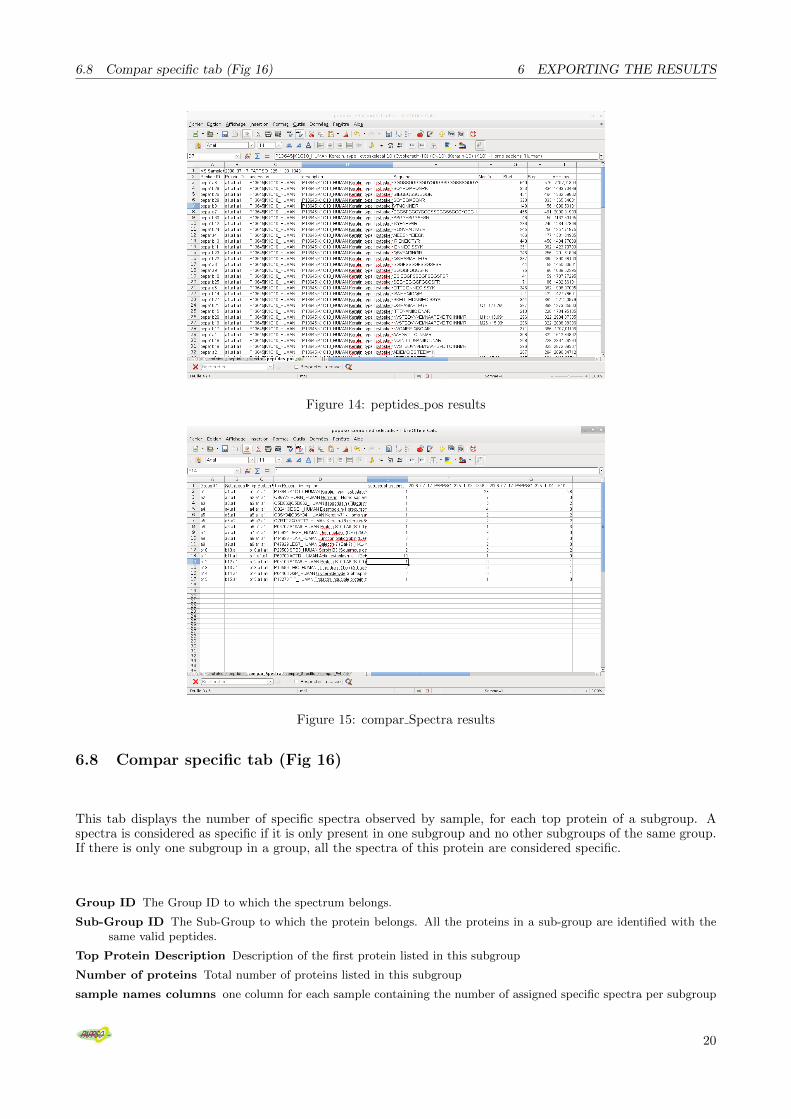
Figure 14: peptides pos results
Figure 15: compar Spectra results
6.8 Compar specific tab (Fig 16)
This tab displays the number of specific spectra observed by sample, for each top protein of a subgroup. Aspectra is considered as specific if it is only present in one subgroup and no other subgroups of the same group.If there is only one subgroup in a group, all the spectra of this protein are considered specific.
Group ID The Group ID to which the spectrum belongs.
Sub-Group ID The Sub-Group to which the protein belongs. All the proteins in a sub-group are identified with thesame valid peptides.
Top Protein Description Description of the first protein listed in this subgroup
Number of proteins Total number of proteins listed in this subgroup
sample names columns one column for each sample containing the number of assigned specific spectra per subgroup
20
6.9 Compar PAI tab (Fig 17) 6 EXPORTING THE RESULTS
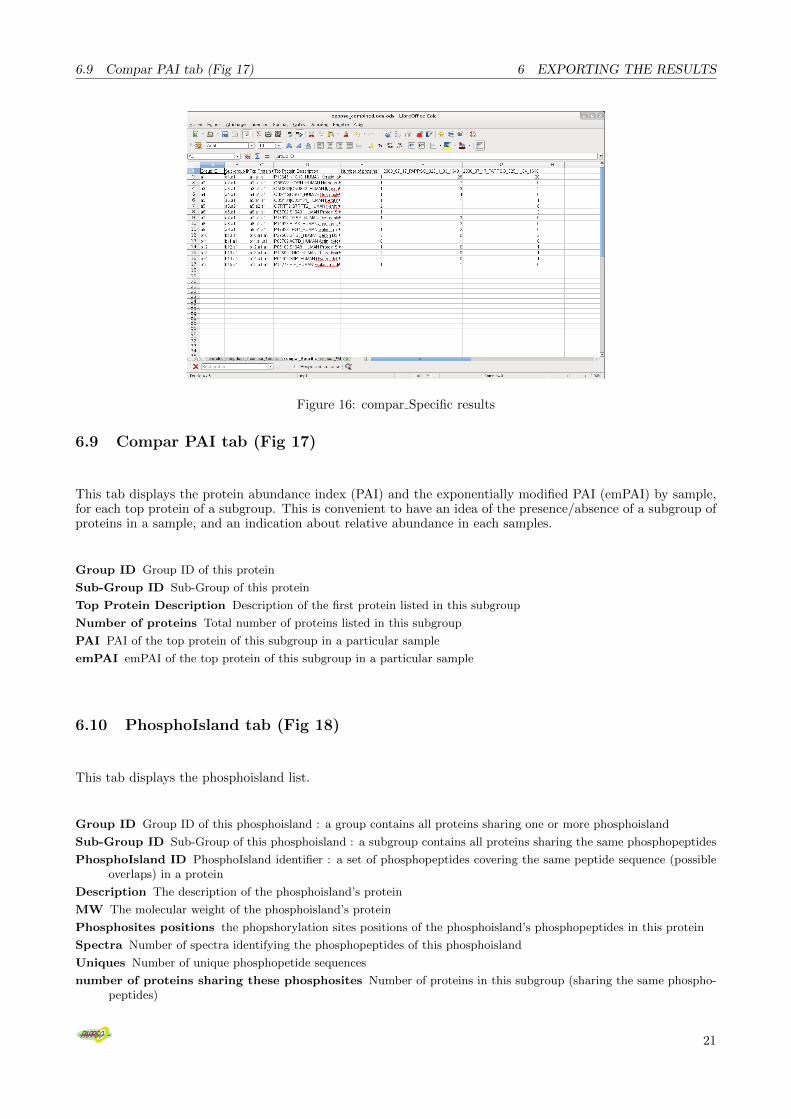
Figure 16: compar Specific results
6.9 Compar PAI tab (Fig 17)
This tab displays the protein abundance index (PAI) and the exponentially modified PAI (emPAI) by sample,for each top protein of a subgroup. This is convenient to have an idea of the presence/absence of a subgroup ofproteins in a sample, and an indication about relative abundance in each samples.
Group ID Group ID of this protein
Sub-Group ID Sub-Group of this protein
Top Protein Description Description of the first protein listed in this subgroup
Number of proteins Total number of proteins listed in this subgroup
PAI PAI of the top protein of this subgroup in a particular sample
emPAI emPAI of the top protein of this subgroup in a particular sample
6.10 PhosphoIsland tab (Fig 18)
This tab displays the phosphoisland list.
Group ID Group ID of this phosphoisland : a group contains all proteins sharing one or more phosphoisland
Sub-Group ID Sub-Group of this phosphoisland : a subgroup contains all proteins sharing the same phosphopeptides
PhosphoIsland ID PhosphoIsland identifier : a set of phosphopeptides covering the same peptide sequence (possibleoverlaps) in a protein
Description The description of the phosphoisland’s protein
MW The molecular weight of the phosphoisland’s protein
Phosphosites positions the phopshorylation sites positions of the phosphoisland’s phosphopeptides in this protein
Spectra Number of spectra identifying the phosphopeptides of this phosphoisland
Uniques Number of unique phosphopetide sequences
number of proteins sharing these phosphosites Number of proteins in this subgroup (sharing the same phospho-peptides)
21
6.11 PhosphoPeptides tab (Fig 19) 6 EXPORTING THE RESULTS
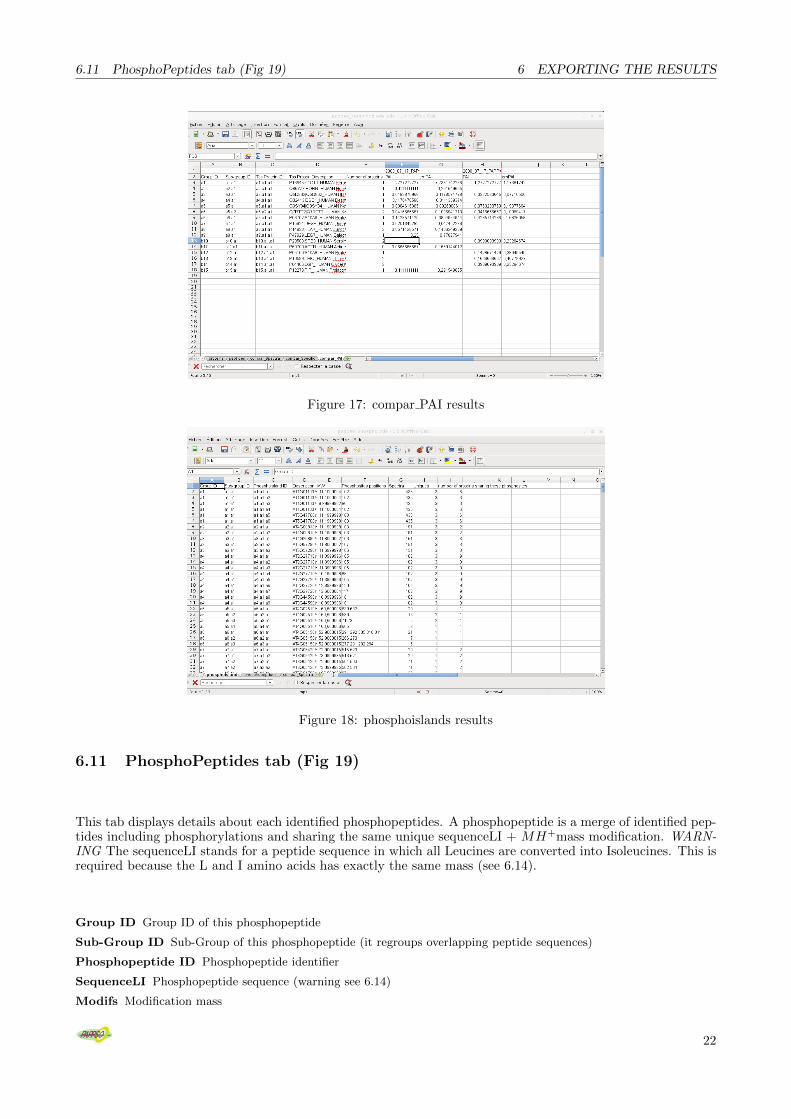
Figure 17: compar PAI results
Figure 18: phosphoislands results
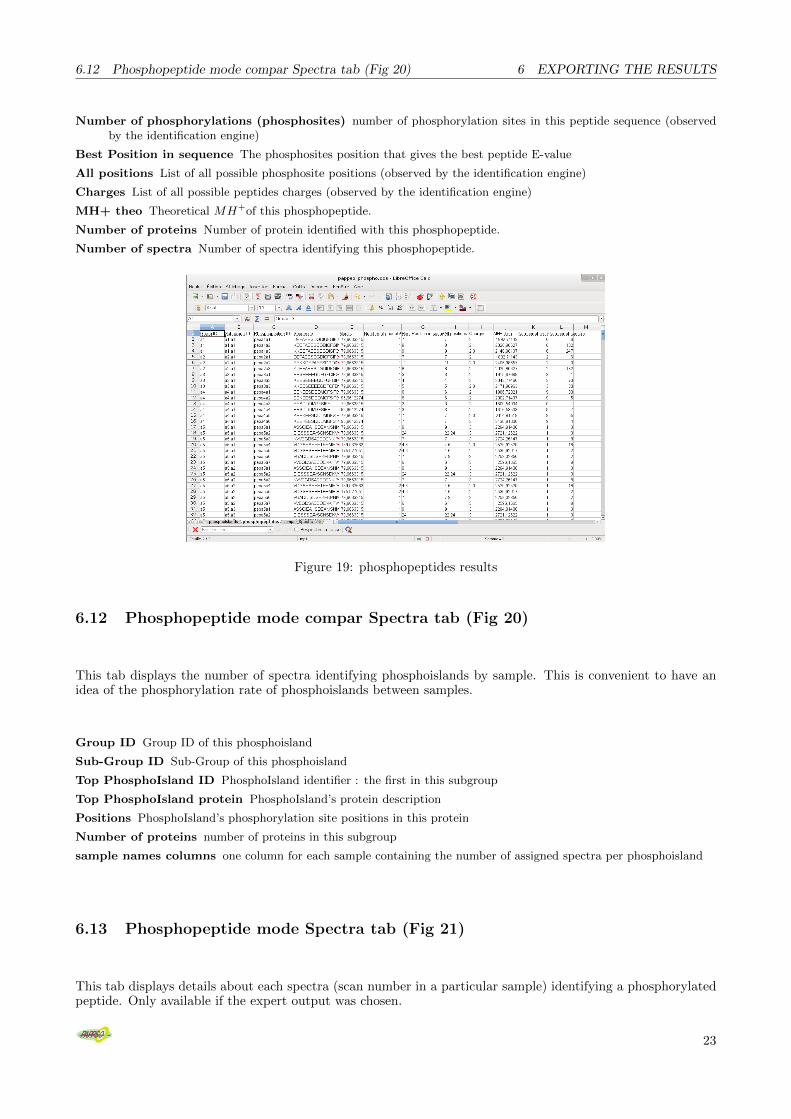
6.11 PhosphoPeptides tab (Fig 19)
This tab displays details about each identified phosphopeptides. A phosphopeptide is a merge of identified pep-tides including phosphorylations and sharing the same unique sequenceLI + MH+mass modification. WARN-ING The sequenceLI stands for a peptide sequence in which all Leucines are converted into Isoleucines. This isrequired because the L and I amino acids has exactly the same mass (see 6.14).
Group ID Group ID of this phosphopeptide
Sub-Group ID Sub-Group of this phosphopeptide (it regroups overlapping peptide sequences)
Phosphopeptide ID Phosphopeptide identifier
SequenceLI Phosphopeptide sequence (warning see 6.14)
Modifs Modification mass
22
6.12 Phosphopeptide mode compar Spectra tab (Fig 20) 6 EXPORTING THE RESULTS
Number of phosphorylations (phosphosites) number of phosphorylation sites in this peptide sequence (observedby the identification engine)
Best Position in sequence The phosphosites position that gives the best peptide E-value
All positions List of all possible phosphosite positions (observed by the identification engine)
Charges List of all possible peptides charges (observed by the identification engine)
MH+ theo Theoretical MH+of this phosphopeptide.
Number of proteins Number of protein identified with this phosphopeptide.
Number of spectra Number of spectra identifying this phosphopeptide.
Figure 19: phosphopeptides results
6.12 Phosphopeptide mode compar Spectra tab (Fig 20)
This tab displays the number of spectra identifying phosphoislands by sample. This is convenient to have anidea of the phosphorylation rate of phosphoislands between samples.
Group ID Group ID of this phosphoisland
Sub-Group ID Sub-Group of this phosphoisland
Top PhosphoIsland ID PhosphoIsland identifier : the first in this subgroup
Top PhosphoIsland protein PhosphoIsland’s protein description
Positions PhosphoIsland’s phosphorylation site positions in this protein
Number of proteins number of proteins in this subgroup
sample names columns one column for each sample containing the number of assigned spectra per phosphoisland
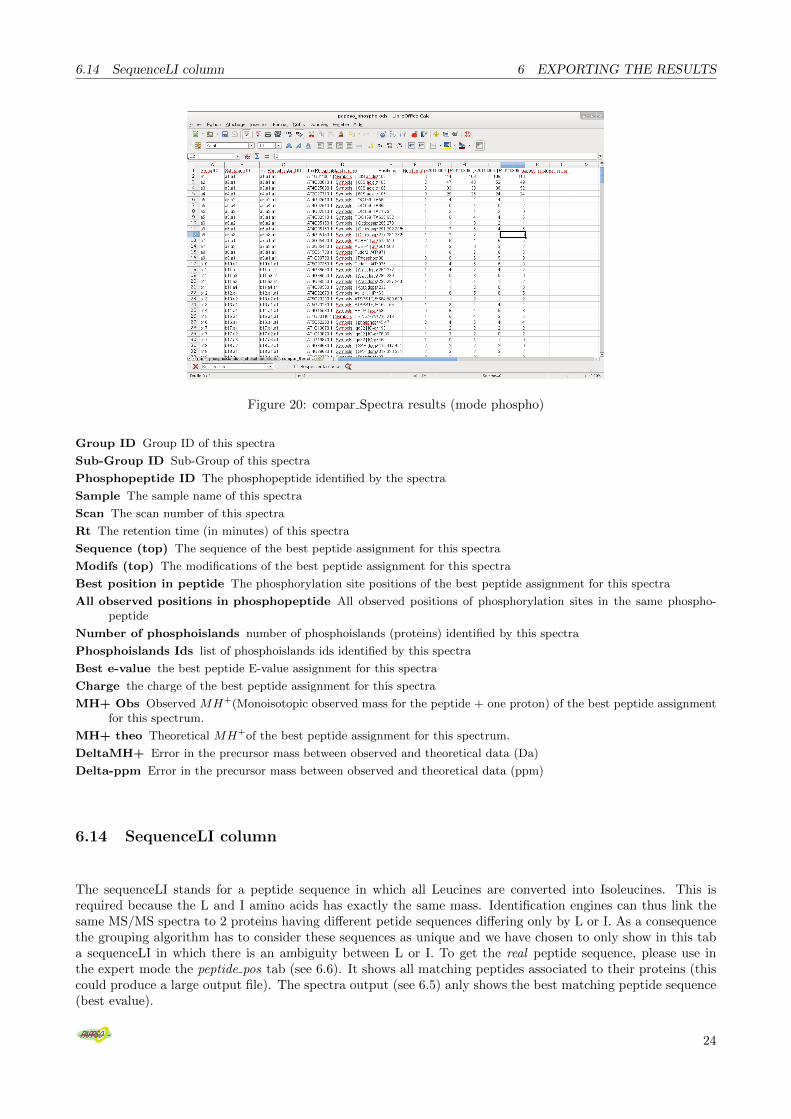
6.13 Phosphopeptide mode Spectra tab (Fig 21)
This tab displays details about each spectra (scan number in a particular sample) identifying a phosphorylatedpeptide. Only available if the expert output was chosen.
23
6.14 SequenceLI column 6 EXPORTING THE RESULTS
Figure 20: compar Spectra results (mode phospho)
Group ID Group ID of this spectra
Sub-Group ID Sub-Group of this spectra
Phosphopeptide ID The phosphopeptide identified by the spectra
Sample The sample name of this spectra
Scan The scan number of this spectra
Rt The retention time (in minutes) of this spectra
Sequence (top) The sequence of the best peptide assignment for this spectra
Modifs (top) The modifications of the best peptide assignment for this spectra
Best position in peptide The phosphorylation site positions of the best peptide assignment for this spectra
All observed positions in phosphopeptide All observed positions of phosphorylation sites in the same phospho-peptide
Number of phosphoislands number of phosphoislands (proteins) identified by this spectra
Phosphoislands Ids list of phosphoislands ids identified by this spectra
Best e-value the best peptide E-value assignment for this spectra
Charge the charge of the best peptide assignment for this spectra
MH+ Obs Observed MH+(Monoisotopic observed mass for the peptide + one proton) of the best peptide assignmentfor this spectrum.
MH+ theo Theoretical MH+of the best peptide assignment for this spectrum.
DeltaMH+ Error in the precursor mass between observed and theoretical data (Da)
Delta-ppm Error in the precursor mass between observed and theoretical data (ppm)
6.14 SequenceLI column
The sequenceLI stands for a peptide sequence in which all Leucines are converted into Isoleucines. This isrequired because the L and I amino acids has exactly the same mass. Identification engines can thus link thesame MS/MS spectra to 2 proteins having different petide sequences differing only by L or I. As a consequencethe grouping algorithm has to consider these sequences as unique and we have chosen to only show in this taba sequenceLI in which there is an ambiguity between L or I. To get the real peptide sequence, please use inthe expert mode the peptide pos tab (see 6.6). It shows all matching peptides associated to their proteins (thiscould produce a large output file). The spectra output (see 6.5) anly shows the best matching peptide sequence(best evalue).
24
6.15 Files *fdr.txt 6 EXPORTING THE RESULTS
Figure 21: Spectra results (mode phospho)
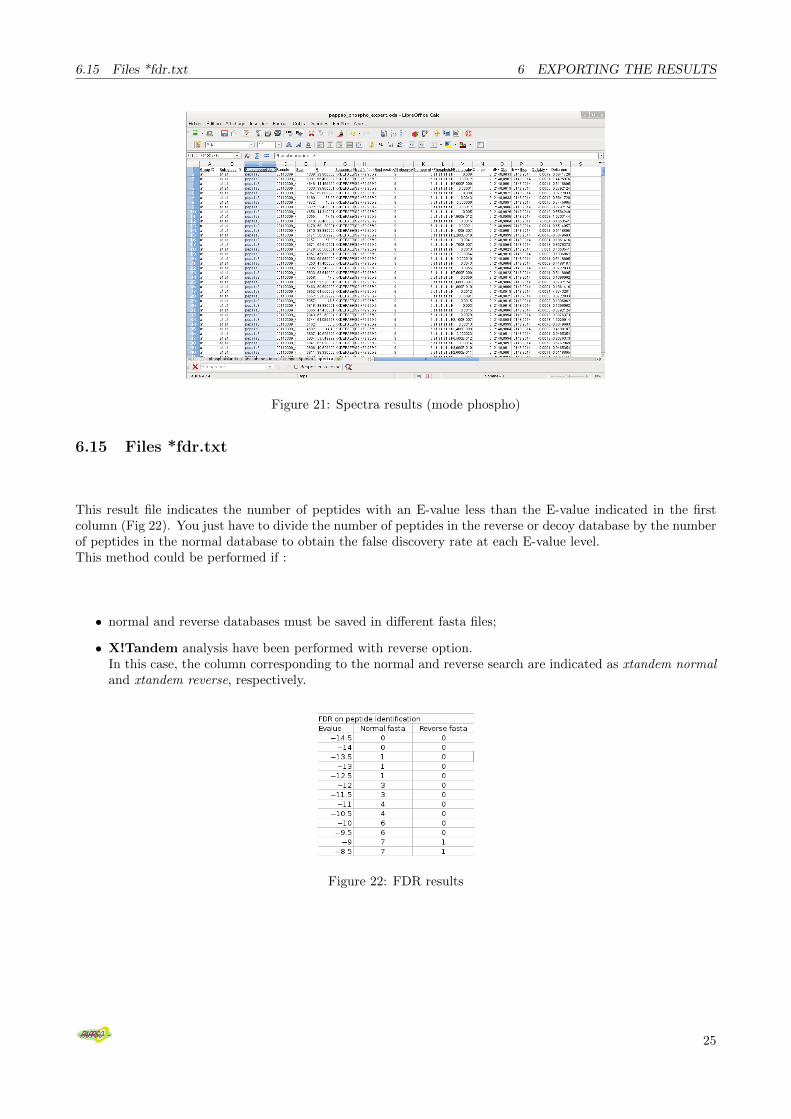
6.15 Files *fdr.txt
This result file indicates the number of peptides with an E-value less than the E-value indicated in the firstcolumn (Fig 22). You just have to divide the number of peptides in the reverse or decoy database by the numberof peptides in the normal database to obtain the false discovery rate at each E-value level.This method could be performed if :
• normal and reverse databases must be saved in different fasta files;
• X!Tandem analysis have been performed with reverse option.In this case, the column corresponding to the normal and reverse search are indicated as xtandem normaland xtandem reverse, respectively.
Figure 22: FDR results
25

7 CHANGELOG
7 Changelog
7.1 ”Myosine” branch
3.3.3 Myosine Anabolisee New XML parser giving better informations to the users (line number, columnnumber, filename containing errors). Better support for high performance clusters throught HTCondor.BUG FIX in the “peptide pos” tab of the spreadsheet output in expert mode : only the first protein ineach subgroup was displayed.
3.3.2 Myosine Chargee Better performances. New ODS output featuring complete summary of MS identi-fication runs. Updated documentation.
3.3.1 Myosine Famelique Better performances. Problems concerning the PAI computation by samples arefixed. Updated documentation.
3.3.0 Myosine Rachitique Grouping of sub-group has been changed for better performances and to fix over-grouping on large datasets (thanks to M. Blein)If you have a very large dataset, we recommand to reload xtandem results to fix errors.
7.2 ”Tubuline” branch
3.2.2 Tubuline Etayee Corrected report of input parameter on X!Tandem output result (thanks to T. Greko).
3.2.1 Tubuline Etayee Add new X!Tandem paramaters for multiple search of modifications in one analyseand calculation can now be performed on z ¿ 3.
3.2.0 Tubuline Squelettique Identification from Mascot dat file can now be imported and filtered. All workas X!Tandem result excepts that protein sequence can not be retrieved : PAI and coverage are absent.Correction of FDR calculation from Reverse/Decoy search.
7.3 ”Keratine” branch
3.1.5 Keratine Moustachue Add support of phosphorylation neutral loss and enhanced ETD detection onMS2 spectra.Correction of MassChroQ export.
3.1.4 Keratine Poilue Add support for viewving ETD spectra after automatic detection.
3.1.3 Keratine Chevelue Corrected bug of xtandem preset. Refine analysis was never start instead refineparam is set to yes.Adds a new annotated spectrum renderer and bug fix on ODS export.
3.1.2 Add export results on Open Document Spreadsheet (.ods) file.Correction of bugs (Grouping, PepNovo export, ...).
3.1.1 FDR computation are now compatible with reverse option of X!Tandem.
3.1.0 Algorithm of grouping have been completly rewritten :
26

7.3 ”Keratine” branch 7 CHANGELOG
• Older project must be refiltered to be properly grouped.
• Phosphopeptide filtering have been enhanced to correspond to :
– SubGroup represents the number of phosphosites
– Group represents the number of phosphoproteins
• Configuration file have been modified and must be parameter again
27