xps process mineralogy- xstrata process support … · footwall cu ore to take of ad- ... grade...
TRANSCRIPT

To Contact Us: Dominic Fragomeni Manager Process Mineralogy Group Phone: +1 705 699 3400 ext. 3492 [email protected]
www.xstrataprocesssupport.com Page 4
XPS Case Study Process Mineralogy- Xstrata Process Support Winter 2010
XPS Centre
Strathcona Retrofit Flowsheet development then moved to a Strathcona Mill Ret-rofit option rather than a new concentrator. The geometallur-gical unit definition was critical in defining a flowsheet that would afford flexibility without sacrific-ing metallurgical performance. A Cu Pre-float option was intro-duced to allow for varied Con-tact and Footwall tonnage rates and limit the metal losses to the pyrrhotite tailings (Figure 7). This flowsheet also allows for a tailored grinding strategy for Footwall Cu ore to take of ad-vantage of the coarse grains(Table 2).
Mini-Pilot Plant Testing A series of MPP campaigns were completed for a total of 7 differ-ent ores and blends, and all flow-sheet concepts were investigated over 2 separate 1 week, 24 hour/day campaigns. The samples were primarily drill core from surface drilling and totalled only 5 tonnes of sample material. The blends were prepared according to the resource model available at the time of sampling.
Plant Implementation The metallurgical program, sup-ported by quantitative minera-logical data, recommended three
retrofits to the concentrator, all of which have been implemented in preparation for full commercial production in 2010. 1. The inclusion of the Cu pre-
float, designed to limit Ni and Cu losses to the pyr-rhotite tailing when process-ing blends.
2. The introduction of a CMC system, which effectively deals with Mg-bearing Sublayer breccia ores.
3. Additional Cu/Ni separation capacity to allow for over 80% Cu recovery to Cu con-centrate and significant in-crease in Footwall ore ton-nage rates.
The Geometallurgical unit defini-tion, lab scale flotation testwork, piloting and design basis were performed using exploration drill core and were essentially com-plete nearly 2 years before the mine commercial production. This has allowed for engineering and implementing of retrofits at the Strathcona Mill and the re-sulting flexibility and recovery gains forecast. Figure 7: Schematic Flowsheet for Footwall/Contact Blend with Cu Pre-Float.
Table 2: Comparison of Recoveries with and without Cu Pre-Float.
Ore Blend (Contact/Footwall)Ni Recovery Cu Recovery Ni Recovery Cu Recovery Ni Recovery Cu Recovery
50/50 85.0 97.4 79.1 95.4 5.9 2.025/75 89.8 98.4 88.0 97.1 1.7 1.3
With Cu Pre-float Without Cu Pre-float Difference
Footwall Ore Contact Ore
Cu Pre-float ConcPri Ro Conc
Sec Ro Conc
Scav Conc
Scav Tails
P56 75µm P56 75µm
Process Diagnosis At Nickel Rim South
Page 1
Winter 2010
“Adding value...Reducing risk” www.xstrataprocesssupport.com
Process Mineralogy- Xstrata Process Support
CASE STUDY Presented at the 42nd Annual Meeting of the Canadian Mineral Processors
Nickel Rim South (NRS), a high grade copper-nickel-PGE de-posit with total reserves (Proven and Probable) of 9.6 Mtonnes at 1.57 % Ni, 2.85 % Cu, 1.20 g/t Pt, 1.35 g/t Pd, 10.20 g/t Ag, and 0.46 g/t Au (Xstrata Nickel, 2009), is located in the Sudbury region, approximately 400 km north of Toronto, On-tario, Canada. During the ex-ploration drilling phase several options were identified for processing of the ore: construc-tion of a new concentrator; processing of the ores through the existing Strathcona concen-trator or retrofitting the Strath-cona flowsheet to provide im-proved performance. The met-allurgical program was de-signed to test all of these op-tions in the context of on-going exploration drilling, resource definition and economic analy-sis.
Geology, Mineralogy and Geometallurgical Unit
Definition Mineralisation in the NRS de-posit results in several unique ore types or geometallurgical units (Figure 1), which were expected to show different metallurgical responses. Six distinct geometallurgical units were defined based on their mineralogical characteris-tics. These include: Footwall Main (Core), Footwall Upper, Fringe, Low Sulphur PGE, Con-tact Sublayer Breccia and Con-tact Footwall Breccia. Figure 2 shows typical textures from the geometallurgical units, as im-aged by QEMSCAN. The scale of each image is approximately 3.5 mm x 3.5 mm. Images show that the Main Footwall and Upper Footwall textures are coarsest. Sulphide textures in all other geometallurgical units are finer grained and more commonly associated with sili-cate gangue.
Upper Footwall Miner-
alization
Figure 1: Nickel Rim South Schematic Cross-Section Looking Northwest.
Pentlandite
Chalcopyrite
Bornite
Pyrrhotite
Feldspar
Quartz
Chlorite
Pyroxene
Magnetite
Figure 2: Geometallurgical Unit Tex-tures as measured by QEMSCAN.
Main Footwall
Upper Footwall
Fringe Footwall
Low Sulphur PGM
Contact Sublayer Breccia
Contact Footwall Breccia
“Adding Value… Reducing Risk” www.xstrataprocesssupport.com Page 2
XPSbulletinProcess Mineralogy XPS Case Study
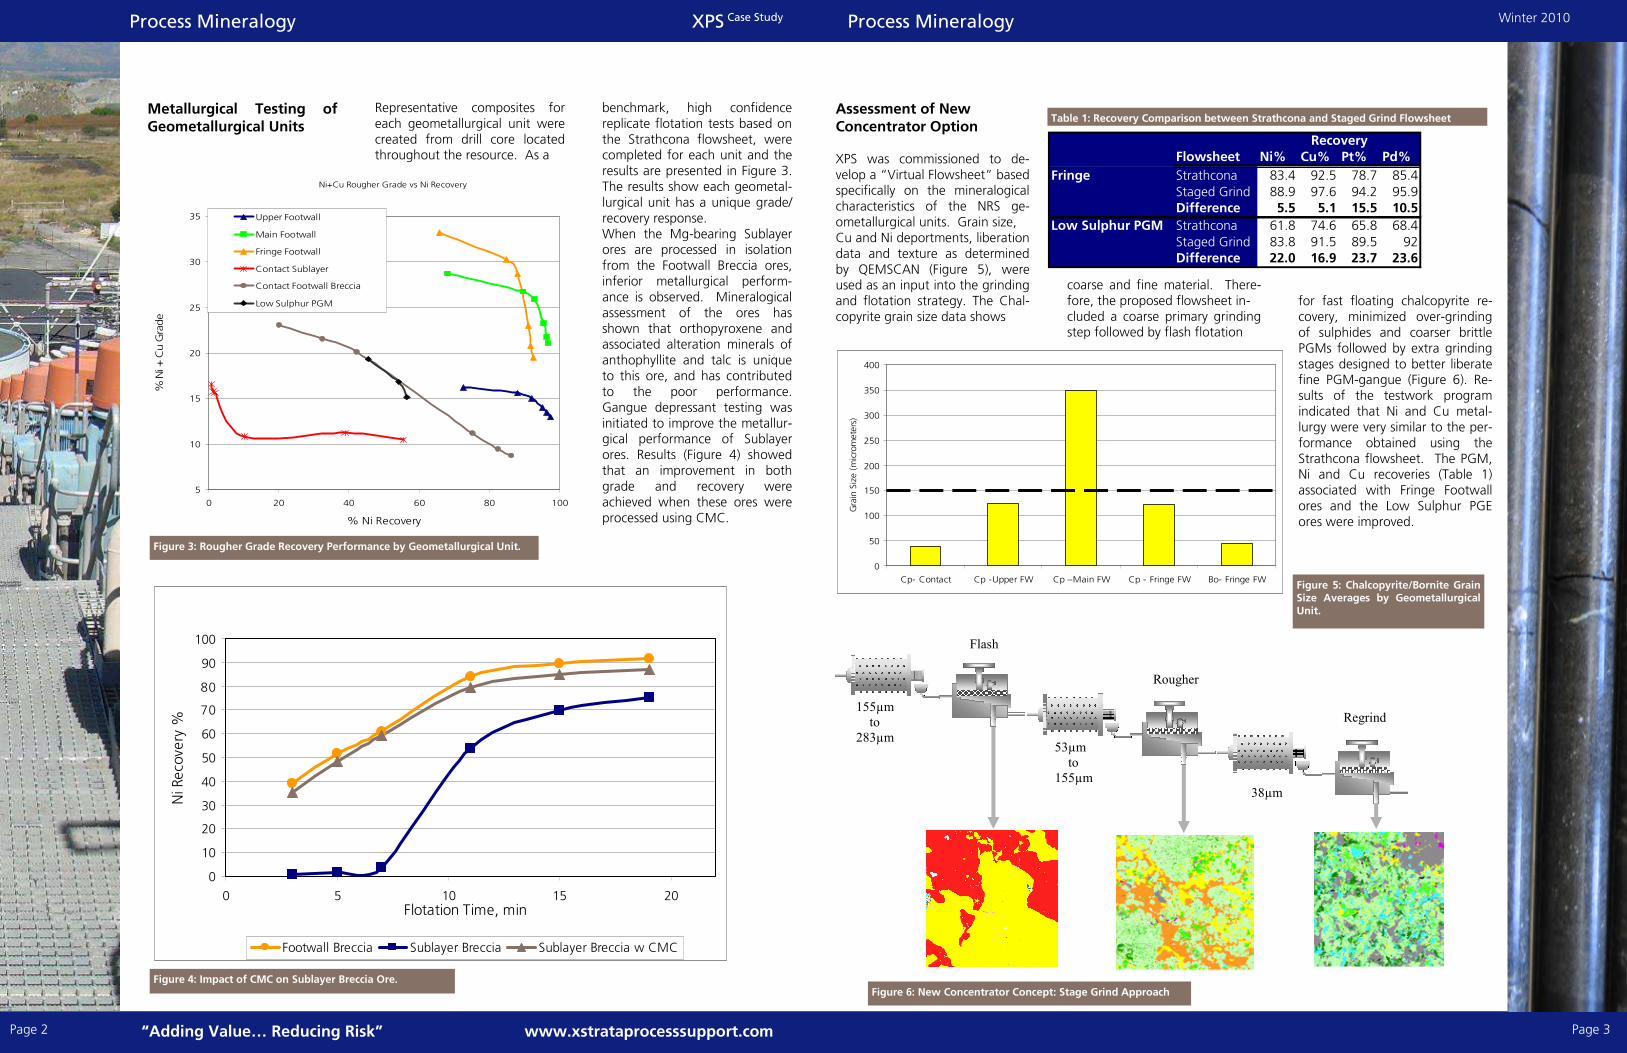
Metallurgical Testing of Geometallurgical Units
Representative composites for each geometallurgical unit were created from drill core located throughout the resource. As a
benchmark, high confidence replicate flotation tests based on the Strathcona flowsheet, were completed for each unit and the results are presented in Figure 3. The results show each geometal-lurgical unit has a unique grade/recovery response. When the Mg-bearing Sublayer ores are processed in isolation from the Footwall Breccia ores, inferior metallurgical perform-ance is observed. Mineralogical assessment of the ores has shown that orthopyroxene and associated alteration minerals of anthophyllite and talc is unique to this ore, and has contributed to the poor performance. Gangue depressant testing was initiated to improve the metallur-gical performance of Sublayer ores. Results (Figure 4) showed that an improvement in both grade and recovery were achieved when these ores were processed using CMC. Figure 3: Rougher Grade Recovery Performance by Geometallurgical Unit.
Figure 4: Impact of CMC on Sublayer Breccia Ore.
Ni+Cu Rougher Grade vs Ni Recovery
5
10
15
20
25
30
35
0 20 40 60 80 100
% Ni Recovery
% Ni + Cu Grade
Upper Footwall
Main Footwall
Fringe Footwall
Contact Sublayer
Contact Footwall Breccia
Low Sulphur PGM
0
10
20
30
40
50
60
70
80
90
100
0 5 10 15 20Flotation Time, min
Ni Recovery %
Footwall Breccia Sublayer Breccia Sublayer Breccia w CMC
Page 3
Winter 2010 Process Mineralogy
Assessment of New Concentrator Option XPS was commissioned to de-velop a “Virtual Flowsheet” based specifically on the mineralogical characteristics of the NRS ge-ometallurgical units. Grain size, Cu and Ni deportments, liberation data and texture as determined by QEMSCAN (Figure 5), were used as an input into the grinding and flotation strategy. The Chal-copyrite grain size data shows
coarse and fine material. There-fore, the proposed flowsheet in- cluded a coarse primary grinding step followed by flash flotation
for fast floating chalcopyrite re-covery, minimized over-grinding of sulphides and coarser brittle PGMs followed by extra grinding stages designed to better liberate fine PGM-gangue (Figure 6). Re-sults of the testwork program indicated that Ni and Cu metal-lurgy were very similar to the per-formance obtained using the Strathcona flowsheet. The PGM, Ni and Cu recoveries (Table 1) associated with Fringe Footwall ores and the Low Sulphur PGE ores were improved.
Figure 6: New Concentrator Concept: Stage Grind Approach
Figure 5: Chalcopyrite/Bornite Grain Size Averages by Geometallurgical Unit.
Table 1: Recovery Comparison between Strathcona and Staged Grind Flowsheet
Flowsheet Ni% Cu% Pt% Pd%
Fringe Strathcona 83.4 92.5 78.7 85.4
Staged Grind 88.9 97.6 94.2 95.9Difference 5.5 5.1 15.5 10.5
Low Sulphur PGM Strathcona 61.8 74.6 65.8 68.4
Staged Grind 83.8 91.5 89.5 92Difference 22.0 16.9 23.7 23.6
Recovery
0
50
100
150
200
250
300
350
400
Cp- Contact Cp -Upper FW Cp –Main FW Cp - Fringe FW Bo- Fringe FW
Grain Size (micrometers)
Flash
Rougher
155µm
to
283µm
53µm
to
155µm
38µm
Regrind

To Contact Us: Dominic Fragomeni Manager Process Mineralogy Group Phone: +1 705 699 3400 ext. 3492 [email protected]
www.xstrataprocesssupport.com Page 4
XPS Case Study Process Mineralogy- Xstrata Process Support Winter 2010
XPS Centre
Strathcona Retrofit Flowsheet development then moved to a Strathcona Mill Ret-rofit option rather than a new concentrator. The geometallur-gical unit definition was critical in defining a flowsheet that would afford flexibility without sacrific-ing metallurgical performance. A Cu Pre-float option was intro-duced to allow for varied Con-tact and Footwall tonnage rates and limit the metal losses to the pyrrhotite tailings (Figure 7). This flowsheet also allows for a tailored grinding strategy for Footwall Cu ore to take of ad-vantage of the coarse grains(Table 2).
Mini-Pilot Plant Testing A series of MPP campaigns were completed for a total of 7 differ-ent ores and blends, and all flow-sheet concepts were investigated over 2 separate 1 week, 24 hour/day campaigns. The samples were primarily drill core from surface drilling and totalled only 5 tonnes of sample material. The blends were prepared according to the resource model available at the time of sampling.
Plant Implementation The metallurgical program, sup-ported by quantitative minera-logical data, recommended three
retrofits to the concentrator, all of which have been implemented in preparation for full commercial production in 2010. 1. The inclusion of the Cu pre-
float, designed to limit Ni and Cu losses to the pyr-rhotite tailing when process-ing blends.
2. The introduction of a CMC system, which effectively deals with Mg-bearing Sublayer breccia ores.
3. Additional Cu/Ni separation capacity to allow for over 80% Cu recovery to Cu con-centrate and significant in-crease in Footwall ore ton-nage rates.
The Geometallurgical unit defini-tion, lab scale flotation testwork, piloting and design basis were performed using exploration drill core and were essentially com-plete nearly 2 years before the mine commercial production. This has allowed for engineering and implementing of retrofits at the Strathcona Mill and the re-sulting flexibility and recovery gains forecast. Figure 7: Schematic Flowsheet for Footwall/Contact Blend with Cu Pre-Float.
Table 2: Comparison of Recoveries with and without Cu Pre-Float.
Ore Blend (Contact/Footwall)Ni Recovery Cu Recovery Ni Recovery Cu Recovery Ni Recovery Cu Recovery
50/50 85.0 97.4 79.1 95.4 5.9 2.025/75 89.8 98.4 88.0 97.1 1.7 1.3
With Cu Pre-float Without Cu Pre-float Difference
Footwall Ore Contact Ore
Cu Pre-float ConcPri Ro Conc
Sec Ro Conc
Scav Conc
Scav Tails
P56 75µm P56 75µm
Process Diagnosis At Nickel Rim South
Page 1
Winter 2010
“Adding value...Reducing risk” www.xstrataprocesssupport.com
Process Mineralogy- Xstrata Process Support
CASE STUDY Presented at the 42nd Annual Meeting of the Canadian Mineral Processors
Nickel Rim South (NRS), a high grade copper-nickel-PGE de-posit with total reserves (Proven and Probable) of 9.6 Mtonnes at 1.57 % Ni, 2.85 % Cu, 1.20 g/t Pt, 1.35 g/t Pd, 10.20 g/t Ag, and 0.46 g/t Au (Xstrata Nickel, 2009), is located in the Sudbury region, approximately 400 km north of Toronto, On-tario, Canada. During the ex-ploration drilling phase several options were identified for processing of the ore: construc-tion of a new concentrator; processing of the ores through the existing Strathcona concen-trator or retrofitting the Strath-cona flowsheet to provide im-proved performance. The met-allurgical program was de-signed to test all of these op-tions in the context of on-going exploration drilling, resource definition and economic analy-sis.
Geology, Mineralogy and Geometallurgical Unit
Definition Mineralisation in the NRS de-posit results in several unique ore types or geometallurgical units (Figure 1), which were expected to show different metallurgical responses. Six distinct geometallurgical units were defined based on their mineralogical characteris-tics. These include: Footwall Main (Core), Footwall Upper, Fringe, Low Sulphur PGE, Con-tact Sublayer Breccia and Con-tact Footwall Breccia. Figure 2 shows typical textures from the geometallurgical units, as im-aged by QEMSCAN. The scale of each image is approximately 3.5 mm x 3.5 mm. Images show that the Main Footwall and Upper Footwall textures are coarsest. Sulphide textures in all other geometallurgical units are finer grained and more commonly associated with sili-cate gangue.
Upper Footwall Miner-
alization
Figure 1: Nickel Rim South Schematic Cross-Section Looking Northwest.
Pentlandite
Chalcopyrite
Bornite
Pyrrhotite
Feldspar
Quartz
Chlorite
Pyroxene
Magnetite
Figure 2: Geometallurgical Unit Tex-tures as measured by QEMSCAN.
Main Footwall
Upper Footwall
Fringe Footwall
Low Sulphur PGM
Contact Sublayer Breccia
Contact Footwall Breccia