xport opportunity surveys - epublications th koeln · organic black tea in germany and the united...
TRANSCRIPT

EOS Series
EXPORT OPPORTUNITY SURVEYS
The Market for
Organic Black Tea in
Germany and the United
States
EOS Research Paper 2/2016
May 2016

I
Table of Contents
Table of contents ..................................................................................................... I
Authors and contact persons ............................................................................... III
List of figures ......................................................................................................... IV
List of tables ............................................................................................................ V
List of abbreviations .............................................................................................. VI
Executive summary ................................................................................................ 1
1. Product description ......................................................................................... 2
2. Production, foreign trade &consumption ....................................................... 4
Production ............................................................................................................. 4
Foreign trade ......................................................................................................... 5
German and US trade ........................................................................................... 6
Apparent consumption ......................................................................................... 10
3. Market characteristics ................................................................................... 11
Germany ............................................................................................................. 11
The United States ................................................................................................ 12
4. Market access ................................................................................................ 15
Tariffs .................................................................................................................. 15
Standards and regulations ................................................................................... 15
Non-tariff barriers ................................................................................................ 16
5. Prices .............................................................................................................. 17
Producer prices ................................................................................................... 17
Import prices ....................................................................................................... 17
Wholesale prices ................................................................................................. 18
Retail prices ........................................................................................................ 18
Value chain ......................................................................................................... 19
6. Distribution channels .................................................................................... 22
7. Commercial practices .................................................................................... 25
Germany ............................................................................................................. 25
The United States ................................................................................................ 26
8. Packaging and labeling ................................................................................. 27

II
Packaging ........................................................................................................... 27
Labeling............................................................................................................... 28
9. Sales promotion ............................................................................................. 31
Trade fairs and exhibitions .................................................................................. 31
Trade magazines ................................................................................................. 34
Associations ........................................................................................................ 35
10. Market prospects ......................................................................................... 36
Germany ............................................................................................................. 36
The United States ................................................................................................ 37
Annex ..................................................................................................................... 41
Annex 1: Selected potential importers ................................................................ 41
References ............................................................................................................ 44

III
Authors and contact persons
This market research paper has been prepared under the supervision of Prof. Dr. Wolfgang
Veit of TH Köln - University of Applied Sciences and Prof. Dr. Carol Scovotti of University
of Wisconsin-Whitewater in the course of the inter-university cross-border collaboration
student research project “Export Opportunity Surveys (EOS)”. The respective authors are
responsible for the content of their own texts.
Authors
Broghammer, Sandra, TH Köln - University of Applied Sciences
Comini, Agnese, TH Köln - University of Applied Sciences
Cooray, Sonali, TH Köln - University of Applied Sciences
Foitzik, Ana, TH Köln - University of Applied Sciences
Sze, Wei Lin, TH Köln - University of Applied Sciences
Ma, Elena Ailin, TH Köln - University of Applied Sciences
Pale Bautista, Zulma, TH Köln - University of Applied Sciences
Sagstetter, Thomas, University of Wisconsin-Whitewater
Sampson, Megan, University of Wisconsin-Whitewater
Contact persons
Prof. Dr. Wolfgang Veit Prof. Dr. Carol Scovotti
TH Köln - University of Applied Sciences University of Wisconsin-Whitewater
Schmalenbach School of Business and Economics Department of Marketing
Phone: +49 221 8275 3420 Phone: +1 262 472 5469
E-Mail: [email protected] E-Mail: [email protected]

IV
List of figures
Figure 1: Prices of production in US$/ t (2004 - 2010)............................................................ 17
Figure 2: Import prices in Germany and US (2005 - 2014) ..................................................... 18
Figure 3: Breakdown of retail price along the value chain for fair trade organic tea .............. 20
Figure 4: Example of the breakdown of retail price along the value chain for fair trade
organic tea from China in Germany ........................................................................................ 20
Figure 5: Tea export supply chain ........................................................................................... 22
Figure 6: Organic label ‘Bio-Siegel’ additionally for the German market ................................ 28
Figure 7: Organic label ‘EU-Bio-Logo’ for the EU market ....................................................... 28
Figure 8: Organic label ‘USDA organic seal’ for the US market ............................................. 29

V
List of tables
Table 1: Top 10 producers of tea in tons in 2013 ..................................................................... 4
Table 2: Top 10 countries exporting black tea (2010 - 2014) ................................................... 5
Table 3: Value/ tt of top 10 countries exporting black tea (2010 – 2014) ................................. 5
Table 4: Top 10 countries importing black tea (2010 - 2014) ................................................... 6
Table 5: Value/ tt of top 10 countries importing black tea (2010 – 2014) ................................. 6
Table 6: Top 10 countries exporting black tea to Germany (2010 - 2014) ............................... 7
Table 7: Value / tt of top 10 countries exporting black tea to Germany (2010 – 2014) ............ 7
Table 8: Top 10 countries exporting black tea to US (2010 - 2014) ......................................... 8
Table 9: Value / tt of top 10 countries exporting black tea to USA (2010 – 2014) ................... 8
Table 10: Top 10 countries importing black tea from Germany (2010 - 2014) ......................... 9
Table 11: Value / tt of top 10 countries importing black tea from Germany ............................. 9
Table 12: Top 10 countries importing black tea from US (2010 - 2014) ................................... 9
Table 13: Value / tt of top 10 countries importing black tea from USA (2010 – 2014) ........... 10
Table 14: Estimated consumption of black tea from US and Germany (2010 - 2014) ........... 10
Table 15: Maximum residue limits for tea, green, black (black, fermented and dried) ........... 16
Table 16: Comparison of the German and US labeling requirements .................................... 30

VI
List of abbreviations
B2B Business to Business
BLF Bought Leaf Factories
BMEL Bundesministerium für Ernährung und Landwirtschaft
BÖWL Bund Ökologische Lebensmittelwirtschaft
CBI Centrum Bevordering Import (Netherlands)
CFR Code of Federal Regulations
CIF Cost insurance freight
CTC Crush, Tear, Curl
CAGR Compound Annual Growth Rate
DeLeA Deutsche Lebensart
DM dm-drogerie markt
EC European Commission
e.g. for example
EU European Union
EXW EX WORKS
€ Euro
FAO Food and Agricultural Organization
FAOSTAT Food and Agriculture Organization Corporate Statistical Database
FDA Food and Drug Organization
FOB Free on board
GMO genetically modified organisms
GSP General System of Preferences
HS Harmonized Commodity Description and Coding System
IDH the sustainable trade initiative
IFOAM International Federation of Organic Agriculture Movements
ISO International Organization for Standardization
kg kilogram
lb pound
LMIV Lebensmittel-Informationsverordnung

VII
MFN Most Favored Nation
mm millimeter
MRLs Maximum Residue Limits
P/ I Proforma Invoice
SITC Standard International Trade Classification
t ton
tt thousand tons
TCC Tropical Commodity Coalition
TIS Transport Information Service
US United States
US$ United States Dollar
USDA United States Department of Agriculture
WTO World Trade Organization
1
Executive summary
Tea is one of the most popular beverages in the world. It is also considered a very
healthy beverage and can be consumed either hot or cold. Tea is mainly produced in
China and India, however the top exporter of black tea is Sri Lanka.
Since organic black tea has been gaining popularity over the past decade, this report
analyzes the market entry opportunities for the German and US markets for this
specific type of tea.
In the US, consumption of iced tea has been increasing and black tea is preferred over
green tea. However, there is no demand for organic black tea. US consumers are
mostly young and health conscious. In Germany, there is an increasing demand for
organic products, especially beverages. Consumers are shifting from elderly to
younger generations. The younger consumers expect organic, fair trade and
sustainable products which support the local producers.
In both markets competition is rising, which results in unchanged retail prices. Neither
the German nor US market have tariffs, quotas, or restrictions on the import of black
tea and are therefore fairly easy to enter.
The tea supply chain is characterized by a very strong vertical integration by just a few
multinational companies. Specific transport and storage conditions are essential to
guarantee the quality of the tea. The distribution channels are quite similar in Germany
and the US. In Germany, organic black tea is mostly sold by discounters and other
grocery retailers, whereas in the US, tea can be bought in conventional supermarkets
and natural product retailers.
Tea is sold worldwide through auctions or directly by the producer. The ways of
contacting a producer are diverse, including telephone, trade fairs, and online
business-to-business marketplaces. Trade agreements are recommended to be
included in a written contract between the business partners.
The market prospects for organic black tea tend to be very positive in both markets,
due to an increasing demand for organic and specialty tea. In the near future, the
challenge will be to offer even higher quality tea and tea with different tastes and
varieties.

2
1. Product description
This export opportunity survey is intended for exporters interested in selling organic
black tea in the German and US markets. It covers the market for tea, classified under
the following codes:
● HS Code: 090230 – Black tea (fermented) and partly fermented tea, in
immediate packing of content not exceeding 3 kg (661 lb.).
● HS Code: 090240 – Other black tea (fermented) and other partly fermented tea.
● SITC Code: 074.13 – Black tea (fermented) and partly fermented tea, in
immediate packing of a content not exceeding 3 kg (661 lb.), whether or not
flavored.
● SITC Code: 074.14 – Other black tea (fermented) and other partly fermented
tea, whether or not flavored.
Tea is the result of processed leaves of the evergreen shrub, Camelia sinensis, which
can grow between 300 and 2000 meters (984 and 6,561 feet) above sea level and has
a better flavor when it is grown at a higher elevation. Temperature and rainfall are also
important. The best temperatures for growth range from 10 to 24˚C (50 to 75˚F) and
rainfall should be about 2 to 2.3 meters (6.5 to 7.5 feet) a year. Although these figures
may be ideal conditions for the growth of tea leaves, tea can grow well with less rain
too (Saberi, 2010).
Tea flavors and qualities can differ according to the variety and the way the leaves are
treated. Camellia sinensis comes in 2 primary varieties. First, the Camellia sinensis
from China (Camellia sinensis var. sinensis) is usually a small leaved bush, which
produces a delicate tea and has a height of 1 to 3 meters (3.2 to 9.8 feet). Second,
the Camellia sinensis (Camellia sinensis var. assamica), native to the Assam region
in India, comes from a small tree with large leaves, which produces a strong earthy
flavor. These varieties are cultivated many times and used to make hybrids. The
different climate and soil conditions result in the creation of a wide selection of teas
with different tastes and flavors across the world (Saberi, 2010).
There are six types of tea leaves: white, yellow, green, oolong, black, and pu’er. Tea
grading determines the quality of the tea leaves and eventually the treatment of the
leaves. Black tea is graded on a 4-point scale of quality. Whole leaf teas are
considered the most valuable and of the highest quality, followed by broken leaves,
fannings, and dusts. Broken leaves are sold as medium grade teas and are commonly
contained in tea bags. Fannings are the remains of the production of the larger tea
varieties.

3
Lastly, dusts are the finest tea particles left over from the production. Fannings and
dusts are usually contained in tea bags as it allows easy diffusion of the tea. These
kinds of teas also have a darker color and stronger flavor when brewed (Saberi, 2010).
The processing phases of the tealeaves are generally picking, withering, rolling, drying
and grading (Measurement and Control in food processing, Manabendra Bhuyan,
Taylor and & Francis, 2007, p. 9). Black tea differs from the other tea because between
the rolling and the drying phase, the tealeaves are subject also to the phase of
fermentation. Besides the previous mentioned processing, called Orthodox
production, there is a second type of processing in the case of black tea, called CTC
production. After rolling and before fermentation, tealeaves are shredded with a CTC
machine (TIS, 2015).
The largest black tea producing countries include India (Darjeeling and Assam), Sri
Lanka (Ceylon), China, and Kenya.

4
2. Production, foreign trade &consumption
Production
Conventional tea
China is the largest tea producing country with an output of 1.9 million tons, accounting
for 36% of the world's total production, as shown in Table 1. The second largest
producer, India, produced 1.2 million tons in 2013 (FAOSTAT, 2015).
Table 1: Top 10 producers of tea in tons in 2013
Source: FAO STAT (2015)
Organic tea
According to the International Institute of Sustainable Development, 12% of world tea
production, which is equivalent to 557,000 tons of tea, was certified by the major
international voluntary sustainability standards in 2012. The International Federation
of Organic Agricultural Movements (IFOAM) represents close to 800 affiliates in 117
countries. Following IFOAM, a majority of organic tea is produced in China, India, and
Japan, which accounted for 49,192 tons of production in 2011. In 2012, global organic
tea production accounted for 1% of global production and 2% of global exports (Potts,
Lynch, Wilkins, Huppe, Cunningham, & Voora, 2014).
Ranking Producer Quantity
(in t) Percentage
1 China 1,924,457 36%
2 India 1,208,780 23%
3 Kenya 432,400 8%
4 Sri Lanka 340,230 6%
5 Viet Nam 214,300 4%
6 Turkey 212,400 4%
7 Iran 160,000 3%
8 Indonesia 148,100 3%
9 Argentina 105,000 2%
10 Japan 84,800 2%
World 5,345,523
Table 1: Top 10 producers of tea in tons in 2013
Source: FAO STAT, 2015

5
Foreign trade
As the trade data for organic black tea is limited, interference on the market share of
organic black tea from the data for regular black tea (HS Code: 090230 and 090240)
is made. As mentioned above, 2% of global exports are organic tea and hence, it is
assumed that 1% - 2% of the quantity of black tea is organic.
World exports
India and Sri Lanka, which are the 2nd and 4th largest producers of black tea
respectively, are also the top exporters of black tea worldwide. Sri Lanka exported
over 32.18% of black tea in 2014.
Table 2: Top 10 countries exporting black tea (2010 - 2014)
Source: UN Comtrade (2015)
Table 3: Value/ tt of top 10 countries exporting black tea (2010 – 2014)
Source: UN Comtrade (2015)
Qty (in tt)
Trade
Value
(US$mil)
Qty (in tt)
Trade
Value
(US$mil)
Qty (in tt)
Trade
Value
(US$mil)
Qty (in tt)
Trade
Value
(US$mil)
Qty (in tt)
Trade
Value
(US$mil)
Sri Lanka 307.15 1,324.06 315.73 1,428.77 313.30 1,356.33 350.57 1,472.68 319.90 1,554.64
India 214.29 656.42 314.95 836.75 220.62 669.32 250.96 801.40 208.76 642.26
Argentina 84.65 92.71 85.25 102.78 75.75 102.38 75.02 112.62 74.47 110.44
Indonesia 75.70 143.77 65.92 132.40 58.46 119.97 58.70 119.44 54.26 97.09
Malawi 50.00 80.77 45.97 86.23 45.37 69.89 43.23 86.03 47.51 74.27
China 60.90 177.46 57.80 212.38 57.51 234.90 54.44 259.21 46.53 273.03
United Kingdom 27.92 273.29 60.12 221.62 19.52 167.66 20.92 159.21 20.10 128.01
Germany 19.73 136.23 21.64 159.91 19.29 143.97 19.43 159.33 19.04 154.03
Poland 7.98 59.83 11.50 111.99 13.60 138.57 14.78 161.70 17.07 181.45
USA 6.55 47.33 6.39 46.85 7.59 56.40 7.23 66.38 8.38 75.54
World 1,588.28 4,962.13 1,305.46 4,221.96 1,163.08 4,019.44 1,680.52 5,625.20 994.15 4,051.22
20112010
Table 2: Top 10 countries exporting black tea
201420132012
2010 2011 2012 2013 2014
Value / tt
(US$mil)
Value / tt
(US$mil)
Value / tt
(US$mil)
Value / tt
(US$mil)
Value / tt
(US$mil)
Sri Lanka 4.3 4.5 4.3 4.2 4.9
India 3.1 2.7 3.0 3.2 3.1
Argentina 1.1 1.2 1.4 1.5 1.5
Indonesia 1.9 2.0 2.1 2.0 1.8
Malawi 1.6 1.9 1.5 2.0 1.6
China 2.9 3.7 4.1 4.8 5.9
United Kingdom 9.8 3.7 8.6 7.6 6.4
Germany 6.9 7.4 7.5 8.2 8.1
Poland 7.5 9.7 10.2 10.9 10.6
USA 7.2 7.3 7.4 9.2 9.0
World 3.1 3.2 3.5 3.3 4.1
Table 3: Value/ tt of top 10 countries exporting black tea
6
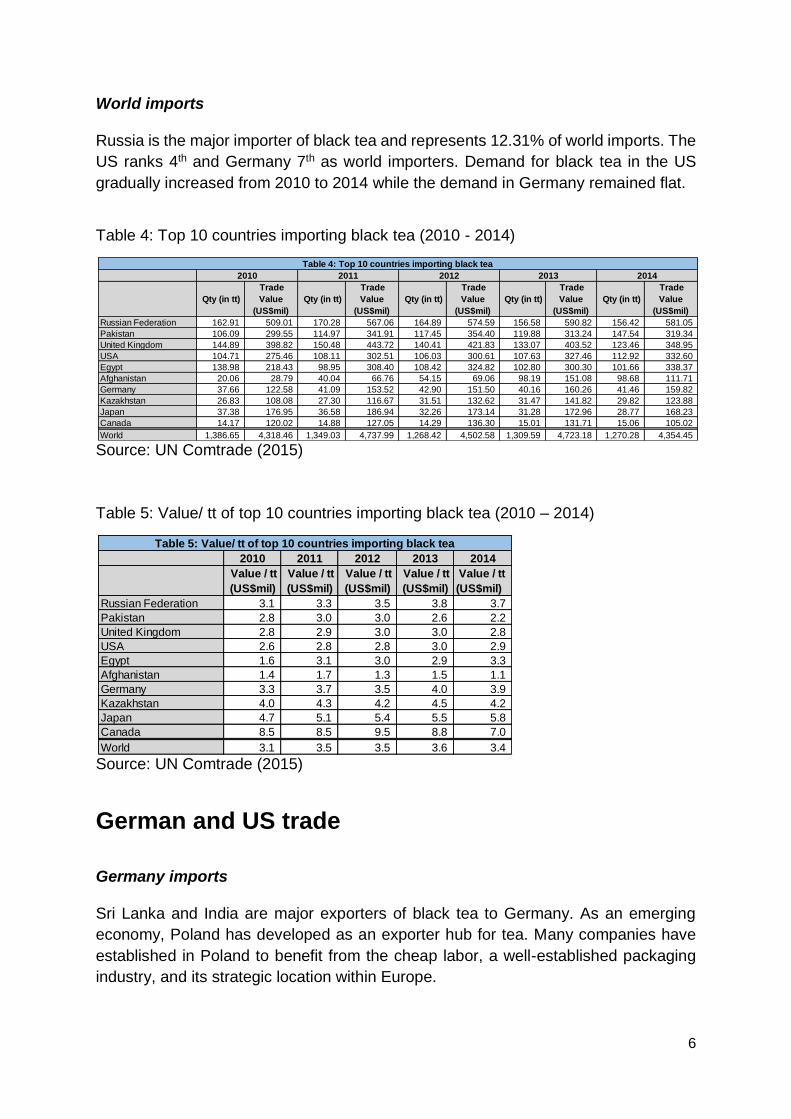
World imports
Russia is the major importer of black tea and represents 12.31% of world imports. The
US ranks 4th and Germany 7th as world importers. Demand for black tea in the US
gradually increased from 2010 to 2014 while the demand in Germany remained flat.
Table 4: Top 10 countries importing black tea (2010 - 2014)
Source: UN Comtrade (2015)
Table 5: Value/ tt of top 10 countries importing black tea (2010 – 2014)
Source: UN Comtrade (2015)
German and US trade
Germany imports
Sri Lanka and India are major exporters of black tea to Germany. As an emerging
economy, Poland has developed as an exporter hub for tea. Many companies have
established in Poland to benefit from the cheap labor, a well-established packaging
industry, and its strategic location within Europe.
Qty (in tt)
Trade
Value
(US$mil)
Qty (in tt)
Trade
Value
(US$mil)
Qty (in tt)
Trade
Value
(US$mil)
Qty (in tt)
Trade
Value
(US$mil)
Qty (in tt)
Trade
Value
(US$mil)
Russian Federation 162.91 509.01 170.28 567.06 164.89 574.59 156.58 590.82 156.42 581.05
Pakistan 106.09 299.55 114.97 341.91 117.45 354.40 119.88 313.24 147.54 319.34
United Kingdom 144.89 398.82 150.48 443.72 140.41 421.83 133.07 403.52 123.46 348.95
USA 104.71 275.46 108.11 302.51 106.03 300.61 107.63 327.46 112.92 332.60
Egypt 138.98 218.43 98.95 308.40 108.42 324.82 102.80 300.30 101.66 338.37
Afghanistan 20.06 28.79 40.04 66.76 54.15 69.06 98.19 151.08 98.68 111.71
Germany 37.66 122.58 41.09 153.52 42.90 151.50 40.16 160.26 41.46 159.82
Kazakhstan 26.83 108.08 27.30 116.67 31.51 132.62 31.47 141.82 29.82 123.88
Japan 37.38 176.95 36.58 186.94 32.26 173.14 31.28 172.96 28.77 168.23
Canada 14.17 120.02 14.88 127.05 14.29 136.30 15.01 131.71 15.06 105.02
World 1,386.65 4,318.46 1,349.03 4,737.99 1,268.42 4,502.58 1,309.59 4,723.18 1,270.28 4,354.45
2010 2011 2012 2013
Table 4: Top 10 countries importing black tea
2014
2010 2011 2012 2013 2014
Value / tt
(US$mil)
Value / tt
(US$mil)
Value / tt
(US$mil)
Value / tt
(US$mil)
Value / tt
(US$mil)
Russian Federation 3.1 3.3 3.5 3.8 3.7
Pakistan 2.8 3.0 3.0 2.6 2.2
United Kingdom 2.8 2.9 3.0 3.0 2.8
USA 2.6 2.8 2.8 3.0 2.9
Egypt 1.6 3.1 3.0 2.9 3.3
Afghanistan 1.4 1.7 1.3 1.5 1.1
Germany 3.3 3.7 3.5 4.0 3.9
Kazakhstan 4.0 4.3 4.2 4.5 4.2
Japan 4.7 5.1 5.4 5.5 5.8
Canada 8.5 8.5 9.5 8.8 7.0
World 3.1 3.5 3.5 3.6 3.4
Table 5: Value/ tt of top 10 countries importing black tea

7
Many companies repack the imported bulk tea into consumer packages (tea bags)
and these are exported from Poland to Western Europe (CBI Market Intelligence,
2015).
Table 6: Top 10 countries exporting black tea to Germany (2010 - 2014)
Source: UN Comtrade (2015)
Table 7: Value / tt of top 10 countries exporting black tea to Germany (2010 – 2014)
Source: UN Comtrade (2015)
The United States imports
Argentina, which ranks 7th in world exporters, is the major contributor of black tea to
the US. Germany exported approximately US$14 million of black tea to the US in 2014,
however the trade value has decreased almost 54% from 2010.
Qty (in tt)
Trade
Value
(US$mil)
Qty (in tt)
Trade
Value
(US$mil)
Qty (in tt)
Trade
Value
(US$mil)
Qty (in tt)
Trade
Value
(US$mil)
Qty (in tt)
Trade
Value
(US$mil)
Sri Lanka 5.80 24.06 6.32 30.43 5.81 25.17 8.54 31.15 6.61 31.61
India 9.80 28.43 7.31 38.61 6.18 32.88 7.98 42.44 6.58 31.79
Belgium 3.09 11.73 3.52 13.98 3.79 13.91 3.90 15.92 4.50 17.79
China 1.93 5.86 2.59 8.60 2.71 10.00 2.87 11.62 3.44 12.29
Argentina 2.59 3.42 1.90 2.66 2.52 4.04 1.68 2.81 2.59 4.65
Indonesia 5.26 8.10 4.40 7.26 3.38 5.83 3.84 7.01 2.45 3.97
United Kingdom 1.01 5.12 1.32 3.46 1.09 1.78 1.15 4.18 2.20 7.18
Malawi 0.42 0.69 1.00 1.32 0.63 0.70 0.62 1.19 1.24 1.78
Netherlands 1.30 5.00 0.91 4.48 1.62 6.51 1.19 6.29 1.16 4.74
Poland 0.17 1.06 0.32 2.20 0.47 3.13 0.71 6.20 0.86 7.66
Total Germany Imports 37.66 122.58 41.09 153.52 43.40 156.66 40.23 160.52 41.52 160.60
2010 2011 2012 2013 2014
Table 6: Top 10 countries exporting black tea to Germany
2010 2011 2012 2013 2014
Value / tt
(US$mil)
Value / tt
(US$mil)
Value / tt
(US$mil)
Value / tt
(US$mil)
Value / tt
(US$mil)
Sri Lanka 4.1 4.8 4.3 3.6 4.8
India 2.9 5.3 5.3 5.3 4.8
Belgium 3.8 4.0 3.7 4.1 4.0
China 3.0 3.3 3.7 4.0 3.6
Argentina 1.3 1.4 1.6 1.7 1.8
Indonesia 1.5 1.7 1.7 1.8 1.6
United Kingdom 5.0 2.6 1.6 3.6 3.3
Malawi 1.7 1.3 1.1 1.9 1.4
Netherlands 3.9 4.9 4.0 5.3 4.1
Poland 6.1 6.8 6.6 8.7 8.9
Total Germany Imports 3.3 3.7 3.6 4.0 3.9
Table 7: Value / tt of top 10 countries exporting black tea to Germany

8
Table 8: Top 10 countries exporting black tea to US (2010 - 2014)
Source: UN Comtrade (2015)
Table 9: Value / tt of top 10 countries exporting black tea to USA (2010 – 2014)
Source: UN Comtrade (2015)
Germany exports
Both Germany and the US are recognized as top importers and exporters of black tea.
Germany exports black tea mainly to European countries. As mentioned above, while
the US is the 3rd largest country partner, trade value has decreased over the years.
Qty (in tt)
Trade
Value
(US$mil)
Qty (in tt)
Trade
Value
(US$mil)
Qty (in tt)
Trade
Value
(US$mil)
Qty (in tt)
Trade
Value
(US$mil)
Qty (in tt)
Trade
Value
(US$mil)
Argentina 48.61 61.21 50.28 68.70 48.37 73.92 50.47 85.07 50.58 82.93
India 14.84 46.47 15.57 56.06 13.36 46.93 15.45 60.73 13.83 52.18
China 11.75 23.00 11.60 30.90 11.86 41.71 9.94 41.98 8.49 43.54
Sri Lanka 3.08 15.42 3.56 19.13 3.18 16.44 3.53 20.99 4.48 25.40
Indonesia 6.28 11.95 5.97 11.67 3.82 7.60 4.53 8.96 4.08 7.20
Germany 5.32 32.05 5.75 35.41 4.29 25.74 3.23 18.91 2.45 14.72
Malawi 2.31 4.21 2.75 4.99 3.64 5.05 4.95 9.43 1.79 2.74
Canada 1.83 25.42 1.73 23.21 2.06 25.28 1.95 25.02 1.61 20.20
United Kingdom 1.83 22.29 1.46 16.45 0.87 10.27 1.04 11.22 1.11 13.16
Ecuador 0.48 0.66 0.40 0.58 0.49 0.68 0.40 0.64 0.50 0.85
Total USA Imports 104.71 292.02 108.10 320.98 106.03 318.10 107.63 344.74 112.92 350.38
Table 8: Top 10 countries exporting black tea to USA
2010 2011 2012 2013 2014
2010 2011 2012 2013 2014
Value / tt
(US$mil)
Value / tt
(US$mil)
Value / tt
(US$mil)
Value / tt
(US$mil)
Value / tt
(US$mil)
Argentina 1.3 1.4 1.5 1.7 1.6
India 3.1 3.6 3.5 3.9 3.8
China 2.0 2.7 3.5 4.2 5.1
Sri Lanka 5.0 5.4 5.2 5.9 5.7
Indonesia 1.9 2.0 2.0 2.0 1.8
Germany 6.0 6.2 6.0 5.9 6.0
Malawi 1.8 1.8 1.4 1.9 1.5
Canada 13.9 13.4 12.3 12.8 12.5
United Kingdom 12.2 11.3 11.8 10.8 11.9
Ecuador 1.4 1.5 1.4 1.6 1.7
Total USA Imports 2.8 3.0 3.0 3.2 3.1
Table 9: Value / tt of top 10 countries exporting black tea to USA
9
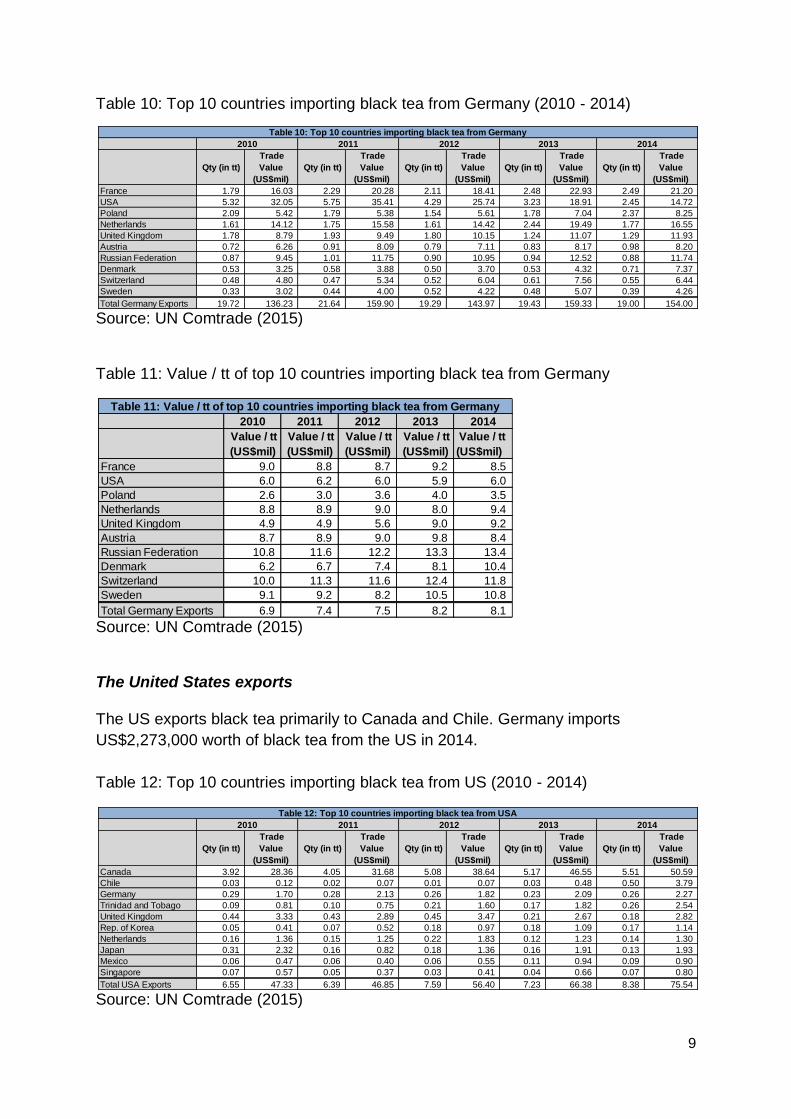
Table 10: Top 10 countries importing black tea from Germany (2010 - 2014)
Source: UN Comtrade (2015)
Table 11: Value / tt of top 10 countries importing black tea from Germany
Source: UN Comtrade (2015)
The United States exports
The US exports black tea primarily to Canada and Chile. Germany imports
US$2,273,000 worth of black tea from the US in 2014.
Table 12: Top 10 countries importing black tea from US (2010 - 2014)
Source: UN Comtrade (2015)
Qty (in tt)
Trade
Value
(US$mil)
Qty (in tt)
Trade
Value
(US$mil)
Qty (in tt)
Trade
Value
(US$mil)
Qty (in tt)
Trade
Value
(US$mil)
Qty (in tt)
Trade
Value
(US$mil)
France 1.79 16.03 2.29 20.28 2.11 18.41 2.48 22.93 2.49 21.20
USA 5.32 32.05 5.75 35.41 4.29 25.74 3.23 18.91 2.45 14.72
Poland 2.09 5.42 1.79 5.38 1.54 5.61 1.78 7.04 2.37 8.25
Netherlands 1.61 14.12 1.75 15.58 1.61 14.42 2.44 19.49 1.77 16.55
United Kingdom 1.78 8.79 1.93 9.49 1.80 10.15 1.24 11.07 1.29 11.93
Austria 0.72 6.26 0.91 8.09 0.79 7.11 0.83 8.17 0.98 8.20
Russian Federation 0.87 9.45 1.01 11.75 0.90 10.95 0.94 12.52 0.88 11.74
Denmark 0.53 3.25 0.58 3.88 0.50 3.70 0.53 4.32 0.71 7.37
Switzerland 0.48 4.80 0.47 5.34 0.52 6.04 0.61 7.56 0.55 6.44
Sweden 0.33 3.02 0.44 4.00 0.52 4.22 0.48 5.07 0.39 4.26
Total Germany Exports 19.72 136.23 21.64 159.90 19.29 143.97 19.43 159.33 19.00 154.00
Table 10: Top 10 countries importing black tea from Germany
2010 2011 2012 2013 2014
2010 2011 2012 2013 2014
Value / tt
(US$mil)
Value / tt
(US$mil)
Value / tt
(US$mil)
Value / tt
(US$mil)
Value / tt
(US$mil)
France 9.0 8.8 8.7 9.2 8.5
USA 6.0 6.2 6.0 5.9 6.0
Poland 2.6 3.0 3.6 4.0 3.5
Netherlands 8.8 8.9 9.0 8.0 9.4
United Kingdom 4.9 4.9 5.6 9.0 9.2
Austria 8.7 8.9 9.0 9.8 8.4
Russian Federation 10.8 11.6 12.2 13.3 13.4
Denmark 6.2 6.7 7.4 8.1 10.4
Switzerland 10.0 11.3 11.6 12.4 11.8
Sweden 9.1 9.2 8.2 10.5 10.8
Total Germany Exports 6.9 7.4 7.5 8.2 8.1
Table 11: Value / tt of top 10 countries importing black tea from Germany
Qty (in tt)
Trade
Value
(US$mil)
Qty (in tt)
Trade
Value
(US$mil)
Qty (in tt)
Trade
Value
(US$mil)
Qty (in tt)
Trade
Value
(US$mil)
Qty (in tt)
Trade
Value
(US$mil)
Canada 3.92 28.36 4.05 31.68 5.08 38.64 5.17 46.55 5.51 50.59
Chile 0.03 0.12 0.02 0.07 0.01 0.07 0.03 0.48 0.50 3.79
Germany 0.29 1.70 0.28 2.13 0.26 1.82 0.23 2.09 0.26 2.27
Trinidad and Tobago 0.09 0.81 0.10 0.75 0.21 1.60 0.17 1.82 0.26 2.54
United Kingdom 0.44 3.33 0.43 2.89 0.45 3.47 0.21 2.67 0.18 2.82
Rep. of Korea 0.05 0.41 0.07 0.52 0.18 0.97 0.18 1.09 0.17 1.14
Netherlands 0.16 1.36 0.15 1.25 0.22 1.83 0.12 1.23 0.14 1.30
Japan 0.31 2.32 0.16 0.82 0.18 1.36 0.16 1.91 0.13 1.93
Mexico 0.06 0.47 0.06 0.40 0.06 0.55 0.11 0.94 0.09 0.90
Singapore 0.07 0.57 0.05 0.37 0.03 0.41 0.04 0.66 0.07 0.80
Total USA Exports 6.55 47.33 6.39 46.85 7.59 56.40 7.23 66.38 8.38 75.54
Table 12: Top 10 countries importing black tea from USA
2010 2011 2012 2013 2014

10
Table 13: Value / tt of top 10 countries importing black tea from USA (2010 – 2014)
Source: UN Comtrade (2015)
Apparent consumption
As shown in Table 14, the estimated consumption of black tea in Germany and the US
is calculated with the formula “import minus export”, because neither country has tea
production.
Germany’s estimated consumption of black tea has undergone several fluctuations
from 2010 to 2014 reaching a growth rate of 8% in 2014, while the US recorded 6.5%.
The consumption per capita is slightly higher in the US than in Germany.
Table 14: Estimated consumption of black tea from US and Germany (2010 - 2014)
Source: UN Comtrade (2015)
Based on the import trends from Germany and the US, we can expect Germany to
import more black tea while the US imports less or the same amount of black tea in
the next years. Nevertheless, the US market is more lucrative as consumption of black
tea is higher than in Germany.
2010 2011 2012 2013 2014
Value / tt
(US$mil)
Value / tt
(US$mil)
Value / tt
(US$mil)
Value / tt
(US$mil)
Value / tt
(US$mil)
Canada 7.2 7.8 7.6 9.0 9.2
Chile 4.2 3.6 6.9 15.7 7.5
Germany 5.9 7.6 7.1 9.2 8.7
Trinidad and Tobago 9.0 7.4 7.6 10.6 9.7
United Kingdom 7.6 6.6 7.7 12.8 15.6
Rep. of Korea 7.5 7.3 5.4 6.0 6.6
Netherlands 8.7 8.2 8.4 10.4 9.6
Japan 7.5 5.2 7.7 12.2 15.1
Mexico 7.6 6.6 9.9 8.4 9.6
Singapore 8.5 7.8 13.1 18.9 11.9
Total USA Exports 7.2 7.3 7.4 9.2 9.0
Table 13: Value / tt of top 10 countries importing black tea from USA
import (in
t)export (in t)
estimated
consumptio
n (in t)
per capita
consumption
(kg)
import (in
t)export (in t)
estimated
consumption
(in t)
per capita
consumption
(kg)
2010 37.66 19.73 17.93 0.22 104.71 6.55 98.16 0.32
2011 41.09 21.64 19.45 0.24 108.11 6.39 101.72 0.33
2012 43.40 19.29 23.60 0.29 106.03 7.59 98.44 0.31
2013 40.24 19.43 20.73 0.26 107.63 7.23 100.40 0.32
2014 41.52 19.04 22.42 0.28 112.92 8.38 104.55 0.33
Table 14: Estimated consumption of black tea from USA and Germany (2010 - 2014)
Year
Germany USA

11
3. Market characteristics
Germany
Consumer preferences
In 2014, the ratio of consumption for black tea to green tea was 71% to 29%,
respectively (Deutscher Teeverband, 2014). Organic tea is a well-established luxury
product in the German market (Deutscher Teeverband, 2012). The most consumed
and most popular black teas are Assam, Ceylon, and Darjeeling (DeLeA e.V., 2015).
In many cases, being only organic is insufficient for a product in the German market.
The customer does not differentiate between organic, fair trade and sustainability, and
expects a product to fulfill all of these attributes (Passport, Organic Beverages, 2015).
Many German consumers are aware of the ethical issues in the tea producing
countries. Living in a stable and wealthy environment, they increasingly tend to buy
ethical products to support the producers (Passport, Hot Drinks, 2015).
Market segments
Almost 53% of tea consumers are over 50, who are more concerned about good
quality and brands, and have a higher purchase capacity. Nevertheless, younger
people are also becoming tea consumers, due to its rising general popularity
(Muthkomm, 2012).
As many teas are further processed in Germany, there is a wide range of varieties and
flavors of tea, which open new market segments like younger health conscious
consumers (Teeverband, 2013). Among Germans, the classical tea drinkers are
women, however men are also considering tea as their daily beverage (Teeverband,
2013). The “East Frisians”, who live in Northern Germany, is the largest group of
consumers of black tea with a consumption of 300 liters per person annually
(Teeverband, 2015). Most of the customers consume bagged tea, as it is cheaper.
However, there is also an increasing demand for loose tea (CBI, Ministry of Foreign
Affairs, 2015). 4,5% of the consumers in 2014 consumed their tea in restaurants and
specialty tea shops (Deutscher Teeverband, 2015).
Conditions of acceptance
The price is the main driver that is considered when buying groceries (Deutsche
Gesellschaft für Qualität, 2014). However, constant growth in the German market for
organic beverages and the beliefs in sustainability labels show the willingness of the

12
customers to pay higher prices (Passport, Organic Beverages, 2015). Furthermore,
consumers believe that certified food tastes better than food with no such certification
(Organic-Market Info, 2015).
Competition
Both black tea and coffee contain caffeine and are typically consumed as breakfast
drinks (Goethe Institute, 2015). However, in 2014, sales of organic black tea
accounted for only 10% of those who purchase organic coffee (Passport, Organic
Beverages, 2015). Another substitution product for black tea is green tea. The
perception of tea is changing in the customer’s eyes. While some loyal tea consumers
stick with their choices, young customers are keen on trying out new types and blends
(Deutscher Teeverband e.V., 2015). Especially for black tea, herbal and fruit infusions
as well as tisanes can become a threat in the German market (CBI, Ministry of Foreign
Affairs, 2015).
Demand trends
The market for organic beverages in Germany grew by 3% in value in 2014 and further
growth is expected. The German consumer is well informed and trusts organic
products, which should be differentiated clearly from regular products. The sales of
organic black teas are expected to rise up to 23.2 million euro in 2019, with a
Compound Annual Growth Rate (CAGR) of 5.9% and a total growth of 33.1%. In terms
of volume, a flat rate of growth is expected (Passport, Organic Beverages, 2015).
The United States
Consumer preferences
In the US market, approximately four in five consumers drink either iced or hot tea.
Tea can be found in 80% of US households, which, correlates to around 158 million
individuals drinking tea on any given day. The types of tea consumed in the US is led
by black tea at 84%, green tea at 15%, and various other forms such as white tea and
oolong. Drinking iced tea has risen dramatically in recent years to an estimated 85%
(Tea Association of the USA Inc, 2014).

13
Market segments
Consumption of tea in the US is highest in the Northeast and Southern regions. The
rate of consumption for tea between men and women over the age of 20 is equal
(LaComb, Sebastian, Enns, & Goldman, 2011). A movement in consumption towards
health conscious products as well as convenience has led to an increase in tea
purchases in the US (Tea Association of the USA Inc, 2014). The affluent, young,
educated, and health conscious consumers who like to try out unique and organic
flavors are attracted to specialty teas. The number of restaurants serving specialty tea
and the number of tea salons has also been increasing over the years.
Conditions of acceptance
Tea quality is extremely important in the organic tea industry. Wholesalers’ work
closely with tea importers from all over the world because it allows them to change
with the evolving market, creates an opportunity for the customization of blends, and
it provides confidence that the tea has been grown and processed in an acceptable
manner. It also allows wholesalers to always have fresh tea that has been optimally
stored, temperature controlled, and away from light. Tea quality is of the utmost
importance (Townshend’s Tea Company, 2015).
Tea is not considered a high-risk food, when importing into the US market. But, with
the combination of fruits, spices, nuts, and herbs, it is important that suppliers manage
the quality of the tea products as would any other food processor (Eng, 2013).
Competition
The top three preferred beverages in the US market, for adults over the age of 20, is
plain water, coffee, and soft drinks. Compared to younger adults, older adults drink
more coffee than alcoholic beverages, plain water, and regular soft drinks. For
breakfast, coffee is reported to be the most frequently consumed beverage. The drink
of choice when eating snacks, or having lunch and dinner, is plain water. Tea is
consumed more than diet soft drinks, juice, and milk (Ferdman, 2014).
Demand trends
According to the US Tea Association (2014), “The US market for tea has more than
quadrupled during the past twenty-plus years- from just under $2 billion in 1990 to just
over $10 billion last year.” Though tea consumption in the US is growing, Americans
are more interested in iced tea than hot tea. About 85% of tea consumed in the US is
chilled and comes from ready-to-drink tea bags (Ferdman, 2014).
Over half of the tea consumed in the US is black tea. Fruit and herbal tea accounts for

14
a quarter of US consumption with neither tea being able to grow in its market segment
in recent years. Green tea, which makes up over 11% of US tea consumption has
seen the most growth in the last 10 years. The perception that tea, especially green
tea, is very healthy and is causing an impact on the US market (Ferdman, 2014).
Several factors play a role in the influence of demand for tea. They include traditional
demographics such as cultural backgrounds, education, occupation, age, income, and
price variables. In the US tea market, it has been shown that income and price did not
impact consumption. Factors that do influence consumption include demographics
and health perceptions (A Committee on Commodity Problems, 2012).
When comparing the German and US markets, there is a demand for organic products
in Germany. In the US, there is currently a preference for iced tea products, though
consumption and awareness of hot tea options will grow. In the future, the market
looks continuously attractive in Germany due to the rising demand for quality and
organic products. In the US, there is demand for black tea but not explicitly for organic
black tea.

15
4. Market access
Tariffs
Neither the US nor Germany impose tariffs on black tea.
Standards and regulations
The EU and the US have recognized each other's organic production rules and control
systems as equivalent under their respective rules:
● The rules in EU are laid down by the Council Regulation (EC) No. 834/2007
and Commission Regulation (EC) No. 889/2008 (OJ L-250 18/09/2008). These
rules cover not only production and processing, but also the control and labeling
of organic food (European Commission, 2014).
● In the US, the standards are laid out in the Organic Food Protection Act by the
United States Department of Agriculture (USDA). Specific organic standards
must be met and verified by USDA agents and only the USDA can certify
products within the US as being organic (USDA, 2015).
Concurrently, the standards for fair trade and food health are very important.
For both producers and traders, a fair trade product must comply with the standards
defined in Germany by the Fair trade International and in the US by the Fair Trade
USA. Whereas, in Codex Alimentarius we can find the Maximum Residue Limits
(MRLs) for conventional and organic black tea valid for both EU and the US, as
displayed on Table 9.

16
Table 15: Maximum residue limits for tea, green, black (black, fermented and dried)
Source: Codex Alimentarius (2014)
Non-tariff barriers
Germany and the US have no quotas or other quantitative restrictions on the import of
tea. However, in both countries strict import requirements and large companies, such
as Unilever, that control the market make it difficult for smaller tea companies to enter
these markets, thus forming barriers of entry (CBI Ministry of Foreign Affairs, 2015).
In term of trade barriers, entering in the US or in the European market is equally easy.
Because of the equivalent arrangement of the regulations, organic products from
Europe can freely circulate in the US market and vice versa. This represents a great
opportunity for the non-EU or US exporters who intend to export in both markets
(European Commission, 2015).
There are no tariffs or quotas for black tea in either market and it is not expected to
see a raise in them in the foreseeable future.

17
5. Prices
Producer prices
The profitability of the industry has been under pressure in recent years. There has
been an oversupply of tea in the international market due to overproduction and
constant demand of tea. As shown in Figure 1, the producer prices have been clearly
rising in the countries and it is attributed to the higher cost of labor and energy (Wal,
2008).
Figure 1: Prices of production in US$/ t (2004 - 2010)
Source: FAO STAT (2015)
Import prices
As shown in figure 2, the average import price of black tea for Germany is generally
lower than the US. Overall, both German and US prices increased gradually from 2005
to 2014.
$4.819,84
$2.543,72
$647,96 $318,30
$-
$1.000,00
$2.000,00
$3.000,00
$4.000,00
$5.000,00
$6.000,00
2004 2005 2006 2007 2008 2009 2010 2011 2012 2013
Annual Production prices in US$/t (2004 - 2013)
China
Kenya
SriLanka
Turkey

18
Figure 2: Import prices in Germany and US (2005 - 2014)
Source: UN Comtrade Database (2014)
Wholesale prices
According to the International Trade Centre, organic consumer may accept price
premiums of 10-25%. To establish a realistic pricing policy, producers and importers
need to closely monitor the market and price movements since prices for most organic
products tend to fluctuate over time and market requirements change frequently.
The wholesale price is determined by the quantity and quality of the tea. Every supplier
has its own minimum order quantity, usually between 10 to 20 kilograms (22 to 44 lb.)
from US$1.20 to US$5.00 per kilogram (Alibaba, 2015). Figure 2 shows the
development of the tea pricing trend over the last 10 years.
Retail prices
In Germany, roughly half of consumers buy their tea in retail shops and discounters
such as Rossmann, DM, and Rewe, with prices ranging from 1.59€ (Rossmann) to
3.29€ (Rewe) for organic black tea. However approximately one fifth prefer specialized
teashops with a wider range of products, with prices ranging from 3.90€ and 13.90€
per 100 grams, depending on the origin (TeeGschwender, 2015).
For Germany, the price for organic black tea in 2009 per kilogram was 28.05€. In 2010
it dropped to 27.84€ and in 2014 it increased back to 28.12€. As compared to the US,
the price per kilo was $43.60 in 2009 and increased to $44.80 in 2010. The price
0
2.000
4.000
6.000
8.000
10.000
2005 2006 2007 2008 2009 2010 2011 2012 2013 2014
US
$/T
on
ne
s
1000 US$/1 Ton1 US$/1 Kg
Import prices of Germany and USA (2005 - 2014)
GERMANY USA

19
continued to rise to $49.60 per kilogram in 2014.
Value chain
The tea supply chain is complex as it involves many producers, collectors, traders and
packers. The downstream stages which are also the most lucrative part of tea trade
such as blending, packing, and marketing are often controlled by multinational tea
packers and brokers in the buying country. However, the number of smallholders is
rising rapidly and they sell their green leaf to independent Bought Leaf Factories
(BLFs) or to estate factories directly.
The obtained average prices of tea at the most important auction centers (Kolkata-
India, Colombo- Sri Lanka, and Mombasa- Kenya) are a reference for the world market
price (TCC, 2010). In a public auction, the brokers and the buyers determine the final
price of the lot based on the last selling type of the tea and the market conditions.
The breakdown of the retail price along the value chain of organic tea is shown in
Figure 3. The processing and packaging stage generates the most value in the value
chain as it transforms the tea leaves into tea bags or flavored tea, which are ready for
consumption. For example, for every dollar spent on Chinese organic black tea, 30%
accounts for the free on board (FOB) price, which includes the price paid to the
producers and costs of local transport and taxes of tea in China (Altromercato, 2015).

20
Figure 3: Breakdown of retail price along the value chain for fair trade organic tea
Source: Altromercato (2015), adapted by SOMO
Figure 4: Example of the breakdown of retail price along the value chain for fair trade organic tea from China in Germany in kg.
+ $7.07 + $11.00 + $12.10 + $4.31
Production$4.82
Trading$11.89
Processing/ Packaging
$22.89
Retail$34.99
Consumers$39.30
Process
Stakeholders Workers, Bought Leaf Factories (BLFs)
Warehouses, Brokers, Trading/ Buying agents
Freight Handler, Blenders & Packers
Supermarkets, Independent Retailers
Individual consumers
Type of Pricing involved
Production Cost
FOB, Auction Charges
CIF, Packer’s cost
Wholesale VAT
Major Players Unilever
Tata Tea
Mcleod Russel
James Finlay
John Keells
Unilever
Tata Tea
Van Rees
James Finlay
Unilever
Tata Tea
Twinings
Aldi
Walmart
Example: Price breakdown of organic China black tea Germany & USA (in USD$)
Approximate Percentages
12% 18% 28% 31% 11%
Germany $4.82 $7.07 $11.00 $12.10 $4.31
USA $4.82 $10.06 $13.88 $15.38 $5.46
1. Production
2. Trading
3. Processing/ Packaging
4. Retail
5. Consumers

21
Figure 4 illustrates the breakdown of the retail price across the supply chain. Both
Germany and US follow a similar breakdown with the most value added in the
processing and retail level. In summary, with increasing labor cost, production prices
is predicted to increase while retail prices remain unchanged due to increased
competition in the market. The researched information indicates that the US is a more
lucrative market to export black tea, as the retail price is higher in the US than in
Germany.

22
6. Distribution channels
The international supply chain for Germany and the US is similar because tea is
imported to both countries. Figure 6 shows how tea arrives to the customer.
Figure 5: Tea export supply chain
Source: Authors (2015)
The tea supply chain is characterized by a very strong vertical integration by just a few
multinational companies. At the global level, 85% of production is sold by
Blender/ packer
Retailer
Consumer
Freight handler
Warehouses
Tea auction system/
brokers
Traders/ buying agents
Bought Leaf Factories
(BLFs)
Factory workers
Estate Factories
Tea plucker/
worker
Smallholder Plantation/ Estate
Collector
Buying Centre
Pro
du
ctio
n
Bu
lkin
g/
Tra
de
Pro
ce
ssin
g
Reta
il C
on
s.

23
multinationals. Direct links between manufacturers and producers are common.
However, major producing and processing companies dominate the trade, have a
strong influence on transport companies and source parts of their supplies from their
own plantations (IDH, 2011)
For a new company, it’s not difficult to enter into the tea supply chain, but it should
have a perfect understanding of the way of selling and distribution for each product
(R. Laduwahetty, personal communication, October 12, 2015).
Tea should be shipped three to four weeks after harvest to avoid quality degradation
during transport. It can be transported by ship, truck, railroad, or aircraft. More and
more tea, especially Darjeeling, is shipped by air. Estates are located outside of major
cities and towns, where there aren’t any or limited rail networks, so tea must be
transported to the harbor by road freight (D. Silva, personal communication, December
12, 2015) in container carriers (R. Laduwahetty, personal communication, October 12,
2015). However, tea is predominantly transported and shipped in containers in both
markets. The containers have to be watertight and must not be contaminated in any
way. Furthermore, a below deck storage is required to avoid exposure to rain,
seawater, or temperature changes. The cargo must be protected from moisture and
from damp weather (rain or snow) to prevent the tea from mold growth (TIS, 2015).
Tea has a long storage life of 18 months, even longer if it is transported and stored
correctly. The storage place has to be cool, dry, and has to have good ventilation. Tea
must be stowed away from sources of heat in order to avoid the risk of desiccation
and drying. Favorable travel temperature ranges from 5 to 25°C (41 to 77ºF). The
humidity needs to be between 50% and 60%, and the water contents of 4% to 6% at
equilibrium for black tea. If there is a risk of degradation by mold, ventilation measures
with an air exchange rate of 10 changes per hour is recommended (TIS, 2015).
About 70% of the Europe-wide traded tea is shipped to Hamburg. Many service
providers like laboratories, logistical specialists, and suppliers, as well as the German
Tea Association and the European Tea Committee are located in Hamburg. From
there, the minimal processed tea is blended and packaged by the tea companies and
handled for the final users (Verband Deutscher Reeder, 2012).
German domestic players are very strong, leaving only a very small share of the
category to international competitors. The two biggest players, Ostfriesische Tee
Gesellschaft and Teekanne, hold a combined share of 42% (Category Briefing, Tea in
Germany, 2015). They import tea for the German market and also to re-export it mostly
in Europe.

24
For the US market, the three main tea companies are Unilever United States Inc., with
a share of 17.5%, followed by RC Bigelow Inc., and Twining & Co Ltd. (Passport, Tea
in the US, 2015).
In the US, tea is distributed through three major channels. There are distributors that
stock inventory and provide agents who service large resellers like grocery stores and
convenience store chains. Secondly, wholesalers that have their own distribution
network under their own terms and conditions (R. Laduwahetty, personal
communication, October 12, 2015), provide value added products and services to the
tea offering. Lastly, retailers deliver tea directly to the consumer for consumption
(Ezine Articles, 2007).
Almost half of the organic beverages in Germany are sold through discounters and
other grocery retailers, like Denn’s and Alnatura. The respective retail value for non-
grocery retailers like Weltladen and Gepa, count for 13.5%, whereas Internet retailing
was just 2% (Euromonitor, Organic Beverages in Germany, 2015). In the overall
German tea market, tea specialty shops could reach a market share of 17.4% in 2014.
In the US, conventional supermarkets and natural product retailers account for 44.8%
of the respective retail value, followed by Hypermarkets with 26.8% and non-grocery
retailers like drugstores. Internet retailing, with 0.1% is like in Germany, are minimally
used by the customers in the US (Euromonitor, Organic Beverages in the US, 2015).
The German and US market only differ in the way tea is distributed from the tea
companies to retailers. In Germany, direct links between those parties are common,
while in the US retailers can receive tea from distributors, agents, and wholesalers.
Retail spending for organic beverages is predicted to grow further in the German and
the US market. Besides distributing through everyday retailers, distribution through
specialty teashops should also be considered since they have gained fairly strong
value in both markets.

25
7. Commercial practices
Worldwide, the majority of tea is sold through auctions. Another sales method is direct
selling by the producer. The Colombo Tea Auction Centre is one of the largest in the
world and trades on average about 5 to 6 million kg (11 to 13 million lb.) of tea weekly
(Institute of Social Development Kandy, 2008).
If an importer from Germany or the US wants to purchase directly from a producer, the
most common ways of contacting are via email, the producer’s website or by
telephone. It is common that the importer is the one who first establishes the contact
between the business partners (R. Laduwahetty, personal communication, October
12, 2015). The order details as well as purchasing conditions should be included in a
written contract. Credits should be available for the producer to finance the production.
Arrangements can be made with commercial banks or government agencies through
crop liens that are guaranteed through sponsors. Contracts with producers can also
include fixed pricing structures through negotiations (FAO, 2015). A Proforma Invoice
(P/I) is most commonly used. If a broker is hired to do Customs Clearance, incoterms
can be negotiated (Institute of Social Development, Kandy 2008). Possible incoterms
for tea trade are FOB and EX WORKS, but this depends on the preferences of the
business partners (D. Silva, personal communication, December 12, 2015). There are
no preferred payment methods, they can be negotiated individually between business
partners and should be included in the contract (R. Laduwahetty, personal
communication, October 12, 2015).
Germany
Since German retailers usually do not order organic products directly from producers,
it is important to contact specialized wholesalers. They know the German organic food
market, importing requirements and can take care of shipping and distribution in
Germany. At trade fairs, which specialize in organic food and beverages like the
“International Green Week” or “BioFach”, retailers, wholesalers, and importers can be
contacted directly. In online business-to-business (B2B) marketplaces, like
“Greentrade” or “iXPOS Export Community“, products can be offered and buyers or
business partners can be found (iXPOS, 2015).

26
The United States
Due to the Bioterrorism Act, tea importers and suppliers are required to give the FDA
advanced notice of import, which can be done electronically and requires an importer
to be registered with the FDA. This only applies to cargo arriving by an ocean vessel
and does not apply to other modes of transportation. There are also labeling
requirements that must be met when importing to the US (FDA, 2015).
In the organic tea industry, Germany and the US will experience similar commercial
practices because standardizations have been put in place within the industry. Even
with these standardizations in place, companies still will be able to negotiate with
individual producers. Since producers have to register with the FDA before entering
the US market, it might be slightly easier to export to Germany.
In the future, with fast, technical and innovative ways to contact, order, and
communicate between buyers and sellers, a larger shift towards online communication
can be predicted.

27
8. Packaging and labeling
The requirements for packaging and labeling for Germany are listed in the EU-wide
Regulation (EU) No 1169/2011 of the European Parliament and of the Council on the
provision of food information to consumers. For the US, the Code of Federal
Regulation (CFR) Title 21, §101 of the Federal Food, Drug, and Cosmetic Act applies.
Packaging
Organic and conventional black teas are packed in the same way for transportation
and the end user.
After the grading phase, tea leaves are packed in airtight containers to prevent
absorption of moisture, which can cause loss of flavor during storage. Before sending
the products to the consumer market, the airtight containers are put in packing chests.
These chests are usually constructed of plywood, lined with aluminum foil, and one or
two plies of parchment paper, which provides aroma-proof packaging. The corners are
covered with sheet metal to reinforce the chests and protect the contents from
humidity/moisture and foreign odors. Plywood chests from China and India are often
additionally protected by bast mats or fabric (TIS, 2015).
Classification by net weight:
● Whole chest 35 - 60 kg or 40 - 73 kg
● ½ chest 20 - 40 kg or 30 - 40 kg
● ¼ chest/box 9 kg
● Paper and jute bags 25 - 60 kg
Tea chests that have been packaged and sealed in the country of origin are called
‘country coopered packages’. Coopering is the process of making or repairing barrels.
The ones that are packaged upon arrival at the port of destination are called ‘dock
coopered packages’ (TIS, 2015).
Both in the US and EU, the packaging of tea for the end user varies a lot. Loose tea
can be packed either in corrugated paper cartons lined with aluminum foil, metal tins,
metalized plastic sachets or tea bags made of special porous paper. Tea bags are
mainly packed with broken-grade teas (TIS, 2015).

28
Labeling
Germany
For packages, the front size must at least be 1.2mm (0.04 inch) tall based on lower
case letter.
For packages less than half the size of a postcard, it has to be at least 0.9mm (0.03
inch). These sizes are required since all information has to be visible, legible and if
necessary, indelible (BMEL).
To claim black tea as organic, the producers, importers, wholesalers and processors
need to be certified and controlled (Lieblingstee, 2014). The product has to be marked
with an EU certified organic label. In addition to the EU label, the trademark protected
German organic logo can be used (Oekolandbau, 2015).
Figure 6: Organic label ‘Bio-Siegel’ additionally for the German market
Source: Oekolandbau (2015)
Figure 7: Organic label ‘EU-Bio-Logo’ for the EU market
Source: Oekolandbau (2015)

29
The United States
The font size must be at least 1.6mm (0.06 inch) tall based on the lowercase letter,
the height of letters can not be more than 3 times their width, All required information
must have sufficient contrast and be easily legible. When using a foreign language
anywhere on the package, all required information must be in both English and the
foreign language (FDA, 2013).
Any domestic or imported product that claims to be organic must be certified and
needs to be labeled with the USDA organic seal. See Figure 8 (OrganicGuide, 2015).
The labeling requirements are the same for the US and the US states.
Figure 8: Organic label ‘USDA organic seal’ for the US market
Source: USDA (2015)
In the EU and the US, an organic product has to contain a minimum of 95% organic
ingredients to be considered organic. The number of labeling requirements is almost
equivalent, see Table 9. The complexity of labeling in both markets is equal.

30
Table 16: Comparison of the German and US labeling requirements
Source: BMEL (2015) & FDA (2013)
Unlike the US, Germany already had other private organic labels long before the
emergence of the national official recognized organic logos. For instance, Naturland,
Bioland and Demeter, which have stricter requirements than the Bio-Siegel and the
EU label (BÖLW, 2015).
It can be harder in the future to export to Germany than to the US due to an increasing
trend of private labeling of retail distribution in Germany for organic products like
Rewe-Bio, BioBio (Netto), and Edeka-Bio, partnering with the previous mentioned high
standard German organic logo (BÖLW, 2015).
31
9. Sales promotion
Organic tea products have gained substantial attention in both the US and Germany.
There are many well-established trade fairs, associations and magazines for organic
products. BioFach is organized in both countries by Nürnberg Messe, with the support
of IFOAM Organics International.
Trade fairs and trade magazines are the most commonly used methods for suppliers
to promote their products. Alternatively, trade associations also connect industry
players and provide news and information about the industry.
Germany, with its increased attention on organic products, organizes more trade fairs
and gives more support to interested suppliers. Anuga and Biofach have been the
largest exhibitions in Germany and the US, both have achieved great success and
acknowledgment within the industry It is expected that they will maintain their
relevance.
Trade fairs and exhibitions
Germany
Anuga
Koelnmesse GmbH
Messeplatz 1
50679 Cologne
Germany
Tel.: +49 (221) 821-2240
Fax: + 49 (221) 821 99-3410
Website: http://www.anuga.com
Biofach Into Organic
Nürnberg Messe
Messezentrum
90471 Nürnberg
Germany
Tel.: +49 (911) 8606-8996
Fax: +49 (911) 8606-8645
Website: https://www.biofach.de/en/
BioNord, BioSüd, BioWest and BioEast
Deutsche Messe Halle 4 30521 Hannover

32
Augsburger Schwabenhallen Messe Am Messezentrum 5 86159 Augsburg
Messe Düsseldorf Halle 14 Messeplatz 1 40474 Düsseldorf
Messe Berlin Jafféstrasse 2 Halle 25 14055 Berlin
Tel. central office: +49 (511) 8765-4820
Fax: +49 (511) 8765-4829 Coteca
Hamburg Messe und Congress GmbH
Messeplatz 1
20357 Hamburg
Germany
Tel.: +49 (40) 3569-2434
Fax: +49 (40) 3569-2771
Website: http://coteca-hamburg.com/en
Drinktec
Messe München GmbH
Messegelände
81823 München
Germany
Tel.: +49 (89) 949-20720
Fax: +49 (89) 949-20729
E-mail: [email protected]
Website: http://www.drinktec.com/
International Green Week
Messe Berlin GmbH
Messedamm 22
14055 Berlin
Germany
Tel.: +49 (30) 3038-0
Fax: +49 (30) 3038-2019
E-mail: [email protected]
Website: http://www.gruenewoche.de/en/
33
Fruit Logistica
Berliner Großmarkt GmbH
Beusselstr. 44 N-Q
10553 Berlin
Germany
Tel.: +49 (30) 3038-2020
Fax: +49 (30) 3989-6124
Website: http://www.fruitlogistica.de/en/
The United States
BioFach America
Baltimore Convention Center
One West Pratt Street
Baltimore, 21201 USA
For all US/ Canadian companies: Michelle Spann +1 (303) 998-9040
For all others: Katharina Neumann +49 (0) 9 11 86 0681 79
Host: NuernbergMesse GmbH
Website: https://www.biofach-america.com/en/contact/exhibitors/
Natural Products Expo East
Baltimore Convention Center
One West Pratt Street
Baltimore, 21201 USA
Host: New Hope Natural Media
Tel: +1 (866) 458-4935, +1 (303) 390-1776
Website: http://www.expoeast.com
Natural Products Expo West
Anaheim Convention Center
800 West Katella Avenue
Anaheim, 92802 USA
Host: New Hope Natural Media
Tel: +1 (866) 458-4935, +1 (303) 390-1776
Website: http://www.expowest.com

34
World Tea Expo
Las Vegas Convention Center
3150 Paradise Rd
Las Vegas, NV 89109 USA
Host: F+W Media Trade Show & Events, LLC.
Tel: +1 (866) 456-3062
Fax: +1 (513) 531-0798
Website: http://www.worldteaexpo.com/index.php/contact-us
Trade magazines
Germany
Das Tee Magazin
Intarix Consulting GmbH
Schillerstrasse 20
35423 Lich
Germany
Tel.: +49 (6404) 659-321
Fax: +49 (6404) 659-322
E-Mail: [email protected]
Website: http://www.intarix.de
The United States
The Tea House Times connects businesses and consumers to tea retailers,
wholesalers, and tea related business help.
The Tea House Times
2 Main Street #1049
Sparta, 07871 USA
Tel: +1 (973) 551-9161
E-Mail: [email protected]
Website: http://www.theteahousetimes.com/

35
Associations
Germany
Der Deutsche Teeverband e.V. (The German Tea Association)
Sonninstraße 28
20097 Hamburg
Germany
Tel.: +49 (40) 2360-1634
Fax: +49 (40) 2360-1610
Website: http://www.tea-up-your-life.de/english/
Waren-Verein der Hamburger Börse e.V.
Große Bäckerstraße 4
20095 Hamburg
Germany
Tel.: +49 (40) 3747-190
Fax: +49 (40) 3747-1919
E-Mail: [email protected]
Website: http://www.waren-verein.de
The United States
Organic Trade Association
444 N. Capitol St. NW, Suite 445A
Washington D.C., 20001 USA
Tel: +1 (202) 403-8520
Website: https://www.ota.com/
Tea Association of USA
362 5th Ave- Suite 801
New York , 10001 USA
Tel: +1 (212) 986-9415
Fax: +1 (212) 697-8658
E-mail: [email protected]
Website: http://www.teausa.com/

36
10. Market prospects
Germany
The market for organic beverages in Germany grew by 3% in value in 2014 and a
further constant growth is expected (Passport, Organic Beverages, 2015). The sales
of organic black teas are expected to rise up to 23.2 million euro by 2019, which would
be a total growth of 33.33% from 2014 to 2019 (Passport, Organic Beverages in
Germany, 2015).
Hot drinks will continue to be perceived as lifestyle products throughout the forecast
period. It is expected that companies will continue with their strategies of distinguishing
their brands through new or more sophisticated flavors, creating unique positions in
the market (Passport, Hot Drinks in Germany, 2015).
The main tea consumers in Germany are over 50, but younger people are also
becoming more interested. This rising popularity can be a chance for companies to
expand to a new market segment (Muthkomm, 2012).
Coffee is the main competitor for tea. The biggest threat for organic black tea is the
growing popularity of green tea, which is seen as a healthy alternative (Passport, Hot
Drinks in Germany, 2015). Herbal and fruit infusions as well as tisanes can also
become a threat in the German market (CBI, Ministry of Foreign Affairs, 2015).
Vegetable teas, which offer a savory taste, can become a possible threat, but are not
obvious competitors yet. They are positioned as an even healthier tea experience,
which can almost serve as a snack containing no calories (Passport, Hot Drinks in
Germany, 2015). Technical innovations on the tea markets are tea pod machines and
their success is likely due to the convenience they offer (Passport, Hot Drinks in
Germany, 2015).
In the tea manufacturing process, safety regulations are already very strict, including
ISO Food Safety Methods. In attempts to ban more pesticides, even stricter safety
regulations can be expected. The trend also goes towards food grade packaging
materials, which can become compulsory in the long-term future (R. Laduwahetty,
personal communication, November 18, 2015).
Concerning organic black tea, there are no trade agreements as well as changes in
the process, such as the auction system planned for the near future (R. Laduwahetty,
personal communication, November 18, 2015). Although the prices for tea, in general,
are predicted to stay the same, the prices for organic teas will rise due to higher
customer awareness and a rising demand for organic tea (D. Silva, personal
communication, December 12, 2015).
37
The distribution channels of tea will possibly shift in the long-term towards buying from
the producers directly. Thanks to the internet, social media and the customers’
expectations to receive goods instantly, producers will increasingly send tea directly
to the buyer, skipping time and cost-consuming intermediate steps (D. Silva, personal
communication, December 12, 2015).
The United States
As in Germany, competition for tea products is expected to grow in the US. This can
be seen by the expansion into this market by beverage companies. The tea market,
though, is growing more towards teas with premium quality and bolder flavors.
Because of this, more manufacturers are producing products in a loose-leaf format.
This production style is perceived by US consumers as higher quality than bags and
is sold at a higher price. This trend will result in the demand for higher quality tea
production and products, without taking away from mass-produced variations
(Passport, Organic Beverages in the US, 2015).
An innovation in tea cultivation and production is expected to increase as the demand
for tea products continue. This will especially be true in the organic and specialty tea
markets. Because tea cultivation is very labor intensive and it takes about 5 years for
a plant to mature, exclusive brews from local farmers and producers will see a rise in
demand for their products as US consumers seek out higher quality and unique tea
variations (Hardie, 2015). There is also a massive movement in the tea brewing
process, like tea concentrate and bubble tea (Ball, 2005).
A number of trends are occurring in the US that is increasing tea consumption. First,
consumers are becoming more sophisticated in their tastes and because of the highly
popular specialty coffee industry, consumers are appreciating and educating
themselves on other beverage choices. Second, as in Germany, there is a growing
awareness of the health benefits tea provides due to extensive media coverage. Third,
consumers want better tasting foods and beverages. Lastly, the marketing and
packaging done by the beverage industry has appealed to the purchase-conscious
American consumer (Shu, 2001).
With the majority of tea being supplied from mass-producing countries like China,
India, Kenya, Sri Lanka and Argentina, there is room for specialty blends for higher-
grade tea consumption. A small domestic market in the US has created opportunities
to work with smaller growers. This could be advantageous because where tea is grown
has a direct effect on the unique flavors and blends that are created (Hardie, 2015).
When comparing the two markets, Germany views organic tea as a lifestyle product
with most consumers currently over the age of 50. In the US, consumers are becoming

38
more sophisticated with their tastes and are demanding unique variations. However,
in both markets there is increased consumption of tea products with increased demand
for organic and specialty teas. The market prospects are very positive for not only
mass-producing suppliers but also smaller businesses, especially in the US as
younger people look for new tastes and healthier products.

39
Market prospect synopsis
US Germany Chapter message
2: Production, trade, consumption:
Although black tea imports are expected to increase more in Germany, the US is more lucrative as the trade value and consumption is higher.
3: Market characteristics:
Increasing attractiveness of the Germany market due to the rising demand for quality and organic products. In the US there is demand for black tea but not explicit for organic black tea.
4: Market access:
There are equal arrangements of trade regulations and low trade barriers in both the US and Germany and no changes are expected in the future.
5: Prices:
Production prices are predicted to increase while retail prices remain unchanged. The US market appears to be a more attractive market due to a higher retail price than Germany.
6: Distribution:
Tea retail market is rising in both countries, especially for tea specialty shops.
7: Commercial practices:
Commercial practices for organic tea are similar in both markets. It is slightly easier to export to Germany because of the necessary registration with the FDA before exporting to the US.

40
8: Packaging and labeling:
It can be harder in the future to export to Germany than to the US, due to an increasing trend of private labeling in Germany.
9: Trade promotion:
There are more channels and support available for organic tea exporters to present their products in Germany.
10: Market prospects:
The demand of organic tea is expected to grow in both countries due to rising customer awareness. The market prospects are very positive in both countries.

41
Annex
Annex 1: Selected potential importers
Teekanne GmbH & Co. KG ,
Kevelaerer Str. 21-23 D
40549 Düsseldorf
Germany
Tel.: +49 (211) 50850-1
Fax: +49 (211) 504-8139
Website: http://www.teekanne.de
Ostfriesische Tee Gesellschaft GmbH & Co. KG
Am Bauhof 13–15
21218 Seevetal
Germany
Tel.: +49 (4105) 504-0
Fax: +49 (4105) 624-0
Website: http://www.otg.de
R.C.Bigelow.Inc
201 Black Rock Turnpike
CT 06825 Fairfield
USA
Tel.: +1 (888) 244-3569, +1 (203) 334-1212
Fax: +1 (203) 382-5509
Website: http://www.bigelowtea.com
Unilever United States Inc
800 Sylvan Avenue
NJ 07632 Englewood Cliffs
USA
Tel.: +1 (201) 894-4000, +1 (800) 298-5018
Website: http://www.unileverusa.com

42
Twining & Co Ltd
777 Passaic Ave Suite 230
Clifton, NJ 07012
USA
Tel.: +1 (973) 591-0600
Fax: +1 (973) 591-1700
Website: http://www.twiningsusa.com

43
Annex 2: Contact list
Rohan Ladduwahetty
Director at UniWorld TEAS (UWT)
324, Old Road Ambatale
Mulleriyawa North, Sri Lanka
Tel: +94 (11) 291-3018
Email: [email protected]
Website: http://www.uniworldteas.com
Dananjaya Silva
Managing Director at PMDTea
UK Address
Suite 16, 24-28 St. Leonards Road,
Windsor, Berkshire, SL4 3BB, UK
Sri Lanka Address
155, Dam Street, Colombo 12, Sri Lanka
Tel: +44 (77) 2531-7590
Tel: +94 (76) 666- 9203
Email: [email protected]
Website: http://www.pmdtea.com
Maria Andronikidou
President at Sri Lanka Bridge e.V.
Bismarckstraße 47
45470 Mülheim an der Ruhr, Germany
Tel: +49 (208) 6260-324
Email: [email protected]
Website: http://www.srilanka-bridge.de

44
References
Alibaba (2015). Organic black tea wholesale. Retrieved from: http://wholesaler.alibaba.com/wholesale/search?SearchText=organic+black+tea.
Altman, R. (2002). Tea export and transportation: Global trends. Retrieved from http://www.teaandcoffee.net/0202/tea.htm.
Altromercato (2015). Food and drink. Retrieved from http://www.altromercato.it/it/prodotti/ALI/A02/101/506/000041.
A Committee on Commodity Problems (2012). A demand analysis for the tea market. Retrieved from http://www.fao.org/fileadmin/templates/est/COMM_MARKETS_MONITORING/Tea/Documents/IGG_20/12-2-demand.pdf.
Bailey, S. (2015). Why the US tea industry is seeing impressive growth. Market Realist. Retrieved from http://marketrealist.com/2015/06/growing-demand-tea-us/.
Ball, S. (2005). The latest in tea innovations. Retrieved from http://www.teaandcoffee.net/0705/retail.htm.
BOLW (2015). Eindeutige Kennzeichnung durch Staatliche bio-siegel und verbandszeichen. Retrieved from http://www.boelw.de/biofrage_04.html.
Bundesministerium für Ernährung und Wirtschaft (2015). Deutsche einfuhrvorschriften für lebensmittel. Retrieved from https://www.bmel.de/DE/Ernaehrung/SichereLebensmittel/KontrolleRisikomanagement/_Texte/DossierKontrolleUndRisikomanagement.html;jsessionid=AB9D23633AC0DAE1204D25C73C96E098.2_cid296?nn=406618¬First=true&docId=431770.
Category Briefing (2015). Tea in Germany. Apr ed.
Chang, K. (2015). World tea production and trade current and future development. Food and Agriculture Organization of the United Nations. Retrieved from http://www.fao.org/3/a-i4480e.pdf.
45
CBI Ministry of Foreign Affairs (2015). CBI market channels and segments: Tea. Retrieved from https://www.cbi.eu/sites/default/files/channels-segments-europe-tea-2014.pdf.
CBI Ministry of Foreign Affairs (2015). What competition do you face on the European tea market?. Retrieved from https://www.cbi.eu/market-information/tea/competition/.
CBI Market Intelligence (2015). Tea in Poland. Retrieved from https://www.cbi.eu/sites/default/files/study/product-factsheet-tea-poland-2014.pdf.
CBI (2014). Which trends offer opportunities on European tea market?. Retrieved from https://www.cbi.eu/market-information/tea/trends/.
Deutsche Gesellschaft für Qualität (2014). Hauptsache billig: Drei von vier Deutschen achten beim Lebensmittelkauf vor allem auf den Preis. Retrieved from http://www.dgq.de/aktuelles/news/hauptsache-billig/.
Deutscher Teeverband e.V. (2013). Markt und Zahlen. Retrieved from http://www.teeverband.de/presse/presse_texte/Markt_und_Zahlen-Wirtschaft/2014/DeutscherTeemarkt2012.php.
Deutscher Teeverband e.V. (2015). Jahresbericht 2014. Retrieved from http://www.teeverband.de/wirtschaft/Jahresbericht_2014.php.
Deutscher Teeverband e.V. (2015). Tee als Wirtschaftsfaktor. Retrieved from http://www.teeverband.de/wirtschaft/pdf/Jahresbericht_Tee_2015.pdf.
Eng, R. (2013). Investing in quality assurance: A tea industry perspective. Food Safety News. Retrieved from http://www.foodsafetynews.com/2013/12/investing-in-quality-assurance-a-tea-industry-perspective/#.VjSxB4R9qzM.
European Commission (2014). Trade export helpdesk. Retrieved from http://www.exporthelp.europa.eu/thdapp/taxes/show2Files.htm?dir=/requirements&reporterId1=EU&file1=ehir_eu15_04v001/eu/main/req_sporgan_eu_010_0612.htm&reporterLabel1=EU&reporterId2=DE&file2=ehir_de15_04v001/de/main/req_sporgan_de_010_0612.htm&reporterLabel2=Germany&label=Voluntary+-+Products+from+organic+production&languageId=en&status=PROD.
FAO (2015). Contract farming. Retrieved from http://www.fao.org/docrep/004/y0937e/y0937e03.htm.
46
FAOSTAT (2015). Food and Agriculture Organization of the United Nations Statistical Division. Retrieved from http://faostat3.fao.org/home/E.
FDA (2015). Filing prior notice. Retrieved from http://www.fda.gov/Food/GuidanceRegulation/ImportsExports/Importing/ucm2006837.htm.
FDA (2013). Food labeling guide. Retrieved from http://www.fda.gov/Food/GuidanceRegulation/GuidanceDocumentsRegulatoryInformation/LabelingNutrition/ucm2006828.htm.
Ferdman R.A. (2014). America is slowly-but surely- becoming a nation of tea dtrinkers. The Washington Post. Retrieved from https://www.washingtonpost.com/news/wonkblog/wp/2014/09/03/america-is-slowly-but-surely-becoming-a-nation-of-tea-drinkers/.
Goggi, P.F. (2014). The state of the US tea industry 2014 year in review. Tea Association of the USA Inc. Retrieved from http://www.teausa.com/14654/state-of-the-industry.
Goethe Institute (2015). Retrieved from http://www.goethe.de/ins/ie/prj/scl/ess/de179806.htm.
Groosmann, M. (2011). Tea sector overview. IDH: The sustainable Trade Initiative. Retrieved from file:///Users/Tommy/Downloads/IDHSectorOverview_TEA.pdf.
Hardie, A.M. (2015). North American tea plantations have a promising future. Retrieved from http://www.thedailytea.com/travel/north-american-tea-plantations-promising-future/.
Hollyer, J.R., Fergerstrom, M., & Hu, C.U. (2012). Required and optional labeling for loose tea for sale. College of Tropical Agriculture and Human Resources: University of Hawaii at Manoa, Honolulu, Hawaii. Retrieved from http://www.ctahr.hawaii.edu/oc/freepubs/pdf/FST-47.pdf.
International Markets Bureau (2011). Organic packaged food and beverages in Germany. Retrieved from http://www5.agr.gc.ca/resources/prod/Internet-Internet/MISB-DGSIM/ATS-SEA/PDF/5769-eng.pdf.
International Markets Bureau (2011). Organic packaged food and beverages in the United States. Retrieved from http://www5.agr.gc.ca/resources/prod/Internet-Internet/MISB-DGSIM/ATS-SEA/PDF/5983-eng.pdf.
47
Institute of Social Development, Kandy (2008). SustainabiliTea: Report of Sri Lanken tea industry. PiC, New Delhi.
iXPOS (2015). Organic Foods. Retrieved from http://www.ixpos.de/IXPOS/Navigation/EN/Your-business-in-germany/Business-sectors/Consumer-goods/Food-and-beverage/organic-foods,t=distribution-channels-,did=265180.html.
Kortbech-Olesen, R. (2002). The United States market for organic food and beverages. International Trade Center. Retrieved from http://www.intracen.org/uploadedFiles/intracenorg/Content/Exporters/Sectoral_Information/Agricultural_Products/Organic_Products/us-market.pdf.
LaComb, R.P., Sebastian, R.S., Enns, C.W., & Goldman, J.D. (2011). Beverage choices of US adults: What we eat in America, NHANES 2007-2008. US Department of Agriculture. Retrieved from http://www.ars.usda.gov/SP2UserFiles/Place/80400530/pdf/DBrief/6_beverage_choices_adults_0708.pdf.
LieblingsTee (2014) Bio-Zertifizierung. Retrieved from http://www.lieblingstee.de/bio-zertifizierung.
Muthkomm (2012). Tee im trend - Ein blick in den teemarkt. Retrieved from http://www.muthkomm.de/de/news/ostfriesische-teegesellschaft/tee-im-trend-ein-blick-in-den-teemarkt.
OECD (2005). OECD trade policy studies environmental requirements and market access. OECD Publishing: Paris, France. Retrieved from https://books.google.de/books?id=Q_-QwozXLMsC&printsec=copyright&hl=de#v=onepage&q&f=false.
Okolandbau (2015). Bio-Siegel. Retrieved from https://www.oekolandbau.de/bio-siegel/.
Organic Guide (2015). Certification in labeling in the United States. Retrieved from http://www.organicguide.com/organic/certification-and-labeling-in-the-united-states/.
Organic-Market Info (2015). Study shows that fair-trade labels are being linked to higher cost willingness. Retrieved from http://organic-market.info/news-in-brief-and-reports-article/study-shows-that-fair-trade-labels-are-being-linked-to-higher-cost-willingness-and-to-better-taste-perception.html.

48
OTG (2015). Market share by distribution channels 2014. Retrieved from https://en.otg.de/we-do-more-with-tea/the-tea-market/market-share-by-distribution-channels.
Passport (2015). Organic beverages in Germany. Euromonitor International, June ed.
Passport (2015). Hot drinks in Germany. Euromonitor International, April ed.
Passport (2015). Tea in the Us. Euromonitor International, February ed.
Potts, J., Lynch, M., Wilkings, A., Huppe, G., Cunningham, M., & Voora, V. (2014). The state of sustainability initiatives review 2014: Standards and the green economy. International Institute for Sustainable Development: Winnipeg, Manitoba Canada. Retrieved from https://www.iisd.org/pdf/2014/ssi_2014.pdf.
Saberi, H. (2010). Tea: A global history. Reakton Books: London, England.
Shu, T. (2001). Time for tea—U.S. specialty tea trends. Retrieved from http://www.ocha-festival.jp/archive/english/conference/ICOS2001/files/PROC/IV-055.pdf.
Statista (2015). Tea production of the main producing countries from 2006 to 2014 (in metric tons). Retrieved from: http://www.statista.com/statistics/264188/production-of-tea-by-main-producing-countries-since-2006/.
TCC (2010). TCC tea barometer 2010. Retrieved from https://www.google.com/url?sa=t&rct=j&q=&esrc=s&source=web&cd=2&ved=0CCMQFjABahUKEwjv5-m35YrJAhVje6YKHRCxBmk&url=http%3A%2F%2Fwww.teacoffeecocoa.org%2Ftcc%2Fcontent%2Fdownload%2F404%2F2879%2Ffile%2FTCC_TEA_baro2010_LP.pdf&usg=AFQjCNEiyoCTfjjXZfuq565rzzA4bTSlsQ&sig2=DQ4faWyjMszxv5ovoMExBQ&cad=rjt.
Tea Association of the USA Inc. (2014). Tea fact sheet- 2014. Retrieved from http://www.teausa.com/14655/tea-fact-sheet.
TeeGschwender (2015). Preisliste ausgabe 55. Meckenheim: TeeGschwender.
The World Bank (2015). Data. Retrieved from http://data.worldbank.org.

49
TIS (2015). Tea. Retrieved from http://www.tis-gdv.de/tis_e/ware/genuss/tee/tee.htm.
Townshend’s Tea Company (2015). Townshend’s wholesale. Retrieved from http://www.townshendstea.com/wholesale.html.
Transportation Information Service (2015). Tea. Retrieved from http://www.tis-gdv.de/tis_e/ware/genuss/tee/tee.htm.
US Customs and Border Protection (2015). Importing tea, coffee and spices for commercial purposes. Retrieved from https://help.cbp.gov/app/answers/detail/a_id/337/kw/tea%20import.
USDA (2015). Organic standards. Retrieved from http://www.ams.usda.gov/grades-standards/organic-standards.
United Nations Conference on Trade and Development (2013). Forum to discuss country sustainability standards that increasingly affect developing-country exports. Retrieved from http://unctad.org/en/pages/newsdetails.aspx?OriginalVersionID=425.
US National Library of Medicine (2015). Black tea: Medineplus supliments. Retrieved from https://www.nlm.nih.gov/medlineplus/druginfo/natural/997.html.
United States Department of Agriculture Economic Research Service (2015). US food imports. Retrieved from http://www.ers.usda.gov/data-products/us-food-imports.aspx.
Verband Deutscher Reeder (2012). Ein Meer von Tee. Deutsche Seeschifffahrt, 26. Retrieved from http://www.haelssen-lyon.de/fileadmin/user_upload/pdf/DtSeesch12-2012-Tee.pdf.
Wal, S. v. (2008). Sustainability Issues in the Tea Sector: A Comparative Analysis of Six Leading Producing Countries. Amsterdam: Stichting Onderzoek Multinationale Ondernemingen Centre for Research on Multinational Corporations.
WTO (2015). Tariff analysis online. Retrieved from http://tao.wto.org/report/TariffLines.aspx.

50
Yanjing, Z. (2014). Green barriers for China tea: A case study of anhui tea imports and exports co, ltd faces green barriers in exporting. Savonia University of Applied Sciences, Finland. Retrieved from https://publications.theseus.fi/bitstream/handle/10024/75320/ZouYanjing.pdf?sequence=1.