xm8-07 cubierta 19 28/2/07 11:47 página 1 switching to a ... · volatility and the most efficient...
TRANSCRIPT

Switching to a TemporaryCall Auction in Timesof High UncertaintyDavid AbadRoberto Pascual
XM8-07 Cubierta 19 28/2/07 11:47 Página 1

XM8-07 BOLETIN 19 28/02/2007 11:44 Página 2

Switching to a Temporary Call Auction in Times of HighUncertaintyDAVID ABADROBERTO PASCUAL
Monografía n.º 19
Febrero 2007
XM8-07 BOLETIN 19 28/02/2007 11:44 Página 3

David Abad es profesor titular y vicedecano de Estudios de Administración yDirección de Empresa en la Universidad de Alicante. [email protected]
Roberto Pascual es profesor titular de la Universidad de las Islas Baleares, DepartamentoEconomía de la Empresa, Area de Contabilidad y Finanzas. [email protected]
Los autores agradecen a Yakov Amihud, Kenneth Kim y Bruce N. Lehmann, sus útilescomentarios y sugerencias. También agradecen a José Antonio Pérez de Sociedad deBolsas su aportación de datos.
Las opiniones expresadas en este documento reflejan exclusivamente la opinión delos autores y no deben ser atribuidas a la Comisión Nacional del Mercado de Valores.
La Comisión Nacional del Mercado de Valores, al publicar esta serie, pretende facilitarla difusión de estudios que contribuyen al mejor conocimiento de los mercados devalores y su regulación.
La Comisión Nacional del Mercado de Valores difunde la mayoría de sus publicacionesa través de la red INTERNET en la dirección www.cnmv.es
© CNMV. Se autoriza la reproducción de los contenidos de esta publicación siempreque se mencione su procedencia.
ISBN: 84-87870-62-7
Depósito Legal: M-10962-2007
Imprime: Cromotex
XM8-07 BOLETIN 19 28/02/2007 11:44 Página 4

Abstract
Madhavan (1992, The Journal of Finance, 47, 2, 607-641) recommends a temporaryswitch to a call auction rather than a trading halt in times of market stress. Hepredicts the call auction to aggregate information more efficiently and to facilitatethe resumption of the continuous session. In this paper, we test the properties of theswitching mechanism proposed by Madhavan using data from the Spanish StockExchange (SSE). The SSE implements rule-based call auctions to stabilize prices. Onthe positive side, we find there is price learning during the auction, and pricereversals dominate price continuations after the auction. On the negative side, weconclude rule-based auctions do not calm the market and do not reduce informationasymmetries, except for small-caps. Our findings suggest the switching mechanismperforms better with thinly traded stocks.
Keywords: call auction, price learning, price reversals, price continuations, informationasymmetry, thinly-traded stocks.JEL Classification: G10; G14.
XM8-07 BOLETIN 19 28/02/2007 11:44 Página 5

XM8-07 BOLETIN 19 28/02/2007 11:44 Página 6

Contents
1. Introduction 11
2. Institutional 15
3. Literature review and hypotheses 17
4. Data and preliminary statistics 21
5. Empirical evidence on the efficiency of the switching mechanism 25
5.1. Price discovery during short-lived rule-based call auctions 25
5.2. Liquidity, activity, and volatility around rule-based calla auctions 28
5.3. Price continuation during and after rule-based cal auctions 32
5.4. Adverse selection costs around rule-based auctions 34
6. Summary and conclusions 39
7. Rerefences 41
XM8-07 BOLETIN 19 28/02/2007 11:44 Página 7

XM8-07 BOLETIN 19 28/02/2007 11:44 Página 8

Index of tables
Table I. Preliminary Statistics 22
Table II. Price discovery during price-triggered volatility auctions 27
Table III. Price behavior during and after rule-based auctionsa 33
Index of figures
Figure 1. Intraday Distribution of Volatility Auctions 23
Figure 2. Liquidity, volatility and activity around volatility auctions 30
Figure 3. Adverse selection costs around volatility auctions 36
XM8-07 BOLETIN 19 28/02/2007 11:44 Página 9

XM8-07 BOLETIN 19 28/02/2007 11:44 Página 10

1. Introduction
Individual-security trading halts are a very common device in financial markets todeal with periods of high uncertainty. The pros and cons of trading halts have beenthe subject of an intense debate among academics and regulators. Proponents arguethat trading halts provide time for price reassessment and reduce informationasymmetries. Moreover, they reduce transitory volatility, offset overreaction, andprevent liquidity traders from incurring in severe losses. In contrast, critics claimthat trading halts are an unnecessary impediment for trading, delay price discovery,and may even have the counterproductive effect of exacerbating price changes.1
In the most important US markets, firm-specific trading halts are discretionary and,consequently, their timing is generally unpredictable. In the NYSE, trading halts areinitiated by the specialist. During NYSE halts, the specialist issues indicator quotes,“trial balloons” to which traders respond submitting commitments to trade. Thisprice exploration stage lasts for more than one hour and finishes with a call auction.Most NYSE halts are delayed openings (Lee et al., 1994). In the Nasdaq, trading haltsare initiated by the StockWatch Department. Christie et al. (2002) report durationsfor the no-trading phase between 30 and 60 minutes. The halt finishes with a 5-minute quotation period for market markers and does not involve a centralized callauction.
The evidence on US discretionary halts suggests they fail to stabilize the market.Lee et al. (1994) report unusual volatility and trading volume in the half hourfollowing NYSE halts. While volatility rapidly decays thereafter, trading volumeremains high two days after the halt. They conclude NYSE halts do not “[…] facilitatethe type of information transmission that results in cleaner reopening prices”.Christie et al. (2002) provide consistent evidence for the Nasdaq case. Post-halttrading activity and volatility are higher than on non-halt days for up to two hours.For intraday halts, they also report higher than usual post-halt spreads within 30minutes after the resumption of trading. They conclude that the uncertaintyassociated with Nasdaq trading halts is not resolved by the time the halt is lifted.Finally, Corwin and Lipson (2000) analyze the order flow around NYSE halts. Theyshow that order submissions and cancellations are extremely high during the haltperiod, suggesting that investors use the halt to reposition their trading interests.Nonetheless, the unusual order flow remains high for several hours after the halt.They also show that the reopening price is a good predictor of posterior prices,indicating that submissions and cancellations during the halt are a useful source of
Switching to a Temporary Call Auction in Times of High Uncertainty
1 Detailed discussions can be found in Lee et al. (1994), Harris (1998), and Kim and Rhee (1997), among others.
11
XM8-07 BOLETIN 19 28/02/2007 11:44 Página 11

information. Finally, liquidity, as measured by book depth near the quotes, isunusually low, after NYSE halts.
Madhavan (1992) criticizes those microstructures that propose to use trading haltsto reduce market stress in continuous systems. He argues the trading halt mayexacerbate the original problem, possibly leading to market failure. Madhavantheoretically compares price formation in financial markets under different tradingmechanisms: price-driven and order-driven continuous markets and order-drivenperiodic auctions. He shows that continuous mechanisms may fail in periods ofsevere information asymmetry unless there is enough liquidity trading. Wheninformation asymmetry is sufficiently grave, liquidity-motivated traders have noincentives to trade since they cannot make nonnegative expected profits. In thesecircumstances, equilibrium may not exist. In contrast, Madhavan shows that callauctions may still be viable in economies where continuous auctions fail. The callauction equilibrium exists even when public information is so poor that dealersdecide not to make market. The reasoning is that pooling orders for simultaneousexecution overcomes the costs of information asymmetry. Moreover, call auctionsmay aggregate information more efficiently than continuous markets. In particular,prices converge to the strong form efficient price as the number of auction participantsincreases.
In his theoretical framework, Madhavan (1992) concludes that, once halted, it maybe difficult or even impossible to restate the trading process unless the degree ofinformation asymmetry is lessened. Instead, Madhavan proposes a temporaryswitch to a periodic trading phase in times of market stress. The particular timingof the switch would be rule-based (non-discretionary).2 The allocation price of theauction would serve as a public information signal of the asset value that mayfacilitate the resumption of the continuous session.
Amihud and Mendelson (1991) provide indirect support to Madhavan’s proposition.They use data from the Tokyo Stock Exchange, where the two daily trading sessionsare opened with a periodic auction (Itayose). These authors show that the dailyreturns from the opening auction, which is preceded by a non-trading phase, aremore volatile than the daily returns from the call auction used to open the afternoonsession. Even more, they find that the mid-day auction “may well exhibit the leastvolatility and the most efficient value discovery process”.
In this paper, we provide direct evidence on the efficiency of Madhavan’s (1992)proposition using data from the Spanish Stock Exchange (SSE). Since 2001, the SSEuses short-lived rule-based call auctions to deal with unusual volatility levels duringthe continuous trading session. A so-called “volatility” auction is triggered whenprices hit stock-specific price limits. The call auction lasts 5 minutes plus a randomend of maximum 30 seconds and, afterwards, the continuous trading sessionresumes. The SSE system of rule-based call auctions just matches the switchingmechanism recommended by Madhavan (1992).3 We evaluate Madhavan’s
Comisión Nacional del Mercado de Valores
2 In particular, Madhavan (1992) suggests triggering the switching mechanism when the quoted bid-ask
spread exceeds a certain critical level based on trading volume and historical spreads.3 A similar switching mechanism is implemented in Euronext.
12
XM8-07 BOLETIN 19 28/02/2007 11:44 Página 12

proposition studying the implications of the SSE switching mechanism in pricediscovery, market stability, and information asymmetry risk.
We find that rule-based auctions significantly contribute to price discovery; themarket-clearing price of the volatility auction reflects learning in the sense thatthe allocation price of the auction is more informative about the long-run valueof the stock than pre-auction quotations. Although this finding is robust acrossstocks, we find that volatility auctions are more relevant in the price discoveryprocess of infrequently traded stocks. We also find that price reversals dominateprice continuations both during and after rule-based auctions. Our findings thereforedisagree with those claiming that circuit breakers systematically delay price discovery.Nonetheless, the rule-based auction is not sufficient to correct the overreactionoccurring in the pre-auction period.
As with discretionary US halts, we provide evidence that the switching mechanismproposed by Madhavan (1992) does not calm the market. Volatility, trading activity,and illiquidity levels are unusually high after the auction, meaning that rule-basedauctions do not fully resolve price uncertainty. Additionally, we report unusualadverse selection costs levels in the pre-auction period, especially for small-caps.After the rule-based auction, the atypical risk persists during almost two hoursamong large-caps, but it reverts immediately to non-auction days’ levels amongsmall-caps. Our findings therefore suggest the switching mechanism performsbetter in reducing information asymmetries with thinly traded stocks.
The remainder of the paper is organized as follows. In section 2, we give details onthe microstructure of the SSE. In section 3, we review the existing theoreticalliterature and develop hypotheses we test in posterior sections. In section 4, wedescribe the database and provide some preliminary statistics. In section 5, wereport our empirical findings on the performance of the Madhavan’s (1992)switching mechanism. Finally, in section 6, we conclude.
Switching to a Temporary Call Auction in Times of High Uncertainty 13
XM8-07 BOLETIN 19 28/02/2007 11:44 Página 13

XM8-07 BOLETIN 19 28/02/2007 11:44 Página 14

2. Institutional background
The electronic trading platform of the SSE, called SIBE, holds the trading activity ofthe SSE-listed stocks that, in their most recent past, have satisfied minimumrequisites on trading activity and liquidity. The list of stocks admitted to tradethrough the SIBE is revised every semester. The SIBE is an order-driven marketwhere liquidity is provided by an open limit order book (LOB). Trading iscontinuous from 9:00 a.m. to 5:30 p.m. There are two fixed daily call auctions; thefirst one determines the opening price (8:30-9:00 a.m.), and the second one sets theofficial closing price (5:30-5:35 p.m.). Three basic types of orders are allowed: limitorders, market orders, and market-to-limit orders. Market orders walk up or downthe book until they are totally executed. Market-to-limit orders are restricted to thebest price on the opposite side of the market. Orders submitted that are notinstantaneously executed are stored in the book waiting for a counterparty. Theusual price-time priority rule applies. Unexecuted orders can always be cancelledand modified. A trade occurs when an incoming order matches one or more orderson the opposite side of the LOB; thus, every trade involves at least one order storedon the LOB.
Since 5-14-2001, the SSE incorporates a system of intraday price limits and volatilityhalts directed to handle unusual volatility levels. The “static” price range defines themaximum permitted variation (in either direction) around the so-called “static”price. The static price is the allocation price of the last auction performed. Staticprice limits remain in force throughout the entire session or until a new auction istriggered. There are standardized categories of possible static ranges: 4%, 5%, 6%,7% and 8%. There is also a unique 10% range for stocks listed in the “New Market”.4
The range assigned to a particular stock depends on its most recent historicalvolatility. Static ranges are ordinarily revised every six months. Extraordinaryrevisions are possible if the situation of the market so requires.
Whenever an incoming order is to be executed at or above (below) the upper(lower) static price limit, a static halt (henceforth SH) is triggered. A SH lasts only5 minutes plus a random end of at most 30 seconds.5 During this interval, atâtonnement process takes place. As usual, traders can submit, cancel, and modifyorders during the tâtonnement, but no trade occurs. When this period finishes, thesystem sets the allocation price of the auction, if any. Volatility halts are never
Switching to a Temporary Call Auction in Times of High Uncertainty
4 The New Market includes technological and chemical firms, R&D firms, and Internet firms, among others. All
firms in this segment of the SIBE are highly volatile. 5 The goal of this random end is to avoid price manipulation.
15
XM8-07 BOLETIN 19 28/02/2007 11:44 Página 15

extended; continuous trading, therefore, resumes after the halt independently ofwhether a consensus price has been attained.6 During a SH, the static price isupdated and set equal to the price limit that triggered the halt. After the SH, thestatic price is set equal to the allocation price of the auction, if it exists.7
There are some features of SSE switching mechanism that we would like tohighlight. First, SSE halts are non-discretionary (rule-based). The decision of haltingthe continuous double auction trading process and switching to a call auctionprocess does not depend on the discretion of a market maker or any kind ofexchange official. Mandatory and objective rules establish when a stock mustautomatically enter in an auction phase. SSE investors can continuously monitorthe distance between the quoted prices and the upper and lower price limits,meaning that static halts can be anticipated up to a certain extent. Second, SSE haltslast less than discretionary halts. Corwin and Lipson (2000) report an average haltlength of 80 minutes for the NYSE. Christie et al. (2002) report lengths between 31and 60 minutes for the Nasdaq. Third, Because of the two previous features,volatility halts are very frequent. From May 14th 2001 to December 31st 2003, morethan 3000 static halts took place among all the firms in the SIBE, excluding non-Spanish stocks. Moreover, to observe two or more halts the same day is not a rareevent (27.44% of days with static halts have at least two static halts).8
Comisión Nacional del Mercado de Valores
6 There is only an exception to this rule. A necessary condition for a price to be the allocation price of an
auction is that all market orders and market-to-limit orders submitted during the auction must find
counterparty at that price. When no potential allocation price satisfies this condition, market regulators may
extend the auction. The length of this extension is, however, totally discretionary.7 In addition to static ranges, the SIBE introduced “dynamic” ranges in 5-14-2001. These ranges set the
maximum price variation around the last trade price. These price limits are therefore updated each time
there is a new trade. By definition, static ranges are always larger than dynamic ranges. A dynamic halt
(henceforth DH) is triggered when a dynamic price limit is violated. A violation of the static range implies a
dramatic intraday variation in the stock price. On the contrary, a dynamic halt may be triggered by a single
and unexpected large-sized order. In this paper, we focus on static halts and we discard days with one or
more dynamic halts.8 The effect of the predictability of the static halts on traders’strategies has been studied by Abad and Pascual
(2006).
16
XM8-07 BOLETIN 19 28/02/2007 11:44 Página 16

3. Literature review and hypotheses
Madhavan (1992) argues that switching to temporary call auctions in times of highuncertainly instead of halting the trading process may result in more efficientreopening prices. He shows that during call auctions, all traders observe a noisyestimate of their aggregated information, in addition to the public or private signals.The resulting allocation price is more efficient as a signal of the asset value thegreater the number of participants in the auction. Other theoretical and empiricalstudies have shown that concentrating orders in a call auction may increase priceefficiency (see Biais et al., 2005, pp. 244-245, for a review). Indeed, single callauctions are used in several continuous markets when the uncertainty aboutfundamentals is large, such as in the pre-opening and pre-closing intervals, or to re-open following a trading halt. In some other markets, infrequently traded andilliquid stocks are traded through periodic trading systems in order to concentrateliquidity.9 Medrano and Vives (2001) theoretically show that, in the presence ofstrategic informed traders that manipulate the price discovery process during thecall auction, market-clearing prices approach, but do not converge, to the efficientprice. However, they prove information revelation exists, and it accelerates towardsthe close of the auction. Biais et al. (1999) provide consistent empirical evidence.Using data on pre-opening auctions of the Paris Bourse, they show that tentativeallocation prices become more efficient in a semi-strong sense as the auction comesto its end. Medrano and Vives (2001) also show that price discovery benefits froma long tâtonnement process, such as the two and a half hours of the pre-openingperiod in the Paris Bourse. However, a short duration implies less time for pricemanipulation by strategic informed traders. As a consequence of this tradeoff, thedegree of information revelation during short-lived rule-based auctions remains asan open empirical question. Our first hypothesis is that,
H1 (“Pure learning” hypothesis): Price triggered volatility auctions contribute toprice discovery. The allocation price of a short-term rule-based volatility auctionis an unbiased estimator of the equilibrium price of the stock (semi-strong priceefficiency).
Switching to a Temporary Call Auction in Times of High Uncertainty
9 Many European markets have developed market segments for illiquid stocks based on sequences of long-
lasting call auctions. In Spain, for example, this segment is called “Fixing”. In this market, stocks only trade
twice a day, at noon and at 17:30 p.m., and transaction prices are determined through two consecutive
single-call auctions. Similar segments are found in Paris, Milan, Amsterdam, Athens, Lisbon etc. Lauterbach
(2001) studies stocks in the Tel-Aviv Stock Exchange that were removed from the continuous market and
sent back to a single daily auction market. He concludes that continuous trading may be suboptimal for
thinly traded stocks.
17
XM8-07 BOLETIN 19 28/02/2007 11:44 Página 17

A recurrent argument among circuit breaker critics is that these mechanisms delayprice discovery because they interfere with the natural progress of the tradingprocess (e.g., Fama, 1989; Lehman, 1989; Lee et al., 1994). When price movementsare constrained by price limits, for example, stocks may be prevented from reachingtheir equilibrium price. As a result, they have to wait until the resumption oftrading to reach their true value. The so-called delayed price discovery hypothesiswould therefore predict positive (negative) returns after an upper (lower) limit-hit.Kim and Rhee (1997) and Chen (1998) report overnight price continuations afterdaily limit-hits, concluding that price limits postpone price discovery. Huang et al.(2001) argue this pattern is also consistent with the overreaction hypothesis. Underthis alternative, circuit breakers delay both information revelation and overreactionby noise traders. If we are willing to assume that informed traders only revealinformation through trading, that value-motivated trading during the opening islimited or prohibited, and that noise traders may be unable to infer the intrinsicvalue of the stock during the overnight because of the lack of trading, then,overnight price continuations could be explained by noise traders overreacting tonew information. This overreaction will be gradually reversed afterwards.Consistently, Huang et al. (2001) find overnight continuations after limit-hits andprice reversals the day after in the Taiwan Stock Exchange.
In a market like the SSE, where price limits activate a temporary switch to a callauction, limit-hits interrupt the continuous session for a while but, as discussedearlier, do not necessarily prevent price discovery. Moreover, value-motivatedactivity is not limited during the auction phase. Therefore, both informationrevelation and overreaction may concur during the auction. In the SSE, however,the allocation price of the auction is limited. The auction static limits, computedover pre-hit static limit, are in force during the 5-minute volatility auction. If theintrinsic value of the stock is above (below) the upper (lower) limit during theauction, price discovery and overreaction may be still delayed until the resumptionof the continuous trading. Moreover, the auction may fail to prevent overreaction ifit is too short or if the volume allocated at the market-clearing price is insufficientto satisfy the demands of noise traders.
Finally, suppose call auctions are efficient in revealing information (i.e., H1 is notrejected). In this scenery, the risk supported by an informed trader would augmentnear the price limit, encouraging her to anticipate trades, and increasing adverseselection costs. Kim and Sweeney (2002) develop a model where an informedinvestor faces binding daily price limits. In their model, the informed investordelays her profit-motivated trades from one day to the next when the current priceis near, but the equilibrium price is substantially beyond, today’s limit. Thereasoning is that by trading today, the informed investors can profit from only asmall price rise. Moreover, if today’s trading reveals so much information thattrading tomorrow is not worthwhile, then the informed investor bears a highopportunity cost. However, if the amount of information leaked overnight isexcessive, so that trades tomorrow would be not profitable, or the limit price is closeto the equilibrium price, the investor would be less likely to wait. Therefore, thismodel would also predict that when a limit-hit does not stop trading but activatesan alternative trading device that could reveal new information, informed investorswould be more willing to anticipate their trading programs.
Comisión Nacional del Mercado de Valores18
XM8-07 BOLETIN 19 28/02/2007 11:44 Página 18

Given all previous arguments, we must conclude that the effectiveness ofMadhavan’s (1992) rule-based auctions in preventing overreaction and delayedvalue-motivated trading is an open empirical question. Hence, we formulate thefollowing hypotheses to be tested empirically in the next sections,
H2: In venues where limit-hits activate temporary switches from continuous toperiodic trading, there is no price continuation after the auction.
H3: In venues where limit-hits activate temporary switches from continuous toperiodic trading, adverse selection costs are not unusually large after the auction.
Concentration of trades and orders in a single call auction in times of market stresscould be particularly beneficial for infrequently traded stocks. It is well known thatstocks of large firms use to be covered by many analysts and investors. Therefore,they are likely to be subject to less information asymmetries than are stocks of smallfirms.10 Biais et al. (1999) build on Copeland and Galai’s (1983) theoretical frameworkto argue that for thinly-traded stocks mandated call auctions can minimizeinformation asymmetries at the time of trade and lead to greater risk sharing. Therationale is that posted limit orders for infrequently traded stocks bear a highinformation asymmetry risk because the arrival rate of information is superior tothe arrival rate of orders. A mandated call auction allows limit order traders tosubmit their orders right before the known time of the call, collecting all theinformation revealed during the tâtonnement process. Moreover, the call auctionpromotes the clustering of the thin order flow that otherwise would be spread overthe continuous session. Concentration favors liquidity and risk sharing, and helpsto aggregate individual pieces of information. In contrast, when the arrival rate oforders is high relative to the arrival rate of information, as would be the case infrequently traded stocks, the gains from rule-based calls could be small or evenoffset by the costs to traders of not being able to rebalance their portfolios incontinuous time. Therefore, we would expect the Madhavan’s (1992) switchingmechanism to better aggregate disperse information in small-cap infrequentlytraded stocks. Explicitly, we hypothesize that,
H4: Rule-based call auctions are more efficient in resolving informationasymmetries when stocks are thinly traded.
Switching to a Temporary Call Auction in Times of High Uncertainty
10 Clarke and Shastri (2001) report a negative relationship between several proxies of adverse selection costs
and the number of analysts assessing a stock. Easley et al. (1996) find the probability of information-based
trading to be lower for high volume stocks. Easley et al. (2002) find higher illiquidity premiums in stock
returns of small-cap stocks in the NYSE. Abad and Rubia (2005) corroborate this finding for the case of the
SSE. See Stoll (2000) for further evidence on the highest transaction costs of infrequently traded stocks.
19
XM8-07 BOLETIN 19 28/02/2007 11:44 Página 19

XM8-07 BOLETIN 19 28/02/2007 11:44 Página 20

4. Data and preliminary statistics
The database consists of limit order book files and trade files for 114 SSE-listed stocks,from June 2001 to December 2003. We consider stocks handled by the continuouselectronic platform of the SSE. Book files comprise the 5 best ask and bid quotes, thequoted depth, and the number of orders supporting each quote. Book registers aretime stamped to the nearest hundredth of a second, and updated each time the bookchanges. Trade files provide the price, size, and the time-stamp of each trade. Weidentify market orders, limit orders, and cancellations by matching the book and tradefiles using an algorithm originally developed by Pardo and Pascual (2005). Thedistinction between buyer-initiated and seller-initiated trades is straightforward sinceall trades consume liquidity either at the offer or at the bid side of the book.
We will pay special attention to two sets of stocks: (a) “IDX” stocks were constituentsof the official SSE index (IBEX-35) during the whole sample period; (b) “NIDX”stocks never belonged to the IBEX-35. There are 32 IDX stocks and 70 NIDX stocks.These sets of stocks represent the two archetypes of stock that can be found in theSSE: IDX stocks are frequently traded and highly liquid; NIDX stocks are lessfrequently traded and can be considered as illiquid. The other 12 stocks went in andout of the IBEX portfolio at least once during the whole sample period.
Our sample comprises 2735 static halts. However, we eliminate the 9-11-2001 halts(71) because of the unique circumstances involved. We discard 33 halts lasting morethan 5 minutes. Finally, we eliminate 7 halts of RIO (12-30-2002) because they tookplace uninterruptedly. From the remaining 2624 halts, 1460 are upper-limit haltsand 1164 are lower-limit halts.
Table I provides sample statistics. Panel A in Table I reports cross-sectional dailystatistics on several market indicators. This panel shows that IDX stocks are, inmedian terms, more active and liquid than the average stock. They also have asmaller relative tick size. Volatility indicators, however, are higher for IDX stocksthan for NIDX. This possibly amazing finding is the consequence of (a) a far moreintense flow of orders and (b) the inclusion of high-tech firms among the IDX stocks.
Panel B in Table I provides statistics about static halts. Upper-limit halts are morecommon than lower-limit halts, particularly among the NIDX stocks. The volumetraded at the equilibrium price of the auction represents a median 1.45% of thevolume negotiated during the continuous session. This same figure for the closingauctions, that also last 5 minutes, is more than 3 times larger (4.55%). Thiscomparison is more dramatic for the IDX stocks (1.05% versus 10.74%) than for the
Switching to a Temporary Call Auction in Times of High Uncertainty 21
XM8-07 BOLETIN 19 28/02/2007 11:44 Página 21

NIDX stocks (1.98% versus 2.35%). Table I therefore suggests that volatility auctionsmay play a more important role in the price discovery process of NIDX stocks.Sometimes, auction participants do not reach a consensus about the equilibriumprice of the stock. Since static halts are never extended, the auction finishes withoutan allocation price and, therefore, without trading. We call these auctions zero-volume halts. In our sample, 153 volatility auctions over 2624 are zero-volume halts.In relative terms, zero-volume halts are more frequent among the NIDX stocks.
Comisión Nacional del Mercado de Valores22
Preliminary Statistics TABLE I
This table reports statistics on the Spanish stocks and the rule-based (volatility) auctions considered in this study. Panel A provides median dailystatistics on the liquidity, the activity, the volatility, and the relative tick size of the 114 stocks in the sample. The sample includes data from June 2001to December 2003. Stocks are further grouped into index-stocks (IDX) and non-index stocks (NIDX). IDX stocks permanently belonged to the IBEX-35index; NIDX never belonged to the IBEX-35. Liquidity indicators are the quoted bid-ask spread; the book depth (number of shares displayed) at the 5best ask plus 5 best bid levels, and the number of limit orders stored at those same book levels. Activity indicators are the daily volume in shares andthe daily number of trades. Volatility proxies are the high-low quote midpoint ratio, and the number of quote midpoint changes. The relative tick iscomputed as the inverse of the daily average price of the stock. Panel A reports the median across days and stocks of all these statistics. Panel B reportsthe number of rule-based auctions in the sample, distinguishing also between upper-limit (UB) and lower-limit (LB) triggered auctions. We also reportsome cross-section average statistics for days with rule-based auctions: the volume (in shares) allocated at the market-clearing price of the auctionover the total volume traded during the continuous session, and the ratio of the volume (in shares) allocated at the market-clearing price of the closingauction over the total volume traded in the continuous session. Both volatility and closing auctions last 5 minutes plus a random end of maximum 30seconds. Finally, we report the number of auctions that concluded without achieving an equilibrium price (“zero-volume” halts).
A: General Statistics All (114) IDX (32) NIDX (70)
Liquidity: Spread 0.0375 0.0273 0.0567
Depth 17,765 25,692.5 14,137.5
Orders 17.5 19.8 15.9
Activity: Volume (shares) 72,398.5 647,525 23,227
Trades 52.5 463.5 24
Volatility: High-Low 0.018 0.0229 0.0149
Quote Changes 46 401 18
Tick: 1/Price 0.0995 0.0708 0.1191
B: Volatility Auctions Statistics
Number of Auctions: All Auction 2,624 639 1,619
UB Auction 1,460 329 936
LB Auction 1,164 310 683
Volume Halt/Continuous (%): All Auction 1.45 1.05 1.98
UB Auction 1.40 1.04 1.84
LB Auction 1.55 1.08 2.43
Volume Close Auction/Continuous (%): All Auction 4.55 10.74 2.35
UB Auction 3.68 10.41 2.05
LB Auction 5.96 11.35 3.27
Zero-Volume Auction: All Auction 153 7 137
UB Auction 92 5 82
LB Auction 61 2 55
XM8-07 BOLETIN 19 28/02/2007 11:44 Página 22

Figure 1 shows the intraday distribution of static halts. We split the trading session into17 half-hour intervals. Figure 1 reveals remarkable differences between IDX halts andNIDX halts. Static halts during the first (last) intervals of the trading session are morecommon among NIDX (IDX) stocks. The break point in the IDX halts distributioncoincides with the opening of the NYSE (15:30 Spanish Time). These patterns suggestthat the motives that use to cause IDX stocks to reach the price limits and trigger astatic halt may be unlike in nature to those that give rise to a NIDX static halt.
Intraday Distribution of Volatility Auctions FIGURE 1
We compute the percentage of static halts located in each half-hour interval of the SSE trading session. Wereport the resulting distribution for: (a) the whole sample (114 stocks); (b) IDX stocks, that is, those thatbelonged to the IBEX-35 portfolio during the whole sample period (32 stocks), and (c) NIDX stocks, that is, thosethat never were included in the IBEX-35 portfolio (70 stocks). Sample period: June 2001 – December 2003.
Switching to a Temporary Call Auction in Times of High Uncertainty 23
0.00
2.00
4.00
6.00
8.00
10.00
12.00
14.00
16.00
Perc
enta
ge
Half-Hour Interval
NIDXIDX
Sample
9:00-9:30
9:30-10:00
10:00-10:30
10:30-11:00
11:00-11:30
11:30-12:00
12:00-12:30
12:30-13:00
13:00-13:30
13:30-14:00
14:00-14:30
14:30-15:00
15:00-15:30
15:30-16:00
16:00-16:30
16:30-17:00
17:00-17:30
XM8-07 BOLETIN 19 28/02/2007 11:44 Página 23

XM8-07 BOLETIN 19 28/02/2007 11:44 Página 24

5. Empirical evidence on the efficiency of theswitching mechanism
5.1. Price discovery during short-lived rule-based call auctions
In this subsection, we test hypothesis H1 in section 3. This hypothesis states that short-term volatility auctions triggered by limit-hits contribute to price discovery, and theirmarket-clearing prices are semi-strongly efficient. The analysis design follows aprocedure proposed by Biais et al. (1999), henceforth BHS, based on unbiasedregressions. BSH study the learning process during the 8:30-10:00 a.m. pre-openingauction in the Paris Bourse by analyzing the information content in the sequence oftentative allocation prices. As in the SSE auctions, pre-opening orders can be submitted,cancelled, or modified before the allocation price is determined. Therefore, these ordersmight fail to be firm and informative. Consequently, indicative prices could reflect noise.BSH test this hypothesis against the alternative that indicative prices reflect learning.Under the alternative hypothesis, indicative prices are unbiased predictors of the truevalue of the stock, and their precision increases as the pre-opening period advances.
The “pure” noise and the “pure” learning hypotheses could be formulated as follows,
H0 : qt = E(m|I0) + εt [1]
H1 : qt = E(m|It) [2]
where m is the long-term value of the security; qt is the indicative price at time t;I0 is the public information set before the pre-opening period starts; It is the publicinformation set at time t; εt is a noise term, independent from m. Under hypothesis[1], hereafter referred as the pure noise hypothesis, no new information has beenprocessed into qt since the start of the auction. Under hypothesis [2], hereafterreferred as the pure learning hypothesis, qt is a martingale process.
BHS test the former hypotheses estimating the following unbiased regression,
m – E(m|I0) = α + β[qi – E(m|I0)] + wi [3]
The pure learning hypothesis posits that qi is the conditional expectation of m; changesin qi are entirely informative about the value of the security. Therefore, under the purelearning hypothesis β = 1. Contrarily, under the pure noise hypothesis β = 0, sincechanges in qt have no informational content. BHS interpret α as a risk premiumassociated with the uncertainty about m. BHS estimate equation [3] across days for each
Switching to a Temporary Call Auction in Times of High Uncertainty 25
XM8-07 BOLETIN 19 28/02/2007 11:44 Página 25

indicative price made public during the pre-opening period. They consider the closingprice of the session as the proxy for m, and the previous close as the proxy for E(m|I0).
Our analysis differs from BHS in that SSE volatility auctions are short-lived andinterrupt the continuous session. Therefore, traders have less time to submit andcancel orders, either manipulative or informative, and to discover the equilibriumvalue of the stock. However, volatility auctions are preceded by a length-varyingcontinuous trading interval during which learning may have progressed. Thesedifferences suggest that BHS conclusions regarding the long-term pre-openingperiod in the Paris Bourse might not be applicable to the case of the price-triggeredshort-term volatility auctions of the SSE.
We do not have information about indicative prices during the volatility auction;therefore, we estimate equation [3] only for the allocation price (qt). As BHS, we considerthe allocation price of the closing auction as the proxy for the equilibrium value of thestock (m). We differ from BHS, however, in that we consider the time-weighted quotemidpoint in the 5-minute interval before the auction to proxy for E(m|I0). In thismanner, we account for the learning occurred from the start of the opening auction(8:30 a.m.) to the start of the volatility auction. All prices are expressed in logs.
Table II summarizes the estimation of equation [3] by OLS with White robuststandard errors. We provide the results for the whole sample of volatility auctionsand also for the auctions of IDX and NIDX stocks separately. We discard zero-volume auctions because, by definition, they have no market-clearing price. Inaddition, we separate the auctions in three groups depending on their starting time.We consider the time intervals (open 11:00], (11:00 15:30], and (15:30 close]. Sinceour proxy for is the allocation price of the closing auction, we would expect β toartificially increase from the first to the third time interval.11
Table II provides the estimated coefficients α and β in [3] and the F-values of testingthe nulls and β = 0 and β = 1. Table II shows that the pure noise hypothesis in [1](β = 0) is always rejected at the 1% level. The market-clearing prices therefore reflectlearning, meaning there is a significant contribution to price discovery duringvolatility auctions. This finding is robust across subsamples and time intervals.Moreover, the pure learning hypothesis (β = 1) is never rejected for the sample ofIDX stocks. Despite the estimated β coefficients are also high, the null β = 1 isgenerally rejected for the NIDX stocks. Table II therefore suggests that allocationprices of NIDX auctions may be noisier than allocation prices of IDX auctions.Nonetheless, since IDX volatility auctions are more common towards the end of thesession (see Figure 1), and our proxy for the long-run value of the stock is the closingprice of the session, this finding could be explained by our particular experimentaldesign. Looking exclusively at the auctions located between 11:00 a.m. and 3:30p.m., the estimated betas for IDX and NIDX stocks are almost identical, though thenull β = 1 of is still rejected for the NIDX stocks. For the auctions triggered after 3:30p.m., the learning hypothesis is accepted for both NIDX and IDX stocks.
Comisión Nacional del Mercado de Valores26
11 Reboredo (2004) also studies price discovery during SSE volatility auctions. He considers, however, a
smaller sample of auctions, does not distinguish static from dynamic auctions, and does not control for the
starting time of the auction.
XM8-07 BOLETIN 19 28/02/2007 11:44 Página 26

Switching to a Temporary Call Auction in Times of High Uncertainty 27
Price discovery during price-triggered volatility auctions TABLE II
This table summarizes the estimation of the following regression model by OLS with White robust standard errors,
m – E(m|I0) = α + β[qi – E(m|I0)] + wi ,
with i indexing volatility auctions. As a proxy for the long-run value of the stock (m) we use the closing price of the session. The expectation E(m|I0), withI0 being the the information that is publicly available before the auction, is computed using the time-weighted average of the quote midpoint in the5-minute interval that precedes the limit-hit that triggers the auction. Finally, qi refers to the market-clearing price of the auction. The table reportsthe estimated α and β coefficients for the complete sample (“ALL”), and also for index stocks (“IDX”) and non-index stocks (“NIDX”) separately. An IDXstock was a constituent of the IBEX-35 during the whole sample period. A NIDX stock never belonged to the IBEX-35. We further split the auctions interms of time of the limit-hit in three groups: before 11:00 a.m., between 11:00 and 15:30, and between 15:30 and the end of the continuous session.Finally, we also classify auctions attending to the relative volume allocated at the end of the auction. This measure is computed as the ratio of thevolume (in shares) traded at the market-clearing price of the auction over the total volume traded during the corresponding continuous session. Anauction is considered of “low volume” (“high volume”) if the relative volume allocated is below (above) the 25% (75%) value of the empiricaldistribution of this variable. The table reports the F-value of testing the null β = 0 (pure noise hypothesis) against the alternative that β ≠ 0, and thenull β = 1 (pure learning hypothesis) against the alternative that β ≠ 1. It also shows the ratio between the residual mean square error and the meansquare error of m – E(m|I0), a proxy of the uncertainty about m remaining after the auction. The sample includes all the static volatility auctions thattook place in the Spanish Stock Exchange between June 2001 and December 2003. We exclude zero-volume auctions, that is, auctions that endedwithout finding a market-clearing price.
Coefficients F tests
Auctions β α H0: β=0 H0: β=1 RMSE (%) Adj-R2 Obs.
All
ALL 0.8311* 0.0024* 798.68 32.99 86.84 0.2462 2448
IDX 0.8923* 0.0006 72.83 1.06† 94.76 0.1022 632
NIDX 0.8015* 0.0036* 413.95 25.38 88.27 0.2207 1459
Before 11:00 a.m.
ALL 0.8051* 0.0011 27.23 12.15 85.66 0.2664 569
IDX 0.5778 –0.0044 3.23 1.72† 95.35 0.0285 77
NIDX 0.7393* 0.0035 98.97 12.31 89.65 0.1963 402
Between 11:00 a.m. and 15:30 p.m.
ALL 0.8478* 0.0027** 35.04 9.83 88.48 0.2168 1099
IDX 0.8442 0.0008 19.56 0.67† 96.47 0.0688 252
NIDX 0.8478* 0.0027 214.8 6.93 87.46 0.235 697
After 15:30 a.m.
ALL 0.9270* 0.0028* 280.81 1.74† 85.77 0.2643 780
IDX 1.0927* 0.0015 89.38 0.64† 87.96 0.2264 303
NIDX 0.9056* 0.0047* 133.51 1.45† 85.47 0.2696 360
Low volume
ALL 0.9570* 0.0025 344.42 0.7† 80.01 0.3598 612
IDX 0.9073** 0.0037 6.42 0.07† 98.35 0.0327 161
NIDX 0.8721* 0.0067** 17.75 2.53† 87.11 0.2413 368
Medium volume
ALL 0.7771* 0.0020 193.68 15.93 92.96 0.136 1225
IDX 0.9931* 0.0003 38.4 0† 94.52 0.107 313
NIDX 0.7491* 0.0020 34.93 15.14 91.87 0.1557 727
High volume
ALL 0.6810* 0.0027 258.58 56.73 83.86 0.2969 611
IDX 0.8293* –0.0019 40.56 1.72† 89.38 0.2013 158
NIDX 0.7499* 0.0033 186.59 20.76 81.34 0.3383 364
*, **: Statistically significant at the 1% and 5% level, respectively.† The null cannot be rejected at the 1% level.
XM8-07 BOLETIN 19 28/02/2007 11:44 Página 27

Table II also reports a measurement of the uncertainty remaining about the valueof the security once the information revealed during the volatility auction has beentaken into account. Our proxy is the ratio of the residual mean square error (RSME)of [3] over the mean square error of m – E(m|I0). All ratios are above 80%, confirmingthere is a significant learning during the auction, but also meaning that, regardlessof the auction, there is still a considerable amount of uncertainty to be resolved. Aremarkable point is that the residual variance is smaller for NIDX stocks. RSMEratios are generally below 90% for NIDX stocks and above 90% for IDX stocks. Thisfinding suggests that volatility auctions may be more important for the pricediscovery process of the less frequently traded and liquid SSE stocks.
Table II provides support to hypothesis H1 in section 3, suggesting that switchingto a call auction in times of market stress may facilitate price discovery. Madhavan(1992) also predicts that the efficiency of the allocation price should increase withthe number of participants in the auction. Unfortunately, our database does notinclude information about the number of participants in each auction. However, aproxy of investors’ participation could be the volume traded at the allocation price.We compute for each rule-based auction the ratio of allocated volume over totalvolume traded during the corresponding continuous session. Using the 25% and75% percentiles of the empirical distribution of that variable, we classify our eventsinto low-volume auctions (below or equal to the 25% percentile), high-volumeauctions (above the 75% percentile), and medium-volume auctions (between the25% and the 75% percentiles). We repeat the estimation of equation [3] for eachvolume-based set of auctions. Our findings are inconclusive. Inconsistently withMadhavan (1992) proposition, we find that both the IDX and NIDX subsampleshave lower betas among the high-volume class of auctions (0.82 and 0.74) thanamong the low-volume class of auctions (0.9 and 0.87). Moreover, for the NIDXstocks, the learning hypothesis is rejected at the 1% level for the high-volumeauctions, but cannot be rejected for the low-volume auctions. However, the RSMEratio is smaller for the high-volume auctions (89.4 and 81.3) than for the low-volumeauctions (98.3 and 87.1). These findings could be influenced by the intradaydistribution of high-volume and low-volume auctions. If low-volume auctions arelocated towards the end of the day and high-volume auctions towards thebeginning, our analysis will be biased in the direction of accepting low-volumeauctions to be more efficient. However, neither low-volume auctions nor high-volume auctions are more frequent in the 15:30-close interval than in the open-11:00 a.m. interval. Finally, the validity of our analysis depends on the quality of theproxy used.
5.2. Liquidity, activity, and volatility around rule-based call auctions
Empirical evidence on US discretionary halts (see Lee et al., 1994, Corwin andLipson, 2000, and Christie et al., 2002) reports unusually high volatility and tradingactivity levels, and irregularly low liquidity levels, persisting several hours after theresumption of the continuous session. These studies conclude that the uncertaintyis not resolved by US trading halts.
As a second step in our study of the performance of Madhavan’s (1992) switchingmechanism, we replicate former US studies by analyzing volatility, liquidity, and
Comisión Nacional del Mercado de Valores28
XM8-07 BOLETIN 19 28/02/2007 11:44 Página 28

trading activity two hours before and after SSE volatility auctions. For eachvolatility auction, we consider 5-minute intervals defined from the beginning of theauction backwards, and from the end of the auction forwards. For each 5-minuteinterval, we compute the accumulated volume (Vt) in shares; the bid-ask spread (St)weighted by time; the average displayed depth on the offer and demand sides of thelimit order book (Dt) weighted by time, and the midpoint volatility (σt), computedusing a high-low ratio. All previous variables are expressed as standard deviationsfrom the “ordinary” (without volatility auctions) days’ mean per stock and 5-minuteinterval. For each variable, we stack together the time series of all stocks andestimate the regression model in equation [4] by OLS with White robust standarderrors. The ( ) dummy variables correspond to the 24 5-minute intervals thatgo after (precede) the volatility auction.
[4]
The intercept in [4] captures the average deviation of each variable from ordinarydays. The estimated intercepts show that days with volatility auctions are morevolatile ( ), less liquid ( ), and more active ( )than ordinary days, at the 1% level of statistical significance. This finding isconfirmed when IDX and NIDX stocks are considered separately. In Figure 2, wedisplay the estimated coefficients of the dummy variables in [1] whenever they arefound to be statistically different from zero at the 1% level. We provide the findingsfor the complete sample (Figure 2.a), and for the IDX stocks (Figure 2.b) and NIDXstocks (Figure 3.c) separately.
In general, the patterns shown in Figure 2 do not differ from those previouslyreported for US discretionary halts. Volatility achieves its maximum level in the 5-minute interval following the auction, a pattern that is consistent acrosssubsamples. Unusual volatility levels persist at least two hours after the auction, butthey experience a rapid decay in less than one hour. For example, the averagevolatility level for IDX (NIDX) stocks five minutes before the auction is 2.5 (4.3)standard deviations larger than the ordinary days’ mean for the same time interval.In the five minutes that follow the resumption of the continuous session, volatilityreaches a maximum of 2.8 (5.2) standard deviations, but one hour after it is only 0.3(0.4) standard deviations larger that the ordinary days’ mean.
Trading volume attains its highest level in the 5-minute interval before the auctionis triggered, but it remains unusually high after the continuous session restarts. Itdecays from 0.67 (1.02) for the IDX (NIDX) stocks 5 minutes after the auction to0.25 (0.29) one hour after the auction. Regarding liquidity, the bid-ask spread iswider after the auction than before the auction, but it reverts to the daily mean in30 minutes for the IDX stocks and in 1 hour for the NIDX stocks. We do not findremarkable differences between the displayed book depth after the auction andbefore the auction.12
˜ .α0 0 35V = ˜ . , ˜ – .α α0 00 26 0 13S D= = ˜ .ασ0 0 39=
y D D ut j
b
j jb
ja
j ja
t= + + +=
−
=∑ ∑α α α0 24
1
1
24
–
DjbDj
a
Switching to a Temporary Call Auction in Times of High Uncertainty
12 The pattern reported for the book depth should be taken with caution. The SSE allows the submission of
partially hidden limit orders. Therefore, the displayed depth is not equal to the total depth available in the
LOB. The use of hidden limit orders in the SSE is analyzed by Pardo and Pascual (2004).
29
XM8-07 BOLETIN 19 28/02/2007 11:44 Página 29

Comisión Nacional del Mercado de Valores30
5-minute intervals around the auction
DepthVolumeSpreadVolat
(b) IDX stocks
–24
–22
–20
–18
–16
–14
–12
–10 –8 –6 –4 –2
Auct
ion 2 4 6 8 10 12 14 16 18 20 22 24
Stan
dard
dev
iatio
ns fr
om th
e no
n-ha
lt da
ys' m
ean
per i
nter
val
0
1
2
3
4
5
6
Stan
dard
dev
iatio
ns fr
om th
e no
n-ha
lt da
ys' m
ean
per i
nter
val
-0.5
0
0.5
1
1.5
2
2.5
3
3.5
4
4.5
–24
–22
–20
–18
–16
–14
–12
–10 –8 –6 –4 –2
Auct
ion 2 4 6 8 10 12 14 16 18 20 22 24
5-minute intervals around the auction
DepthVolumeSpreadVolat
(a) All stocks
Liquidity, volatility and activity around volatility auctions FIGURE 2
This table provides the average volatility, liquidity, and trading activity levels around the SSE volatility auctions in our sample. We consider 24 5-minute intervals before and after each auction. Liquidity in each interval is measured by the bid-ask spread and the average displayed depth onoffer and demand sides of the book, both weighted by time; trading activity is measured by the accumulated volume in shares, and volatility iscomputed as the high-low ratio of the quote midpoint. All the statistics are expressed in standard deviations from the ordinary days’ mean perstock and 5-minute interval. An ordinary day is a day without volatility auctions. For each statistic, we stack together the time series of the 114stocks in our sample and estimate the following regression model,
[F1]
where the RHS variables are dummies that control for the 5-minute intervals before and after the auction. The figure represents the estimatedalpha coefficients in [F1] whenever they are statistically significant at the 1% level. Panel (a) shows the findings for the 114 stocks in the sample;panel (b) shows the findings for the IDX stocks, that is, those that belonged to the IBEX-35 portfolio during the whole sample period (32 stocks),and panel (c) reports the findings for the NIDX stocks, that is, those that never were included in the IBEX-35 portfolio (70 stocks). Sample period:June 2001 – December 2003.
y D D ut j
b
jjb
ja
jja
t= + + +=−
−
=∑ ∑α α α024
1
1
24
XM8-07 BOLETIN 19 28/02/2007 11:44 Página 30

As Lee et al. (1994, pg. 185) point out, in the NYSE case the trading cessation and theparticular reopening mechanism (call auction) used cannot be consideredindependently, since both are fundamental features of the NYSE halts. Therefore,higher levels of volume and volatility after NYSE halts may be due to: (a) the lack ofrecent trading; (b) the inefficiency of the reopening mechanism, or (c) a combinationof both. Something similar occurs with Nasdaq halts, since a trading cessation periodis followed by a 5-minute quotation period for market makers used to reopen thecontinuous trading session. In the SSE case, however, higher volume and volatilityafter rule-based auctions can only be attributed to the inefficiency of the reopeningmechanism since there is no trading cessation period. Our findings suggest that, evenwith price discovery during the auction, uncertainty is not fully resolved by theswitching mechanism. As a consequence, rule-based auctions do not calm the market.
A possible explanation for the failure of the SSE reopening mechanism in calmingthe market is that volatility auctions are too short. Five minutes may be insufficientto achieve a consensus about the true value of the stock, resulting in a noisyreopening price. Christie et al. (2002) show that Nasdaq halts that reopen thefollowing day with a 90-minute quotation period are associated with significantlydampened volatility and spread effects compared with intraday halts, which reopenwith a 5-minute quotation period. They conclude that 90-minute quotation periodsare more efficient because they allow for increased information disseminationduring the halt. Unfortunately, we cannot test this hypothesis since SSE auctionslasting more than 5 minutes are too rare. Alternatively, the SSE rule-based callauctions may fail to calm the market because the static price limits in place duringthe auction are binding. However, only 3.7% of the volatility auctions in our sampleresulted in a price revision superior than 50% of the distance between the static
Switching to a Temporary Call Auction in Times of High Uncertainty 31
5-minute intervals around the auction
DepthVolumeSpreadVolat
(c) NIDX stocks
Stan
dard
dev
iatio
ns fr
om th
e no
n-ha
lt da
ys' m
ean
per i
nter
val
-0.5
0
0.5
1
1.5
2
2.5
3
3.5
4
4.5
–24
–22
–20
–18
–16
–14
–12
–10 –8 –6 –4 –2
Auct
ion 2 4 6 8 10 12 14 16 18 20 22 24
Liquidity, volatility and activity around volatility auctions FIGURE 2
( continuation)
XM8-07 BOLETIN 19 28/02/2007 11:44 Página 31

price and either the upper or the lower limit during the auction. Indeed, only oneauction concluded with an allocation price equal to the upper price limit.
5.3. Price continuation during and after rule-based call auctions
In this subsection, we test hypothesis H2. This hypothesis posits that the switchingmechanism proposed by Madhavan (1992) as implemented by the SSE is effectivein preventing overreaction and not delaying price discovery. In order to test thishypothesis, we investigate whether the price behavior during and after volatilityauctions is dominated by price continuations. For each SSE rule-based auction, we usethe price limit reached (Li), the market-clearing price of the auction (Ai), and a post-auction price (Ci) to compute the stock returns during the call auction, ,and the stock returns following the auction, .
The delaying information hypothesis (hereafter DIH) posits that circuit breakers delayprice discovery by obstructing the trading process. In the SSE case, DIH proponentswould argue that the true value of the stock is above (below) the upper (lower) pricelimit that has been reached. Efficient learning during SSE volatility auctions shouldtherefore lead to price continuations after an upper-limit (lower-limit)hit. The overreaction hypothesis (hereafter OH) agrees in that circuit breakers delayinformation revelation, but also the overreaction of noise traders to new information.In the SSE case, the OH proponents would argue that the biased expectation of thenoise traders about the true value of the stock is above (below) the upper (lower) pricelimit that has been reached. During the auction, noise traders would continue pushingprices towards their perceived fair price. Therefore, this hypothesis would also predictprice continuations during the auction.
To correctly evaluate the performance of SSE switching mechanism, however, we mustlook at the post-auction returns ( ). Suppose an upper-limit auction. Price continuationafter the auction ( ) would signal that the auction either performs poorly inpreventing overreaction or delays price discovery. It could be that overreaction is notliquidated during the auction because the perceived fair value by noise traders is abovethe upper price limit during the auction. Alternatively, the market-clearing price of theauction, possibly manipulated, may underestimate the true value of the stock, or perhapsthe fair value is above the upper limit during the auction. Whatever the case maybe, the conclusion should be that the switching mechanism postpones to resolution ofuncertainty until the post-auction period. We consider three alternative proxies for thepost-auction price: the quote midpoint 30 minutes after the auction, the quote midpoint1 hour after the auction, and the allocation price of the closing auction. Once more, weonly exclude zero-volume auctions from the analysis. For each auction, we compare and with the ordinary days’ median return during the same time interval.
Table III summarizes our empirical findings. We report the median auction returns( ) and post-auction returns ( ) in excess over the ordinary days’ median returnsduring the same time interval. We provide separated results for upper-limit andlower-limit triggered auctions. We use the Wilcoxon nonparametric sign-rank test tocheck whether the auction days’ medians and the ordinary days’ medians arestatistically different. As in previous tables, we report the results for IDX and NIDXstocks separately.
riCri
A
riC
riA
riC >0
riC
r riA
iA> <( )0 0
r C AiC
i i= ( )ln / r A Li
Ai i= ( )ln /
Comisión Nacional del Mercado de Valores32
XM8-07 BOLETIN 19 28/02/2007 11:44 Página 32

The most remarkable finding in Table III is that during both the auction periodand the three post-auction periods, we observe statistically significant price reversals,in median terms. For upper-limit auctions, excess returns are negative during
and after the auction, independently of the post-auction intervalconsidered. The opposite pattern is found for lower-limit auctions. In accumulatedterms , the median excess return over ordinary days is –0.42% (0.63%)from the start of the upper-limit (lower-limit) auction to 30 minutes after thecontinuous session resumes, and –0.55% (0.75%) up to 1 hour after. This pattern isconsistent across subsamples, but stronger for NIDX stocks. For the upper-limit(lower-limit) auctions, the median is –0.55% (0.93%) for NIDX stocks, and -0.16% (0.29%) for IDX stocks. In accumulated terms, the excess return up to 30minutes after the auction is –0.73% (1.10%) for NIDX stocks and –0.24% (0.19%)for IDX stocks. We also find that the trend towards reversion is stronger for lower-limit auctions than for upper-limit auctions. Price reversals during the auction areat odds with the DIH and OH hypotheses. Moreover, price reversals in the post-auction period are inconsistent with the switching mechanism systematicallydelaying price discovery and overreaction.
In general, our findings suggest that overreaction by noise traders may explain amajor percentage of the SSE volatility auctions. The switching mechanism providestime for price reassessment and eradicates the overreaction, but the priceadjustment is not completed during the auction. Thus, price reversals during theauction are followed by further price reversal after the auction. An excessively shortcall auction or price manipulation by strategic informed traders may explain thisprice pattern. Our findings sustain hypothesis H2 since price reversals are morecommon than continuations after volatility auctions. We report two remarkableasymmetries: price reversions are stronger for lower-limit auctions than for upper-limit auctions and for NIDX stocks than for IDX stocks. These asymmetries suggestoverreaction to new information to trigger NIDX rule-based auctions in general, and
riA
r r riT
iA
iC= +( )
riC <( )0ri
A <( )0
Switching to a Temporary Call Auction in Times of High Uncertainty 33
Price behavior during and after rule-based auctions TABLE III
This table reports stock returns both during and after rule-based volatility auctions in excess over ordinary days’ returns. An ordinary day is a daywithout events (rule-based auctions). We distinguish between upper-limit auctions and lower-limit auctions. We compute different continuouslycompounded returns: (a) the return from the price limit triggered to the market-clearing price of the auction; (b) the return from the allocationprice of the auction to the quote midpoint 30 minutes and 60 minutes after the continuous session resumes, and (c) the return from the allocationprice of the auction to the allocation price of the closing auction. Returns are reported in medians across auctions. We provide tests on the nullthat the median during event days are statistically different than the median across ordinary days using the Wilcoxon’s nonparametric sign ranktest. Finally, the analysis is replicated for the IDX subsample (index constituents), and the NIDX subsample (non index stocks) separately.
Median excess return (x1000)
Stock Auction 30 min. 60 min. Close
All Upper –0.9034* –3.3016* –4.5781* –4.0006*
Lower 1.3569* 4.9528* 6.1578* 7.5196*
IDX Upper –0.1212 –1.4998* –2.3034* –0.8696
Lower 0.6129* 2.3177* 1.2961* 2.0677**
NIDX Upper –1.0217* –4.4543* –6.2405* –6.1071*
Lower 1.5044* 7.8110* 9.5006* 10.3954*
*, **: Statistically significant at the 1% and 5% level, respectively.
XM8-07 BOLETIN 19 28/02/2007 11:44 Página 33

lower-limit auctions in particular, more frequently than IDX rule-based auctions andupper-limit auctions, respectively.
5.4. Adverse selection costs around rule-based auctions
We finish our empirical analysis on the efficiency of Madhavan’s (1992) switchingmechanism by testing whether rule-based SSE call auctions improve (reduce)information asymmetries. In particular, we test hypotheses H3 and H4 in section 3.We estimate adverse selection costs using an empirical model of price formationthat parallels the model proposed by Brennan and Subrahmanyam (1996), which isactually based on Hasbrouck (1991), and Foster and Viswanathan (1993). We choosethis approach because it is valid for a relatively broad range of theoreticalspecifications. The model is founded on the widespread believe that the averageprice response to trade-related shocks is a good proxy for the adverse selectioncomponent of price changes.13
Let qt–1 be the logarithm of the quote midpoint right before a trade at time t; let xt
be the signed trade size; let ∆qt = qt – qt–1 be the price impact of the trade at time t,and let Dt be a trade indicator that equals 1 for buyer-initiated trades and –1 forseller initiated trades. The original Brennan and Subrahmanyam’s model is,
[5]
[6]
The model is defined in trade time. Equation [5] is the generating process for signedtrade sizes. The rational behind this model is that the information content of a traderesides in its unexpected component (wt), since xt – wt is perfectly predictable giventhe past history of trades and quote changes. The λ coefficient in [6] measures theinformation content in trade-related shocks, and it proxies for the adverse selectioncomponent of price changes. The coefficient on Dt – Dt–1 is a fixed costs component.
We slightly modify equation [6] so as to accommodate the model to the particularitiesof our experiment. Foster and Viswanathan (1993) and Brennan and Subrahmanyam(1996) apply the model to transaction prices, using the second term in the RHS of[6] to capture the bid-ask bounce. Following Hasbrouck (1991), we apply the modelto quote midpoints and, therefore, that term is unnecessary. Moreover, we extendthe third component in the RHS of [6] to capture unusual levels of λ in the pre-auction and post-auction intervals. Explicitly, we replace [6] by the followingalternative equation for the quote midpoint changes (for the case of upper-limitauctions),
[7]
∆q U H wt qu
t ju
j tu
jj
t t= + + +
⎛
⎝
⎜⎜⎜
⎞
⎠
⎟⎟⎟
+=≠
∑α λ λ φ ε,–
.12
0
12
∆q D D wt q t t t t= + −( )+ +−α λ εΨ 1 .
x x q wt x j
jt j j t j t
j
= + + +=
− −=
∑ ∑α β γ1
5
1
5
∆ ,
Comisión Nacional del Mercado de Valores
13 See also Huang and Stoll (1997) and Madhavan, Richardson, and Roomans (1997), among others.
34
XM8-07 BOLETIN 19 28/02/2007 11:44 Página 34

The dummy Ut in [7] equals one when the transaction t takes place in a day with avolatility auction triggered by a violation of the upper price limit. Therefore, thecoefficient λu measures the average risk premium in days with upper-limit auctionswith respect to the average risk of the stock (λ). Equation [7] also accounts for theaverage supplementary risk around rule-based auctions. We consider two hours fromthe start of the auction backwards, and two hours from the end of the auction forwards,both divided into 10-minute intervals. We use the dummy variables , with j from–12 to –1, to control for the distance from the time stamp of the transaction t to thebeginning of an upper-limit triggered auction. Similarly, we use the dummyvariables , with j from 1 to 12, to control for the distance from the resumptionof the continuous trading to the time stamp of the transaction t. Thus, positive andsignificant coefficients would signal additional risk during days with rule-basedauctions concentrated either in the pre-auction or in the post-auction period. Weestimate model [5]-[7] for upper-limit auctions and lower-limit auctions separately.The equation [7] for lower-limit auctions is defined analogously.
The estimation of [5] and [7] proceeds as follows. First, we estimate equation [5] foreach stock by OLS, with White robust standard errors, and using transaction datafrom the ordinary days. Then, we use the estimated coefficients to obtain theunexpected trade-size (wt) of all transactions executed during event (auction) days.Second, we standardize wt and qt per stock using the mean and standard deviationof the ordinary days’ transactions. Third, we stack together the time series of allstocks and proceed to estimate [7] also by robust OLS.
The average estimated adverse-selection costs coefficient across stocks for ordinarydays (λ) is 0.42. Days with events (rule-based auctions) have a statistically significantpositive risk premium of λu = 0.027 for upper-limit auctions, and negative λl = –0.042for lower-limit auctions. Figure 3.a reports the estimated coefficients in equation[7] for the whole sample. We only report the coefficients that are statisticallysignificant at the 1% level. We provide the coefficients for both upper-limit auctions(light bars) and lower-limit auctions (dark bars). Despite that we observe unusualrisk more than one hour before the auction is triggered, it achieves its highest levelduring the pre-auction period in the 10-minute interval preceding the auction. Ratherthan decreasing, adverse selection costs reach maximum levels in the 10 minuteinterval following the resumption of the continuous trading, decreasing progressivelythereafter. Information asymmetry risk takes almost two hours in revert to itsaverage level. Therefore, we should conclude that the switching mechanism fails inreducing adverse selection costs, therefore rejecting hypothesis H3 in section 3.Moreover, the high adverse selection costs levels observed during at least one hourafter the auction suggest informed traders wait until continuous trading resumes totrade and realize their information advantage. This corroborates our previousconclusion that the rule-based auction does not completely resolve priceuncertainty.
Figure 3.b and 3.c report the estimated coefficients for the IDX and NIDX stocks.NIDX stocks support a more dramatic increase in adverse selection costs, both forlower-limit and upper-limit auctions, than IDX stocks in the last 10-minute pre-auction interval. The higher pre-auction risk for NIDX stocks suggests the marketexpects more value-motivated trading in thinly stocks to be advanced in time when
φji
φji
φju
H j tu,
H j tu,
Switching to a Temporary Call Auction in Times of High Uncertainty 35
XM8-07 BOLETIN 19 28/02/2007 11:44 Página 35
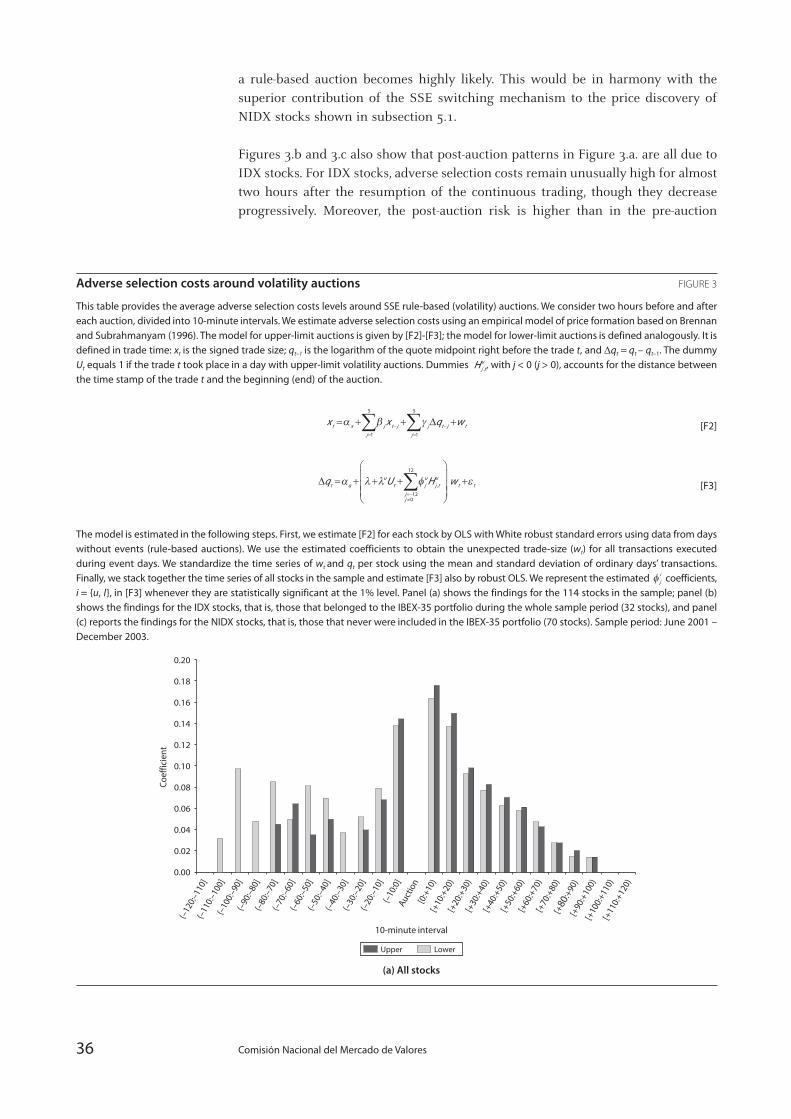
a rule-based auction becomes highly likely. This would be in harmony with thesuperior contribution of the SSE switching mechanism to the price discovery ofNIDX stocks shown in subsection 5.1.
Figures 3.b and 3.c also show that post-auction patterns in Figure 3.a. are all due toIDX stocks. For IDX stocks, adverse selection costs remain unusually high for almosttwo hours after the resumption of the continuous trading, though they decreaseprogressively. Moreover, the post-auction risk is higher than in the pre-auction
Comisión Nacional del Mercado de Valores36
Coef
ficie
nt
10-minute interval
(a) All stocks
LowerUpper
0.00
0.04
0.10
0.14
0.16
0.18
0.20
0.12
0.08
0.06
0.02
(–12
0:–1
10]
(–11
0:–1
00]
(–10
0:–9
0](–
90:–
80]
(–80
:–70
](–
70:–
60]
(–60
:–50
](–
50:–
40]
(–40
:–30
](–
30:–
20]
(–20
:–10
](–
10:0
]Au
ctio
n[0
:+10
)[+
10:+
20)
[+20
:+30
)[+
30:+
40)
[+40
:+50
)[+
50:+
60)
[+60
:+70
)[+
70:+
80)
[+80
:+90
)[+
90:+
100)
[+10
0:+1
10)
[+11
0:+1
20)
Adverse selection costs around volatility auctions FIGURE 3
This table provides the average adverse selection costs levels around SSE rule-based (volatility) auctions. We consider two hours before and aftereach auction, divided into 10-minute intervals. We estimate adverse selection costs using an empirical model of price formation based on Brennanand Subrahmanyam (1996). The model for upper-limit auctions is given by [F2]-[F3]; the model for lower-limit auctions is defined analogously. It isdefined in trade time: xt is the signed trade size; qt–1 is the logarithm of the quote midpoint right before the trade t, and ∆qt = qt – qt–1. The dummyUt equals 1 if the trade t took place in a day with upper-limit volatility auctions. Dummies , with j < 0 (j > 0), accounts for the distance betweenthe time stamp of the trade t and the beginning (end) of the auction.
[F2]
[F3]
The model is estimated in the following steps. First, we estimate [F2] for each stock by OLS with White robust standard errors using data from dayswithout events (rule-based auctions). We use the estimated coefficients to obtain the unexpected trade-size (wt) for all transactions executedduring event days. We standardize the time series of wt and qt per stock using the mean and standard deviation of ordinary days’ transactions.Finally, we stack together the time series of all stocks in the sample and estimate [F3] also by robust OLS. We represent the estimated coefficients,i = {u, l}, in [F3] whenever they are statistically significant at the 1% level. Panel (a) shows the findings for the 114 stocks in the sample; panel (b)shows the findings for the IDX stocks, that is, those that belonged to the IBEX-35 portfolio during the whole sample period (32 stocks), and panel(c) reports the findings for the NIDX stocks, that is, those that never were included in the IBEX-35 portfolio (70 stocks). Sample period: June 2001 –December 2003.
φ ji
∆q U H wt qu
t ju
j tu
jj
t t= + + +⎛
⎝
⎜⎜⎜
⎞
⎠
⎟⎟⎟
+=≠
∑α λ λ φ ε,
–
12
0
12
x x q wt x j
j
t j j t j t
j
= + + +=
− −
=∑ ∑α β γ
1
5
1
5
∆
Hj tu,
XM8-07 BOLETIN 19 28/02/2007 11:44 Página 36

period during at least twenty minutes. For NIDX stocks, however, the post-auctioninformation asymmetry risk is not statistically different to the average levelobserved in the same time interval during ordinary days. Therefore, the SSEswitching mechanism performs well in reducing information asymmetries whenthe stock is infrequently traded. This last finding provides support to hypothesis H4in section 3.
Switching to a Temporary Call Auction in Times of High Uncertainty 37
Coef
ficie
nt
10-minute interval
(b) IDX stocks
LowerUpper
(–12
0:–1
10]
(–11
0:–1
00]
(–10
0:–9
0](–
90:–
80]
(–80
:–70
](–
70:–
60]
(–60
:–50
](–
50:–
40]
(–40
:–30
](–
30:–
20]
(–20
:–10
](–
10:0
]Au
ctio
n[0
:+10
)[+
10:+
20)
[+20
:+30
)[+
30:+
40)
[+40
:+50
)[+
50:+
60)
[+60
:+70
)[+
70:+
80)
[+80
:+90
)[+
90:+
100)
[+10
0:+1
10)
[+11
0:+1
20)
0.00
0.04
0.10
0.14
0.16
0.18
0.20
0.12
0.08
0.06
0.02
10-minute interval
(c) NIDX stocks
LowerUpper
Coef
ficie
nt
(–12
0:–1
10]
(–11
0:–1
00]
(–10
0:–9
0](–
90:–
80]
(–80
:–70
](–
70:–
60]
(–60
:–50
](–
50:–
40]
(–40
:–30
](–
30:–
20]
(–20
:–10
](–
10:0
]Au
ctio
n[0
:+10
)[+
10:+
20)
[+20
:+30
)[+
30:+
40)
[+40
:+50
)[+
50:+
60)
[+60
:+70
)[+
70:+
80)
[+80
:+90
)[+
90:+
100)
[+10
0:+1
10)
[+11
0:+1
20)
–0.15
–0.10
0.05
0.15
0.20
0.25
0.30
0.10
0.00
–0.05
Adverse selection costs around volatility auctions FIGURE 3
(continuation)
XM8-07 BOLETIN 19 28/02/2007 11:44 Página 37

XM8-07 BOLETIN 19 28/02/2007 11:44 Página 38
6. Summary and conclusions
This paper has evaluated the performance of switching from a continuous marketto a temporary call auction in times of elevated uncertainty, as proposed byMadhavan (1992). The SSE implements this switching mechanism in the form ofnon discretionary call auctions. SSE rule-based auctions are short-lived, and theyare triggered when either the upper or the lower intraday price limit is triggered.This study complements previous analyses on the performance of US discretionaryhalts.
Our findings are mixed. On the positive side, we show there is effective pricelearning during the rule-based auction. The market-clearing price of the auction ismore efficient than the quotes in place before the auction is triggered. Moreover,price behavior during and after the auction is dominated by price reversals ratherthan price continuations. This price pattern is stronger when stocks are thinlytraded and the switching mechanism in triggered by the lower price limit. Pricereversals during the auction are compatible with the auction preventingoverreaction. Price reversals after the auction, however, suggest that SSE 5-minuteauctions are not sufficient to correct the pre-auction overreaction.
On the negative side, we find that, as it has already been shown for discretionaryhalts, switching to a temporary call auction does not calm the market. Unusuallyhigh volatility, trading activity, and illiquidity levels persist after rule-basedauctions. Finally, we report a significant increase in the information asymmetry riskright before the auction is triggered, suggesting that informed traders mayanticipate their trading plans as the rule-based auction becomes imminent. Theincrease is particularly dramatic for thinly traded stocks, suggesting that the pre-auction risk faced by informed traders is higher in that case. After the auction,adverse selection costs remain unusually high, meaning that rule-based auctions donot reduce information asymmetries. There is, however, a remarkable exception: forthinly traded stocks, the information asymmetry risk reverts immediately toordinary days’ levels.
Our findings suggest the switching mechanism may perform better when stocks areinfrequently traded. The evidence we report supports the initiative of thoseEuropean markets that have created special segments based on sequences of singlelong-lasting call auctions to handle the trading activity of their least liquid and leastactive stocks. The failure of SSE rule-based call auctions in calming the market andreducing information asymmetries among frequently traded stocks puts forwardthat SSE auctions may be too short.
Switching to a Temporary Call Auction in Times of High Uncertainty 39
XM8-07 BOLETIN 19 28/02/2007 11:44 Página 39

There are a few intriguing findings in this paper. First, we find that more volumeallocated at the market-clearing price of the auction does not imply more efficientlearning during the auction. A comparative analysis of the performance of zero-volume auctions against high-volume auctions may provide additional insights onthis issue. Second, we report asymmetries between upper-limit auctions and lower-limit auctions. Price reversals are stronger during and after upper-limit auctionsthan during and after lower-limit auctions, respectively. It could be argued thisfinding is the consequence of noise traders overreacting more frequently to badnews than to good news. In this were the case, the lower limit would be lessfrequently hit by information-based price movements than the upper limit. Lower-limit auctions would therefore be more likely linked to price reversions than upper-limit auctions. All these issues, however, deserve a more detailed analysis.
Comisión Nacional del Mercado de Valores40
XM8-07 BOLETIN 19 28/02/2007 11:44 Página 40

7. References
ABAD, D. and R. PASCUAL, 2006, A Note on the Magnet Effect of Price Limits, Working Paper,Universidad de las Islas Baleares, Spain.
ABAD, D. and A. RUBIA, 2005, Modelos de Estimación de la Probabilidad de NegociaciónInformada: Una Comparación Metodológica en el Mercado Español, Revista de EconomíaFinanciera, 7, 26-53.
AMIHUD, Y. and H. MENDELSON, 1991, Volatility, Efficiency, and Trading: Evidence from theJapanese Stock Market, Journal of Finance, 46, 1765-1789.
BIAIS, B., L. GLOSTEN, and C. SPATT, 2005, Market microstructure: A survey of microfundations,empirical results, and policy implications, Journal of Financial Markets, 217-264.
BIAIS, B., P. HILLION, and C. SPATT, 1999, Price discovery and learning during the preopeningperiod in the Paris Bourse, Journal of Political Economy, 107, 1218-1248.
BRENNAN, M.J., and A. SUBRAHMANYAM, 1996, Market microstructure and asset pricing: On thecompensation for illiquidity in stock returns, Journal of Financial Economics, 41, 441-464.
CHEN, H., 1998, Price limits, overreaction, and price resolution in futures markets, Journal ofFutures Markets, 18, 243-263.
CHRISTIE, W.G., S.A. CORWIN, and J.H. HARRIS, 2002, Nasdaq trading halts: The impact of marketmechanisms on prices, trading activity, and execution costs,” Journal of Finance, 57, 1443-1478.
CLARKE, J., and K. SHASTRI, 2001, On information asymmetry metrics, Working Paper University ofPittsburgh.
COPELAND, T.E., and D. GALAI, 1983, Information effects on the bid-ask spread, Journal of Finance,28, 1457-1469.
CORWIN, S.A., and M.L. LIPSON, 2000, Order flow and liquidity around NYSE trading halts, Journalof Finance, 55, 1771-1801.
EASLEY, D., S. HVIDKJAER, and M. O’HARA, 2002, Is information risk a determinant of asset returns?Journal of Finance, 57, 2185-2222.
EASLEY, D., N.M. KIEFER, M. O’HARA, and J.B. PAPERMAN, 1996, Liquidity, information, andinfrequently traded stocks, Journal of Finance, 51, 1405-1436.
FAMA, E., 1989, Perspectives on October 1987, or What Did we Learn from the Crash?, inR. KAMPHUIS, R. KORMENDI and J. WATSON, eds., Black Monday and the Future of FinancialMarkets, Homewood, IL, Dow-Jones-Irwin, Inc., 71-82
FOSTER, F.D., S. VISWANATHAN, 1993, Variations in trading volume, return volatility, and tradingcosts: Evidence on recent price formation models, Journal of Finance, 48, 187-211.
HARRIS, 1998, Circuit breakers and program trading limits: Lessons learned, in R.E. Litan and A.M.Santomero, eds., Brookings Wharton Papers on Financial Services, (Brookings Institutions Press,Washington DC), 17-63.
HASBROUCK, J., 1991, Measuring the information content of stock trades, Journal of Finance, 46,179-207.
HUANG, R.D., and H.R. STOLL, 1997, The components of the bid-ask spread: a general approach,Review of Financial Studies, 10, 995-1034.
KIM, K.A., and G. RHEE, 1997, Price limit performance: Evidence from the Tokyo Stock Exchange,Journal of Finance, 52, 885-901.
Switching to a Temporary Call Auction in Times of High Uncertainty 41
XM8-07 BOLETIN 19 28/02/2007 11:44 Página 41

KIM, K.A., and R.J. SWEENEY, 2002, Effects of price limits on information revelation, Working Paper,State University of New York.
LAUTERBACH, B., 2001, A note on trading mechanism and securities’ value: The analysis of rejectsfrom continuous trade, Journal of Banking and Finance, 25, 419-430.
LEE, J., READY, and R.K. SEGUIN, 1994, The intraday stock return characteristics surrounding pricelimit hits, Journal of Multinational Financial Management, 14, 485-501.
LEHMAN, B.N., 1989, Commentary: Volatility, Price Resolution and Effectiveness of Price Limits,Journal of Financial Services Research, 3, 205-209.
MADHAVAN, A., 1992, Trading mechanisms in securities markets, Journal of Finance, 47, 607-641.
MADHAVAN, A., M. RICHARDSON, and M. ROOMANS, 1997, Why do security prices change? Atransaction-level analysis of NYSE stocks, Review of Financial Studies, 10, 1035-1064.
MEDRANO, L.A., and X. VIVES, 2001, Strategic behavior and price discovery, RAND Journal ofEconomics, 32, 221-248.
PARDO, A., and R. PASCUAL, 2005, On the hidden side of liquidity, Working Paper, Universidad delas Islas Baleares, Spain.
REBOREDO, J.C., 2004, The switch from continuous to periodic trading as a circuit breaker:Empirical evidence at the Spanish Stock Market, Mimeo.
STOLL, H.R., 2000, Friction, Journal of Finance, 55, 1479-1514.
Comisión Nacional del Mercado de Valores42
XM8-07 BOLETIN 19 28/02/2007 11:44 Página 42

XM8-07 BOLETIN 19 28/02/2007 11:44 Página 43

XM8-07 BOLETIN 19 28/02/2007 11:44 Página 44

Switching to a TemporaryCall Auction in Timesof High UncertaintyDavid AbadRoberto Pascual
XM8-07 Cubierta 19 28/2/07 11:47 Página 1