xlnt consulting - big data all slides 20130516 … of management's decision making process“...
TRANSCRIPT
Big Data Den Haag, 16 May 2013
© Tom Breur, 2013 1
Big Data: Leveraging your customer data
Tom Breur Big Data
Den Haag, 16 May 2013
Agenda Releasing value in your database Strengths and weaknesses in customer
data Importance of data quality Combining databases and market
research Lessons from real-world case studies
Big Data Den Haag, 16 May 2013
© Tom Breur, 2013 2
Releasing value in your DWH Some of the “recent” trends that are
driving the Advanced Analytics “hype”: Gartner: “pattern based strategies” Data give competitive advantage (e.g.:
“Competing on Analytics”, etc.) Star schema data warehousing ↔ customer
centric marketing
What is a data warehouse?
"A data warehouse is a subject-oriented, integrated, time-variant and non-volatile collection of data in support of management's decision making process“ – Bill Inmon (1990)
“A copy of transaction data specifically structured for query and analysis“ – Ralph Kimball (1996)
Big Data Den Haag, 16 May 2013
© Tom Breur, 2013 3
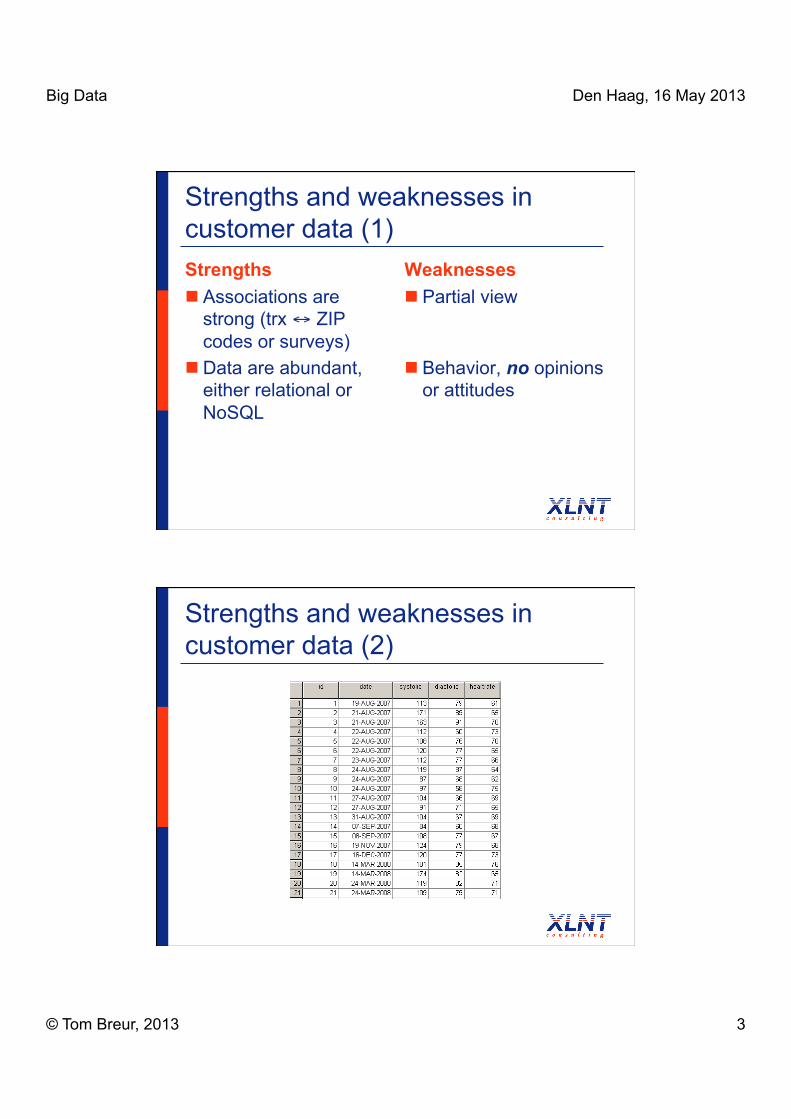
Strengths and weaknesses in customer data (1) Strengths Associations are
strong (trx ↔ ZIP codes or surveys)
Data are abundant, either relational or NoSQL
Weaknesses Partial view
Behavior, no opinions or attitudes
Strengths and weaknesses in customer data (2)
Big Data Den Haag, 16 May 2013
© Tom Breur, 2013 4
Importance of data quality (1) Poor quality data costs a lot of money
(e.g.: Olson, 2003) – but making the business case (e.g.: English 1999, 2009) can be challenging
www.beyenetwork.be/channels/5089/ data quality papers, mainly “data quality in the organization”
Importance of data quality (2)
Dorian Pyle, 2003
“Data is very fickle stuff. At best, it is but a pale reflection of reality. At anything less than the best, it seems intent on leading the unwary astray. Invariably, the data that a data miner has to use seems particularly well constructed to promote frustration.”
(emphasis added)
Big Data Den Haag, 16 May 2013
© Tom Breur, 2013 5
Combining dB & market research Many options:
Associative data fusion Website “experiments” Media & DM
Provide quantitative and qualitative evidence, and always explain your results
Real-world case studies Non-profit lottery organization (Dutch
“Grote Club Actie”) Who is your “true” customer?
Credit card company Targeting key segments
Retail financial services Merging web data with media research
Big Data Den Haag, 16 May 2013
© Tom Breur, 2013 6
Conclusion Data provide a sutainable source of
competitive advantage Unlocking this value can be a challenge, in
particular with “dirty data” Don’t breathe from your own exhaust, at
least not for too long… There are always more options (& data)
for analysis
Exercise (10’ + 10’) Form pairs/groups of two people (non-
colleagues) Take 5 minutes to list existing data
sources you are using – create poster Take another 5 minutes to:
List potentially new sources of data (and their expected merits)
Suggest “new” derived variables/information from existing sources
Big Data Den Haag, 16 May 2013
© Tom Breur, 2013 7
References – data strategy Thomas Davenport & Jeanne Harris (2007) Competing
on Analytics – The New Science of Winning. ISBN# 1422103323
Thomas Redman (2008) Data Driven: Profiting from Your Most Important Business Asset. ISBN# 1422119122
Ian Ayres (2006) Super Crunchers – Why Thinking-By-Numbers is the New Way To Be Smart. ISBN# 0553805401
Thomas Davenport, Jeanne Harris & Robert Morison (2010) Analytics at Work. ISBN# 1422177696
References – data warehousing Bill Inmon, Claudia Imhoff & Ryan Sousa (2001)
Corporate Information Factory. ISBN# 0471399612 Ralph Kimball (1996) The Data Warehouse Toolkit:
Practical Techniques for Building Dimensional Data Warehouses. ISBN# 0471153370
Ralph Kimball (1998) The Data Warehouse Lifecycle Toolkit: Experts Methods for Designing, Developing, and Deploying Data Warehouses. ISBN# 0471153370
Hans Hultgren (2013) Modeling the Agile Data Warehouse with Data Vault. ISBN# 061572308X

Big Data Den Haag, 16 May 2013
© Tom Breur, 2013 8
References – data quality Jack Olson (2003) Data Quality: The Accuracy
Dimension. ISBN# 1558608915 Larry English (1999) Improving Data Warehouse
and Business Information Quality: Methods for Reducing Costs and Increasing Profits. ISBN# 0471253839
Arkady Maydanchik (2007) Data Quality Assessment. ISBN# 0977140024
Larry English (2009) Information Quality Applied. ISBN# 9780470134474
References – data mining Michael Berry & Gordon Linoff (1999) Mastering
Data Mining: The Art and Science of Customer Relationship Management. ISBN# 0471331236
Dorian Pyle (2003) Business Modeling and Data Mining. ISBN# 155860653X
Dorian Pyle (1999) Data Preparation for Data Mining. ISBN# 1558605290
Peter van der Putten (2010) On Data Mining in Context. ISBN# 9789088911439 (also on web!)
Big Data Den Haag, 16 May 2013
© Tom Breur, 2013 9
Big Data analytics
Tom Breur Big Data
Den Haag, 16 May 2013
17
Agenda Rise of “Big Data” Long-tail marketing – size does matter “Big Data” & analytics?
www.xlntconsulting.com 2 18
Big Data Den Haag, 16 May 2013
© Tom Breur, 2013 10
Opkomst van “Big Data”
www.xlntconsulting.com 3 19
Database = relational ? We have known other times… There will be more “other times” New sources:
GPS, RFID, geodata Social media/unstructured data Clickstream data Etc.
www.xlntconsulting.com 4 20
Big Data Den Haag, 16 May 2013
© Tom Breur, 2013 11
www.xlntconsulting.com
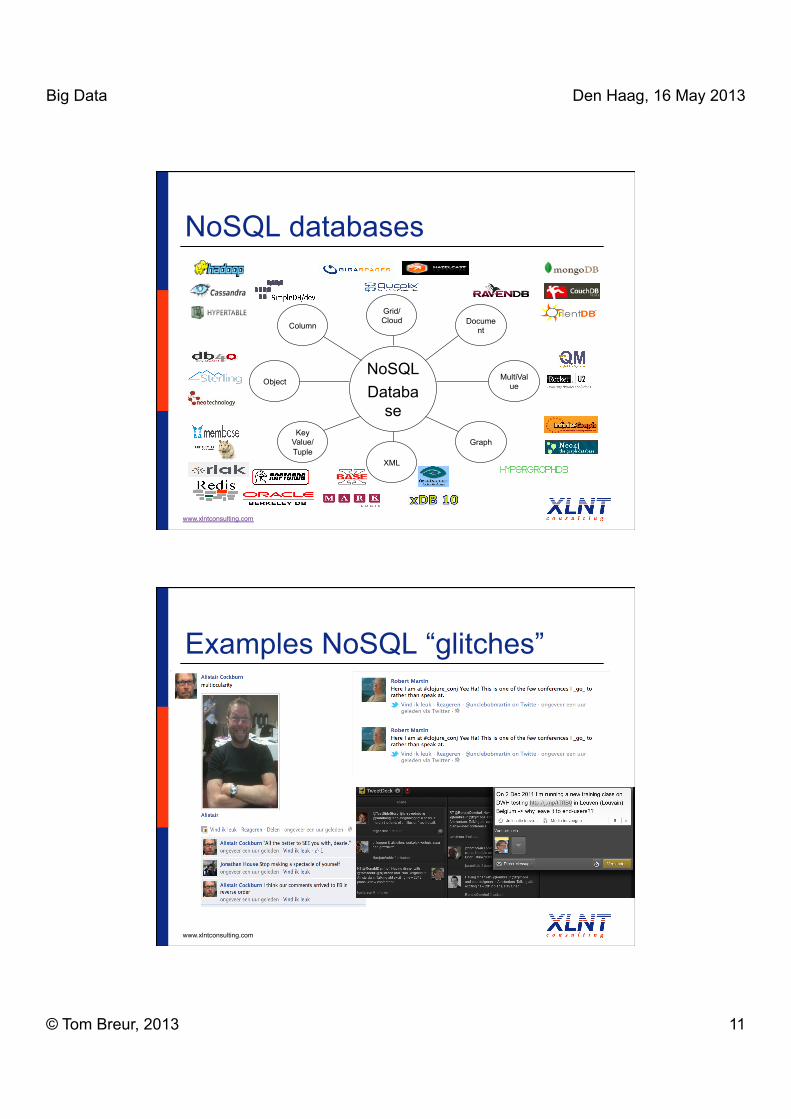
NoSQL Databa
se
Column Document
Grid/Cloud
Object
Graph
XML
MultiValue
NoSQL databases
Key Value/Tuple
Examples NoSQL “glitches”
www.xlntconsulting.com
Big Data Den Haag, 16 May 2013
© Tom Breur, 2013 12
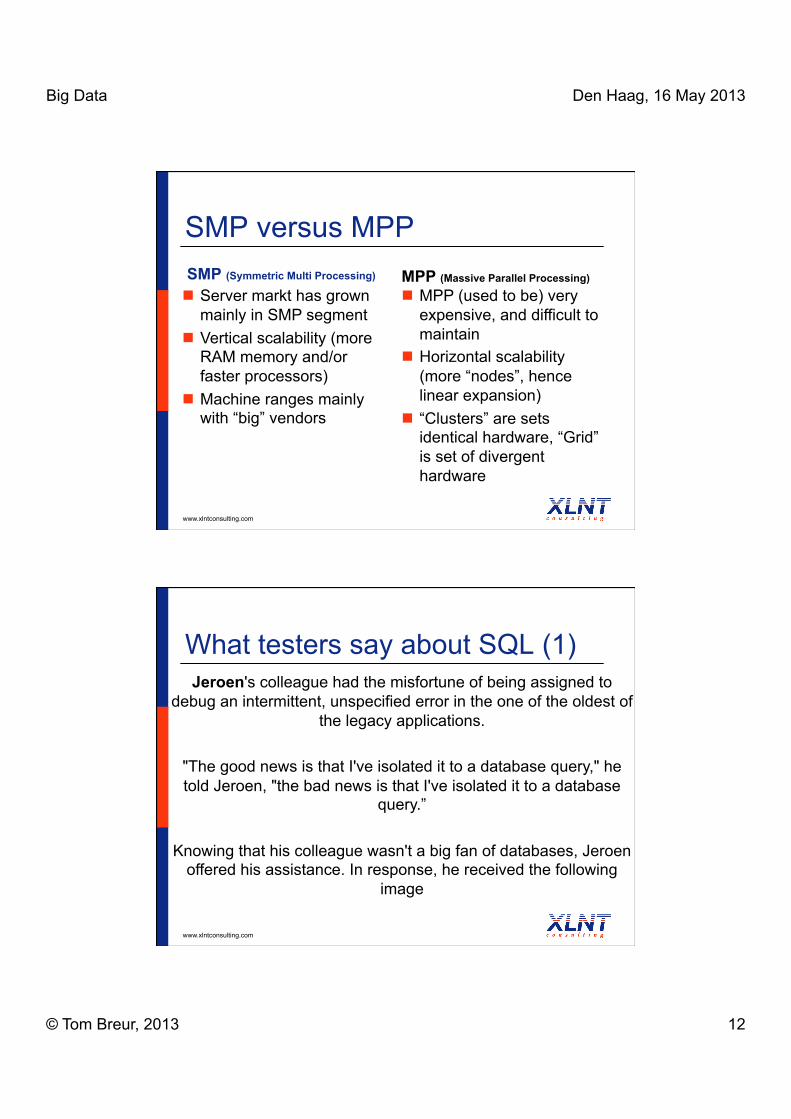
SMP versus MPP SMP (Symmetric Multi Processing)
Server markt has grown mainly in SMP segment
Vertical scalability (more RAM memory and/or faster processors)
Machine ranges mainly with “big” vendors
MPP (Massive Parallel Processing)
MPP (used to be) very expensive, and difficult to maintain
Horizontal scalability (more “nodes”, hence linear expansion)
“Clusters” are sets identical hardware, “Grid” is set of divergent hardware
www.xlntconsulting.com
What testers say about SQL (1)
www.xlntconsulting.com
Jeroen's colleague had the misfortune of being assigned to debug an intermittent, unspecified error in the one of the oldest of
the legacy applications.
"The good news is that I've isolated it to a database query," he told Jeroen, "the bad news is that I've isolated it to a database
query.”
Knowing that his colleague wasn't a big fan of databases, Jeroen offered his assistance. In response, he received the following
image
Big Data Den Haag, 16 May 2013
© Tom Breur, 2013 13
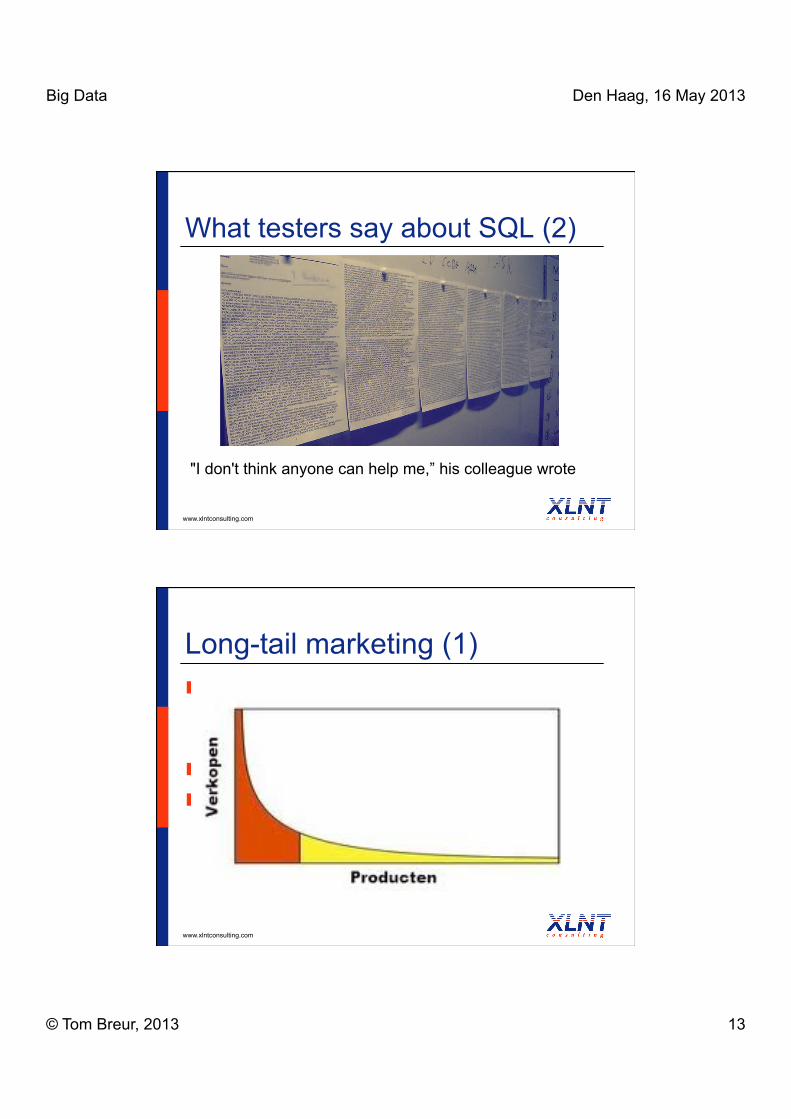
What testers say about SQL (2)
www.xlntconsulting.com
"I don't think anyone can help me,” his colleague wrote
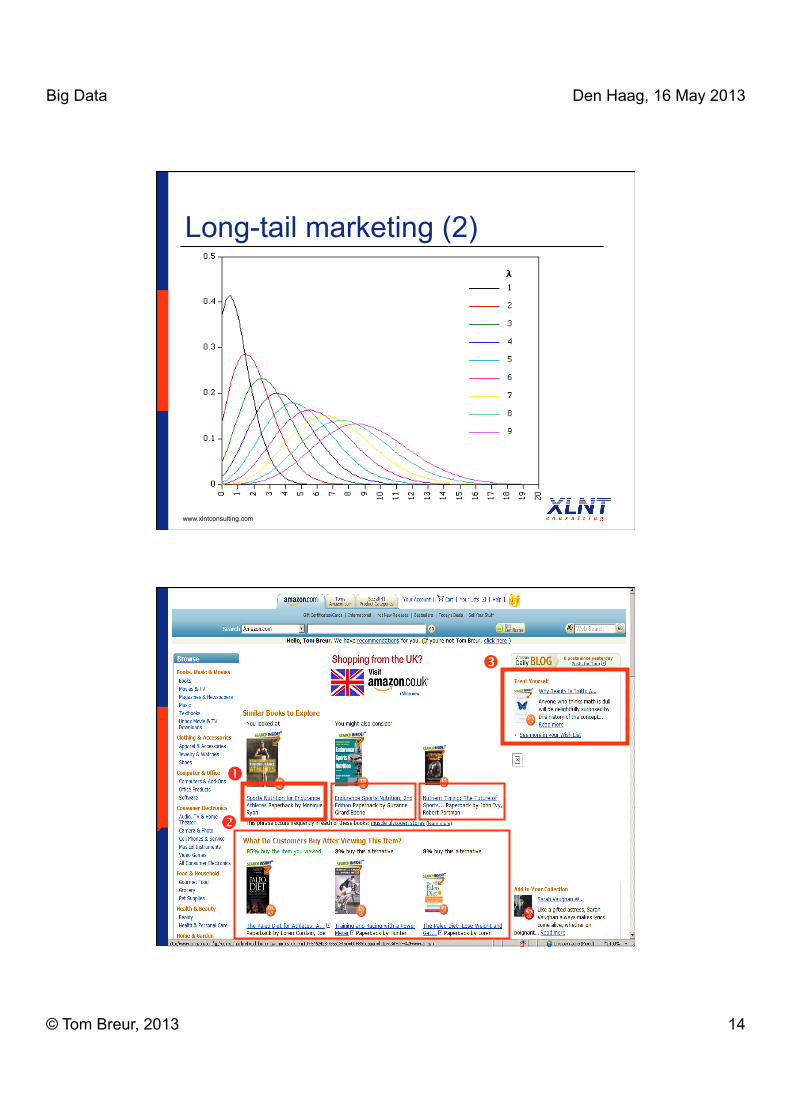
Long-tail marketing (1)
www.xlntconsulting.com
Internet (met name) maakt het mogelijk om steeds consumenten te bereiken, tegen lage(re) marginale kosten
Ergo: de (bereikbare) “markt” groeit! Mass-marketing ⇒ one-to-one
Big Data Den Haag, 16 May 2013
© Tom Breur, 2013 14
Long-tail marketing (2)
www.xlntconsulting.com
www.xlntconsulting.com 11
Big Data Den Haag, 16 May 2013
© Tom Breur, 2013 15
“Big Data” & analytics (1)
www.xlntconsulting.com
“Big Data” are mostly (much) too cumbersome for analysis, dispose 99% asap!
NoSQL is new, and not very user-friendly for analysis
Few analytics tools available for Big Data, e.g.: “R” (Open Source)
Hence: analysis mostly relational, deployment (if needed) NoSQL
“Big Data” & analytics (2)
www.xlntconsulting.com
Big Data make statistics (seemingly) superfluous
“Trivial” differences may (still) lead to significant effects
Many applications for data mining & machine learning algorithms

Big Data Den Haag, 16 May 2013
© Tom Breur, 2013 16
Conclusions (1) Big Data (NoSQL) is a technical evolution
to process previously unheard of data volumes (relatively inexpensively) Flipside is lower consistency, availability of
replication, possibilities for rollback, etc. Size/Scale can give a competitive edge
31 www.xlntconsulting.com
Conclusions (2) For persistent analytics “Big Data” are
‘just’ another source Big Data make statistics (almost)
superfluous, but knowledge of empirical methods remains essential
Big Data & analytics together often remain a pipe dream
However, they are both already reality!
32 www.xlntconsulting.com
Big Data Den Haag, 16 May 2013
© Tom Breur, 2013 17
Big Data: Agile BI & Data Virtualization
Tom Breur Big Data
Den Haag, 16 May 2013
It’s a stretch… Volumes of data are growing (fast)! Variety of sources keeps expanding:
Social media, RFID, log-files, GPS, etc. Business users need their data (much)
sooner: monthly ⇒ weekly ⇒ daily ⇒ intra-day
BI in support of operational processes, calls for (near) real-time data
Big Data Den Haag, 16 May 2013
© Tom Breur, 2013 18
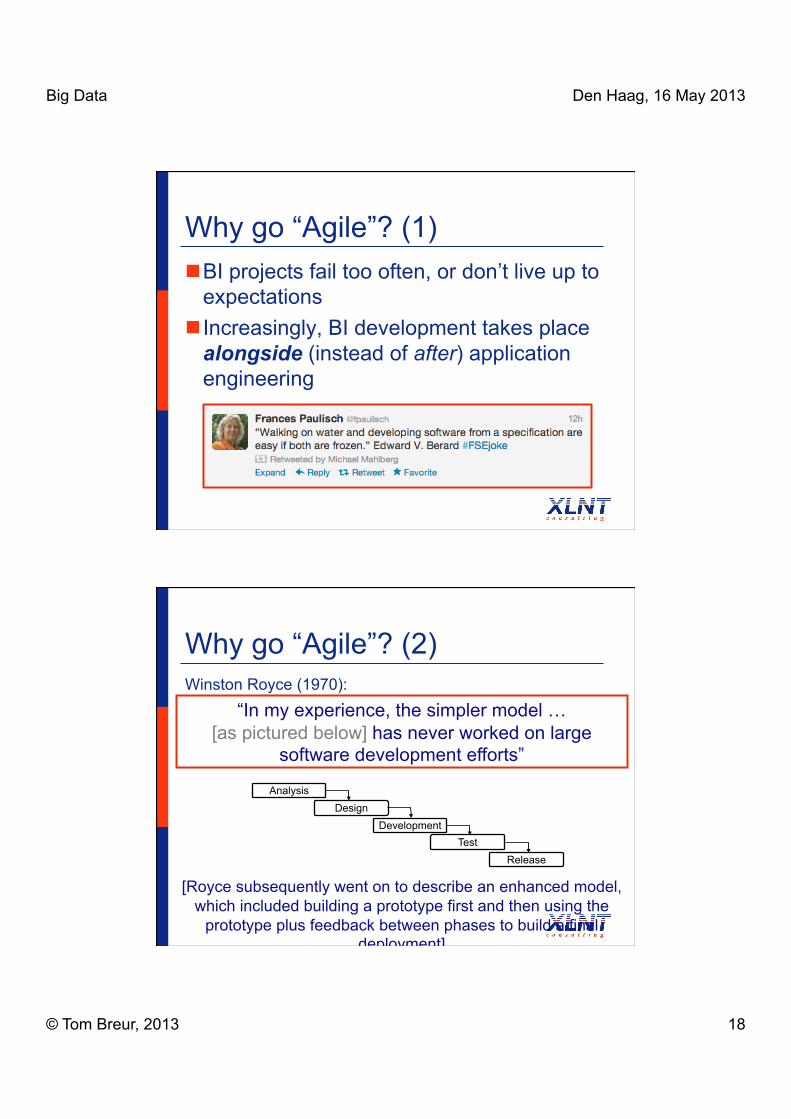
Why go “Agile”? (1) BI projects fail too often, or don’t live up to
expectations Increasingly, BI development takes place
alongside (instead of after) application engineering
Why go “Agile”? (2) Winston Royce (1970):
Release Test
Development Design
Analysis
“In my experience, the simpler model … [as pictured below] has never worked on large
software development efforts”
[Royce subsequently went on to describe an enhanced model, which included building a prototype first and then using the
prototype plus feedback between phases to build a final deployment]
Big Data Den Haag, 16 May 2013
© Tom Breur, 2013 19
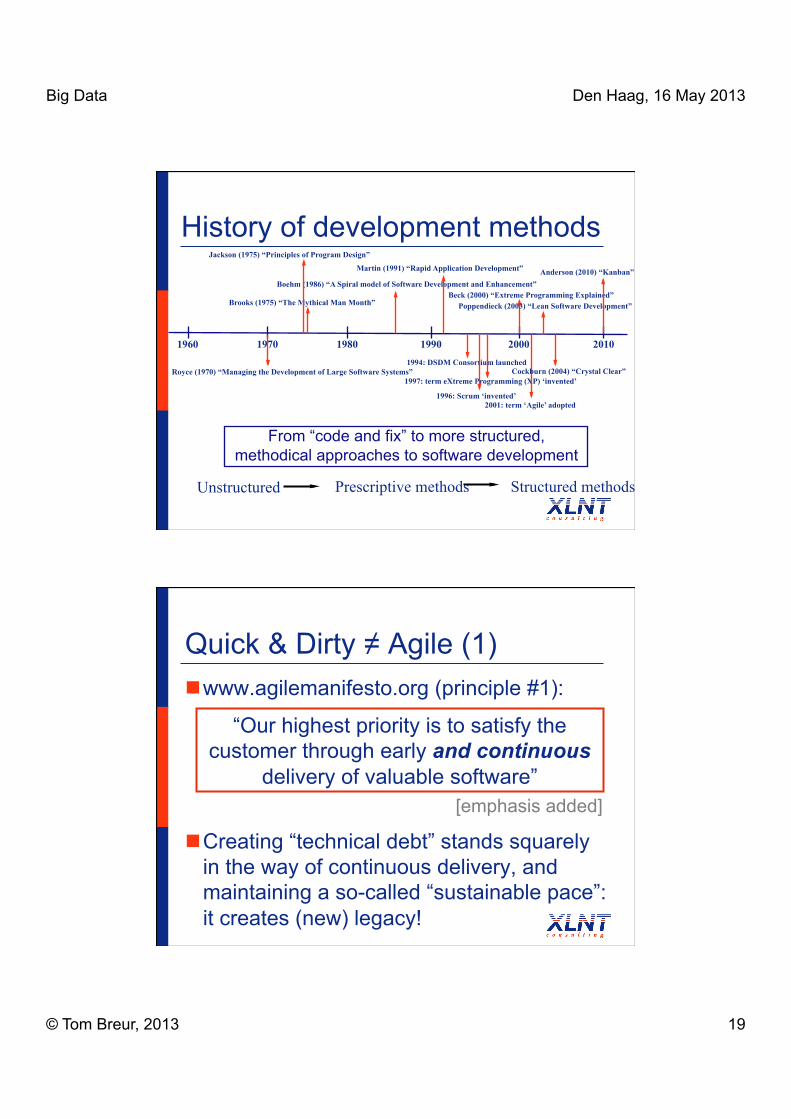
History of development methods
2000 1990 1980 1970 1960
Brooks (1975) “The Mythical Man Month”
Boehm (1986) “A Spiral model of Software Development and Enhancement”
Martin (1991) “Rapid Application Development”
Jackson (1975) “Principles of Program Design”
1994: DSDM Consortium launched
1997: term eXtreme Programming (XP) ‘invented’
2001: term ‘Agile’ adopted
From “code and fix” to more structured, methodical approaches to software development
Beck (2000) “Extreme Programming Explained”
Unstructured Prescriptive methods Structured methods
2010
1996: Scrum ‘invented’
Poppendieck (2003) “Lean Software Development”
Anderson (2010) “Kanban”
Cockburn (2004) “Crystal Clear” Royce (1970) “Managing the Development of Large Software Systems”
Quick & Dirty ≠ Agile (1) www.agilemanifesto.org (principle #1):
Creating “technical debt” stands squarely in the way of continuous delivery, and maintaining a so-called “sustainable pace”: it creates (new) legacy!
“Our highest priority is to satisfy the customer through early and continuous
delivery of valuable software” [emphasis added]
Big Data Den Haag, 16 May 2013
© Tom Breur, 2013 20
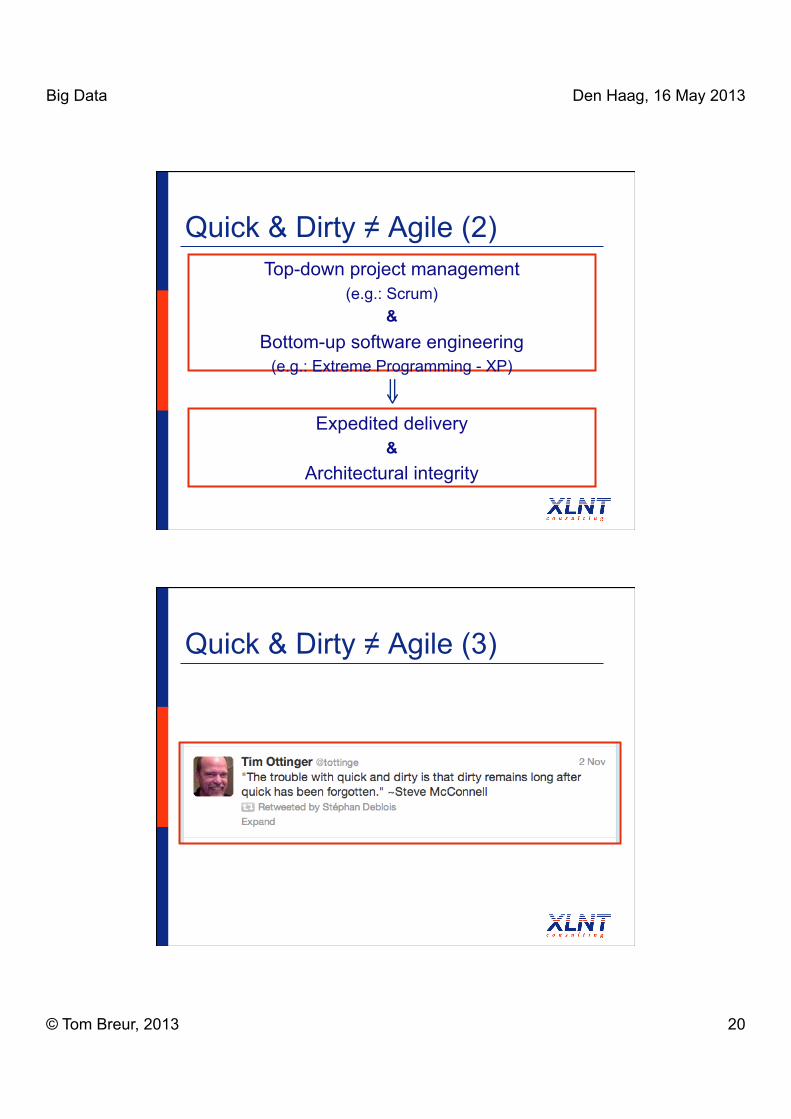
Quick & Dirty ≠ Agile (2) Top-down project management
(e.g.: Scrum) &
Bottom-up software engineering (e.g.: Extreme Programming - XP)
⇓ Expedited delivery
& Architectural integrity
Quick & Dirty ≠ Agile (3)
Big Data Den Haag, 16 May 2013
© Tom Breur, 2013 21
BI requirements Information products trigger change
requests: new data ⇒ insights ⇒ new requirements
Gerald M. (Jerry) Weinberg:
“Without stable requirements, development can’t stabilize, either”
BI: means and ends uncertainty Means uncertainty How do we get there? Lack of “design patterns” Data integration fraught
with data quality issues Lack of Master Data
Management Lack of Meta Data No agreement on how to
conform dimensions
Ends uncertainty Where are we going to? Requirements are difficult
to pin down Diverse end-user groups Ambiguous business
case(s) Scope is unclear Data warehouses are
never “done”
Big Data Den Haag, 16 May 2013
© Tom Breur, 2013 22
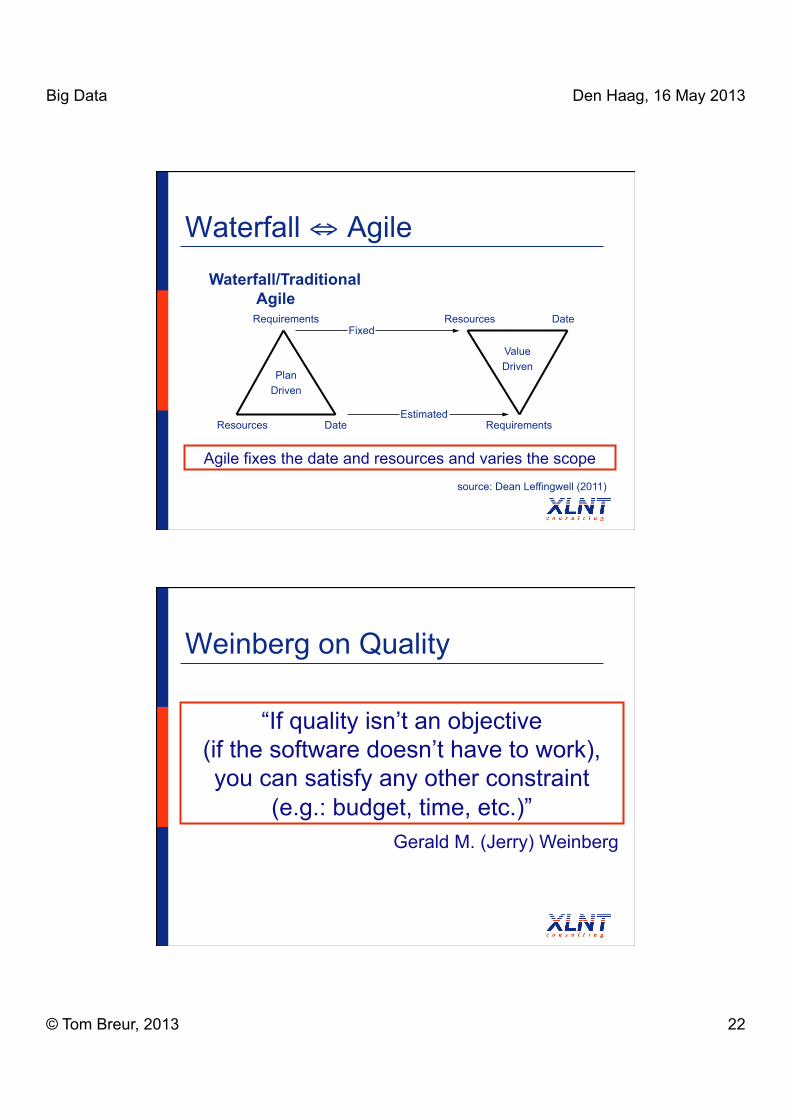
Waterfall ⇔ Agile
source: Dean Leffingwell (2011)
Waterfall/Traditional Agile
Plan Driven
Value Driven
Requirements Resources Date
Resources Date Requirements
Agile fixes the date and resources and varies the scope
Fixed
Estimated
Weinberg on Quality
“If quality isn’t an objective (if the software doesn’t have to work), you can satisfy any other constraint
(e.g.: budget, time, etc.)” Gerald M. (Jerry) Weinberg
Big Data Den Haag, 16 May 2013
© Tom Breur, 2013 23
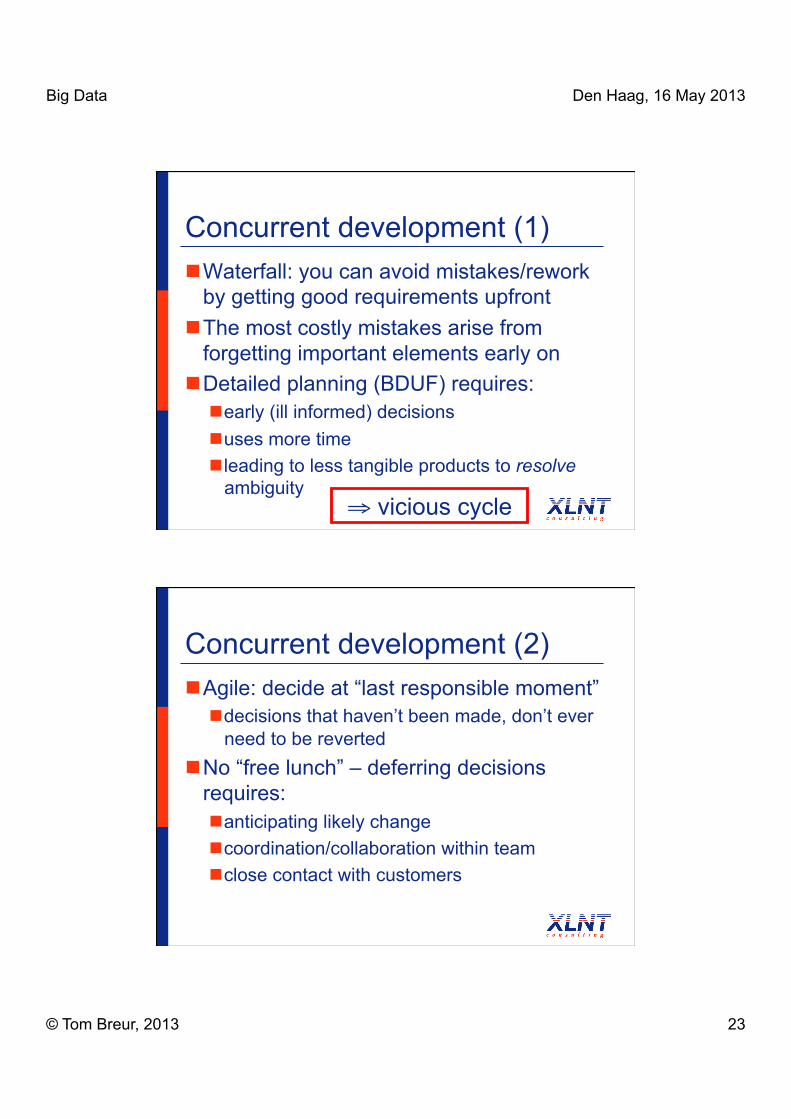
Concurrent development (1) Waterfall: you can avoid mistakes/rework
by getting good requirements upfront The most costly mistakes arise from
forgetting important elements early on Detailed planning (BDUF) requires:
early (ill informed) decisions uses more time leading to less tangible products to resolve
ambiguity ⇒ vicious cycle
Concurrent development (2) Agile: decide at “last responsible moment”
decisions that haven’t been made, don’t ever need to be reverted
No “free lunch” – deferring decisions requires: anticipating likely change coordination/collaboration within team close contact with customers
Big Data Den Haag, 16 May 2013
© Tom Breur, 2013 24
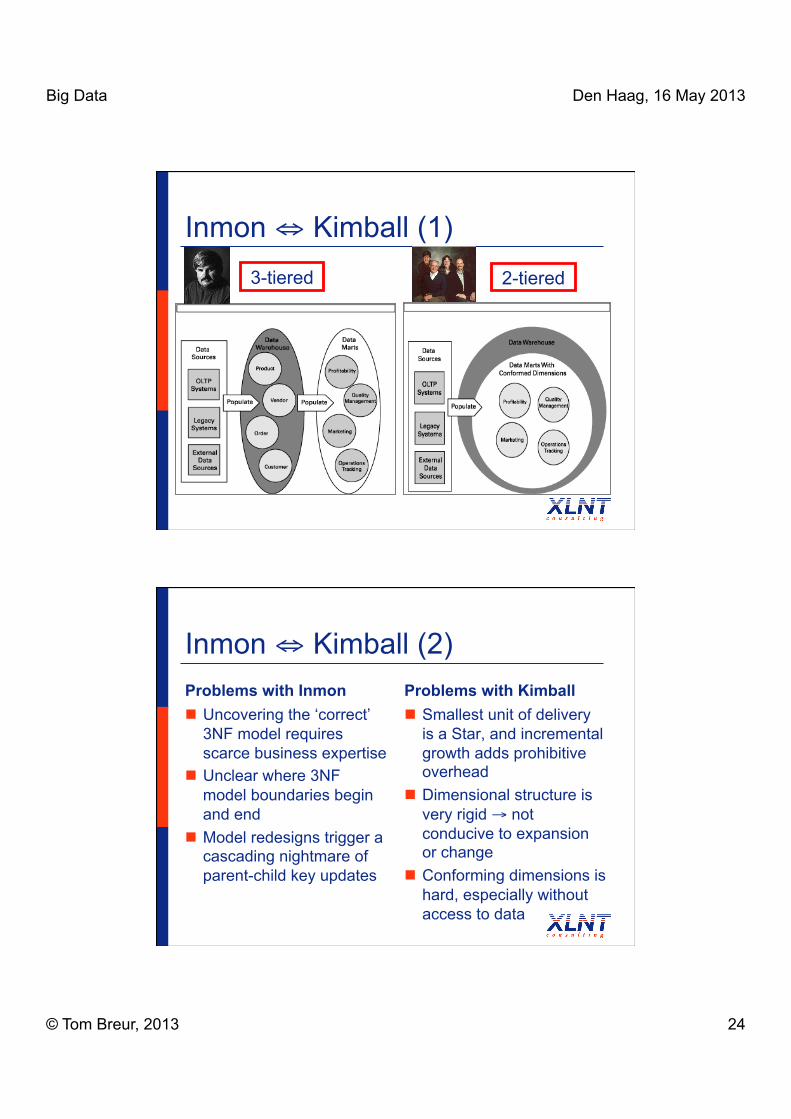
Inmon ⇔ Kimball (1) 3-tiered 2-tiered
Inmon ⇔ Kimball (2) Problems with Inmon Uncovering the ‘correct’
3NF model requires scarce business expertise
Unclear where 3NF model boundaries begin and end
Model redesigns trigger a cascading nightmare of parent-child key updates
Problems with Kimball Smallest unit of delivery
is a Star, and incremental growth adds prohibitive overhead
Dimensional structure is very rigid → not conducive to expansion or change
Conforming dimensions is hard, especially without access to data
Big Data Den Haag, 16 May 2013
© Tom Breur, 2013 25
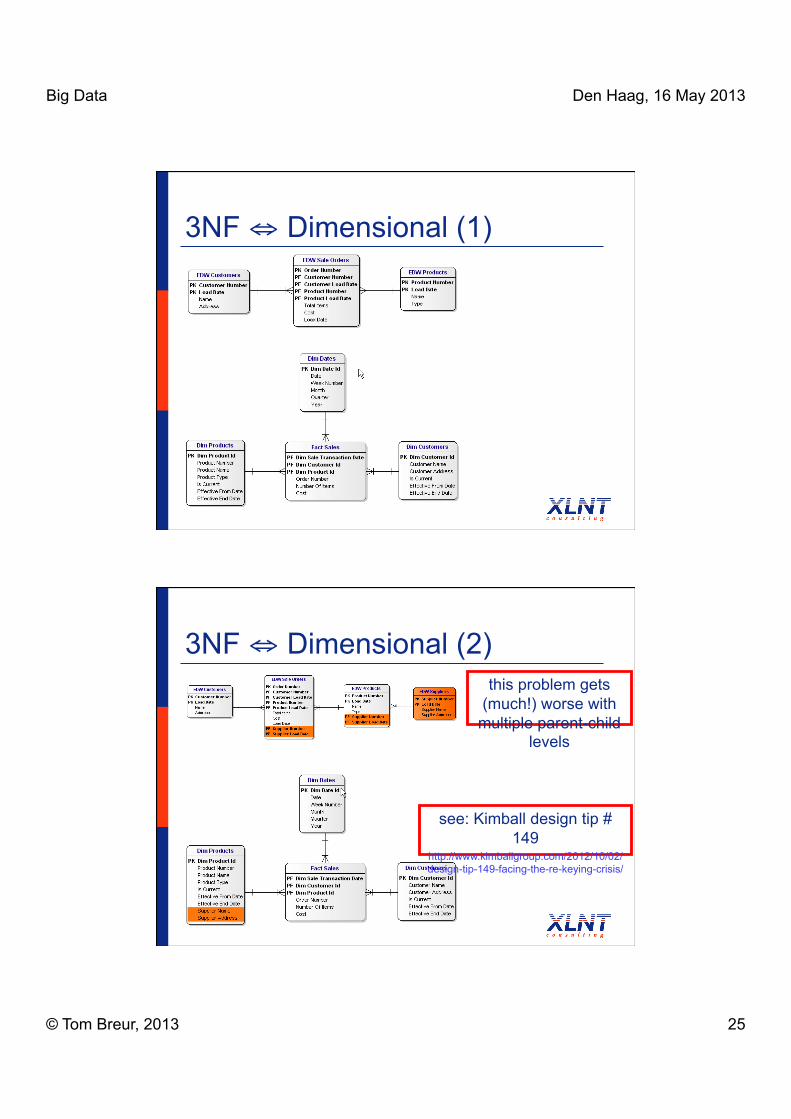
3NF ⇔ Dimensional (1)
3NF ⇔ Dimensional (2)
see: Kimball design tip # 149
http://www.kimballgroup.com/2012/10/02/design-tip-149-facing-the-re-keying-crisis/
this problem gets (much!) worse with
multiple parent-child levels
Big Data Den Haag, 16 May 2013
© Tom Breur, 2013 26
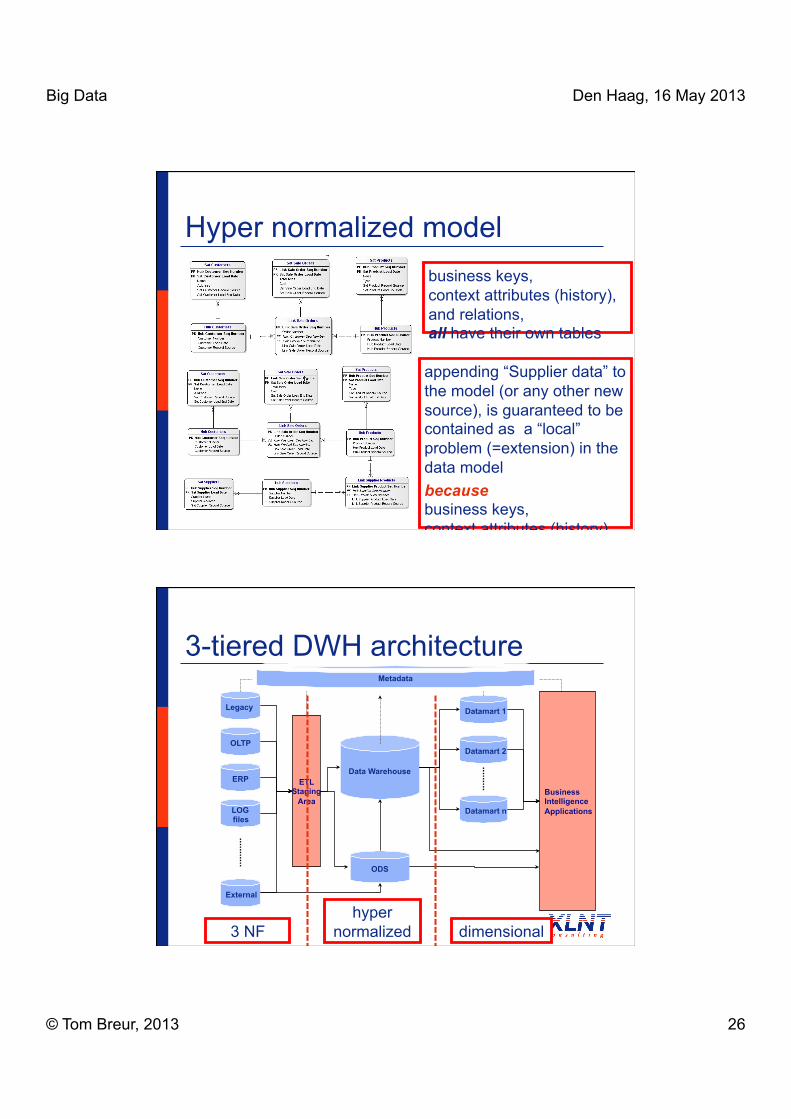
Hyper normalized model business keys, context attributes (history), and relations, all have their own tables
appending “Supplier data” to the model (or any other new source), is guaranteed to be contained as a “local” problem (=extension) in the data model because business keys, context attributes (history),
3-tiered DWH architecture
Legacy
OLTP
ERP
LOG files
External
ETL Staging
Area
Data Warehouse
ODS
Datamart 1
Datamart 2
Datamart n
Business Intelligence Applications
Metadata
3 NF hyper
normalized dimensional

Big Data Den Haag, 16 May 2013
© Tom Breur, 2013 27
Horses for courses 3NF
quickly & accurately capture transaction data easy to get data in
Hyper normalized integrate historical data capture all data, all the time
Dimensional present & analyze data easy to get data out
Legacy
OLTP
ERP
LOG files
External
ETL Staging
Area
Data Warehouse
ODS
Datamart 1
Datamart 2
Datamart n
Business Intelligence Applications
Metadata Back room Data Warehouse Architecture
Front room Business Intelligence Architecture
Backroom ⇔ Frontroom
Big Data Den Haag, 16 May 2013
© Tom Breur, 2013 28
Divide & Conquer “Break down” semantic gap from back- to
front room Offer a range of data services:
Source data “as is” Source data that have undergone cleansing Dimensional models Full-fledge BI applications
Allow business to set priorities!
Why data virtualization? Operational BI calls for real-time data Integrate heterogeneous sources, at least
“in the eye of the beholder” Data virtualization layer hides complexity
about underlying applications & enables sharing of meta data
Data virtualization enables federation, so you can delay (definitive) modeling, yet make data available early
Big Data Den Haag, 16 May 2013
© Tom Breur, 2013 29
Conclusion Big Data are here to stay
(and lets hope the hype passes soon) Data provide a source of sustainable
competitive advantage Speed and volume prohibit (wholesale)
copying: virtualization is the way forward Agile BI enables business alignment, and
gives us a “sporting chance” to keep up
Big Data: Segmenting user types
Tom Breur Big Data
Den Haag, 16 May 2013

Big Data Den Haag, 16 May 2013
© Tom Breur, 2013 30
Bill Inmon: end-user types (1)
What happened? Reactive
Why did it happen? Insight
What is going to happen? Predictive
Events
Interactive
Fixed timing
Farmers
Miners
Explorers
Operators
Tourists
Inmon (TB): end-user types (2)
“past” “future”
“Outside”
“inside”
Farmers
Miners
Explorers
Operators
Tourists
Big Data Den Haag, 16 May 2013
© Tom Breur, 2013 31
Farmers – Clear Sighted (1) Monitor the effect of decisions on the
business by tracking key performance metrics and analysing business reports
Provide Explorers/Miners with feedback on the effectiveness of their predictions
Farmers – Clear Sighted (2) Demonstrate a fairly predictable pattern of
usage They know what data they want, how they
want it displayed, when they want it and in what media
See the world in terms of dimensions (time, product, geography) and metrics (usage, counts, revenue, costs)
Big Data Den Haag, 16 May 2013
© Tom Breur, 2013 32
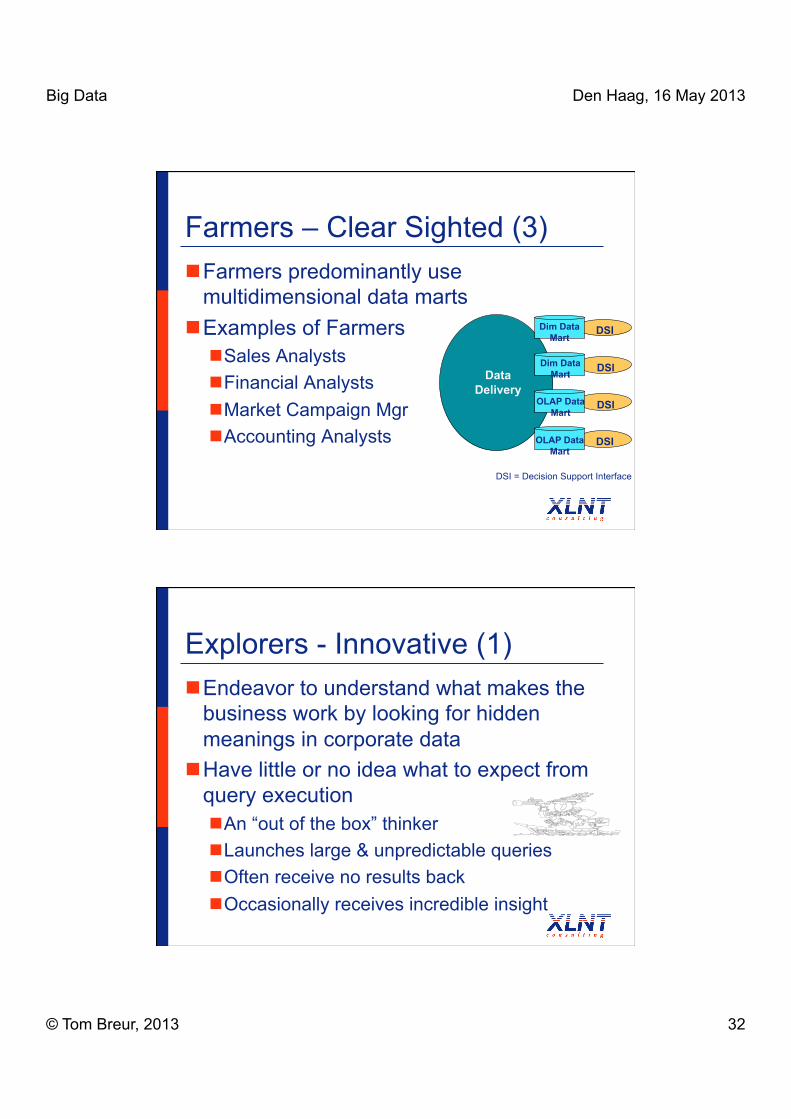
Farmers – Clear Sighted (3) Farmers predominantly use
multidimensional data marts Examples of Farmers
Sales Analysts Financial Analysts Market Campaign Mgr Accounting Analysts
Data Delivery
DSI
DSI
DSI
DSI
Dim Data Mart
Dim Data Mart
OLAP Data Mart
OLAP Data Mart
DSI = Decision Support Interface
Explorers - Innovative (1) Endeavor to understand what makes the
business work by looking for hidden meanings in corporate data
Have little or no idea what to expect from query execution An “out of the box” thinker Launches large & unpredictable queries Often receive no results back Occasionally receives incredible insight
Big Data Den Haag, 16 May 2013
© Tom Breur, 2013 33
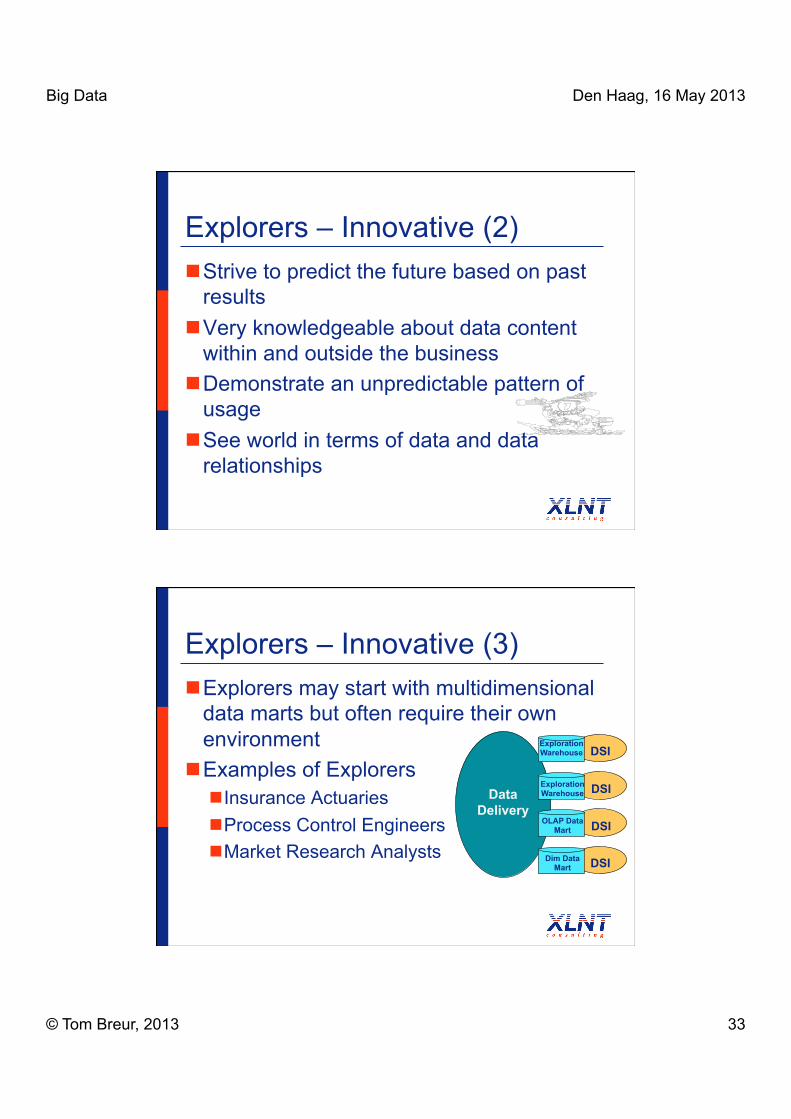
Explorers – Innovative (2) Strive to predict the future based on past
results Very knowledgeable about data content
within and outside the business Demonstrate an unpredictable pattern of
usage See world in terms of data and data
relationships
Explorers – Innovative (3) Explorers may start with multidimensional
data marts but often require their own environment
Examples of Explorers Insurance Actuaries Process Control Engineers Market Research Analysts
Data Delivery
DSI
DSI
DSI
DSI
Exploration Warehouse
Exploration Warehouse
OLAP Data Mart
Dim Data Mart
Big Data Den Haag, 16 May 2013
© Tom Breur, 2013 34
Miners - Thorough (1) Scan large amounts of detailed data
looking for confirmation of a hypothesis or for suspected patterns
Have a good idea what to expect prior to query execution
Operate on a base of data that is preconditioned for analysis
Miners – Thorough (2) Demonstrate a reasonably predictable
pattern of usage Interested in finding meaningful
relationships in transactions
Big Data Den Haag, 16 May 2013
© Tom Breur, 2013 35
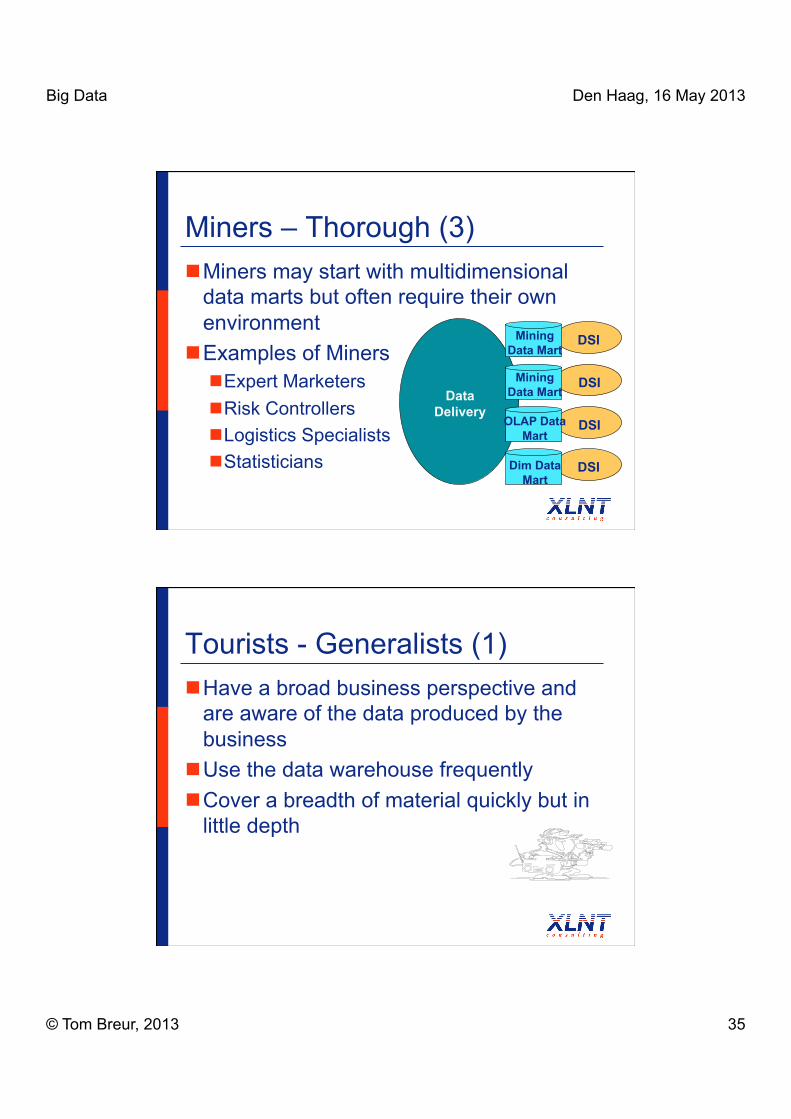
Miners – Thorough (3) Miners may start with multidimensional
data marts but often require their own environment
Examples of Miners Expert Marketers Risk Controllers Logistics Specialists Statisticians
Data Delivery
DSI
DSI
DSI
DSI
Mining Data Mart
Mining Data Mart
OLAP Data Mart
Dim Data Mart
Tourists - Generalists (1) Have a broad business perspective and
are aware of the data produced by the business
Use the data warehouse frequently Cover a breadth of material quickly but in
little depth
Big Data Den Haag, 16 May 2013
© Tom Breur, 2013 36
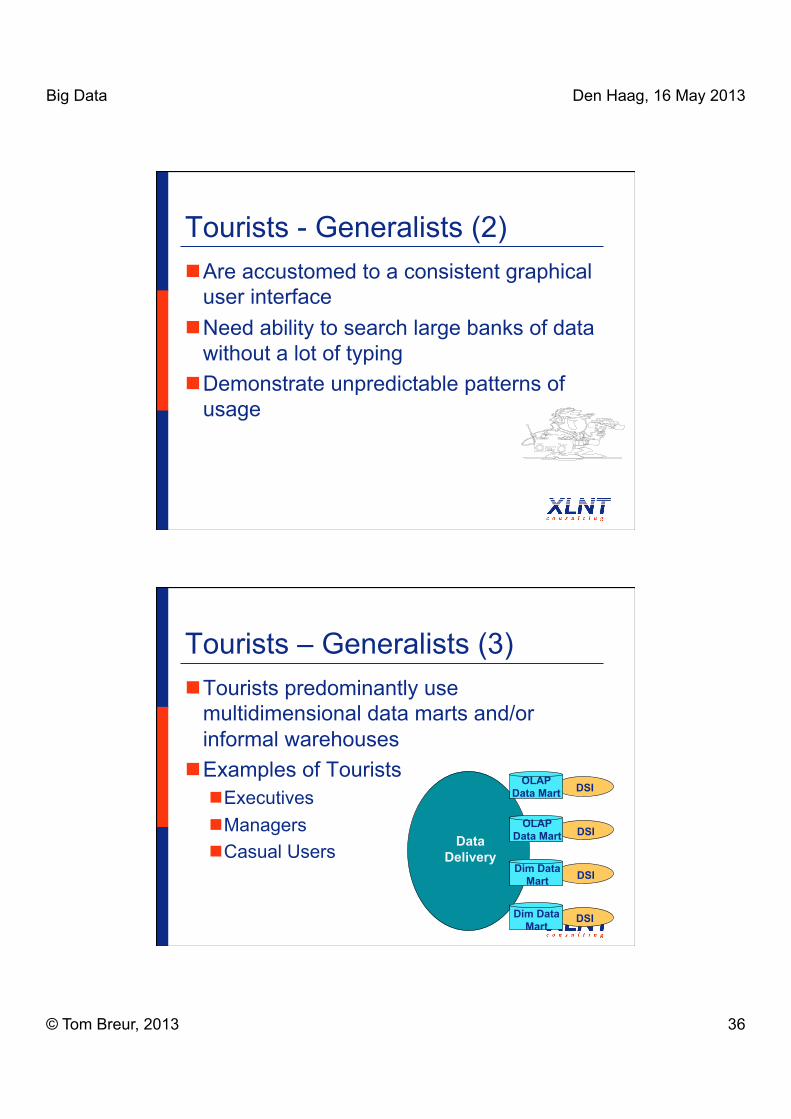
Tourists - Generalists (2) Are accustomed to a consistent graphical
user interface Need ability to search large banks of data
without a lot of typing Demonstrate unpredictable patterns of
usage
Tourists – Generalists (3) Tourists predominantly use
multidimensional data marts and/or informal warehouses
Examples of Tourists Executives Managers Casual Users Data
Delivery
DSI
DSI
DSI
DSI
OLAP Data Mart
OLAP Data Mart
Dim Data Mart
Dim Data Mart
Big Data Den Haag, 16 May 2013
© Tom Breur, 2013 37
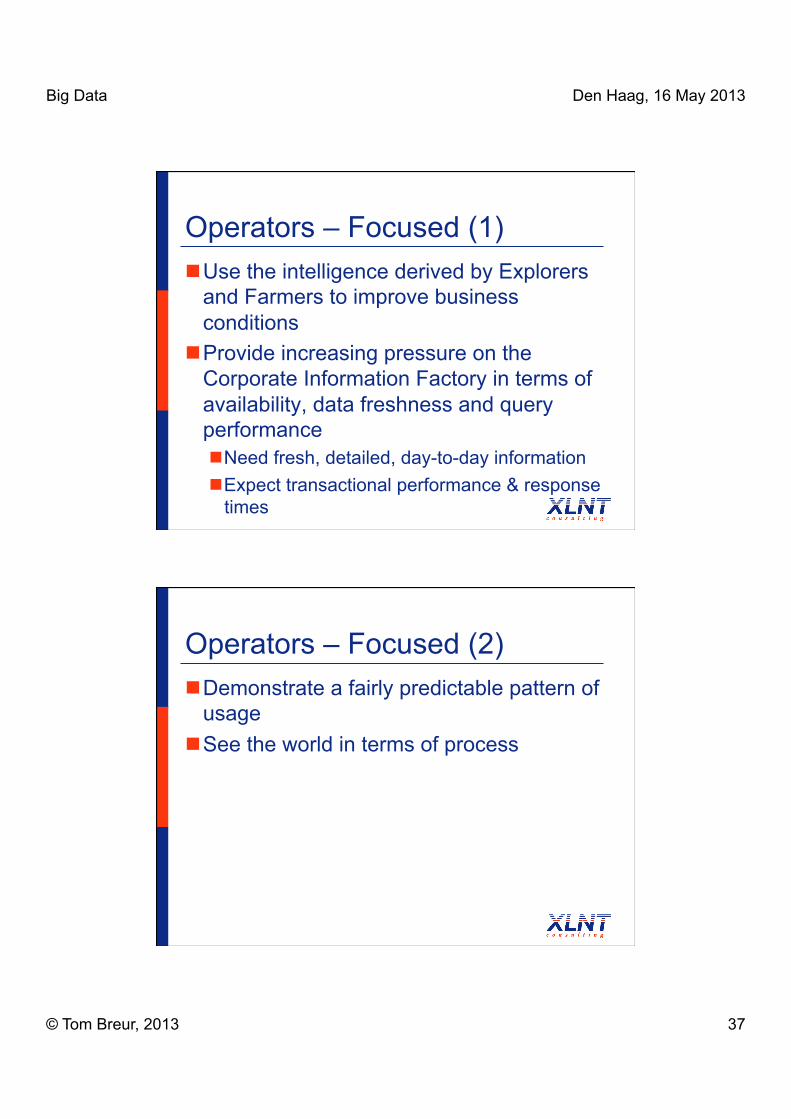
Operators – Focused (1) Use the intelligence derived by Explorers
and Farmers to improve business conditions
Provide increasing pressure on the Corporate Information Factory in terms of availability, data freshness and query performance Need fresh, detailed, day-to-day information Expect transactional performance & response
times
Operators – Focused (2) Demonstrate a fairly predictable pattern of
usage See the world in terms of process

Big Data Den Haag, 16 May 2013
© Tom Breur, 2013 38
Operators – Focused (3) Operators predominantly use the operational
data store and sometimes multidimensional data marts
Examples of Operators Customer Support Representatives Manufacturing Line Managers Inventory Control Managers
Data Delivery
DSI
TrI
TrI
DSI
Oper Mart
Oper Mart
OLAP Data Mart
OLAP Data Mart
Operational Data Store
TrI
TrI = Transaction Interface
Exercise (10’ + 10’) Form new (as in different) pairs/groups of
two people (non-colleagues) Take 5 minutes to inventory your current
(main) user groups – create poster Take another 5 minutes to:
Consider how you could improve existing data/offering/service, and what “new” user types might your BI initiative support? How will this change would further the corporate
cause – business case(s)?
Big Data Den Haag, 16 May 2013
© Tom Breur, 2013 39
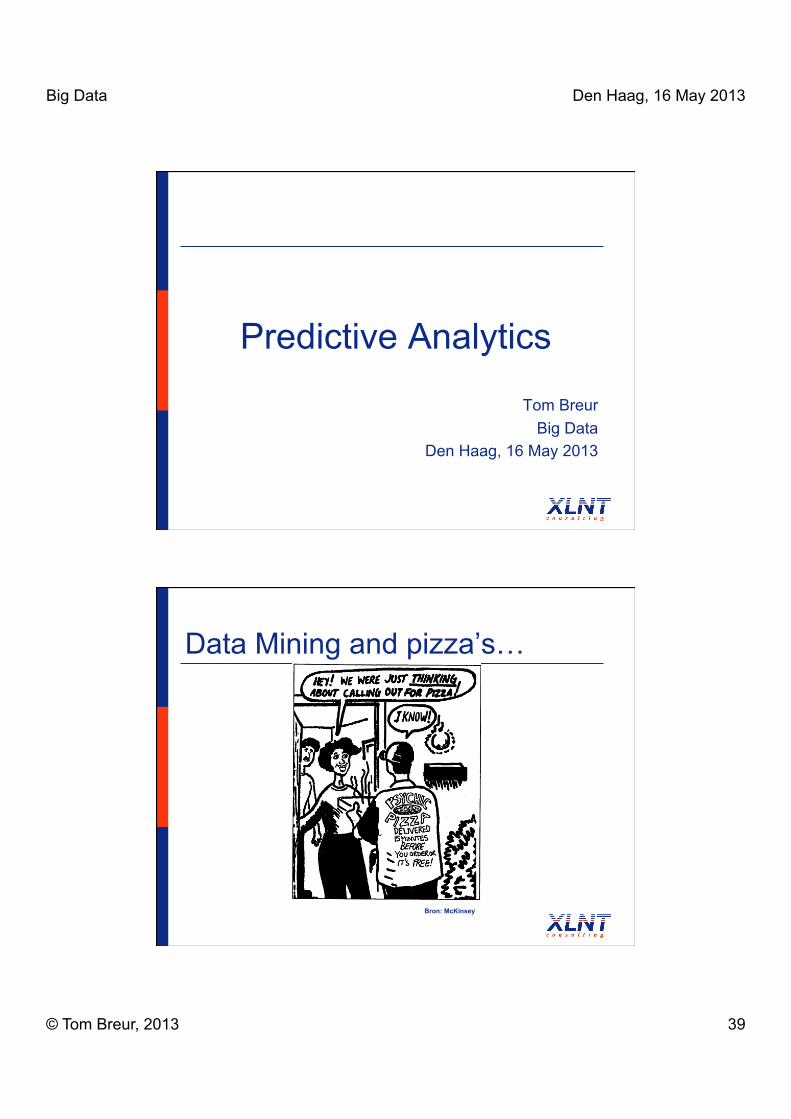
Predictive Analytics
Tom Breur Big Data
Den Haag, 16 May 2013
Data Mining and pizza’s…
Bron: McKinsey
Big Data Den Haag, 16 May 2013
© Tom Breur, 2013 40
Slide 79
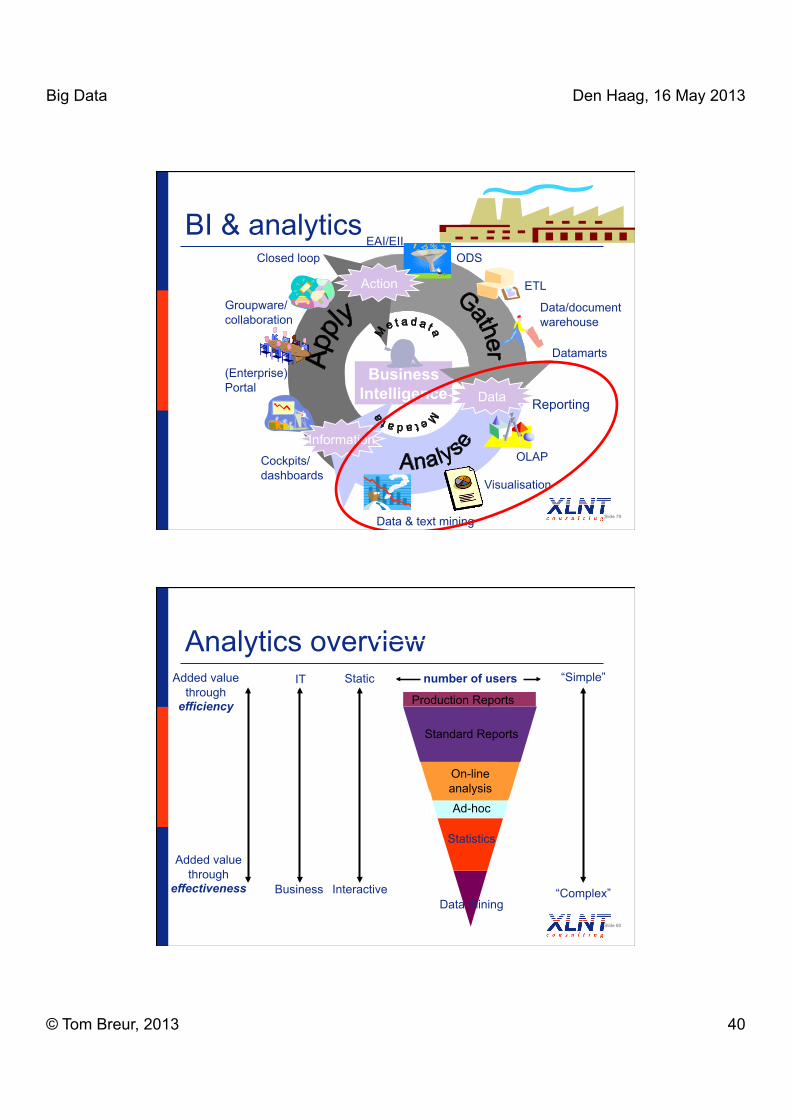
Business Intelligence
Reporting
OLAP
Visualisation
Data & text mining
Cockpits/ dashboards
(Enterprise) Portal
Groupware/ collaboration
Closed loop EAI/EII
ETL
Data/document warehouse
Datamarts
ODS
Information
Data
Action
BI & analytics
Analytics overview
Slide 80
Interactive
Static number of users “Simple”
“Complex” Business
IT
Statistics
On-line analysis Ad-hoc
Production Reports
Data mining
Standard Reports
Added value through
effectiveness
Added value through
efficiency
Big Data Den Haag, 16 May 2013
© Tom Breur, 2013 41
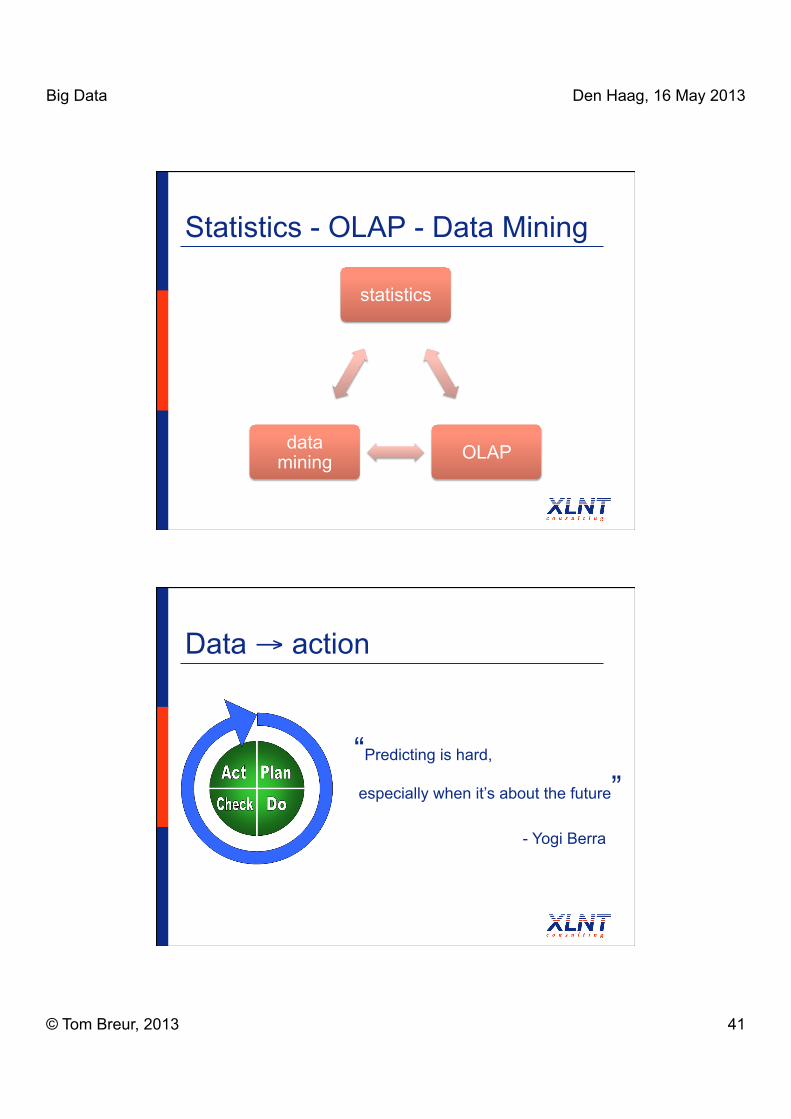
Statistics - OLAP - Data Mining
statistics
OLAP data mining
Data → action
“Predicting is hard,
especially when it’s about the future” - Yogi Berra
Big Data Den Haag, 16 May 2013
© Tom Breur, 2013 42
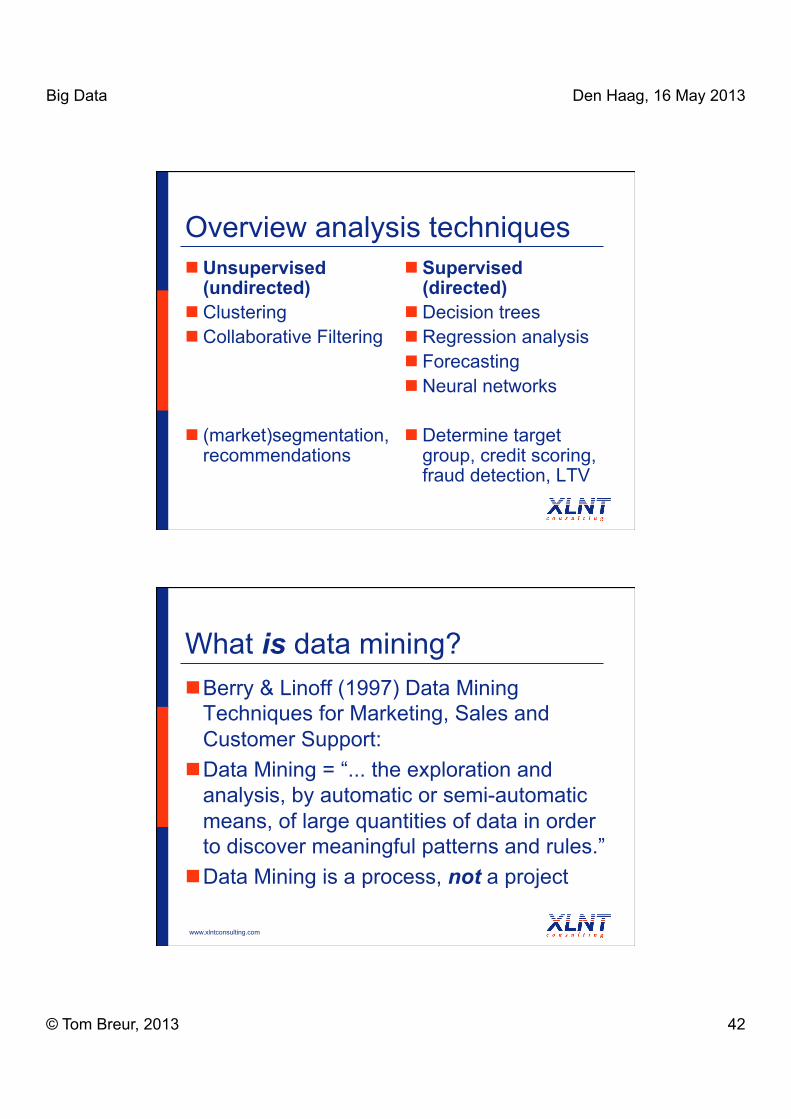
Overview analysis techniques Unsupervised
(undirected) Clustering Collaborative Filtering
(market)segmentation, recommendations
Supervised (directed)
Decision trees Regression analysis Forecasting Neural networks
Determine target group, credit scoring, fraud detection, LTV
What is data mining? Berry & Linoff (1997) Data Mining
Techniques for Marketing, Sales and Customer Support:
Data Mining = “... the exploration and analysis, by automatic or semi-automatic means, of large quantities of data in order to discover meaningful patterns and rules.”
Data Mining is a process, not a project
www.xlntconsulting.com
Big Data Den Haag, 16 May 2013
© Tom Breur, 2013 43
Data Mining ↔ Statistics Data Mining ↔ Statistics
Data mining uses automated procedures, statistics relies on manual procedures
Data mining searches for patterns, statistics tests an assumed relationship
www.xlntconsulting.com
Data Mining ↔ OLAP Data Mining ↔ OLAP
Data Mining uses automated procedures, OLAP relies on an interactive (!) interface
Data mining “generates” hypotheses, OLAP “tests” hypotheses
Data mining is akin to ‘listening’ to data, OLAP is like ‘talking’ to data
www.xlntconsulting.com
Big Data Den Haag, 16 May 2013
© Tom Breur, 2013 44
Two “Flavors” of Data Mining Supervised ↔ Unsupervised Data Mining
(also called: Directed ↔ Undirected Data Mining)
Terms can be used interchangeably Supervised learning uses an array of
“predictor” or “input” or “endogenous” variables to ‘predict’ a “target” or “output” or “exogenous” variable
www.xlntconsulting.com
Predicting the future… (1) What data miners refer to as “predicting”,
is classifying an unknown field, or estimating an unknown value (whose value will become apparent in the future)
www.xlntconsulting.com

Big Data Den Haag, 16 May 2013
© Tom Breur, 2013 45
Predicting the future… (2) Examples of class prediction:
Is this transaction fraudulent? Will this lender default? Is this part defect?
Examples of estimating an unknown value: What is the Life Time Value (LTV) of this
customer? What will next month’s demand be?
www.xlntconsulting.com
Prediction ↔ insight (1) Some models may be deployed for
prediction, others may never be deployed and “merely” serve to generate insight in market dynamics
www.xlntconsulting.com
Big Data Den Haag, 16 May 2013
© Tom Breur, 2013 46
Prediction ↔ insight (2) Even if a model is explicitly only used for
prediction and not for insight, it is good practice to accompany every prediction with an explanation geared toward insight for (at least) 3 reasons: Provide a sanity check Gain credibility, to foster buy-in To (potentially) elicit innovation
www.xlntconsulting.com
Data Requirements (1) Every data mining algorithm (supervised
and unsupervised) can only work with “flat files”
Exactly one row per entity you are modeling: households, customers, accounts, shipments, transactions, etc.
www.xlntconsulting.com
Big Data Den Haag, 16 May 2013
© Tom Breur, 2013 47
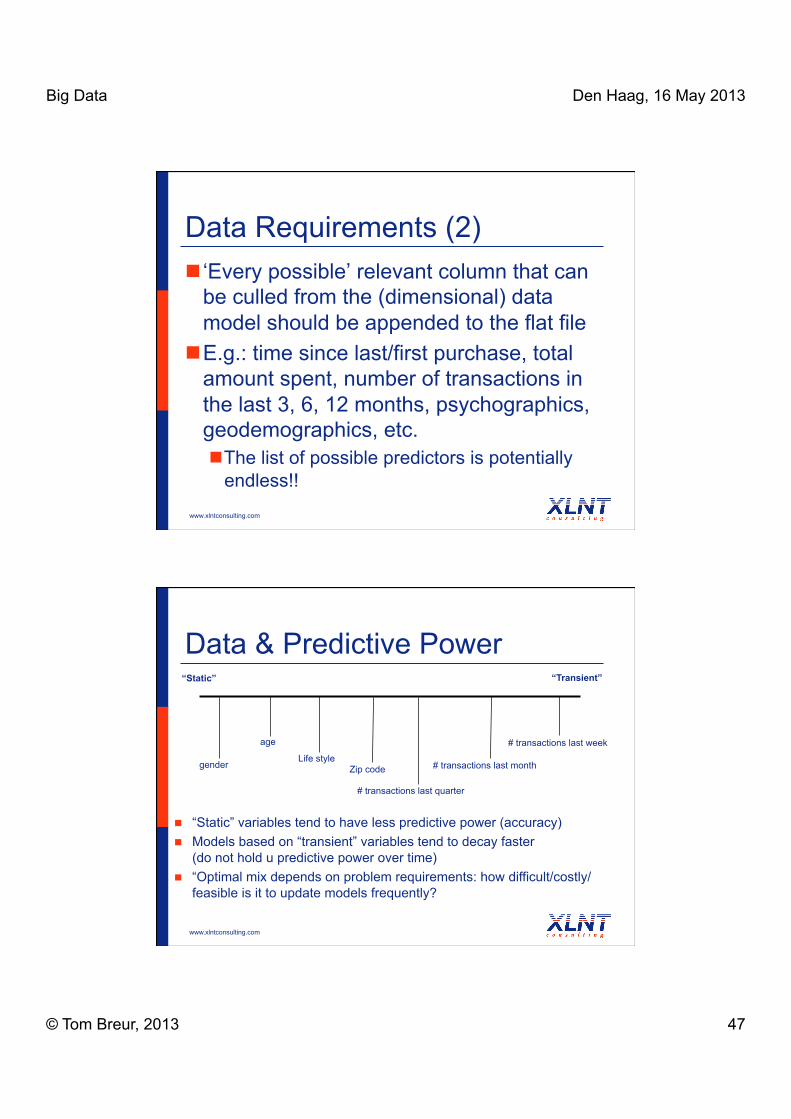
Data Requirements (2) ‘Every possible’ relevant column that can
be culled from the (dimensional) data model should be appended to the flat file
E.g.: time since last/first purchase, total amount spent, number of transactions in the last 3, 6, 12 months, psychographics, geodemographics, etc. The list of possible predictors is potentially
endless!!
www.xlntconsulting.com
Data & Predictive Power “Static” “Transient”
age
gender Zip code Life style
# transactions last quarter
# transactions last month
# transactions last week
“Static” variables tend to have less predictive power (accuracy) Models based on “transient” variables tend to decay faster
(do not hold u predictive power over time) “Optimal mix depends on problem requirements: how difficult/costly/
feasible is it to update models frequently?
www.xlntconsulting.com
Big Data Den Haag, 16 May 2013
© Tom Breur, 2013 48
Big Data: data mining algorithms overview
Tom Breur Big Data
Den Haag, 16 May 2013
Algorithms agenda Decision trees (Regression) Neural networks

Big Data Den Haag, 16 May 2013
© Tom Breur, 2013 49
Decision tree agenda Principles and principal features Algorithms deconstructed: CHAID, Gini,
C5.0, CART Data exploration and model building Use in response modeling Understanding and interpreting the output Alternative approaches for response
modeling, decision trees ⇔ regression
Features of decision trees Symbolic analysis ⇒ recursive partitioning ⇒ decision trees (inductive learning)
Split record set arriving at each node, using ‘best’ variable ⇒ “rinse & repeat”
Stop when: All records in leaf belong to same class No variable can be found for splitting

Big Data Den Haag, 16 May 2013
© Tom Breur, 2013 50
Example decision tree (1)
credit? buroscore
Yes
Yes
Yes
Yes
Yes
No
No
No
No
No
No
No
occupation debt
Blue collar
Blue collar
Blue collar
Low
Blue collar
Blue collar
Blue collar
White collar
White collar
White collar
White collar
White collar
White collar
Low
Low
Low
Medium
High
High
High
High
High
High
High
Medium
Medium
High
High
High
High
High
High
Low
Low
Low
Low
occupation?
White collar
accept 41,7% reject 58,3%
accept 83,3% reject 16,7%
accept 0,0% reject 100,0%
Blue collar
Low, Medium High
accept 100,0% reject 0,0%
accept 0,0% reject 100,0%
debt?
www.xlntconsulting.com
Example decision tree (2)
Big Data Den Haag, 16 May 2013
© Tom Breur, 2013 51
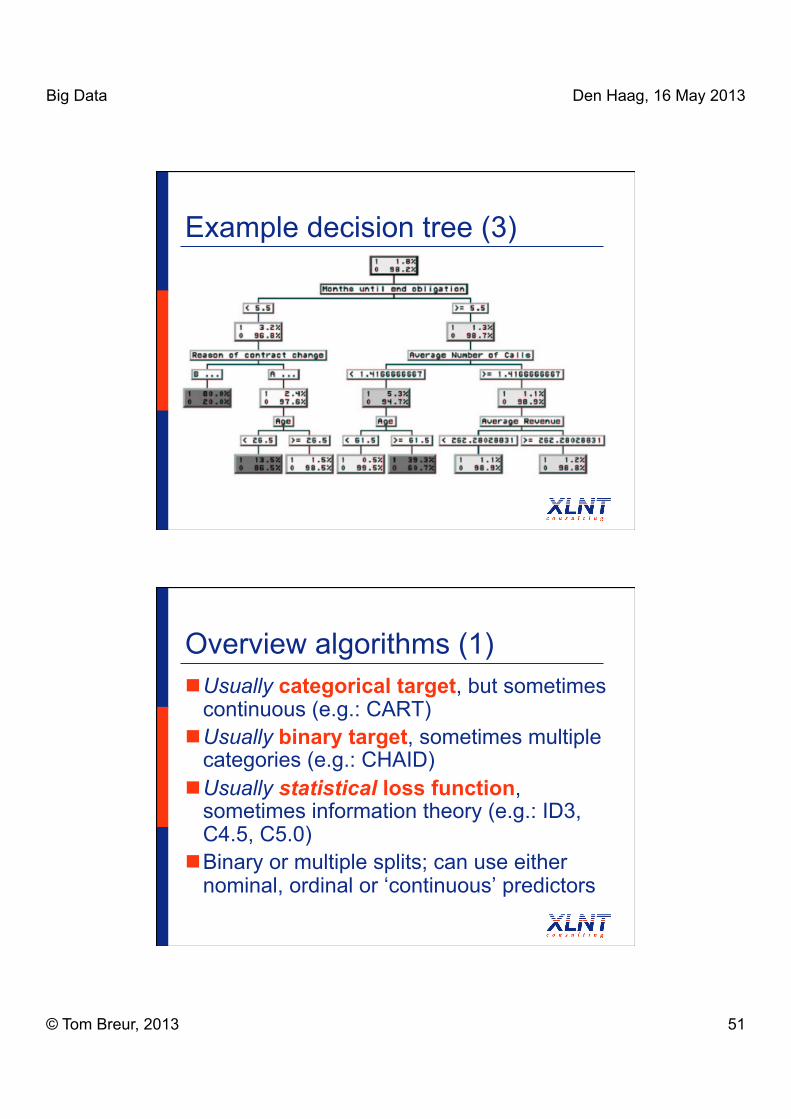
Example decision tree (3)
Overview algorithms (1) Usually categorical target, but sometimes
continuous (e.g.: CART) Usually binary target, sometimes multiple
categories (e.g.: CHAID) Usually statistical loss function,
sometimes information theory (e.g.: ID3, C4.5, C5.0)
Binary or multiple splits; can use either nominal, ordinal or ‘continuous’ predictors
Big Data Den Haag, 16 May 2013
© Tom Breur, 2013 52
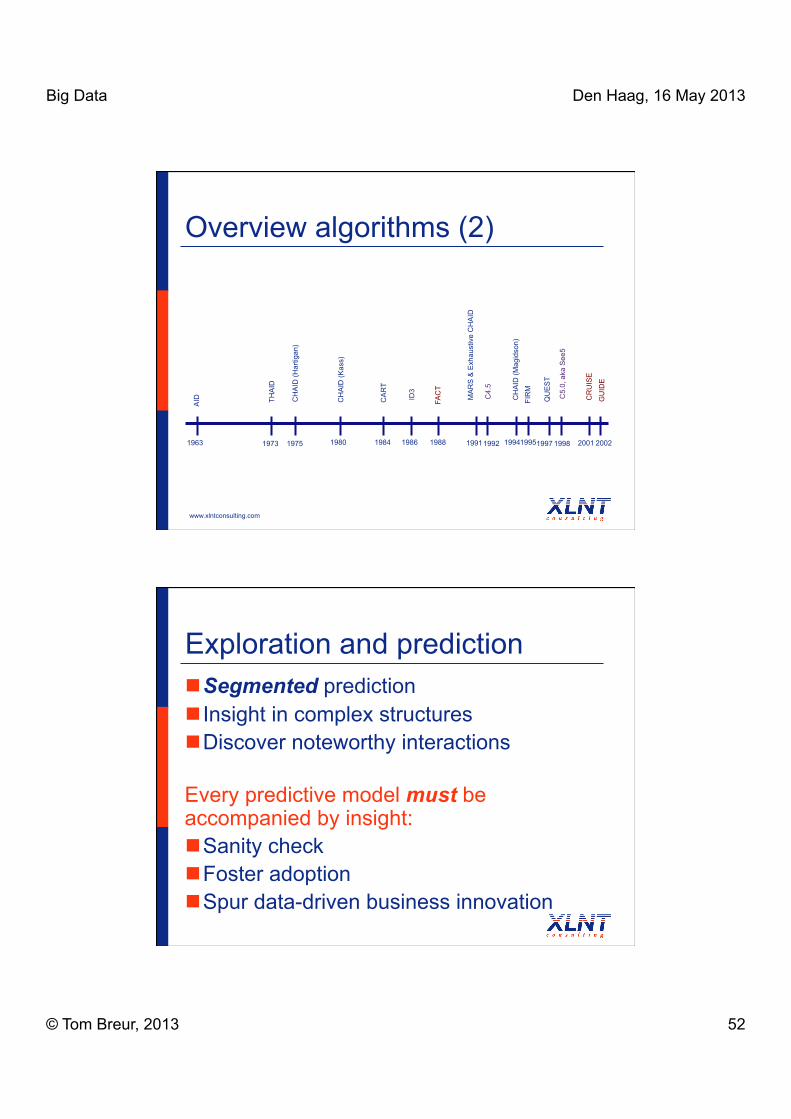
Overview algorithms (2)
1963 1998 1997 1992 1973 1975 1980 1984 1986 1991 1988 1994
C5.
0, a
ka S
ee5
AID
THA
ID
CH
AID
(Har
tigan
)
QU
ES
T
CH
AID
(Mag
idso
n)
CA
RT
CH
AID
(Kas
s)
2002 2001
CR
UIS
E
GU
IDE
ID3
C4.
5
MA
RS
& E
xhau
stiv
e C
HA
ID
FIR
M
1995 FA
CT
www.xlntconsulting.com
Exploration and prediction Segmented prediction Insight in complex structures Discover noteworthy interactions
Sanity check Foster adoption Spur data-driven business innovation
Every predictive model must be accompanied by insight:
Big Data Den Haag, 16 May 2013
© Tom Breur, 2013 53
Automatic ⇔ manual Manual (interactive): apply domain
expertise (aka “model engineering”): Variable selection Business problem Implementation specification
Short ⇔ long term lift characteristics: “Transient”/behavioural ⇔ stable variables
Manual tree building drives variable development
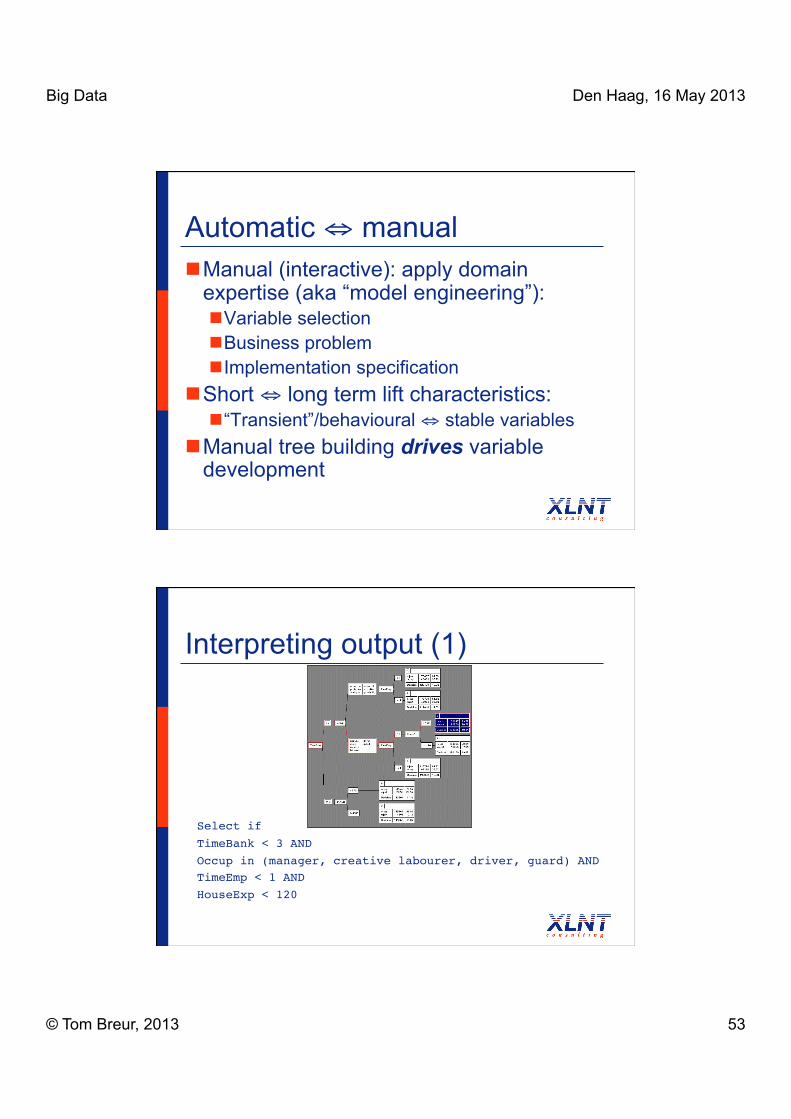
Interpreting output (1)
Select if !TimeBank < 3 AND!Occup in (manager, creative labourer, driver, guard) AND!TimeEmp < 1 AND!HouseExp < 120!
Big Data Den Haag, 16 May 2013
© Tom Breur, 2013 54
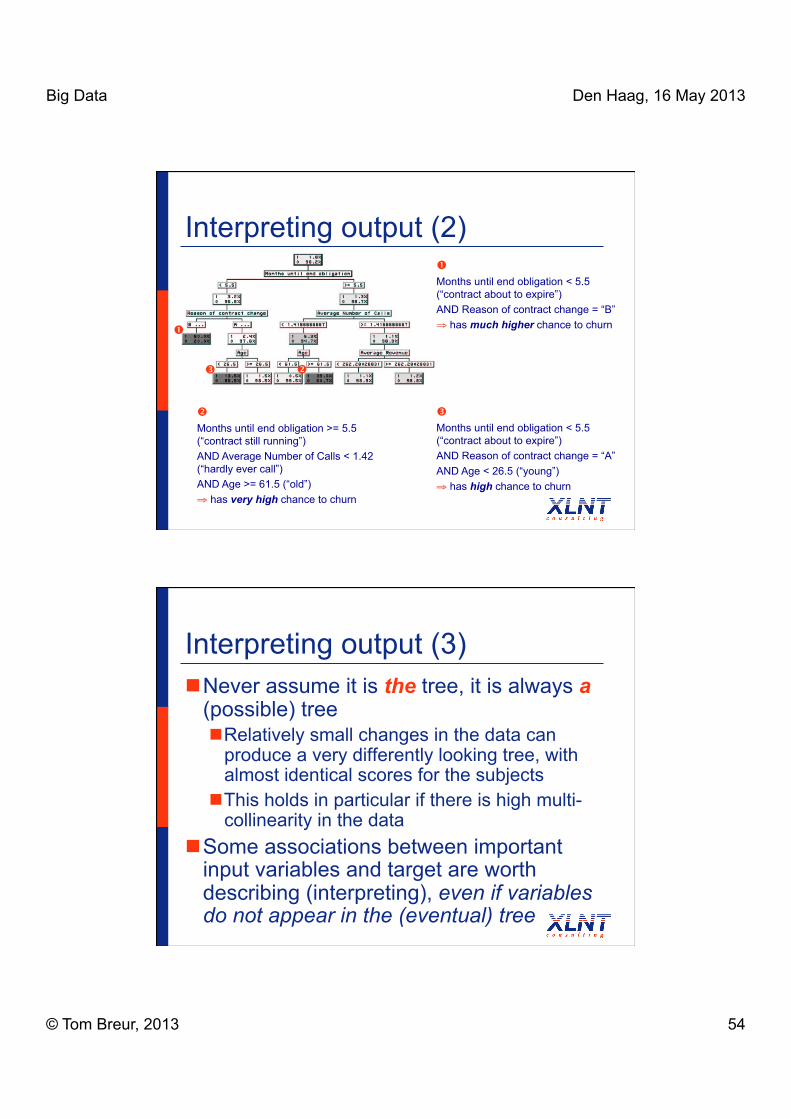
Interpreting output (2)
Months until end obligation >= 5.5 (“contract still running”) AND Average Number of Calls < 1.42 (“hardly ever call”) AND Age >= 61.5 (“old”) ⇒ has very high chance to churn
Months until end obligation < 5.5 (“contract about to expire”) AND Reason of contract change = “B” ⇒ has much higher chance to churn
Months until end obligation < 5.5 (“contract about to expire”) AND Reason of contract change = “A” AND Age < 26.5 (“young”) ⇒ has high chance to churn
Interpreting output (3) Never assume it is the tree, it is always a
(possible) tree Relatively small changes in the data can
produce a very differently looking tree, with almost identical scores for the subjects
This holds in particular if there is high multi-collinearity in the data
Some associations between important input variables and target are worth describing (interpreting), even if variables do not appear in the (eventual) tree
Big Data Den Haag, 16 May 2013
© Tom Breur, 2013 55
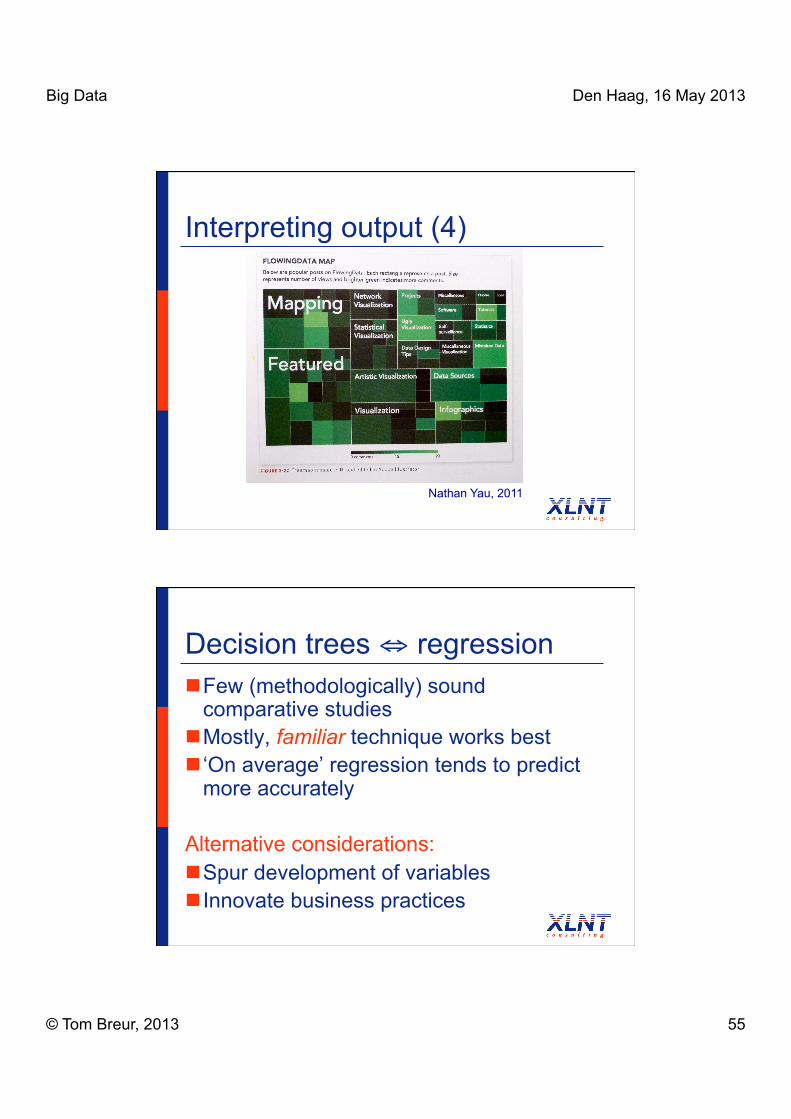
Interpreting output (4)
Nathan Yau, 2011
Decision trees ⇔ regression Few (methodologically) sound
comparative studies Mostly, familiar technique works best ‘On average’ regression tends to predict
more accurately
Alternative considerations: Spur development of variables Innovate business practices
Big Data Den Haag, 16 May 2013
© Tom Breur, 2013 56
Conclusion decision trees Decision trees are:
Flexible Versatile Gentle learning curve
Superior insight drives: Development of (better) predictive variables Innovation of business
Manual (interactive) tree building enhances ‘data learning’ and insight
Resources - history decision trees AID – Morgan & Sonquist (1963) THAID – Messenger & Mandell (1972), Morgan & Messenger (1973),
Morgan & Sonquist (1973) CHAID – Hartigan (1975) CHAID – Kass (1980) CART – Breiman, Friedman, Olshen & Stone (1984) ID3 – Quinlan (1986) FACT – Loh & Vanichestakul (1988) Exhaustive CHAID – Biggs, de Ville & Suen (1991) MARS – Friedman (1991) C4.5 – Quinlan (1992) CHAID – Magidson (1993, 1994) FIRM – Hawkins (1995) QUEST – Loh & Shih (1997) C5.0 – Quinlan (1998) CRUISE – Kim & Loh (2001) GUIDE – Loh (2002)
Big Data Den Haag, 16 May 2013
© Tom Breur, 2013 57
Decision tree software www.angoss.com www.dtreg.com www.lumenaut.com www.micrsoft.com www.portraitsoftware.com www.rulequest.com www.salford-systems.com www.sas.com www.spss.com www.vanguardsw.com www.xlstat.com www.xpertrule.com
Regression Two main “flavors”: linear (usually: OLS)
regression and logistic regression Regression predicts a numeric/continuous
target variable Logistic regression predicts a boolean/
binary target variable (polynomial logistic regression for categorical target)
Essentially statistical procedures (as distinct from Machine Learning)
www.xlntconsulting.com
Big Data Den Haag, 16 May 2013
© Tom Breur, 2013 58
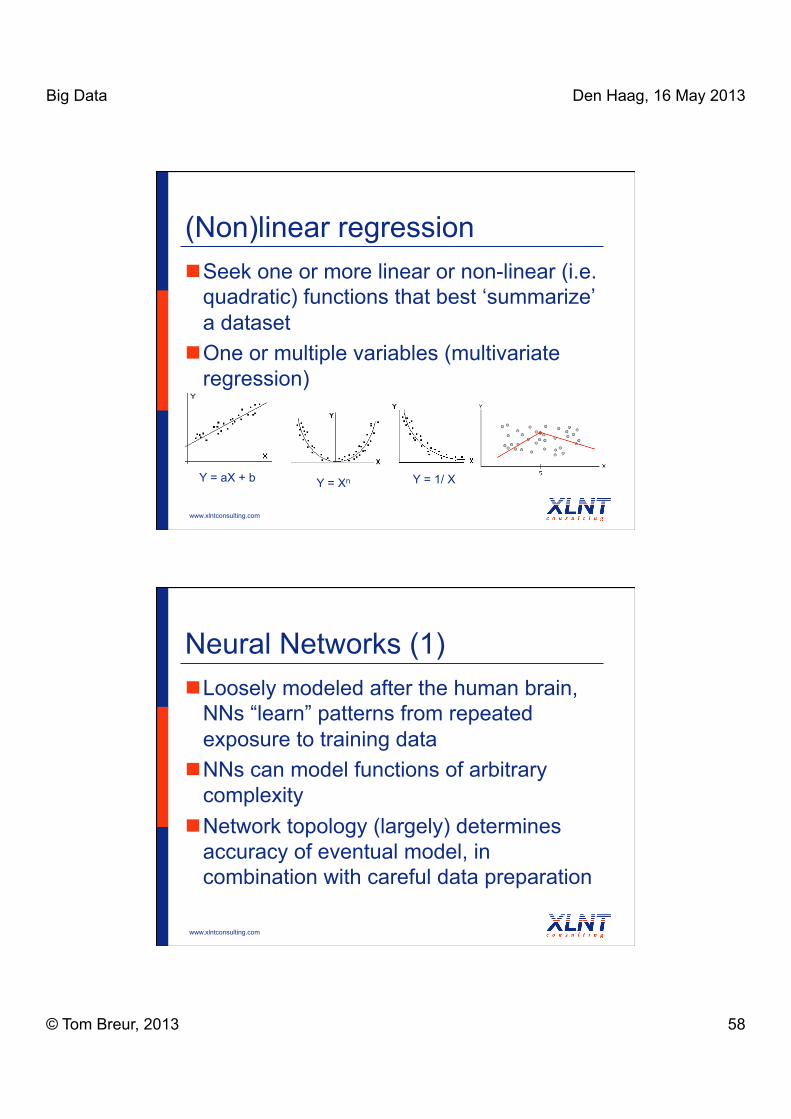
(Non)linear regression Seek one or more linear or non-linear (i.e.
quadratic) functions that best ‘summarize’ a dataset
One or multiple variables (multivariate regression)
Y = aX + b Y = Xn Y = 1/ X
www.xlntconsulting.com
Neural Networks (1) Loosely modeled after the human brain,
NNs “learn” patterns from repeated exposure to training data
NNs can model functions of arbitrary complexity
Network topology (largely) determines accuracy of eventual model, in combination with careful data preparation
www.xlntconsulting.com
Big Data Den Haag, 16 May 2013
© Tom Breur, 2013 59
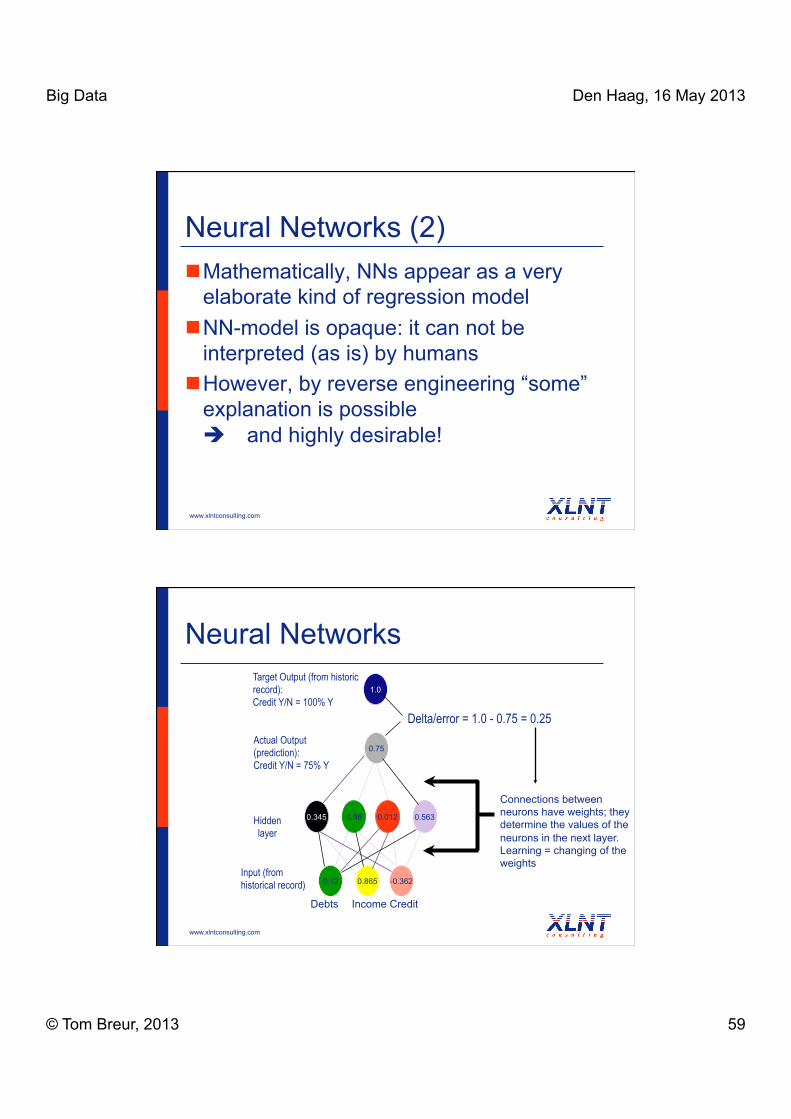
Neural Networks (2) Mathematically, NNs appear as a very
elaborate kind of regression model NN-model is opaque: it can not be
interpreted (as is) by humans However, by reverse engineering “some”
explanation is possible and highly desirable!
www.xlntconsulting.com
Neural Networks
0.12 0.865 -0.362
0.98 0.012 0.563
0.75
0.345
Input (from historical record)
Hidden layer
1.0
Delta/error = 1.0 - 0.75 = 0.25
Target Output (from historic record): Credit Y/N = 100% Y
Actual Output (prediction): Credit Y/N = 75% Y
Debts Income Credit
Connections between neurons have weights; they determine the values of the neurons in the next layer. Learning = changing of the weights
www.xlntconsulting.com
Big Data Den Haag, 16 May 2013
© Tom Breur, 2013 60
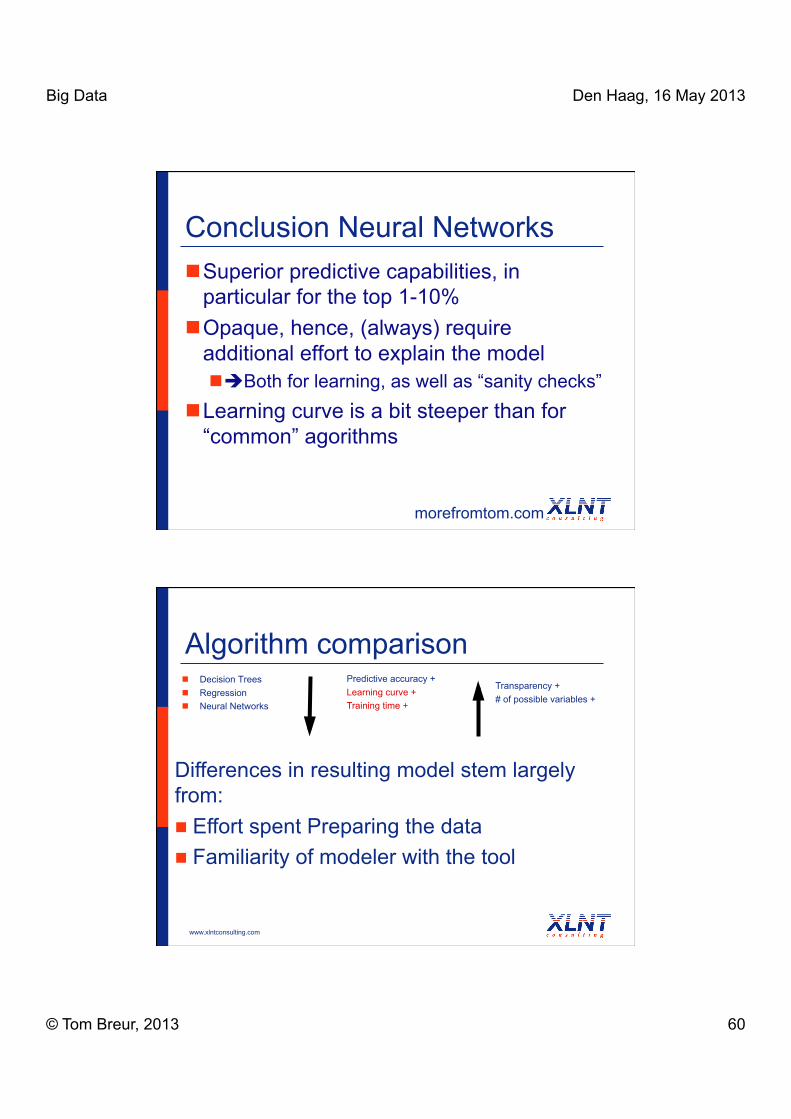
Conclusion Neural Networks Superior predictive capabilities, in
particular for the top 1-10% Opaque, hence, (always) require
additional effort to explain the model Both for learning, as well as “sanity checks”
Learning curve is a bit steeper than for “common” agorithms
morefromtom.com
Algorithm comparison Decision Trees Regression Neural Networks
Predictive accuracy + Learning curve + Training time +
Transparency + # of possible variables +
Differences in resulting model stem largely from: Effort spent Preparing the data Familiarity of modeler with the tool
www.xlntconsulting.com
Big Data Den Haag, 16 May 2013
© Tom Breur, 2013 61
Big Data: Text mining & sentiment analysis
Tom Breur Big Data
Den Haag, 16 May 2013
Why do we care about text? (1) The amount of text is the largest among
all types of data Although it will (soon) be surpassed by other
“big data” sources Structured data (like numbers) in
databases is only a small percentage of all business data Estimates run form 20-80% to 5-95%
Big Data Den Haag, 16 May 2013
© Tom Breur, 2013 62
Why do we care about text? (2) The Internet and World Wide Web are
making vast amounts of textual information easily accessible Competitive intelligence, social media
analysis, etc. all process large amounts of unstructured/semi-structured data
Organizations store more documents than ever before EIM is making these sources (much) more
easily available
Why do we care about text? (3) Decision makers think strategically
They need information outside the organization as well as inside
A wide range of tools for analyzing text and extracting information is now (becoming) available E.g.: extracting keywords, automatic
summarization, document clustering , indexing by topic, sentiment analysis, etc.
Big Data Den Haag, 16 May 2013
© Tom Breur, 2013 63
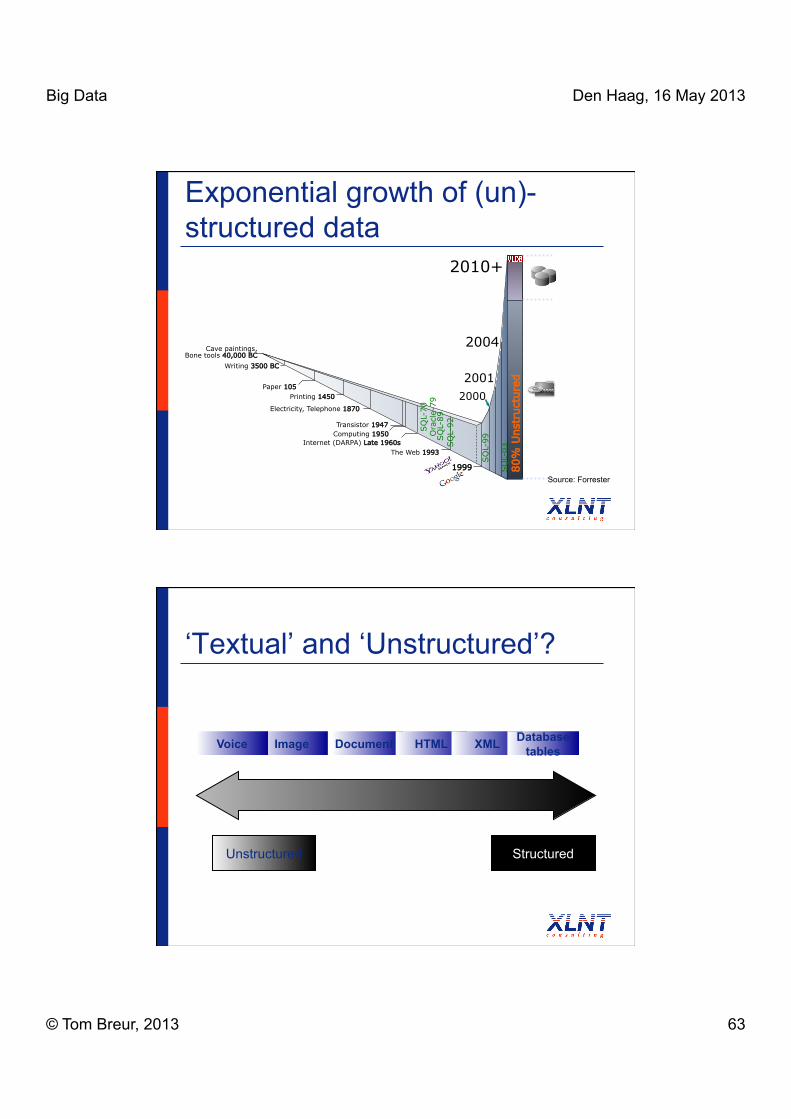
1999
GIG
ABYTE
S
2001
2004
2010+
80%
Unst
ruct
ure
d
2000
Cave paintings, Bone tools 40,000 BC
Writing 3500 BC
Paper 105 Printing 1450
Electricity, Telephone 1870
Transistor 1947 Computing 1950
Internet (DARPA) Late 1960s The Web 1993
SQ
L-70
Ora
cle-
79
SQ
L-89
SQ
L-92
SQ
L-99
SQ
L-03
Source: Forrester
Exponential growth of (un)-structured data
‘Textual’ and ‘Unstructured’?
Documents HTML
Unstructured Structured
XML Database tables Image Voice
Big Data Den Haag, 16 May 2013
© Tom Breur, 2013 64
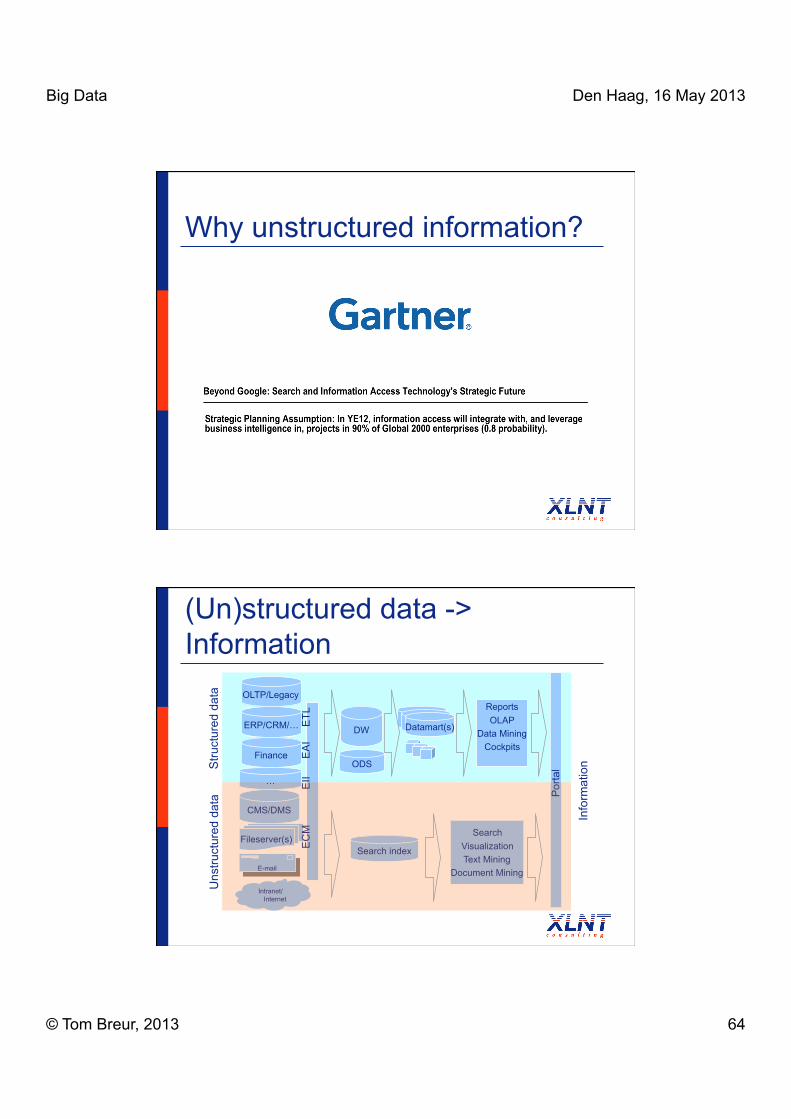
Why unstructured information?
Fileserver(s)
CMS/DMS
Intranet/ Internet
Search index
Search Visualization Text Mining
Document Mining
ERP/CRM/…
OLTP/Legacy
Finance
E
CM
EII
E
AI
E
TL
DW Datamart(s)
Stru
ctur
ed d
ata
…
Reports OLAP
Data Mining Cockpits
ODS
Por
tal
Uns
truct
ured
dat
a
Info
rmat
ion
(Un)structured data -> Information
Big Data Den Haag, 16 May 2013
© Tom Breur, 2013 65
Examples of textual BI (1) Customer profile analysis
mining incoming emails for customer’s complaint and feedback
Information dissemination organizing and summarizing trade news and
reports for personalized information service Security
email or message scan, spam blocker Network intrusion
Examples of textual BI (2) Patent analysis
analyzing patent databases for major technology players and trends
Extracting specific information from the Web (Web mining) More powerful and intelligent search engine