xii- erosion-corrosion prediction model in …...erosion-corrosion prediction model in a co2...
TRANSCRIPT

EROSION-CORROSION PREDICTION MODEL IN A CO2 ENVIRONMENT: IMPROVEMENT AND VALIDATION XII-1
November 2012
XII- EROSION-CORROSION PREDICTION MODEL IN A CO2 ENVIRONMENT:
IMPROVEMENT AND VALIDATION
Introduction
In the oil and gas production industry, erosion and corrosion have influence greatly the design and operation. The erosion process is a result from solid particles entrained in the flow stream from sand production. The effects of sand particle erosion on carbon steel and other metals have been extensively studied by many researchers. The prediction of the erosion rate at different operating conditions is made possible by considering the many different erosion factors (flow velocity, sand shape, sand concentration, impingement angle, flow geometry, etc.).
However, CO2 corrosion is the most dominant metal loss mechanism for oil and gas production facilities as CO2 gas is often a significant component in the production fluids. The corrosion behavior in a CO2 environment has been very well researched under many conditions. At some operating conditions, iron carbonate scale (FeCO3) is produced as a result of the corrosion process. Due to the nature of the FeCO3 scale, some protection could be provided by the scale to reduce the corrosion rates to lower values.
The Erosion/Corrosion Research Center (ECRC) at The University of Tulsa has studied sand particle erosion and CO2 corrosion behavior for more than 25 years. The experiments to investigate erosion and corrosion were conducted by using laboratory flow loops circulating single phase flows and multiphase flows. As a result, the ECRC has developed two separate computer programs for predicting erosion and corrosion rates. ECRC has launched a new research project with the objective to study the combined effects of erosion and corrosion. Faisal Al-Mutahar [1] developed a new erosion-corrosion model to predict the combined effect of solid particle erosion and CO2 corrosion. The objective was to develop a computer program based on the model to predict the erosion-corrosion rate for carbon steel materials.
The erosion-corrosion model developed by Al-Mutahar requires further experimental work to improve and validate the model. The main objective of the research described in this chapter is to collect experimental data to improve and enhance and validate the model’s predictions. The first area of study investigated in this work, is to determine iron carbonate scale erosion resistance characteristics by using a submerged impingement flow configuration. The scale erosion resistance has been studied for scales formed at two different temperatures. Also, erosion-corrosion experiments were conducted to measure the steady state erosion-corrosion rate of a carbon steel material under scale forming conditions. Finally, the experimentally determined steady-state corrosion rates are compared with corrosion rate predictions by the model with the goal of improving and validating the model.

EROSION-CORROSION PREDICTION MODEL IN A CO2 ENVIRONMENT: IMPROVEMENT AND VALIDATION XII-2
November 2012
Experimental Work
Experimental setup
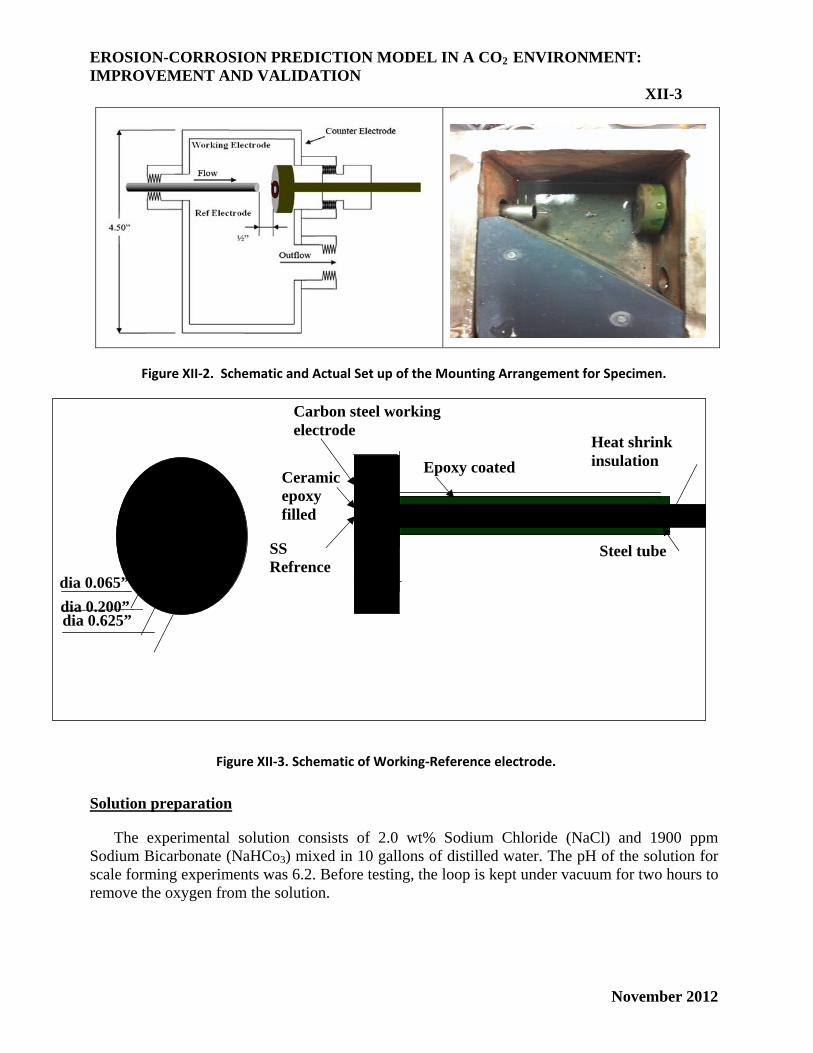
A single-phase flow loop using a jet impingement configuration was used in the process to form iron carbonate scale samples. A schematic diagram of the flow loop is shown in Figure XII-1. The loop is made out of SS316 material and can operate at pressures up to 150 psig (1.13 MPa) and temperatures up to 200 °F (93 °C). The loop consists of HydraCell pump, tank, sand injector, test section and cyclone separator that keeps the sand circulating through the test section. Figure XII-2 shows a schematic and photograph of the jet nozzle and mounting arrangement for the specimen in the test section. The distance between the nozzle exit and the specimen is one half-inch.
Figure XII‐1. Schematic of the Flow Loop.
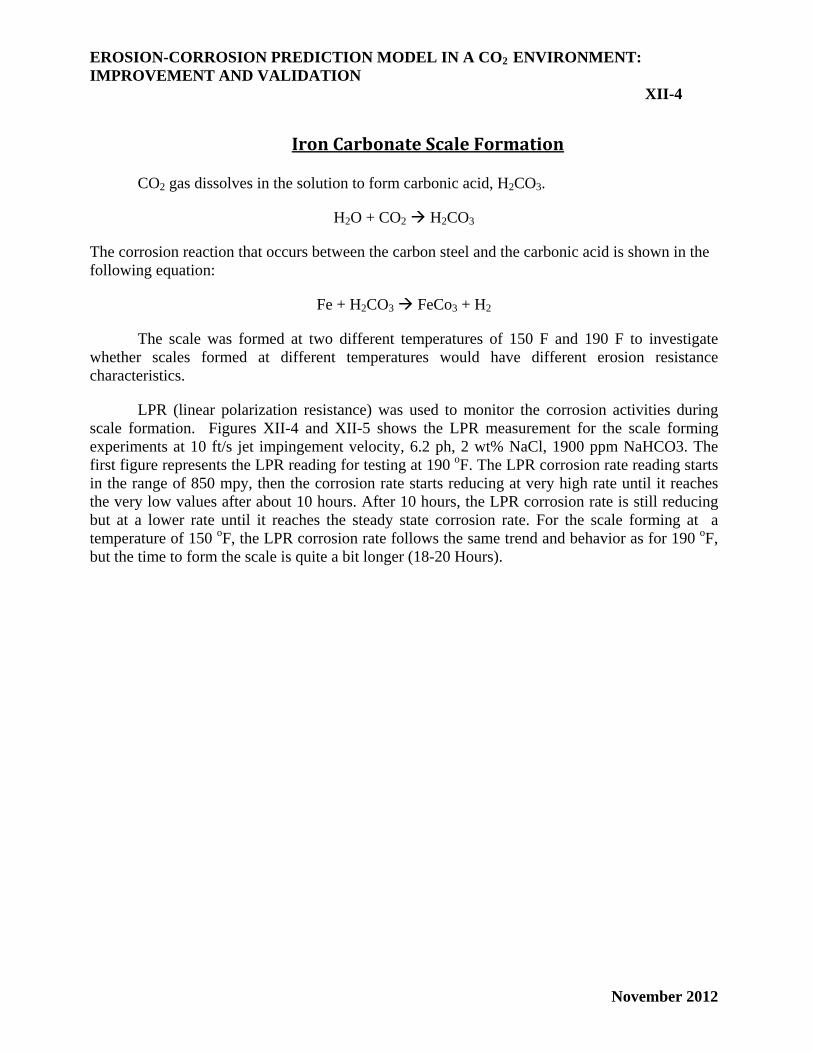
Electrochemical measurements are used to monitor the corrosion rate using the Linear Polarization Resistance (LPR) method. The LPR probe, shown in Figure XII-3 consists of two parts – the working electrode which is made of 1018 carbon steel, and reference electrode which is made of 316L stainless steel. The two electrodes are separated by a non-conductive layer. The counter electrode is the 316L stainless steel loop. The jet of test fluid (which can include entrained sand) is aligned with the center of the electrode. Flow comes through the jet pipe, impacts the surface of specimen and leaves the cell through the outflow port.
EROSION-CORROSION PREDICTION MODEL IN A CO2 ENVIRONMENT: IMPROVEMENT AND VALIDATION XII-3
November 2012
Figure XII‐2. Schematic and Actual Set up of the Mounting Arrangement for Specimen.
Solution preparation
The experimental solution consists of 2.0 wt% Sodium Chloride (NaCl) and 1900 ppm Sodium Bicarbonate (NaHCo3) mixed in 10 gallons of distilled water. The pH of the solution for scale forming experiments was 6.2. Before testing, the loop is kept under vacuum for two hours to remove the oxygen from the solution.
SS Refrence
Ceramic epoxy filled
Carbon steel working electrode
Epoxy coated
Steel tube
Heat shrink insulation
dia 0.065”
dia 0.625” dia 0.200”
Figure XII‐3. Schematic of Working‐Reference electrode.
EROSION-CORROSION PREDICTION MODEL IN A CO2 ENVIRONMENT: IMPROVEMENT AND VALIDATION XII-4
November 2012
Iron Carbonate Scale Formation
CO2 gas dissolves in the solution to form carbonic acid, H2CO3.
H2O + CO2 H2CO3
The corrosion reaction that occurs between the carbon steel and the carbonic acid is shown in the following equation:
Fe + H2CO3 FeCo3 + H2
The scale was formed at two different temperatures of 150 F and 190 F to investigate whether scales formed at different temperatures would have different erosion resistance characteristics.
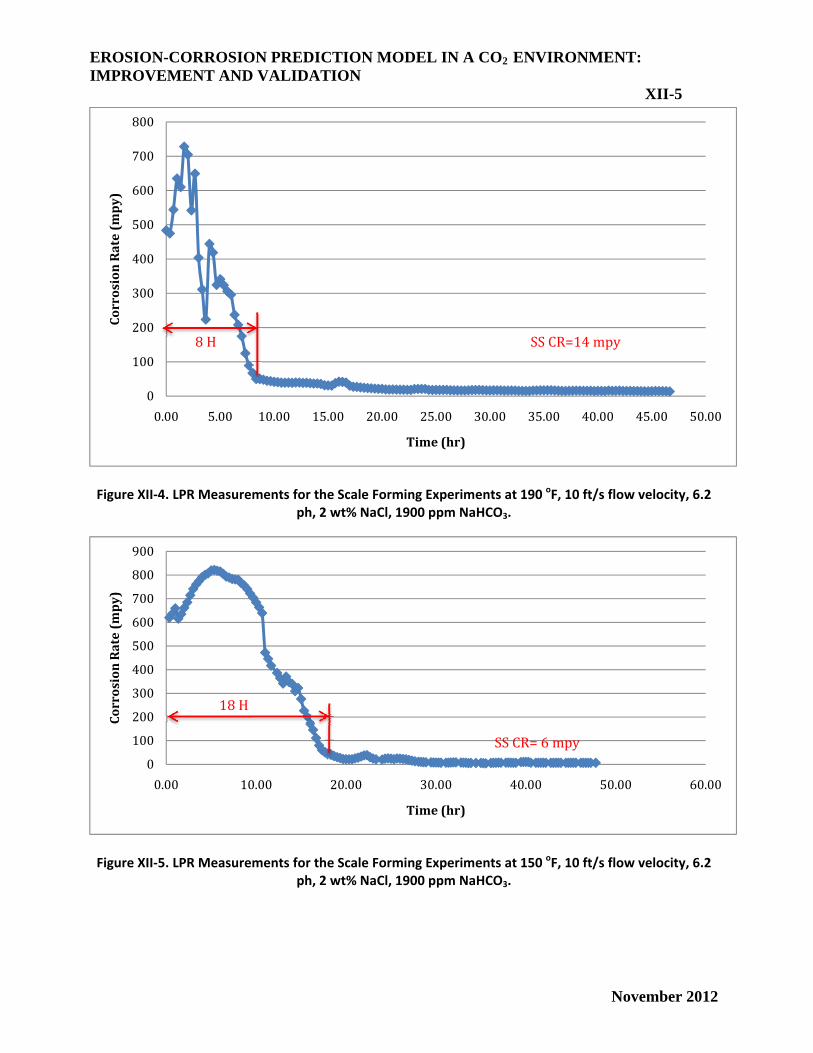
LPR (linear polarization resistance) was used to monitor the corrosion activities during scale formation. Figures XII-4 and XII-5 shows the LPR measurement for the scale forming experiments at 10 ft/s jet impingement velocity, 6.2 ph, 2 wt% NaCl, 1900 ppm NaHCO3. The first figure represents the LPR reading for testing at 190 oF. The LPR corrosion rate reading starts in the range of 850 mpy, then the corrosion rate starts reducing at very high rate until it reaches the very low values after about 10 hours. After 10 hours, the LPR corrosion rate is still reducing but at a lower rate until it reaches the steady state corrosion rate. For the scale forming at a temperature of 150 oF, the LPR corrosion rate follows the same trend and behavior as for 190 oF, but the time to form the scale is quite a bit longer (18-20 Hours).
EROSION-CORROSION PREDICTION MODEL IN A CO2 ENVIRONMENT: IMPROVEMENT AND VALIDATION XII-5
November 2012
Figure XII‐4. LPR Measurements for the Scale Forming Experiments at 190 oF, 10 ft/s flow velocity, 6.2 ph, 2 wt% NaCl, 1900 ppm NaHCO3.
Figure XII‐5. LPR Measurements for the Scale Forming Experiments at 150 oF, 10 ft/s flow velocity, 6.2 ph, 2 wt% NaCl, 1900 ppm NaHCO3.
0
100
200
300
400
500
600
700
800
0.00 5.00 10.00 15.00 20.00 25.00 30.00 35.00 40.00 45.00 50.00
Corrosion Rate (mpy)
Time (hr)
SS CR=14 mpy8 H
0
100
200
300
400
500
600
700
800
900
0.00 10.00 20.00 30.00 40.00 50.00 60.00
Corrosion Rate (mpy)
Time (hr)
18 H
SS CR= 6 mpy

EROSION-CORROSION PREDICTION MODEL IN A CO2 ENVIRONMENT: IMPROVEMENT AND VALIDATION XII-6
November 2012
Scale Characterization by SEM
Iron carbonate scales were characterized with respect to scale thickness and erosion resistance. Scanning electron microscopy (SEM) was used to provide scale thickness measurements. Al-Mutahar [1] found that lower solution pH and lower temperatures tended to lead to thicker scales. SEM was also used to examine scale morphology by looking into the top surface of the scales of un-mounted specimens.
Scale Erosion Resistance Characterization
Iron carbonate scale erosion resistance characterizations were conducted using the submerged impingement flow loop. The sand is injected to the flow and kept circulating within the test section at a temperature of 150 oF. The solution for this erosion testing consisted of distilled and deaerated water under 20-psig nitrogen pressure. The two types of scale tested were the FeCO3 scales that were formed at 150 and 190 oF. The experiments were conducted at sand concentrations ranging from 0.3 to 1.2 wt% and at a constant jet impingement velocity of 10 ft/s. The sand concentrations were monitored and adjusted throughout the scale erosion experiments to maintain a constant sand concentration. The scale erosion tests periods were for 1 to 3 hours. The scale erosion rates were measured by two different ways: Weight Loss (weight difference before and after testing), and 3-D profilometer (volume difference before and after testing).
Table XII-1 shows a sample iron carbonate scale erosion experiment. The sand concentration was sampled after the first injection of the sand, at the middle of the test and at the end. The sand concentration is adjusted by adding more sand to the test loop as needed to maintain a constant sand concentration.
Figure XII-6 summarizes the scale erosion rates for scales that were pre-formed at a temperature of 190 F, 6.2 pH, and 10 ft/s jet impingement velocity. The erosion rate data points were determined by the Weight Loss (blue diamonds) and by the 3-D profilometry for two points only (red squares).

EROSION-CORROSION PREDICTION MODEL IN A CO2 ENVIRONMENT: IMPROVEMENT AND VALIDATION XII-7
November 2012
Table XII-1 Sample scale erosion resistance characterization experiment at 190 oF
Scale forming condition: • (T=190 oF, pH 6.58, PCO2=20 psig • Jet impingement velocity = 10 ft/s
Scale Erosion Testing conditions: • (T=150 oF, PN2=20 psig) • Average Sand conc. = 0.95 wt% • Flow velocity = 10 ft/s
Scale Erosion Rate by weight: ER
Sample weight before test (g) 30.1295
Sample weight after test (g) 30.1273
Metal loss (g) 0.0022
Time (H) 3
Erosion rate (mpy) 374.56
Scale Erosion by 3-D profile: ER
Height before erosion (micron) 55.9
Height after erosion (micron) 58.4
Scale volume loss (cm3) 0.0004442 Mass loss (g) 0.00168796 Time (H) 3 Erosion rate (mpy) 288.5
0.0
0.5
1.0
1.5
2.0
0 0.5 1 1.5 2 2.5 3
Sand concentration
wt%
Time H
Sand wt%
Average wt%

EROSION-CORROSION PREDICTION MODEL IN A CO2 ENVIRONMENT: IMPROVEMENT AND VALIDATION XII-8
November 2012
Erosion Ratio is defined as the mass loss of material divided by mass of sand throughput. The scale Erosion Ratios for different sand concentrations at constant jet impingement velocity are shown in Figure VII-7. There is a slight decrease in the scale Erosion Ratio with increasing sand concentration. This inclination could be attributed to the particle-to-particle interaction. As sand concentration increases particles approaching the test specimen may be deflected by sand particles rebounding from the test specimen. This particle-to-particle interaction is more likely in a jet impingement flow geometry since particle outflow velocity near the specimen is quite low.
Figure XII‐6. Scale Erosion Rate Summaries for 190 oF and 10 ft/s.
Figure XII‐7: Scale to Sand Erosion Ratio (kg/kg) Vs sand concentration for 190 oF and 10 ft/s
Similar to the scale erosion resistance experiments for scales formed at 190 oF, several erosion experiments were conducted to characterize erosion resistance for scales formed at 150 oF. Table XII-2 shows one example of erosion resistance test data for scales preformed at 150 oF. Also Figure XII-8 summarizes the erosion rate for scales formed at 150 oF for different sand
0
100
200
300
400
500
0.0% 0.2% 0.4% 0.6% 0.8% 1.0% 1.2% 1.4%Scale Erosion Rate (mpy)
Sand Concentrations (wt%)
Scale Erosion Rate For 190 oF & 10 ft/s
ER by weight loss @ 190 F (mpy)ER By 3D Profile @ 190 F (mpy)
0.0E+00
5.0E‐07
1.0E‐06
1.5E‐06
2.0E‐06
0.0% 0.5% 1.0% 1.5%Scale to Sand Erosion Ratio
(kg/kg)
Sand Concentration wt%
Scale erosion ratio vs Sand concentration for 190 oF

EROSION-CORROSION PREDICTION MODEL IN A CO2 ENVIRONMENT: IMPROVEMENT AND VALIDATION XII-9
November 2012
concentrations. Work is still in progress to collect more data points in order to better characterize the erosion resistance of these scales.
Table XII-2 Sample of scale erosion resistance characterization experiment at 150 oF
Scale forming condition: • (T=150 oF, pH 6.58, PCO2=20 psig, 2 gpm) • Jet impingement velocity = 10 ft/s
Scale Erosion Testing conditions: • (T=150 oF, PN2=20 psig) • Average Sand conc. = 0.86 wt% • Flow velocity = 10 ft/s
Scale Erosion Rate by weight:
ER
Sample weight before test (g) 30.4934
Sample weight after test (g) 30.4904
Metal loss (g) 0.003
Time (H) 2
Erosion rate (mpy) 766.16385
Scale Erosion by 3-D profile: ER
Height before erosion (micron) 69.9
Height after erosion (micron) 74.9 Scale volume loss (cm3) 0.0008884 Mass loss (g) 0.006831796 Time (H) 2 Erosion rate (mpy) 865.5
0.86
0.0
0.5
1.0
1.5
2.0
0 20 40 60 80 100 120 140
Sand
concentration wt%
Time H
Sand wt% Average wt%
EROSION-CORROSION PREDICTION MODEL IN A CO2 ENVIRONMENT: IMPROVEMENT AND VALIDATION XII-10
November 2012
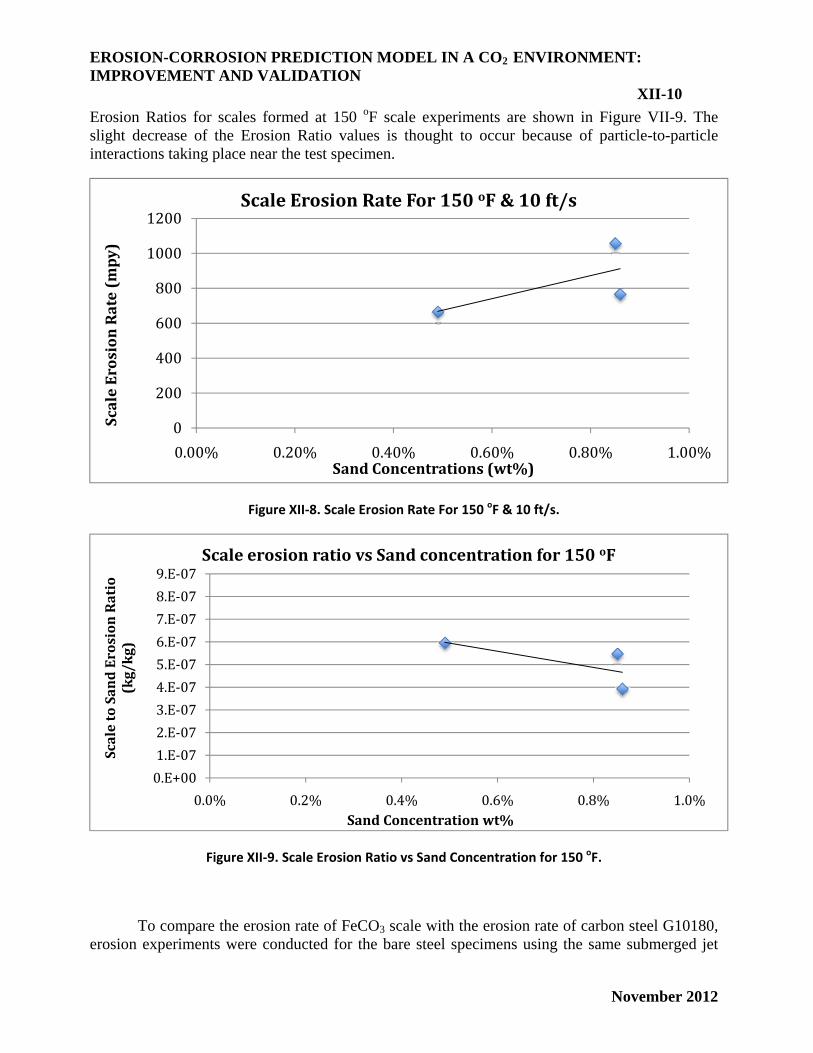
Erosion Ratios for scales formed at 150 oF scale experiments are shown in Figure VII-9. The slight decrease of the Erosion Ratio values is thought to occur because of particle-to-particle interactions taking place near the test specimen.
Figure XII‐8. Scale Erosion Rate For 150 oF & 10 ft/s.
Figure XII‐9. Scale Erosion Ratio vs Sand Concentration for 150 oF.
To compare the erosion rate of FeCO3 scale with the erosion rate of carbon steel G10180, erosion experiments were conducted for the bare steel specimens using the same submerged jet
0
200
400
600
800
1000
1200
0.00% 0.20% 0.40% 0.60% 0.80% 1.00%
Scale Erosion Rate (mpy)
Sand Concentrations (wt%)
Scale Erosion Rate For 150 oF & 10 ft/s
0.E+001.E‐072.E‐073.E‐074.E‐075.E‐076.E‐077.E‐078.E‐079.E‐07
0.0% 0.2% 0.4% 0.6% 0.8% 1.0%
Scale to Sand Erosion Ratio
(kg/kg)
Sand Concentration wt%
Scale erosion ratio vs Sand concentration for 150 oF

EROSION-CORROSION PREDICTION MODEL IN A CO2 ENVIRONMENT: IMPROVEMENT AND VALIDATION XII-11
November 2012
impingement flow loop. Figure XII-10 shows the relation between the scale erosion rate and the bare G10180 steel erosion rate. The graphs indicate that the scale erosion rate is higher than the steel by a factor of about 5 for the scale formed at 190 oF and 6.2 pH. The erosion rate for scale formed at 150 oF is higher than the erosion rate for the steel by a factor of about 15.
Figure XII‐10. Scale Erosion Rate And Bare G10180 Steel Erosion Rate.
Scale SEM Examination Post Erosion Test
The assessment of the scale remaining on the specimen after erosion test was carried out by using a scanning electron microscope (SEM). The objective was to verify that the coating remaining was indeed iron carbonate scale, to determine the thickness of the scale. Figure XII-11 shows a sample result for one specimen. Milling to the specimen surface was done by using the ion beam process to expose a cross section of part of the scale and substrate. As indicated by the SEM micrograph, some scale appears to remain on the specimen surface. Also, Energy Dispersive X-ray Spectroscopy (EDXS) was carried out on the scale and substrate. The results show an oxygen component for the coating compatible with the composition of iron carbonate scale. This was also compared to the substrate results and showed higher content of oxygen and lower percentage of iron content for the scale.
0
200
400
600
800
1000
1200
0.0% 0.5% 1.0% 1.5% 2.0%
Erosion Rate (mpy)
Sand Concentration wt%
Steel
190 OF Scale
150 OF Scale
5 times
15 times

EROSION-CORROSION PREDICTION MODEL IN A CO2 ENVIRONMENT: IMPROVEMENT AND VALIDATION XII-12
November 2012
Figure XII‐11. SEM Analysis for Post Scale Erosion Experiment and EDXS Analysis.
Erosion Corrosion Experiments
To validate the model, corrosion-erosion experiments were conducted in the submerged jet impingement flow loop. The test started with a bare 1018 steel specimen. Iron carbonate scale was formed for the following test conditions: T=190 and 150 oF, 6.5 pH, 10 ft/s jet impingement velocity, 2 wt% NaCl, and 1900 ppm NaHCO3. The procedure for forming the scale was the same as explained in the earlier section of this report. Similarly, the corrosion rate was monitored by LPR. After forming scale and reaching a steady state condition, sand was injected at different concentrations as summarized below to monitor corrosion rates when sand particles were eroding the scale while simultaneously new scale was being created. In most of the cases the erosion-corrosion experiments were conducted for at least 12 hours to allow for the steady state of

EROSION-CORROSION PREDICTION MODEL IN A CO2 ENVIRONMENT: IMPROVEMENT AND VALIDATION XII-13
November 2012
erosion-corrosion to take place. The sand concentration was monitored for each test and adjusted to maintain the targeted sand concentration.
As illustrated by the Figure XII-12, the LPR corrosion rate increased to higher values after injecting the sand. In this experiment, the LPR measurement of corrosion rate increased from the steady state corrosion rate of 16 mpy to 250 mpy after injecting 15 g of sand (equivalent to 1.6 wt % sand concentration). The corrosion rate then started to decrease to slightly lower values until it reached the steady-state value of 198 mpy. At the conclusion of this test, post examination of the specimen revealed that the scale had been completely removed as illustrated in the picture at the top right corner of Figure XII-12.
Figure XII‐12: Erosion‐Corrosion Experiment (T=190 oF, pH 6.2, 10 ft/s) with 1.6 wt% Sand Concentration
A second example of erosion corrosion experiments is presented in Figure VII-13. The test conditions for this test were as follows: 190 oF, pH 6.2, P CO2 20 psig, 10 ft/s velocity, 15 g of sand (sand concentration 0.1 wt%). The steady state corrosion rate after scale formation was completed was 22 mpy. At about 24 hour into the test, 15 g of sand were injected. Following the sand injection the corrosion rate increased to a steady state value of 31 mpy after an additional 12 hours. This increase in the corrosion rate activity is a result of the scale partially eroded due to the sand particles impingements. The sand concentration was monitored throughout the erosion-corrosion experiments as shown in the top right corner of the Figure XII-13.
0
100
200
300
400
500
600
700
800
900
0.00 5.00 10.00 15.00 20.00 25.00 30.00 35.00 40.00
Corrosion Rate (mpy)
Time (hr)
25 g of sand added
SS CR = 13.5 mpy
SS ECR= 198 mpy (7h)

EROSION-CORROSION PREDICTION MODEL IN A CO2 ENVIRONMENT: IMPROVEMENT AND VALIDATION XII-14
November 2012
Figure XII‐13: Erosion‐Corrosion Test (190 oF, pH 6.2, P CO2 20 psig, 10 ft/s velocity, 15 g of sand, Sand Concentration =0.1)
Figure XII-14 shows several erosion-corrosion tests for the same scale forming conditions at 190 oF and different sand concentrations. As it is clearly shown by the graph, the greater the sand concentration, the higher the steady-state corrosion rate.
Figure XII‐14. Summary of Erosion‐Corrosion Tests @ 190 oF, pH 6.2, P CO2 20 psig , 10 ft/s Velocity and Different Sand Concentrations
Three different methods were used to examine the specimens after the erosion-corrosion tests to verify the presence of iron carbonate scale after the erosion tests. SEM (scanning electron
!
0
100
200
300
400
500
600
700
800
900
1000
0.00 10.00 20.00 30.00 40.00 50.00 60.00 70.00
Corrosion Rate (mpy)
Time (hr)
ER‐002 ‐ "15g of sand, conct. =0.1 wt%"
ER‐001 ‐ "25g of sand, concnt. = 1.6 wt%"
Kavitha (0.5 wt% Sand Conct.)
ER‐OO3 (0.4 Concnt)

EROSION-CORROSION PREDICTION MODEL IN A CO2 ENVIRONMENT: IMPROVEMENT AND VALIDATION XII-15
November 2012
microscope) was used to characterize the scale remaining thickness and showed a scale thickness of 15 microns as indicated in Figure XII-15 (a). The XRD (X-Ray Diffraction) also confirmed the presence of siderite (iron carbonate) as shown in Figure XII-15 (b). Also, a copper sulfate solution was used to paint the top surface of the specimen. The bare steel color changes to brown if it is exposed to copper sulfate. The iron carbonate coating shows no color change when exposed to copper sulfate solution. Exposing the erosion-corrosion specimen with the copper sulfate solution confirmed of the presence of the iron carbonate scale as illustrated in Figure XII-15 (c).
(a) XRD analysis
(b) Iron carbonate scale on top of specimen surface after erosioncorrosion experiments
(c) Iron carbonate scale covering all the surface with few pitting shown in brown after using copper sulfite
Figure XII‐15. SEM, XRD and Copper Sulfite Tests on the Specimen After Erosion‐Corrosion Experiments.
New Mechanistic Model Prediction
The newly developed erosion-corrosion prediction model was used to predict the erosion-corrosion rate using the same conditions as were used in the experiments. A comparison was

EROSION-CORROSION PREDICTION MODEL IN A CO2 ENVIRONMENT: IMPROVEMENT AND VALIDATION XII-16
November 2012
made between the experimental data collected from the erosion-corrosion experiments and the model prediction. Table XII-3 summarizes the erosion-corrosion experimental results for different sand erosivity (0.1 to 1.6 wt% concentration) and the model predictions. The model predicted no scale condition for all the cases tested where the post experiments examinations showed iron carbonate scale presence in all cases except one. In other words, scale precipitation rates predicted by the model were less than the scale erosion rates in the tests. In these cases, the model will predict “No Scale”, and the corrosion rate for a bare specimen.
Table XII‐3 Comparison between E‐C model and Experimental Data
Condition Experiment Model
Sand Concentration
Scale Erosion Rate (mpy) CR (mpy) Scale CR (mpy) Scale
0.1 200 31 Scale 763.8 No scale
0.2 250 30 Scale 763.8 No scale
0.4 270 117 Scale 763.8 No Scale
0.5 280 107 Scale 763.8 No scale
1.6 480 190 No-Scale 763.8 No scale
Conclusion
In conclusion, the scale erosion resistance was determined using a submerged jet impingement flow configuration. The erosion resistance of scale formed at 190 oF was lower than for steel by a factor of 5. For scale formed at 150 oF, the ratio was 15. Also, the scale formed at 150 oF eroded 3 times faster than that formed at 190 oF. The erosion-corrosion model for scale-forming conditions underpredicted the scale deposition rate in all cases so far. Experimental data take so far in this project, as well as data from additional tests at other environmental conditions will serve to improve and calibrate the erosion-corrosion model.
Future Work
Plans for future work on this project include:
o Expand the testing of scales formed at 150 oF to better characterize the erosion resistance behavior for scales formed at this lower temperature.

EROSION-CORROSION PREDICTION MODEL IN A CO2 ENVIRONMENT: IMPROVEMENT AND VALIDATION XII-17
November 2012
o Conduct additional erosion-corrosion experiments at different test conditions by varying the following parameters: submerged jet velocity; temperature; and, sand concentration. The Multiphase flow loop will be used to collect additional erosion-corrosion data for comparison with model predictions.
o Investigate possible modifications to the E-C model to bring predictions closer to experimental results.
Reference
1. F. Al-Mutahar, Erosion‐Corrosion For Carbon Steel In Sweet Production With Sand: Modeling and Experiments, Mechanical Engineering Department, The University of Tulsa: Tulsa, OK, 2012.