xi. facts bearing on agricultural income
TRANSCRIPT
This PDF is a selection from an out-of-print volume from the NationalBureau of Economic Research
Volume Title: The National Income and Its Purchasing Power
Volume Author/Editor: Willford Isbell King, assisted by Lillian Epstein
Volume Publisher: NBER
Volume ISBN: 0-87014-014-0
Volume URL: http://www.nber.org/books/king30-1
Publication Date: 1930
Chapter Title: XI. Facts Bearing On Agricultural Income
Chapter Author: Willford Isbell King
Chapter URL: http://www.nber.org/chapters/c6389
Chapter pages in book: (p. 291 - 314)
CHAPTER XI
FACTS BEARING ON AGRICULTURAL INCOME
Chnnges in the Total Physical Productivity of Agriculture.To measure year to year changes in the total physical produc-
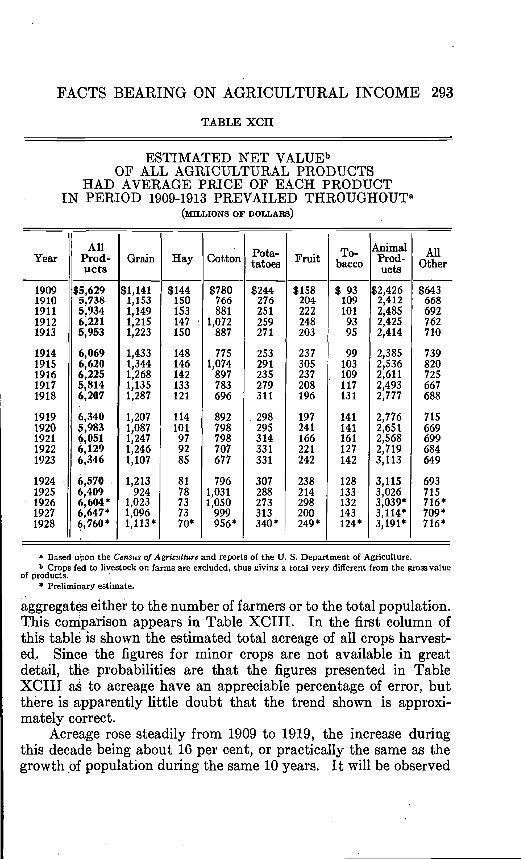
tivity of the agricultural industry is not easy. The records of thephysical quantities of the various crops produced each year are, tobe sure, reasonably complete. But a large proportion of the cropsare used to feed livestock, and, to no small extent, the farmer deriveshis income from the sale of milk, butter, eggs, beef, and pork,rather than from the sale of hay and grain. The figures in TableXCII represent the results of an effort to overcome such statisticaldifficulties and to present a condensed picture of the physicalproductivity of the agricultural industry for the years 1909 to 1925,inclusive. The method of attack has been to calculate what thevalue of the various net products would have been had the priceof each remained at the level measured by the average price ofeach product during the period 1909 to 1913, inclusive.
The question will probably be raised at this point as to whythe average for a period of years has been used as a base in thisparticular instance, while, in previous tables in this report, it hasbeen customary to make all comparisons on the basis of one yearonly, namely 1913. The reason for broadening the base in thisparticular instance is that crop production is notoriously variable,rising and falling greatly with the amount of rainfall, and henceagricultural prices, depending as they do very largely upon thevolume of production in the given year, also vary widely from monthto month and season to season. For this reason, it has seemed bestto take an average for a five year period as a basis for our calcula-tions.
Relative Importance of Different Agricultural Products.The figures for grain and hay production appear very low in
comparison with the figures for animal products. This is due tothe fact that the estimates for grain and hay do not represent thetotal value of the amount of these products raised by the farmers,but merely the estimated value of. the amounts either sold outsideof the farm area, or consumed by human beings on farms or else-
291
292 THE NATIONAL INCOME
where; in other words, an attempt has been made to eliminate allgrain and hay fed to livestock on the farms.
In Chart 45 it is seen that the four groups of products makingup the bulk of agricultural output, are, in order of importance,animal products, grain, cotton and miscellaneous products—animalproducts alone accounting for nearly half of the total value. Fur-thermore, animal products have been increasing relatively in pro-portionate importance, while hay, and to a certain extent grain,show a diminution in relative importance.
A year to Srear comparison indicates that, when all productsare combined, 1915 and 1924 are the banner years for productionin the entire period covered. Although we heard much of thestrenuous efforts of the farmers in 1917 and 1918, in neither of theseyears did physical output reach a level as high as in 1915 or even in1916. It must be remembered, however, that, especially in 1918,the farm working force was reduced by the enlistment of a largenumber of the boys into the Army. The year 1918 did, however,represent a peak for that part of the period, as far as production ofanimal products was concerned, and the yield of potatoes was alsowell above normal. The net supply of grain available for humanfood, while larger than in 1917 and 1916, was not nearly up to thelevel of 1914 and 1915. The net output of grain in 1925 was lowerthan in any other year in the period, and the same may be said ofhay, the tendency in the shipments of the latter being sharplydownward owing to the diminution of the number of horses in thecity. Cotton production was unusually high in 1925. The outputof animal products is more stable than the output of other agri-cultural products, and apparently has a decided upward trend.
The net totals of grain production in Table XCII have notbeen arrived at by calculating and deducting from the gross pro-duction the amount of grain fed to livestock, but have been es-timated on the basis of the excess of exports over imports, theamount of grain milled less the amount ground for feed, and theamount used for brewing and miscellaneous purposes. The figuresfor hay, in the same table, represent the estimated amounts of hayfed to livestock not on farms. As the numbers of such livestock arebut roughly estimated, these figures are, of course, nothing butapproximations.
Variations in Total Acreage Harvested.The figures in Table XCII, while representing the aggregate
of net physical production, do not show the relationships of these
FACTS BEARING ON AGRICULTURAL INCOME 293
TABLE XCII
ESTIMATED NET VALUEbOF ALL AGRICULTURAL PRODUCTS
HAD AVERAGE PRICE OF EACH PRODUCTEN PERIOD 1909-1913 PREVAILED THROUGHOIJTa
(MILLIONS OF DOLLARS)
YearAll
Prod- Grain Hay .Cotton Pta Fruit T-° AnimalProd- All
h
19091910191119121913
19141915191619171918
19191920192119221923
19241925192619271928
$5,6295,7385,9346,2215,953
6,0696,6206,2255,8146,207
6,3405,9836,051
6,346
6,5706,409
,604*6,647*6,760*
$1,1411,1531,1491,2151,223
1,4331,3441,2681,1351,287
1,2071,0871,2471,2461,107
1,213924
1,0231,0961,113*
$144150153147150
148146142133121
114101979283
8178737370*
$780766881
1,072887
7751,074
897783696
892798798707677
7961,0311,050
999956*
$244276251259271
253291235279311
298295314331331
30728827331334Q*
$158204222248203
237305237208196
197241166221242
238214298200249*
$ 93109101
9395
99103109117131
141141161127142
128133132143124*
$2,4262,4122,4852,4252,414
2,3852,5362,6112,4932,777
2,7762,6512,5682,7193,113
3,1153,0263,039*3,114*3,191*
$643668692762710
739820725667688
715669699684649
693715716*709*716*
Based upon the Census of Agriculture and reports of the U. S. Department of Agriculture.b Crops fed to livestock on farms are excluded, thus giving a total very different from the gross value
of products.* Preliminary estimate.
aggregates either to the number of farmers or to the total population..This comparison appears in Table XCIII. In the first column ofthis table is shown the estimated total acreage of all crops harvest-ed.. Since the figures for minor crops are not available in greatdetail, the probabilities are that the figures presented in TableXCIII as to acreage have an appreciable percentage of error, butthere is apparently little doubt that the trend shown is approxi-mately correct.
Acreage rose steadily from 1909 to 1919, the increase duringthis decade being about 16 per cent, or practically the same as thegrowth of population during the same 10 years. It will be observed

$ For data, see Table XC II.
CHART 45
ESTIMATED NET VALUE OF ALL AGRICULTURALPRODUCTS HAD AVERAGE PRICE OF EACH
PRODUCT IN PERIOD 1909-1913PREVAILED THROUGHOUTS

FACTS BEARING ON AGRICULTURAL INCOME 295
also that acreage continued to increase in 1918 despite the fact thata large number of men from the farms were called into the Army.Evidently, then, there is truth in the idea that more work per farmworker was expended on the farms of the United States during wartime than in the years immediately preceding. In 1920, there wasa sharp decline in acres harvested, partly due, presumably, to thefact that the demand at high wages for workers in the cities was sostrong as to draw a proportion of laborers from the farm, and partlyascribable, no doubt, to the fact that, with the collapse of pricesin 1920, a considerable proportion of the low-yield acreage was notworth harvesting. The decline in total acreage extended somewhatfurther in the next year, but, in 1922 and 1923, acreage again rose,despite the fact that the number of farmers' was then beginning todecrease. Between 1922 and 1927, acreage remained practicallystationary, while the number of farmers declined somewhat, and thefarm population fell off materially.
Effect of Tractors and Automobiles on Acreage Cultivated.One of the factors which has enabled a diminished number of
farm workers to maintain acreage undiminished has been the in-creasing use of the tractor on the larger farms in the MississippiValley and especially in the Great Plains region. The fact thatmost farmers now have automobiles has also helped them to econ-omize on time in getting from place to place and doubtless has alsoaided in enabling a smaller number of farmers to keep up the acreage.In 1928, there was a sharp increase in acreage which finally pulledthe figure above the level of 1919—and this in the face of the factthat the number of farmers declined still further.
Cultivated Acreage Per Farmer.The number of acres per farmer in 1909 was about 50.3; in
1919, this had increased to approximately 57.4; and, in 1928, itwas just above 60. It appears, therefore, that the size of the farmas measured by the area of crops cultivated has grown very mate-rially during the 19 years, despite the fact that the number ofworkers per farm has diminished, and also despite the fact that avery considerable additional amount of farm land has been devotedto the intensive type of cultivation necessary for growing thevegetables and fruits required by an increasing population. Such
'The term "farmers" means farm operators and does not include hired employees.
296 THE NATIONAL INCOME
increase in truck farming has evidently been more than offset bythe growth in extensive farming on the Western plains.
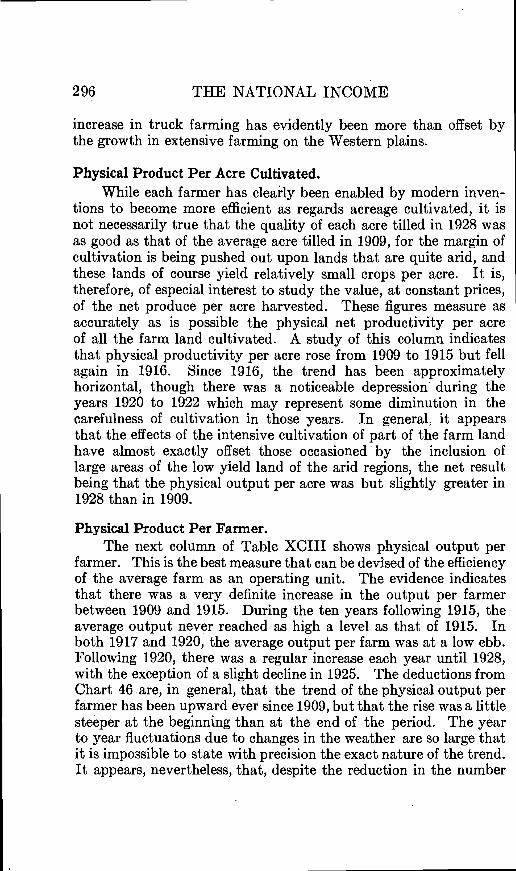
Physical Product Per Acre Cultivated.While each farmer has clearly been enabled by modern inven-
tions to become more efficient as regards acreage cultivated, it isnot necessarily true that the quality of each acre tilled in 1928 wasas good as that of the average acre tilled in 1909, for the margin ofcultivation is being pushed out upon lands that are quite arid, andthese lands of course yield relatively small crops per acre. It is,therefore, of especial interest to study the value, at constant prices,of the net produce per acre harvested. These figures measure asaccurately as is possible the physical net productivity per acreof all the farm land cultivated. A study of this column indicatesthat physical productivity per acre rose from 1909 to 1915 but fellagain in 1916. Since 1916, the trend has been approximatelyhorizontal, though there was a noticeable depression during theyears 1920 to 1922 which may represent some diminution in thecarefulness of cultivation in those years. In general, it appearsthat the effects of the intensive cultivation of part of the farm landhave almost exactly offset those occasioned by the inclusion oflarge areas of the low yield land of the arid regions, the net resultbeing that the physical output per acre was but slightly greater in1928 than in 1909.
Physical Product Per Farmer.The next column of Table XCIII shows physical output per
farmer. This is the best measure that can be devised of the efficiencyof the average farm as an operating unit. The evidence indicatesthat there was a very definite increase in the output per farmerbetween 1909 and 1915. During the ten years following 1915, theaverage output never reached as high a level as that of 1915. Inboth 1917 and 1920, the average output per farm was at a low ebb.Following 1920, there was a regular increase each year until 1928,with the exception of a slight decline in 1925. The deductions fromChart 46 are, in general, that the trend of the physical output perfarmer has been upward ever since 1909, but that the rise was a littlesteeper at the beginning than at the end of the period. The yearto year fluctuations due to changes in the weather are so large thatit is impossible to state with precision the exact nature of the trend.It appears, nevertheless, that, despite the reduction in the number
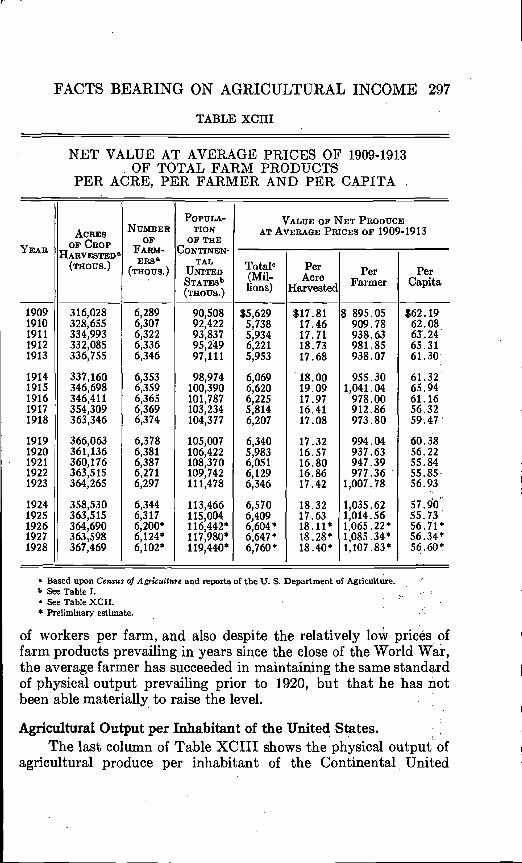
FACTS BEARING ON AGRICULTURAL INCOME 297
TABLE XCIII
NET VALUE AT AVERAGE PRICES OF 1909-19 13OF TOTAL FARM PRODUCTS
PER ACRE, PER FARMER AND PER CAPITA
YEAR OF CROP
NUMBEROF
FARM-ERSa
(mous.)
POPuLATION
OF THE
TAL
STATESb(THOUS.)
V.u11m3 OF NET PRoDucEAT AVERAGE PRICES OF 19091913
Total°(Mil-lions)
PerAcre
HarvestedPer
FarmerPer
Capita.
19091910191119121913
316,028328,655334,993332,085336,755
6,2896,3076,3226,3366,346
90,50892,42293,83795,24997,111
$5,6295,7385,9346,2215,953
$17.8117.4617.7118.7317.68
$ 895.05909.78938.63981.85938.07
$62.1962.086S..2465.3161.301.
19141915191619171918
337,160346,698346,411354,309363,346
6,3536,3596,3656,3696,374
98,974100,390101,787103,234104,377
6,0696,6206,2255,8146,207
18.0019.0917.9716.4117.08
955.301,041.04
978.00912.86973.80
61.3265.94:61.1656.3259.47
19191920192119221923
366,063361,136360,176363,515364,265
6,3786,3816,3876,2716,297
105,007106,422108,370109,742111,478
6,3405,9836,0516,1296,346
17.3216.5716.8016.8617.42
994.04937.63947.39977.36
1,007.78
60.3856.2255.8455.85-56.93
19241925192619271928
358,530363,515364,690363,598367,469
6,3446,3176,200*6,124*6,102*
113,466115,004116,442*117,980*119,440*
6,5706,4096,604*6,647*6,760*
18.3217.6318.11*18.28*18.40*
1,035.621,014.561,065.22*
1,107.83*
57.9055.7356.71*56.34*56.60*
Based upon of Agricuiiure and reports of the U. S. Department of Agriculture.b See Table I.• See Table XCII.
.
* Preliminary estimate.
of workers per farm, and also despite the relatively low offarm products prevailing in years since the close of the World War,the average farmer has succeeded in maintaining the same standardof physical output prevailing prior to 1920, but that he has notbeen able materially to raise the level.
Agricultural Output per Inhabitant of the United States.The last column of Table XCIII shows the physical output of
agricultural produce per inhabitant of the Continental. United

CHART 46
• For data, aee Table XCIII.
NET VALUE AT AVERAGE PRICES OF 1909-19 13OF TOTAL FARM PRODUCTS
PER ACRE, PER FARMER, AND PER CAPITM
Sa
0
0
0S
0a
it
70eoia
—
up'
0' 0' a—
0'UI
0N
UI
NClUI
N0'
ItNUI
r-NNN0001- aCNa
Vplué Ciipita
1,100
lv)
110000aLA.
0U,
-J-J0C
0
70
60
aTa040
Is.0U)
-JDt1
0C
I0
0
II
UI
I,,
'C
00
50-
40-
30-
10-
r r— — — —
-
-
-
00— 01010101a00100
IONa'

FACTS BEARING ON AGRICULTURAL INCOME 299
States. The population of the United States has, of course, beengrowing rapidly. Since 1915, agricultural output has not beenkeeping pace with population. Between 1909 and 1916, productionper capita apparently ran on approximately a level trend, but after1915, a marked decline became apparent, and, from 1917 to 1928,the output of agriculture per inhabitant remained on a level mate-rially lower than that characterizing the years 1909 to 1916. Theaverage output for the years 1917 to 1925, was, in fact, only about91 per cent as great as the output during the years 1909 to 1916.This decline in per capita production of agricultural products re-sulted in some curtailment of exports and in some shift of consump-tion from meat to vegetable products. Every shift in this directionmakes it possible for a fixed number of acres to supply food for anumber of persons relatively much larger than could be fed frommeat grown on the same acreage.
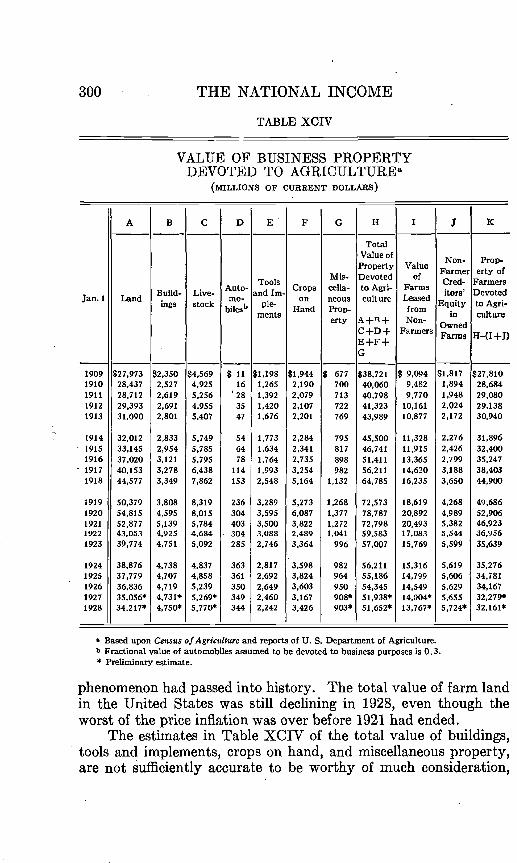
Value of Business Property Devoted to Agriculture.Table XCIV records in terms of current dollars the value of
various kinds of business property devoted to agriculture. Thefigures in this table are either taken directly from the reports ofthe Federal Bureau of Agricultural Economics or are estimatedfrom the reports of that Bureau or from the Census of Agriculture.An interesting column in this table shows the nominal value offarm land in the various years. We see portrayed here the steadyrise in its aggregate value between 1909 and 1915 and the veryrapid ascent between 1915 and 1920. It was, of course, this steepupward incline which led farmers and others to believe that agri-cultural land was an extremely profitable investment, and, becauseof this belief, many thousands of persons bought farms on relativelysmall payments. The disastrous results of this practice, with itsaftermath of wholesale foreclosures of farm mortgages and failuresof numerous banks, are too well known to need emphasis at thispoint. It is, indeed, true that the increase in nominal value between1915 and 1920 would disappear if reduced to terms of dollars ofconstant purchasing power, but the fact must be kept in mind thatpeople interested in buying farm land did not realize that the up-ward movements in values were merely reflections of currency in-flation and that the upward trend would therefore cease whencurrency inflation stopped.
It is interesting to observe how long the effects of the ex-orbitant valuations due to currency inflation persisted after that
300 THE NATIONAL INCOME
TABLE XCIV
VALUE OF BUSINESS PROPERTYDEVOTED TO
A C 1) F G H I J IC
• TotalValue of Non- Prop-Property Value
• Farmer erty ofMis- Devoted ofTools . Cred- Farmers
Auto- Crops celia- to Agri- FarmsBuild- Live- and Im- itore Devoted
Jan. 1 Land . mo- on neous culture Leasedmgs stock b ple- Equity to Agri-
biles Hand Prop- frommeats in cultureerty A+R + Non-
OwnedC +D + FarmersE+F+ Farms H-(I+J)
G
1909 $27,973 $2,330 $4,569 $ 11 $1,198 $1,944 $ 677 $38,721 $ 9,094 $1,817 $27,8101910 28,437 2,521 4,923 16 1,263 2,190 700 40.060 9,482 1,894 28,6841911 28,712 2,619 5,256 28 1,392 2,079 713 40,798 9,770 1,948 29,0801912 29,393 2,691 4,935 35 1,420 2,101 722 41,323 10,161 2,024 29.1381913 31,090 2,801 5,401 47 1,676 2,201 769 43,989 10,877 2,172 30,940
1914 32,012 2,833 5,749 34 1,773 2,284 793 45,300 11,328 2,276 31,896- 1915 33,145 2,954 5,183 64 1,634 2,341 817 46,741 11,915 2,426 32.400
1916 37,020 3,121 5,795 78 1,764 2,735 898 51,411 13,365 2,799 35,247- 1917 40,153 3,278 6,438 114 1,993 3,234 982 56,211 14,620 3,188 38,403
1918 44,577 3,349 7,862 153 2,548 5,164 1,132 64,785 16.235 3,650 44,900
1919 50,379 3,808 8,319 236 3,289 5,273 1,268 72,573 18,619 4,268 49,6861920 54,815 4,395 8,015 304 3,595 6,087 1,317 78.787 20.892 4,989 52,9061921 52,877 5.139 5,784 403 3,500 3,822 1,272 72,798 20,493 3,382 46,9231922 43,053 4,925 4,684 • 304 3,088 2,489 1,041 59,583 17,083 5,544 36,9561923 39,774 4,751 5,092 285 2,746 3,364 996 57,001 15,769 5,599 35,639
1924 38,876 4,738 4.837 363 2,817 3,598 982 56,211 15,316 5,619 35.2761925 37,779 4,707 4,858 361 2,692 3,824 964 55,186 14,799 3,606 34,7811926 36,836 4.719 5,239 350 2,649 3,603 950 34,345 14,549 5,629 34,1671927 35,056* 4,731* 5,269* 349 2,460 3,167 908* 31,938* 14,004* 5,655 32,279*1928 34,217w 4.750* 5,770" 344 2,242 3,426 903* 51,652" 13,767* 5,724" 32,161*
s Based upon Census of Agriculture and reports of U. S. Department of Agriculture.b Fractional value of automobiles assumed to be devoted to business purposes is 0.3.* Preliminary estimate.
phenomenon had passed into history. The total value of farm landin the United States was still declining in 1928, even though theworst of the price inflation was over before 1921 had ended.
The estimates in Table XCIV of the total value of buildings,tools and implements, crops on hand, and miscellaneous property,are not sufficiently accurate to be worthy of much consideration,
FACTS BEARING ON AGRICULTURAL INCOME 301
even though they have been computed as carefully as the data onhand permit. The figures on livestock, however, are reasonablydependable. It will be observed that the nominal value of livestockincreased tremendously between 1912 and 1919, when the peak wasreached. The precipitous decline beginning in 1920 brought thetotal value in 1922 almost back to the level of 1909. While theaggregate value of livestock increased somewhat between 1923 and1928, the total nominal value in 1928 was still no greater than in1914:
The reader's attention is called to the fact that the estimatedvalue of automobiles, as here given, refers not to the total value ofautomobiles on farms, but merely to that fraction of the total valueestimated to represent the percentage of automobile use devoted tobusiness purposes. Examination of the next to the last column inthe table shows that, while the total value of farm property rosebetween 1909 and 1920 and then declined sharply until 1922, afterwhich it tended slightly downward, the equity of non-agriculturalcreditors in the owned farms steadily rose, this type of partialownership being three times as extensive in 1928 as in 1909. Itappears, then, that the burden of debt owed by farmers to non-farmers has, in recent years, been growing larger, while values offarm property have been shrinking. Column K indicates that, as anet result, that part of the property of farmers devoted to agriculturehad a value in gold dollars approximately the same in 1928 as in1912, despite the fact that the gold dollar would buy so much lessof everything in the later years.
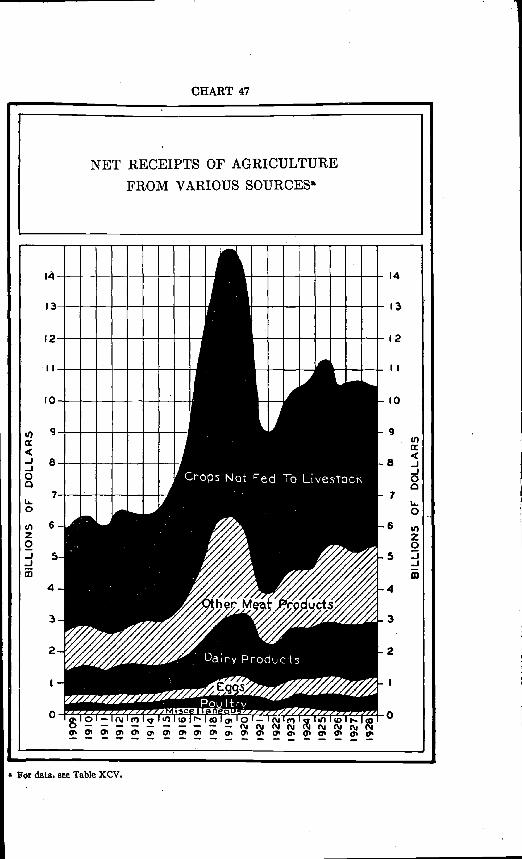
Sources of Agricultural Income.Table XCV and Chart 47 deal with the net receipts in terms of
gold dollars, of the agricultural industry derived from each of anumber of sources; For this reason, year to year comparisons arenot particularly significant. Receipts from crops constitute slightlymore than half of the total value of farm produce, and this propor-tion has changed but little during the period covered by this study.The value of dairy products makes up slightly more than one-eighth of the net value of all farm produce, while meat animalsaccount for something more than one-fifth, and eggs and poultryfor another one-eleventh. These proportions did not change radi-cally between 1909 and 1928.
The graphs in Chart 47 bring out clearly the enormous growth

302 THE NATIONAL INCOME
TABLE XCV
NETb RECEIPTS OF AGRICULTURE FROM VARIOUS(MILLIONS OF CURRENT DOLLARS)
YEAR
TotalNetRe-
ceipts
CROPSN
FED TOLiv
DPROD- EGGS
Pour4-TRY
•
Oi'aEnMEATPROD-UCTS
WOOLANDMo-HAIR
H
w
SOLD FOBURBAN USE
br-ses,
MUleS
DairyCows
Land
19091910191119121913
19141915191619171918
19191920192119221923
19241925192619271928
$ 6,0496,3415,9466,4796,388
6,3936,8048,046
11,02613,473
14,88914,0429,0989,264
10,350
10,52711,28010,498*10,642*10,519*
$3,3543,4883,3133,6933,431
3,4073,7894,5536,5647,501
8,5448,2155,151
5,2625,749
3,8946,0395,077*5,491*5,124*
$ 771830792850853
848864960
1,282
1,633
1,8891,968
1,350
1,2761,555
1,543
1,6671,6811,700*1,753*
$292319293316298
303338367310516
635632487457566
339605563*527*553*
$192210193198214
219209238272337
392409349331395
426432488424*455*
$1,2911,3471,2241,2831,450
1,4511,3941,715
2,3543,262
3,2212,618
1,598
1,7841,858
1,9142,335
2,4972,3322,438*
$6661515245
455645
110140
124903963
89
931049592
114
$ 66777
7779
12
142213
11
11.
121212*12*12*
$3842434242
721121168041
3121
13
13
12
11
11
101113
$3838313847
4236464430
38679867
115
947575*53*48*
a Based upon Census of Agriculture and reports of U. S. Department of Agriculture.b Crops fed to livestock are excluded, thus giving a total very different from the gross value of products.* Preliminary estimate.
occurring between 1914 and 1919, in the nominal agricultural in-come. When we see how striking this increase was, we can readilyunderstand how it happened that, during the period mentioned,most farmers had visions of a constantly accelerating demand fortheir products, and also why it was that farm land skyrocketed invalue during these five years. The terrific debacle of 1920 and 1921is also vividly portrayed.
NET RECEIPTS OF AGRICULTUREFROM VARIOUS SOURCESa
Crops Not To Livestock
Dary Products

304 THE NATIONAL INCOME
Payments by Agriculture to Other Industries.Table XCVI' indicates the approximate amounts of business-
expense money paid out by agriculture to other industries. In thistable, as in the one preceding, all amounts are entered in terms ofdollars current in the given year, and hence the comparisons of onedate with another are not of prime significance. It will be observedthat the owners of leased farms and the holders of mortgages onfarms are treated as investors in the agricultural industry, theresult being that payments to these classes are not counted in thelist of business expenses appearing in Table XCVI. Similarly,amounts paid in the form of. wages and salaries to employees en-gaged in agriculture are not listed in this table, for payments toemployees are not deductions from the income of the industry.
None of the quantities appearing in Table XCVI can be com-puted with any high degree of precision. In general, however, itappears that, at the close of the period, out of the 11 billions ofdollars, representing the total net receipts of farmers, landlords,and mortgage holders combined, between 2 and billions had tobe paid out to other industries for their. contributions to agriculture.
Total Realized Income of Agriculture.When totalS payments to other industries have been subtracted
from the net receipts accruing to the agricultural industry, thefigures entered in Column C of Table XCVII are obtained. Thesefigures show 'the realized income of agriculture in terms of golddollars. By subtracting from the items in this column .the amountpaid to employees in wages and salaries, we arrive at the figures inColumn E which represent the aggregate income of landlords,holders of farm mortgages, and farmers and their families. Thefigures in the last two columns show that the combined nominalincome of agricultural employees and of the entrepreneurs and in-vestors in the industry reached a peak in either 1919 or 1920, de-clined until 1921, and, then, has moved upward.
Realized Inôome of Entrepreneurs and Other Property Owners.Table XCVIII pictures the total realized income of mortgage
hulders, landlords, and agricultural entrepreneurs after it has been'The reader who is interested in a more detailed discussion of the way in which the
figures in Tables xcv and XCVI have been derived is referred to Income in the UnitedStates Volume II, Chapter III, and Income in the Various States, Chapters VII, VIII,and i5c. Both of these books are publications of the National Bureau of EconomicResearch.

FACTS BEARING ON AGRICULTURAL INCOME 305
TABLE XCVI
PAYMENTS FOR BUSINESS PURPOSESMADE BY AGRICULTURE TO OTHER INDUSTRIESa
(MILLIONS OF CURRENT DOLLARS)
InterestPay-
Tools Busi- Har- nessTotal and . ness ness Build- men s
Cotton Horse-Fertili- Binder . to . Spray—Pay- Im- Use of and ings Feed Taxes Gin- . shoe-zer Twine Banks . ingmentS pie- Auto- Sad- Includ- ning ing
ments mobiles dies ing In. anMet-surance chants
19C9 $1,147 $177 $115 $ 24 $17 $58 8107 $307 $166 $ 74 $46 $26 $321910 1,214 223 135 31 16 56 120 282 180 77 36 26 321911 1,225 196 160 37 13 56 126 269 185 80 41 30 331912 1,281 184 147 55 17 57 135 312 174 83 53 31 341913 1,354 229 161 68 23 57 143 283 195 85 46 28 36
1914 1,411 i98 188 73 21 57 146 333 196 87 50 27 35
1915
1916
1917
1918
1919
1920
1921
1922
1923
1924
192S
1926
1927
1928
1,419
1,524
1,951
2,384
2,837
3,143
23072,133
2,485
2,364
2,352
2,446*
2,432*2,572*
173
219
287
363
456
527
255
251
378
337
403
443
479487*
160
162
221
293
326
379
206
198
230
231
257
282
206
93
145
187
201
298
431
330
355
428
316
383
379
362
403
28
25
44
63
49
42
27
29
25
30
30
31
27
29
57
59
76
82
95
73
34
42
49
41
35
33
3237*
150
159
171
172
210
233
276
240
236
236
120
140*
125*
jj5*
346
318
442
581
633
568
341
367
462
499
461
452*
570*
615*
196214256
340
430
503
479
321
355
357
327
327*
278*
909399
109
133
166
194
184
175
175
172171*
171*
625562
68
82
87
74
62
61
63
85
104
101
293556
50
58
58
43
37
36
30
30
363950
61
67
77
47
46
50
49
48
Based upon Census of AgricuUure and reports of U. S. Department of Agriculture. Payments tolandlords and mortgage holders are not included here, for these payments are considered part of income ofthe agricultural industry.
* Preliminary estimate.
divided into three shares: namely, the interest paid to mortgageholders, the rent paid to landlords, and the amount remaining,which is the realized income of farmers and their families. It shouldbe kept in mind that the figures in Column B, representing as theydo realized income, take no cognizance of the sweeping changes inthe value of farm property which have occurred during this period.
The share of the owners of leased farms has grown much lessrapidly than has the share of the mortgage holders. When bothamounts are expressed in terms of the dollars current at the various

306 THE NATIONAL INCOME
TABLE XCVII
REALIZED INCOME OF THE AGRICULTURAL INDUSTRYa(MaLI0NS OF CURRENT DOLLARS)
Year Receipts bPaymentsto Other
Industrieso
RealizedAgricultural
Income
Wagesand
Sal ariesd
19091910191119121913
A-B
$6,0496,3415,9466,4796,388
Income ofEntrepre-neurs and
of Propertye
C-D
$1,1471,2141,2251,2811,354
$$4,9025,1274,7225,1985,034
19141915191619171918
717715751754776
6,3936,8048,046
11,02613,473
$4,1854,4133,9714,4444,258
1,4111,4191,5241,9512,384
4,9825,3856,5239,074
11,089
19191920192119221923
756773828
1,0291,213
14,88914,0429,0989,264
10,350
4,2264,6125,6948,0459,876
2,8373,1432,3072,1332,485
12,05110,8996,7917,1327,864
19241925192619271928
1,4911,6631,4051,2031,231
10,52711,28010,498*10,642*10,519*
10,5619,2363,3865,9286,633
2,3642,3522,446*2,432 *2,572*
8,1638,9298,052*
7,947*
1,2321,2531,2721,252*1,279*
6,9317,6766,779*6,958*6,668*
received by mortgage holders and rent received by landlords.Includes interestb Table XCV.o See Table XCVI.
1 See Table XIX.• Exclusive of imputed rent on owned homes.* Preliminary estimate.
dates, we see that the rent of leased farms increased by about 60per cent between 1909 and 1927, while, during the same period,payments of interest to non-farm mortgage holders practicallytrebled. The realized income of farmers, also expressed in golddollars, rose by about 65 per cent, a fraction slightly greater thanthe increase in rent accruing to landlords. Apparently farmers tendto receive something less than 6 per cent of their entire realizedincome from sources other than agriculture. This percentage has
BEARING 3O?
not changed radically between 1909 and 1927 except during the upsand downs of inflation and deflation, when it oscillated decidedly.
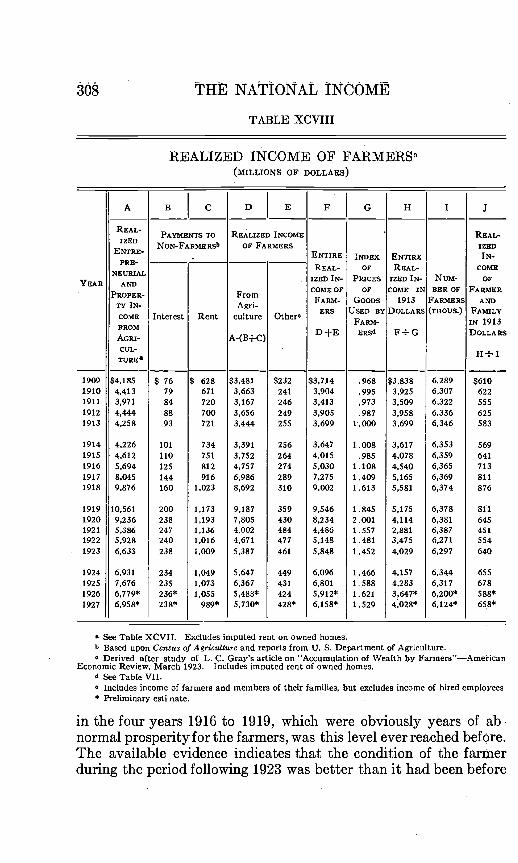
Entire Realized Income of Farmers (1913The figures in Column F of Table XCVIII have been divided
by indices of the prices of the direct or consumers' goods used byfarmers and the results are shown in Column H. The fact should becarefully noted that the index appearing in Column G representsthe price of consumers' goods only, and hence is very different fromthe index compiled by the United States Bureau of AgriculturalEconomics showing the prices of• all goods bought by farmers.The index in Table XC VIII includes the prices of goods produced onthe farm and also consumed there, as well as the prices of goods pur-chased by the farmer for the direct use of himself or his family,but not the prices of goods bought for business purposes.
When all quantities are expressed in dollars of constant purchas-ing power, the income of all farmers was roughly stationary between1909 and 1915, then rose sharply until 1918, declined somewhat in1919, fell off rapidly in 1920, and tumbled precipitously in 1921.The much heralded prosperity of the farmer in 1918 and his povertyin 1921, were, then, no mere figments of the imagination, for thetotal income of all farmers in 1921 would buy but slightly morethan half as many direct goods as would their income in 1918.The purchasing power of the income of all farmers taken as a unitincreased regularly each year from 1921 until 1927 with a slightdecline in 1926. By 1923, it approximately equalled the figure for1915 which was considered a good year for agriculture. The incomein 1925 was about half way between the income of 1915 and that of1916, in both of which years the farmers were sharing in the pros-perity brought on by European war orders.
Income per Farmer (1913 Dollars).Column J represents an estimate of the average realized in-
come, in terms of 1913 dollars, per farm family. The figures in thiscolumn show that the income per farm family remained betweenthe limits of $550 and $625 during the entire period 1909 to 1914,then rose steadily to a sum of $876 in 1918, after which it fellabruptly to $451 in 1921. The recovery after 1921 was steady until$658 was attained in 1927 except for a slight decline in 1926. Thisaverage was materially higher than the average for 1915, the yearwhich, up to that time, was the best in the period recorded. Only
NATIONAL INOOME
TABLE XCVIII
REALIZED INCOME OF(MILLIONS OF DOLLARS)
A B C D E F G H I S
REAL-PAYMENTS TO REALIZED INCOME REAl.-
IZEDOF FARMERS IZED
ENTRE- 1?INDEX ENTIRE IN-
PRE-REAL- OF REAL- COME
NEURIAL
YEAR ANDIZED IN- PRICES IZED IN- Nw1i- OF
COME OF OP COME IN BElt OP FARMERPROPER- From
T AFARM- GOODS 1913 FARMERS AND
TV iN- ngrlERS USED BY DOLLARS (THOUS.) FnULY
COME Interest Rent culture OtheroFARM- IN 1913
PROM
AGRI- A-(B+C)D +E ERSd G DOLLARS
CUL-
TUBE6
1909 $4,185 $ 76 $ 628 $3,481 $232 $3,714 .968 $3,838 6,289 $6101910 4,413 79 671 3,663 241 3,904 .995 3,925 6,301 6221911 3,971 84 720 3,167 246 3,413 .973 3,509 6,322 5551912 4,444 88 700 3,656 249 3,905 .987 3,958 6,336 6251913 4,258 93 721 3,444 255 3,699 1.000 3,699 6,346 583
1914 4,226 101 734 3,391 256 3,647 1.008 3,617 6,353 5691915 4,612 110 751 3,752 264 4,015 .985 4,078 6,359 6411916 5,694 125 812 4,757 274 5,030 1.108 4,540 6,365 7131917 8,045 144 916 6,986 289 7,275 1.409 5,165 6,369 8111918 9,876 160 1,023 8,692 310 9,002 1.613 5,581 6,374 876
1919 10,561 200 1,173 9,187 359 9,546 1.845 5,175 6,378 8111920 9,236 238 1,193 7,805 430 8,234 2.001 4,114 6,381 6451921 5,336 247 1,136 4,002 484 4,486 1.557 2.881 6,387 4511922 5,928 240 1,016 4,671 477 5,148 1.481 3,475 6,271 5541923 6,633 238 1,009 5,387 461 5,848 1.452 4,029 6,297 640
1924 6,931 234 1,049 5,647 449 6,096 1.466 4,157 6,344 6551925 7,676 235 1,073 6,367 431 6,801 1.588 4,283 6,317 6781926 6,779' 236* 1,055 5,488' 424 5,912' 1.621 3,647' 6,200' 588'1927 6,958' 238* 989* 5,730' 428' 6,158* 1.529 4,028' 6,124' 658'
See Table XCVII. Excludes imputed rent on owned hrnnes.b Based upon Census of Agriculture and reports from U. S. Department of Agriculture.a Derived after study of L. C. Gray's article on "Accumulation of Wealth by Farmers"—American
Economic Review, March 1923. Includes imputed rent of owned homes.€1 See Table VII.
Includes income of farmers and members of their families, but excludes income of hired employees* Preliminary esti.nate.
in the four years 1916 to 1019, which were obviously years of abnormal prosperity for the farmers, was this level ever reached before.The available evidence indicates that the condition of the farmerduring the period following 1923 was better than it had been before
FACTS BEARING ON AGRICULTURAL INCOME 309
the World War. Farm incomes in terms of dollars were still verylow as compared to those in the city, but this was true in pre-waras well as in post-war days. There seems, then, to be no groundfor the frequently repeated assertion that, in recent years, the con-dition of the farmer has been absolutely worse than it was before1914, but it is true that he has failed to obtain his proportion ofthe remarkable increase in income characterizing the period begin-ning with 1923.
Changes in the Real Value of Farm Property.As previously stated, the figures in Table XCVIII fail to make
allowance for the changes in property value which have occurred•during the period in question. These variations in the value of thefarmer's wealth have been so tremendous that, when they are takeninto consideration, a very different picture is given of the year-to-year changes which have taken place in the income of the farmers ofthe nation. As in the other studies of property values previouslynoted in this report, all quantities at all dates have been expressedin terms of command over consumers' goods—that is, the changesin value of property, when measured, in terms of 1913 dollars, rep-resent the changes in the amount of direct goods which could havebeen obtained for the amount of money represented by the value ofthe property at the various dates.
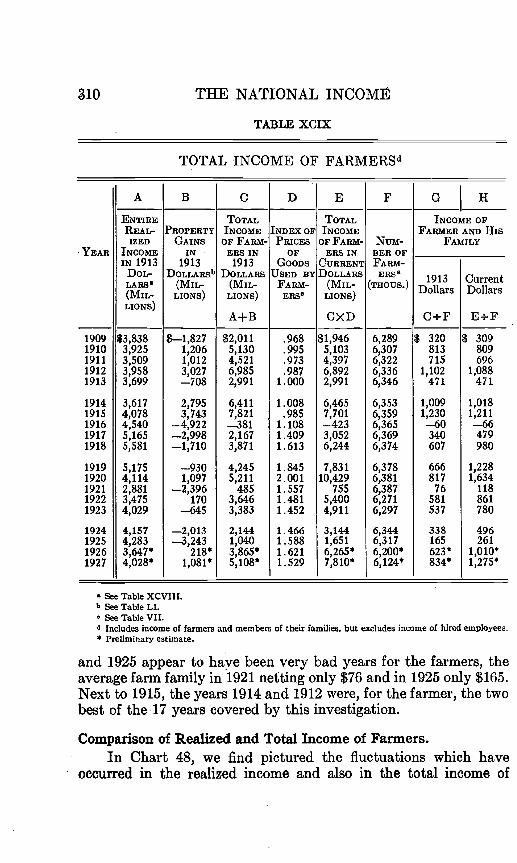
Column B of Table XCIX shows the tremendous amplitudeof the fluctuations in the value of farm property. In 1915, the in-crease in value amounted to 3 3% billions, while, in 1916, the totalvalue of farm property fell off by nearly 5 billions.' The value offarm property declined in 10 years and increased in oniy 7 of theyears in this period. Furthermore, in the 17 years covered, thegains aggregated oniy about 13 billions and the losses about 21billions. The farmer, therefore, had to deduct from his realizedincome approximately 8 billions of dollars in order to arrive at hisactual total income. When the deductions for the years of heavylosses are made, we find that, in 1916, the farmers actually had anegative total income, for, while the value of farm property wasincreasing, it was increasing so much more slowly than the valueof consumers' goods that the loss in purchasing power exceededrealized income. Column G of Table XCIX shows that, whenchanges in property values are taken into account, the aveiageincome of the fatmer and his family varied from a $60 deficit in1916. to a net income of $1,230 in 1915. On. this. basis, both. .1.921
310 THE NATIONAL INCOME
TABLE XCIX
TOTAL INCOME OF FARMERSd
YEAR
A B C D E F G II
ENTIREREAL-flED
INCOMEIN 1913
DoL-LABS5(Ma-LIONS)
PROPERTYGAINS
IN1913
DOLLARSb
LIONS)
TOTALINCOME
OF FARM-ERS IN
1913DOLLARS
(MIL-LIONS)
A+B
INDEX OFPRICES
OFGOODS
USED BYFARM-ERS°
TOTALINCOME
OF FARM-ERS IN
CURRENTDOLLARS
(Ma-LIONS)
CXD
BER OFFARM-ERSR
(mous.)
INCOME OFFARMER AND His
FAMILY
1913Dollars
C+F
CurrentDollars
E÷F
19091910191119121913
19141915191619171918
19191920192119221923
1924192519261927
$3,8383,9253,5093,9383,699
3,6174,0784,5405,1655,581
5,1754,1142,8813,4754,029
4,1574,2833,647*4,028*
$—1,8271,2061,0123,027—708
2,7953,743
—4,922—2,998—1,710
—9301,097
—2,396170
—645
—2,013—3,243
218*1,081*
$2,0115,1304,5216,9852,991
6,4117,821—3812,1673,871
4,2455,211
4853,6463,383
2,1441,0403,865*5,108*
.968
.995
.973
.9871.000
1.008.985
1.1081.4091.613
.1.8452.0011.5571.4811.452
1.4661.3881.6211.529
$1,9463,1034,3976,8922,991
6,4657,701—4233,0326,244
7,83110,429
7555,4004,911
3,1441,6516,265*7,810*
6,2896,3076,3226,3366,346
63536:35963636:3696,374
6,3786,3816,3876,2716,297
6,3446,3176,200*6,124*
$ 320813715
1,102471
1,0091,230—60340607
666817
76581337
338165623*834*
$ 309809696
1,088471
1,0181,211—66479980
1,2281,634
118861780
496261
1,010*1,275*
S See Table XCVIII.b See Table LI.o See Table VII.d Includes income of farmers and members of their families, but excludes income of hired employees.* Preliminary estimate.
and 1925 appear to have been very bad years for the farmers, theaverage farm family in 1921 netting only $76 and in 1925 only $165.Next to 1915, the years 1914 and 1912 were, for the farmer, the twobest of the 17 years covered by this investigation.
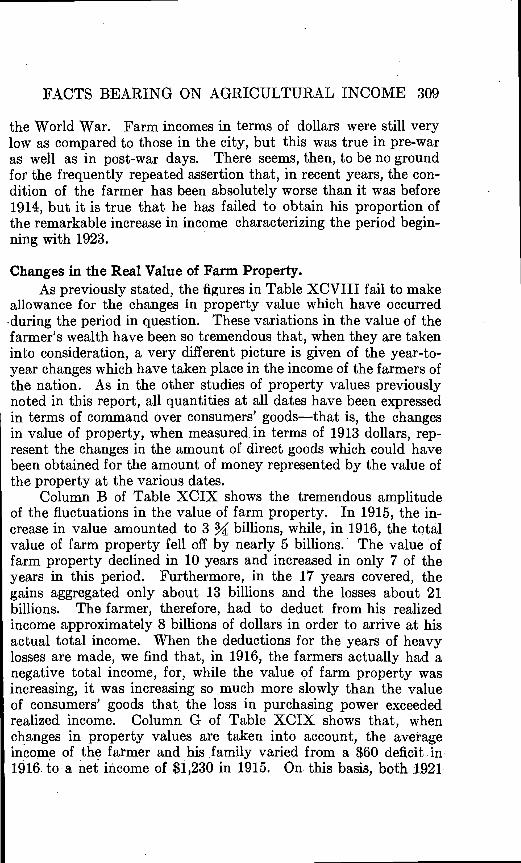
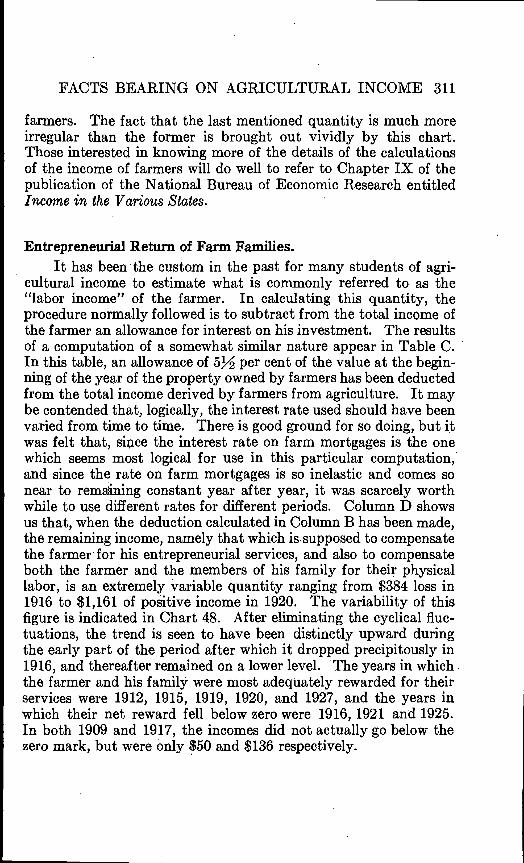
Comparison of Realized and Total Income of Farmers.In Chart 48, we find pictured the fluctuations which have
occurred in the realized income and also in the total income of
FACTS BEARING ON AGRICULTURAL INCOME 311
farmers. The fact that the last mentioned quantity is much moreirregular than the former is brought out vividly by this chart.Those interested in knowing more of the details of the calculationsof the income of farmers will do well to refer to Chapter IX of thepublication of the National Bureau of Economic Research entitledIncome in the Various States.
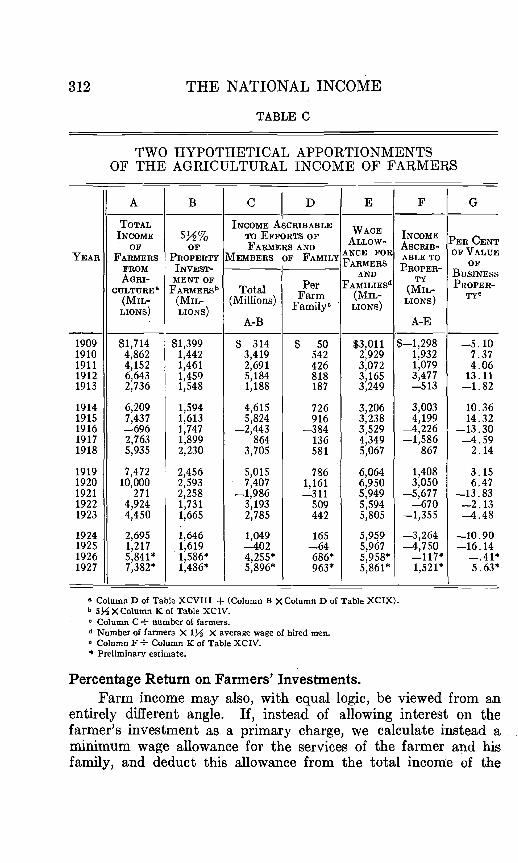
Entrepreneurial Return of Farm Families.It has been the custom in the past for many students of agri-
cultural income to estimate what is commonly referred to as the"labor income" of the farmer. In calculating this quantity, theprocedure normally followed is to subtract from the total income ofthe farmer an allowance for interest on his investment. The resultsof a computation of a somewhat similar nature appear in Table C.In this table, an allowance of per cent of the value at the begin-fling of the year of the property owned by farmers has been deductedfrom the total income derived by farmers from agriculture. It maybe contended that, logically, the interest rate used should have beenvaried from time to time. There is good ground for so doing, but itwas felt that, since the interest rate on farm mortgages is the onewhich seems most logical for use in this particular computation,and since the rate on farm mortgages is so inelastic and comes sonear to remaithng constant year after year, it was scarcely worthwhile to use different rates for different periods. COlumn D showsus that, when the deduction calculated in Column B has been made,the remaining income, namely that which issupposed to compensatethe farmer for his entrepreneurial services, and also to compensateboth the farmer and the members of his family for their physicallabor, is an extremely variable quantity ranging from $384 loss in1916 to $1,161 of positive income in 1920. The variability of thisfigure is indicated in Chart 48. After eliminating the cyclical fluc-tuations, the trend is seen to have been distinctly upward duringthe early part of the period after which it dropped precipitously in1916, and thereafter remained on a lower level. The years in whichthe farmer and his family were most adequately rewarded for theirservices were 1912, 1915, 1919, 1920, and 1927, and the years inwhich their net reward fell below zero were 1916, 1921 and 1925.In both 1909 and 1917, the incomes did not actually go below thezero mark, but were only $50 and $136 respectively.
312 THE NATIONAL INCOME
TABLE C
TWO HYPOTHETICAL APPORTIONMENTSOF THE AGRICULTURAL INCOME OF FARMERS
A B C D E F G
TOTAL INCOME ASCRIBABLEWAGE
INCOME 534% 'ro EFFORTS OF ALLOW-INCOME
OF OF FARMERS AND ASCRIB- PER CENTANCE FOR OF VALUE
YEAR FARMERS PROPERTY MEMBERS OF FAMILYFARMERS
ABLE TOFROM INVEST- I PROPER- OF
AtaRI- MENT OFAND BUSINESS
TYPROPER-CULTUREt FARMERSb Total Per FAMILIESd
(Mm—Farm (MIL-LIONS)
TY°(Mllr (Ma- (Millions) Familyc LIONS)LIONS) LIONS)A-B A-E
1909 $1,714 $1,399 $ 314 $ 50 $3,011 $—1,298 —5.101910 4,862 1,442 3,419 542 2,929 1,932 7.371911 4,152 1,461 2,691 426 3,072 1,079 4.061912 6,643 1,459 5,184 818 3,165 3,477 13.111913 2,736 1,548 1,188 187 3,249 —513 —1.82
1914 6,209 1,594 4,615 726 3,206 3,003 10.36191.5 7,437 1,613 5,824 916 3,238 4,199 14.321916 —696 1,747 —2,443 —384 3,529 —4,226 —13.301917 2,763 1,899 864 136 4,349 —1,586 —4.591918 5,935 2,230 3,705 581 5,067 867 2.14
1919 7,472 2,456 5,015 786 6,064 1,408 3.151920 10,000 2,593 7,407 1,161 6,950 3,050 6.471921 271 2,258 —1,986 —311 5,949 —5,677 —13.831922 4,924 1,731 3,193 509 5,594 —670 —2.131923 4,450 1,665 2,785 442 5,805 —1,355 —4.48
1924 2,695 1,646 1,049 165 5,959 —3,264 —10.901925 1,217 1,619 —402 —64 5,967 —4,750 —16.141926 5,841* 1,586* 4,255* 686* 5,958*1927 7,382* 1,486* 5,896* 963* 5,861* 1,521* 5.63*
Column D of Table XCVIII + (Column B )(Column D of Table XCIX).b 534 XColumn K of Table XCIV.o Column C ÷ number of farmers.d Number of farmers X 134 )< average wage of hired men.o Column F ÷ Column K of Table XCIV.* Preliminary estimate.
Percentage Return on Farmers' Investments.Farm income may also, with equal logic, be viewed from an
entirely different angle. If, instead of allowing interest on thefarmer's investment as a primary charge, we calculate insteadminimum wage allowance for the services of the farmer and hisfamily, and deduct this allowance from the total income of the

REALIZED INCOME, TOTAL INCOME,AND HYPOTHETICAL WAGE
PER FARMER AND HIS FAMILYa
Income

314 THE NATIONAL INCOME
farmers, we shall have an estimate of the amount of income ascrib-able to farm property. By dividing this remaining income by thevalue of the property at the beginning of the year, we can ascertainthe farmer's rate of return on his investment. In Column E ofTable C, we have calculated the wage allowance for the farmers byassuming that the services of the farmer and his family togethershould be worth times the wage of a hired man, an allowancewhich certainly seems low enough. On this basis, it appears fromthe figures in Column G that, in 9 years out of the 17, the returnon the farmer's investment was less than nothing, the highest netloss being more than 16 per cent in 1925, with losses of 13 per centin both 1916 and 1921, and 11 per cent in 1924. The maximumgain, which occurred in 1915, amounted to 14 per cent. Gains of10 per cent in 1914, and 13 per cent in 1912, were also recorded.When the percentages for the 19 years are added algebraically, wefind that the aggregate of losses exceeds the aggregate of gains, thesum showing an average annual net loss on the farmers' investmentof about 0.3 per cent.