xerox 2019 investor day presentation · 2019-02-06 · xerox 2019 investor day this presentation,...
TRANSCRIPT

Xerox 2019 Investor Day

This presentation, and other written or oral statements made from time to time by management contain “forward-looking statements” as defined in thePrivate Securities Litigation Reform Act of 1995. The words “anticipate”, “believe”, “estimate”, “expect”, “intend”, “will”, “should” and similar expressions, as they relate to us, are intended to identify forward-looking statements. These statements reflect management’s current beliefs, assumptions and expectations and are subject to a number of factors that may cause actual results to differ materially. Such factors include but are not limited to: our ability to address our business challenges in order to reverse revenue declines, reduce costs and increase productivity so that we can invest in and grow our business; changes in economic and political conditions, trade protection measures, licensing requirements and tax laws in the United States and in the foreign countries in which we do business; changes in foreign currency exchange rates; our ability to successfully develop new products, technologies and service offerings and to protect our intellectual property rights; the risk that multi-year contracts with governmental entities could be terminated prior to the end of the contract term and that civil or criminal penalties and administrative sanctions could be imposed on us if we fail to comply with the terms of such contracts and applicable law; the risk that partners, subcontractors and software vendors will not perform in a timely, quality manner; actions of competitors and our ability to promptly and effectively react to changing technologies and customer expectations; our ability to obtain adequate pricing for our products and services and to maintain and improve cost efficiency of operations, including savings from restructuring actions; the risk that individually identifiable information of customers, clients and employees could be inadvertently disclosed or disclosed as a result of a breach of our security systems; reliance on third parties, including subcontractors, for manufacturing of products and provision of services; our ability to manage changes in the printing environment and expand equipment placements; interest rates, cost of borrowing and access to credit markets; funding requirements associated with our employee pension and retiree health benefit plans; the risk that our operations and products may not comply with applicable worldwide regulatory requirements, particularly environmental regulations and directives and anti-corruption laws; the outcome of litigation and regulatory proceedings to which we may be a party; any potential termination or restructuring of our relationship with FUJIFILM Holdings Corporation ("Fujifilm"); and other factors that are set forth in the “Risk Factors” section, the “Legal Proceedings” section, the “Management’s Discussion and Analysis of Financial Condition and Results of Operations” section and other sections of our 2017 Annual Report on Form 10-K, as well as our Quarterly Reports on Form 10-Q and Current Reports on Form 8-K filed with the SEC. Xerox assumes no obligation to update any forward looking statements as a result of new information or future events or developments, except as required by law.
Forward-Looking Statements
2

Strategic OverviewJohn Visentin I Vice Chairman & CEO

4
What You Will Hear Today
3How we plan to stabilize and grow revenue in newand existing markets
2
How we expect our transformation to impact our financial results over the next three years
1 Strategic overview and transformation roadmap
4
How we are improving operational efficiency to grow our bottom line while reinvesting in our business
5
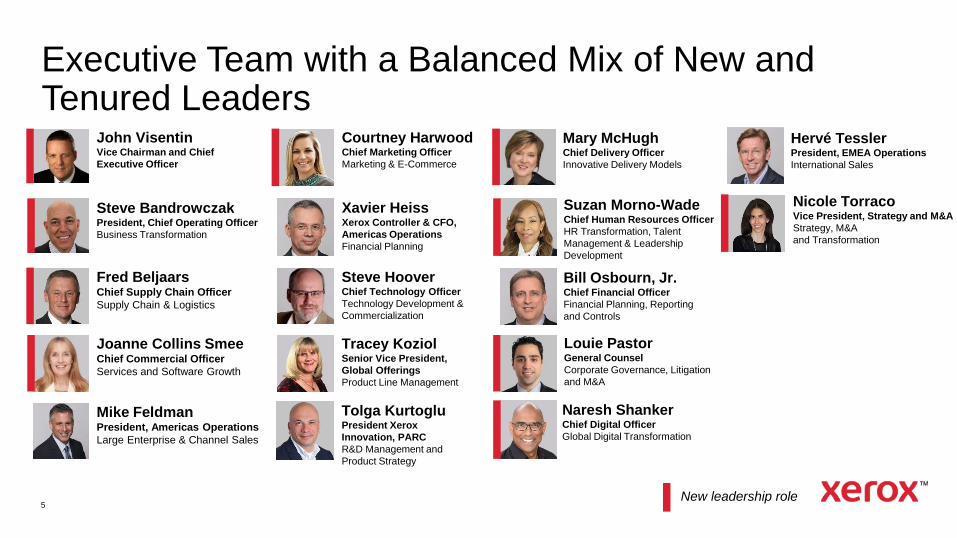
Executive Team with a Balanced Mix of New and Tenured Leaders
New leadership role
Steve BandrowczakPresident, Chief Operating Officer
Business Transformation
John VisentinVice Chairman and Chief
Executive Officer
Joanne Collins SmeeChief Commercial Officer
Services and Software Growth
Courtney HarwoodChief Marketing Officer
Marketing & E-Commerce
Tracey KoziolSenior Vice President,
Global Offerings
Product Line Management
Naresh ShankerChief Digital Officer
Global Digital Transformation
Mike FeldmanPresident, Americas Operations
Large Enterprise & Channel Sales
Tolga KurtogluPresident Xerox
Innovation, PARC
R&D Management and
Product Strategy
Steve HooverChief Technology Officer
Technology Development &
Commercialization
Bill Osbourn, Jr.Chief Financial Officer
Financial Planning, Reporting
and Controls
Fred BeljaarsChief Supply Chain Officer
Supply Chain & Logistics
Xavier HeissXerox Controller & CFO,
Americas Operations
Financial Planning
Hervé TesslerPresident, EMEA Operations
International Sales
Mary McHughChief Delivery Officer
Innovative Delivery Models
Nicole TorracoVice President, Strategy and M&A
Strategy, M&A
and Transformation
Suzan Morno-WadeChief Human Resources Officer
HR Transformation, Talent
Management & Leadership
Development
Louie PastorGeneral Counsel
Corporate Governance, Litigation
and M&A

6
Strategic Initiatives to Position Xerox for Success
Optimize Operations
Drive Revenue
Focus on Cash Flow
Re-energize
Innovation
SHAREHOLDER
VALUE
• Flatten organization for better accountability
and ownership
• Leverage our growing customer base to deliver
end-to-end solutions
• Invest in emerging technologies with attractive
addressable markets
• Expand earnings and cash flow generation

7
Opportunities to Expand Our Market by $54B*
Managed Services,
▲ 3%$27B
A3 Multifunction Printers,
▼ 6%$19B
High-end / Production,
Flat, (Color ▲2%, Mono
▼12%)$7B
A4 Multifunction Printers,
▲2%$14B
Core
Market Size$67B
Software,
▲6%$6B
Digital Services,
▲ 7%$25B
Adjacent
Market Size$31B
AI Workflow Assistants,
▲ 45%$2B
IoT Sensors & Services,
▲ 9%$8B
New
Market Size$23B
3D,
▲ 25%$8B
Digital Packaging,
▲ 11% $5B
▲Note: 2018 Market sizes (Core & Digital Services are Xerox Corp territory, all others are Worldwide), CAGRS are 2018-2020 and are based on Xerox analysis of market data sources.
*See “Forward-Looking Statements” at the front of this document.
Market CAGR (2018-2020)

8
Diverse Customer Base to Grow Core Business and Expand into Adjacent and New Solutions
10/10 Top Global
Banks
8/10 Top Telecom
Companies
10/10Top Payers and
Providers
7/10 Top Largest
Auto & Truck
Manufacturers
50State
Governments
10/10 Largest
Universities
Enterprise SMB70% 30%Channel
MixDirect Indirect70% 30%Direct / Enterprise 41% Indirect Channels 37%XBS 22%

9
2018
Simplify
2019
Transform Portfolio
& Accelerate Sales*
2020
Stabilize*
2021
Road to Growth*
Revenue
Adj1 EPS
Revenue (CC1) (4.9)% CC Down ~5% Down ~3% Target at least flat revenue by 2021
Adj1 Operating
Margin11.6% 12.6% to 13.1% Up > 50 bps Up > 50 bps
Adj1 EPS $3.46 $3.70 to $3.80 $4.00+ Target 7%+ annual growth
FCF1 $1.05B $1.0 to $1.1B $1.1B+ $1.1B+
1Adj measures: see Non-GAAP Financial Measures
Note: Revenue decline at actual currency: 2018 (4.2)%, and 2019 guidance ~(6)%; GAAP EPS: 2018 $1.38, and 2019 guidance $2.60 to $2.70;
Operating Cash Flow from Continuing Operations: 2018 $1.14B, and 2019 guidance $1.15B to $1.25B. It is not possible to provide GAAP measures and reconciliations
for years 2020 and 2021 without unreasonable effort.
*See “Forward-Looking Statements” at the front of this document.
Projected 3-Year Roadmap to Grow Top-line and Bottom-line*

10
Why Invest in Xerox
• Strong, sustainable cash generation, returning
over 50% to shareholders
• Simplifying business for sustainable operational
improvements with Project Own It
• Strong innovation capabilities to deploy into
adjacent and new markets
>$3B of Free Cash Flow1 projected over next 3 years*
>200 bps Adjusted1 Operating Margin expansion
projected over next 3 years, expected to drive at least
$4.00 Adjusted1 EPS by 2020*
Revenue trajectory set to improve annually. Flat to
growing revenue by 2021*.
• Laying the foundation to improve revenue
trajectory by leveraging new and existing
markets
R&D investments focused on innovation to increase 20%
in 2019*
• Earned the right with customer base to scale #1 market share in A3, Production and Managed Print
Services2
1Adj measures: see Non-GAAP Financial Measures
*See “Forward-Looking Statements” at the front of this document2Share data (CY2017, Worldwide) from IDC’s Worldwide and U.S. Managed Print and Document Services and Basic Print Services Market
Shares, 2017: Moving Downmarket, June 2018, IDC #US42612918; A3 and Production market shares (3QLTM 2018 equipment sales revenue,
Xerox Corp territory) are from Xerox analysis based on market sources

Culture of Continuous ImprovementSteve Bandrowczak
12
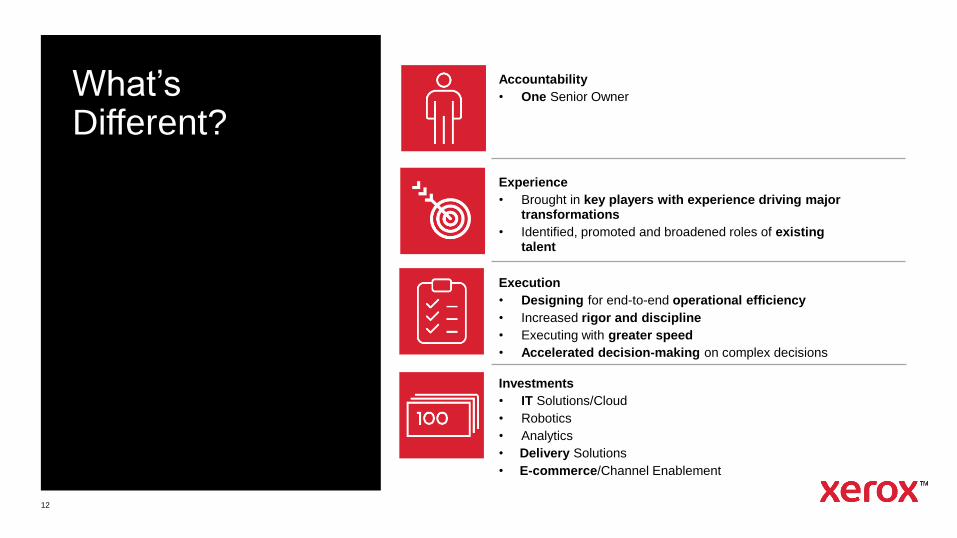
What’s Different?
Accountability
• One Senior Owner
Experience
• Brought in key players with experience driving major transformations
• Identified, promoted and broadened roles of existing talent
Execution
• Designing for end-to-end operational efficiency
• Increased rigor and discipline
• Executing with greater speed
• Accelerated decision-making on complex decisions
Investments
• IT Solutions/Cloud
• Robotics
• Analytics
• Delivery Solutions
• E-commerce/Channel Enablement

13
Customer BenefitsHow a more frictionless and high velocity business impacts customers
Ease of Doing Business
We aim to:
• Streamline the contracting
process
• Reduce SKUs
• Track & trace supply orders
• Use new tools to help customers
fix their issues faster themselves
• Leverage Automatic Meter Reads
and Supplies Replenishment
Better Information
We aim to:
• Improve inventory & supply visibility
• Have more accurate billing and flexibility
• Enable faster & more accurate customer
data retrieval through automation
• Have our machines send predictive fault
and consumables data to support
organization
Speed & Agility
We aim to:
• Increase speed of decision
making
• Reduce Order to Install times
• Leverage a single global delivery
model with common processes

14
Investing in Automation & Predictive Analytics
From To
• Limited, siloed robotic proof of concept programs
Minimal bots in production
Runs on desktops
Lift &Shift (automating existing inefficient processes)
Task oriented/Localized usage
• Analytics focused on data management and reporting
• Add 50 bots in production per month
Bots as “digital” employees (experts, can learn, specific skillsets)
Best-in-class partners engaged globally, cross-functionally and at scale
Runs in the cloud and deployed via self-service
• Advanced analytics
Digital Customer Engagement and Digital enablement of products
• Omni-Channel Customer Care Solutions
Chat • Video • IM
Targeting

15
Re-engineering to create a
more frictionless and
high velocity business.
Organiza-tion
Demand / Supply shaping process
Service Delivery
Produc-tivity
IT systems and tools
Top Line
Organization
• Intensity, speed and scale of transformation
• Decision making closer to customers - flatter,
more agile, faster to respond to customer needs
• Lean and Accountable
Demand/Supply Shaping Process
• Supplies and finished products supply chain
• Fuji Xerox relationship stable
• Right number of offerings at the right cost
Service Delivery
• Customer service excellence
• Order to install times
• Billing accuracy and flexibility
• End to end processes improve customer
experience and reduce cost
Productivity
• Simplify, Eliminate, Standardize
IT Systems and Tools
• Technology refresh
• Self-funding
• Automation & Analytics
Top Line
• Focus on driving the revenue engine
Transforming and Simplifying the Business

16
Project Own It Expected to Drive Gross Savings of at Least $640M in 2019*
Shared Services Centers
Partnering with Top Tier Provider
Optimize Workforce
Process Simplification
using Robotics & Automation
Procurement
Supplier Rationalization / Rate Reduction
Initiating Global Spend Control
Board
Reduce Gap to Indirect & Direct
Cost Benchmark
IT
Reduce Application
Portfolio ~50%
IT Investment Strategy
Organization Optimization
Drive Automation & Simplification
Terminate / Consolidate
Vendors
Delivery
Deal Governance
Enhanced Remote Solve &
Self Help
Establish Preferred Suppliers
Integrated Acct Management, Specialized
Hubs
Supply Chain
Supply Chain Logistics
SKU Simplification
Improve Inventory Controls
Real Estate
Performing Comprehensive Global Portfolio
Review
Reduce Global Footprint ~50%
Align Facilities Planning with Operational
Strategy
Org Design & Benefit Costs
Reduce Layers / Increase Spans /
Address Low Performers
Design Organization &
Operating Model to New Strategy
Harmonize Benefits and Reduce Cost
Enable Self-Service & Data Standardization
Target: $85-105M* Target: $140-160M* Target: $90-110M* Target: $140-$150M* Target: $20-30M* Target: $150-175M*Target: $15-25M*
Robotic Process Automation & Predictive Analytics
*See “Forward-Looking Statements” at the front of this document.

17
7 Key Drivers - Simplifying our Business
Procurement
IT
Supply Chain
Real Estate
Organization Design &
Benefit Costs
8,000+ suppliers ~3000 suppliers
Cost: 4% of revenue
~1700 applications
Cost: 1% of revenue
~500 applications
100’s of Sku increasing inventory cost
16% Sku Simplification and improved inventory
controls executed in 2019; continuing further reduction.
Supply Chain Logistics re-engineered
555 Locations
8.4M square feet
261 Locations
6.2M square feet
Avg. 1:6 spans & layers of control
Numerous benefit plan choices
Avg. 1:8 span of control, reduced 2 layers
Organization Effectiveness
Limited benefit plans offered to simplify the process
Shared Services
Centers
Delivery
FROM TARGETING TO*
*See “Forward-Looking Statements” at the front of this document.

18
Shared Services Center - Transformation Highlights
Shared Services
Centers
(SSC)
FROM TARGETING TO*
Staff augmentation in offshore locations
performing work where it has originated
or been shifted
Scale level automation and process
transformation applied across all applicable
processes to significantly reduce manual work
~2600 resources in SSC
7 organizations utilizing SSC
Patches of low level transformation and
automation in disparate process areas
Siloed groups of offshore staff
with onshore management and
inconsistent operational metrics
~6000 resources in SSC
10 organizations utilizing SSC
Single Global Shared Service aligned to
global processes, connected to the business
and customers
Process aligned Centers of Excellence doing
work in the most efficient location aligned to the
Operating Model (both cost and capability)
Organization based on true Shared Service
design with benchmark spans and layers and
the application of Lean Management using
data analytics and RPA to continuously
improve performance
*See “Forward-Looking Statements” at the front of this document.

19
Delivery - Transformation Highlights
Delivery
FROM TARGETING TO*
Limited supplier quality / cost leverage, often
deal based engagement
Integrated Account Management for all Service
delivery, specialized global delivery hubs by
offering
Sales-led solution design in pursuits
Regional Delivery organizations
- 300+ role definitions, 13 layers
- limited leverage of shared services
- NA Technical Service and XBS delivery isolated
- country level quality metric definitions
Diverse product maintenance incident
management quality performance and costs
- 30% remote solve
Fragmented client ownership across
offerings, fragmented delivery models
Standards based Solution Design Center of
Excellence – robust, competitive solutions offering
Simplified Global Delivery model
- 30 role definitions, 8 layers
- 5x roles in shared service centers
- one Xerox delivery across NA
- few, common quality and cost metrics
Pan-regional suppliers for core capabilities (e.g.
US vended print from 159 suppliers to a target of 2)
Common incident process with enhanced Self
Help and Remote Solve technology
- 43 - 50% self-serve and remote solve
*See “Forward-Looking Statements” at the front of this document.

20
Project Own It:
Enterprise-wide gross savings of at least $640M expected in 2019*
375
170
150
280
490
2021
2020
2019
PROJECT OWN IT EXPECTED SAVINGS* ($M)
Completed In Execution Mode
2019 Flow Thru
*See “Forward-Looking Statements” at the front of this document.

21
Transforming and
simplifying OUR
OPERATIONS
Creating a more frictionless
and high velocity business
for OUR CLIENTS
Enabling investments while
growing OUR PROFITS
Roadmap to Stabilize and Grow RevenueJoanne Collins Smee Steve Hoover

23
2019 2020 2021
Drive Innovation & New Growth Businesses
Expected Impact Over Next 3 Years*
Capitalize on the opportunity in SMB
Expand Services & Software
Improve our Core Technology Business
Transform client Digital Experience
Our Revenue Roadmap is Focused on Five Major Strategies
*See “Forward-Looking Statements” at the front of this document.

24
The Foundation of our Three-year Roadmap Builds from
Leadership Positions in our Core Technology and Services Markets
A3 multifunction printers, $19B,▼6%#1,
20% share
• Differentiating through ConnectKey software and security
• Defending our market share leadership, with growth in SMB
A4 multifunction printers, $14B, ▲2%#7,
5% share
• Improved breadth of portfolio
• Underpenetrated in multiband and value added IT reseller
channels (“IT VARS”)
High End (Production Color), $6B, ▲2%#1,
28% share
• Strength and leadership in Xerographic technology
• Expanding our solutions in Inkjet across the portfolio
and into adjacent technologies
1. Share data (CY2017, Worldwide) from IDC’s Worldwide and U.S. Managed Print and Document Services and Basic Print Services
Market Shares, 2017: Moving Downmarket, June 2018, IDC #US42612918
* Note: All other market shares (3QLTM 2018 equipment sales revenue, Xerox Corp territory) and market data (CY2018, CAGR ‘18-’20,
Xerox Corp territory) are from Xerox analysis based on market sources
Managed Services, $27B, ▲3%#1 in MPS,
21% share1
• Growing in SMB / Channel Managed Print Services
• Vertical differentiation in Enterprise
• Regaining strength in Services

Our revenue roadmap is focused on five major strategies
2019 2020 2021
Drive Innovation & New Growth Businesses
Impact Over Next 3 Years
Capitalize on the opportunity in SMB
Expand Software & Services
Improve our Core Technology Business
Transform client Digital Experience
25
Improve Our Core Technology Business
Disrupting the multifunction device market*
• Creating a new category of workplace assistant: Leverage new technologies in
cloud, security, automation, AI and personalization
• Redefining the multi-function user experience: Using ConnectKey platform that is digitally enabled to grow with our customers - cloud and
mobile ready, expand capability through apps, personalized experience while delivering
the most secure ecosystem
Workplace Assistant & Apps Kiosk Solution Specialty toners
We are not simply trying harder in this marketplace, we are looking to fundamentally re-define it
*See “Forward-Looking Statements” at the front of this document.

Our revenue roadmap is focused on five major strategies
2019 2020 2021
Drive Innovation & New Growth Businesses
Impact Over Next 3 Years
Capitalize on the opportunity in SMB
Expand Software & Services
Improve our Core Technology Business
Transform client Digital Experience
26
Improve Our Core Technology Business
• Expanding beyond commodity print: With metallic, fluorescent and clear inks, to
bring higher value solutions to our customers
• Lowering the cost of entry into inkjet printing: Leverage our press platforms and
proprietary inkjet technology
• Disrupting digital packaging: New technology to significantly grow the
addressable market
Revolutionizing traditional color by going
beyond CMYK and paper*
We are not simply trying harder in this marketplace, we are looking to fundamentally redefine it
*See “Forward-Looking Statements” at the front of this document.

Our revenue roadmap is focused on five major strategies
2019 2020 2021
Drive Innovation & New Growth Businesses
Impact Over Next 3 Years
Capitalize on the opportunity in SMB
Expand Software & Services
Improve our Core Technology Business
Transform client Digital Experience
27
Reinforcing benchmark data, document, and device security
Providing scalable cloud services that are user and IT friendly
Bridging physical and digital worlds so office workers can be more productive
Guiding the customer experience using analytics to find opportunities for automation and improvementA
na
lyti
cs
Digital
Security
Clo
ud
/IoT
Enabling
the
Intelligent
Workplace
From MPS to Xerox Intelligent Workplace Services
Moving beyond print gives us latitude to deliver additional value

Our revenue roadmap is focused on five major strategies
2019 2020 2021
Drive Innovation & New Growth Businesses
Impact Over Next 3 Years
Capitalize on the opportunity in SMB
Expand Software & Services
Improve our Core Technology Business
Transform client Digital Experience
28
Expanding Services & Software*
Accelerating services revenue from a position
of strength
• Leading with vertical service bundles supported by robust horizontal capabilities
• Focusing on Services growth in the SMB
• Extending our leadership in Enterprise services
Digital Patient Digital RetailerDigital Insurer Digital Citizen
We aim to root everything we do in a robust technology and security foundation
serving digital age client requirements
*See “Forward-Looking Statements” at the front of this document.

29
Digital PatientTransforming the doctor/patient healthcare experience
Improve doctor /
patient experience
Handle large
volume physical
records
Reduce high
missed
appointment
rate
Expand patient
contact options
Easy access to medical info for faster
and more accurate patient care
Patient records securely managed & stored
30% of patient communications now
electronic
Reduce missed appointments rate
ResultsXerox Solution
Digitization of physical patient records
Omni-channel communications
Digital Workflow Automation
Personalization Automation
& AISecurityCloud

30
Digital Retailer Improving retailer & omnichannel customer communication
Execute
campaigns /
promotions
efficiently
Manage print for
stores centrally
Reduce
overprinting
Limit excess
assets
Simplified ordering and cost estimating
Dashboard for financials
Data intelligence
Automation of job parameters
Delivering savings and efficiencies
ResultsXerox Solution
Xerox Communications Services
Platform
XMPie
Digital Asset Management System
Automation
& AICloud Security Personalization
Our revenue roadmap is focused on five major strategies
2019 2020 2021
Drive Innovation & New Growth Businesses
Impact Over Next 3 Years
Capitalize on the opportunity in SMB
Expand Software & Services
Improve our Core Technology Business
Transform client Digital Experience
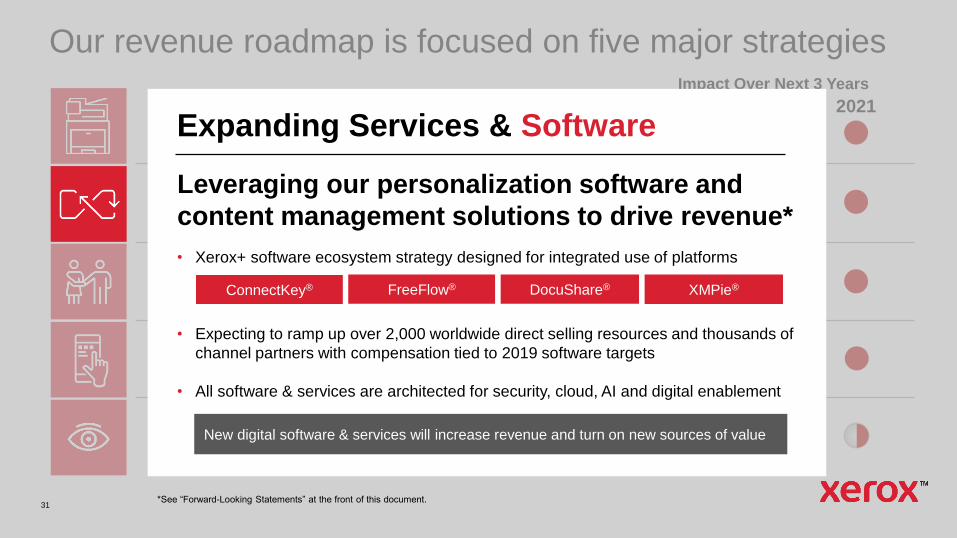
31
Expanding Services & Software
Leveraging our personalization software and
content management solutions to drive revenue*
• Xerox+ software ecosystem strategy designed for integrated use of platforms
• Expecting to ramp up over 2,000 worldwide direct selling resources and thousands of
channel partners with compensation tied to 2019 software targets
• All software & services are architected for security, cloud, AI and digital enablement
ConnectKey® DocuShare®FreeFlow® XMPie®
New digital software & services will increase revenue and turn on new sources of value
*See “Forward-Looking Statements” at the front of this document.

Our revenue roadmap is focused on five major strategies
2019 2020 2021
Drive Innovation & New Growth Businesses
Impact Over Next 3 Years
Capitalize on the opportunity in SMB
Expand Software & Services
Improve our Core Technology Business
Transform client Digital Experience
32
Capitalize on the Opportunity in SMB
Increased investment in channel and Xerox Business
Solutions (XBS) focused on SMB markets
• Direct Sales & Service
• XBS
• Channel partners (multibranded
and monobranded)
• Value Added IT resellers
• Xerox eCommerce
• Xerox Inside Sales
Our coverage strategy is aligned to support our portfolio with emphasis and investment in SMB channels
• XBS expanding
‒ organic & inorganic coverage
‒ IT services business
• Further expansion in the channel
(monobranded & multibranded)
• Value Added Resellers (VARs)
channel acceleration
• eCommerce
SMB Plan
EnterpriseFortune 500
Government
Top GC Accounts
Small
Medium
Local Gov’t
Health Care
Education
Accounts
(all Industries)
Commercial

Our revenue roadmap is focused on five major strategies
2019 2020 2021
Drive Innovation & New Growth Businesses
Impact Over Next 3 Years
Capitalize on the opportunity in SMB
Expand Software & Services
Improve our Core Technology Business
Transform client Digital Experience
33
Transform Client Digital Experience
Delight customers with a world-class
digital experience that drives growth
INVEST
Target: Double revenue from digital sources to $600M by 2021*
World-class
digital
experience.
Profitable
revenue.
• Expand Enterprise: Provide a comprehensive,
personalized offering to all clients globally
• Grow SMB: Introduce e-commerce in untapped
markets: International and Core U.S. Business Units
(Xerox Business Solutions)
• Invest: Reallocate resources to improve infrastructure
and the customer journey, to drive growth
*See “Forward-Looking Statements” at the front of this document.

Our revenue roadmap is focused on five major strategies
2019 2020 2021
Drive Innovation & New Growth Businesses
Impact Over Next 3 Years
Capitalize on the opportunity in SMB
Expand Software & Services
Improve our Core Technology Business
Transform client Digital Experience
34
We expect our innovation programs to yield revenue in 2020 and beyond*
Digital Packaging and PrintTAM: $5B 11% CAGR
3D Printing / Digital ManufacturingTAM: $8B 25% CAGR
AI Workflow Assistants for Knowledge WorkersTAM: $2B 45% CAGR
Sensors & Services for the Internet of ThingsTAM: $8B
9% CAGR
Note: Market data (CY2018, CAGR ‘18-’20, Worldwide) are from Xerox analysis based on market sources
*See “Forward-Looking Statements” at the front of this document

Our revenue roadmap is focused on five major strategies
2019 2020 2021
Drive Innovation & New Growth Businesses
Impact Over Next 3 Years
Capitalize on the opportunity in SMB
Expand Software & Services
Improve our Core Technology Business
Transform client Digital Experience
35
Digital Packaging and Print
Digital packaging customers require lower cost inks that can print on a wide variety of
packaging materials. Our PARC-developed, new-to-the-world printing technology is
designed to deliver that disruptive technology to the market.
2019 2020 2021
Expected impact over next 3 years*
Innovation stage
Stage 3: Product
Commercialization
TAM: $5B
11% CAGR
Key elements
• 50+ patents
• Powered by Xerox® and Xerox
GTM business models
• Strong customer feedback
2019
Pass technology capability
phase gate and expand
development effort to more
target markets
Total Packaging Market $45B
Labels – 25%
Flexibles – 1%
Folding Cartons – 1%
Corrugated – 1%
% Current Digital Penetration
*See “Forward-Looking Statements” at the front of this document

Our revenue roadmap is focused on five major strategies
2019 2020 2021
Drive Innovation & New Growth Businesses
Impact Over Next 3 Years
Capitalize on the opportunity in SMB
Expand Software & Services
Improve our Core Technology Business
Transform client Digital Experience
36
AI Workflow Assistants for Knowledge Workers
AI is not yet helping most knowledge workers with complex document creation, such as RFP
responses, contracts, customer briefing books, etc. Our PARC-developed AI technology analyzes
the background knowledge for each desired document and proposes document content and
structure that will both improve document relevance and lower expensive human effort to create
high-value documents.
TAM: $2B
45% CAGR
Key elements
• RFP responses is first target market. Others to follow.
• Strong positive customer feedback
• Open source AI combined with unique PARC AI capabilities
• Full SaaS offering
• Leverage XBS channel for SMB market
2019 2020 2021
Innovation stage
Stage 3: Product
Commercialization
2019
Commercial use validated by both internal Xerox & external
customers. Launch in late 2019.
Expected impact over next 3 years*
*See “Forward-Looking Statements” at the front of this document

Our revenue roadmap is focused on five major strategies
2019 2020 2021
Drive Innovation & New Growth Businesses
Impact Over Next 3 Years
Capitalize on the opportunity in SMB
Expand Software & Services
Improve our Core Technology Business
Transform client Digital Experience
37
3D Printing / Digital Manufacturing
Manufacturing customers want to use 3D printing, but the current offerings only serve the
prototyping market well, not broad manufacturing. Xerox-developed, acquired and partnered
printing, software and material technologies are expected to deliver the productivity, materials range
and cost and design tools to enable part manufacturing.
Innovation stage
Stage 2: Technology
demonstration
TAM: $8B
25% CAGR
Key elements• Lead with Powered by Xerox® GTM model
• PARC AI based manufacturing software
• 10x faster plastics printing and low-cost plastic powders
• Low-cost metal printing with more metals thru Vader acquisition
• Utilize M&A and co-development
• Strong customer feedback from major manufacturers
2019 2020 2021
2019
Plastics and metals are expected to move into product
commercialization
Expected impact over next 3 years*
*See “Forward-Looking Statements” at the front of this document

Our revenue roadmap is focused on five major strategies
2019 2020 2021
Drive Innovation & New Growth Businesses
Impact Over Next 3 Years
Capitalize on the opportunity in SMB
Expand Software & Services
Improve our Core Technology Business
Transform client Digital Experience
38
Sensors & Services for the Internet of Things
IoT requires low-cost, low-power sensors for broad usage. PARC-developed sensors and analytics
technologies can deliver this in targeted applications based upon hybrids of printed electronics,
standard electronics and imaging technologies. Applications are expected to improve outcomes in
health, safety and security for consumers, manufacturers and brands.
Target market
Healthcare, packaging, logistics &
supply chain software companies
Innovation stage
Stage 1: Ideation & technology
exploration
TAM: $8B
9% CAGR
2019 2020 2021
Key elements
• Democratize IOT sensing by
leveraging PARC IP &
capabilities
• Multiple new miniaturized
sensors demonstrated
2019
Find key early application that will drive adoption and
move into technology demonstration/product
commercialization
Expected impact over next 3 years*
*See “Forward-Looking Statements” at the front of this document

Our revenue roadmap is focused on five major strategies
2019 2020 2021
Drive Innovation & New Growth Businesses
Impact Over Next 3 Years
Capitalize on the opportunity in SMB
Expand Software & Services
Improve our Core Technology Business
Transform client Digital Experience
39
Ideate Incubate Deliver
Decision
Gates
Ready for
scale
Ready for
incubation
1
2
3
Disciplined down
selection process
validating product-
market fit
New venture studio
capability with
entrepreneurial
and market expertise
Tranche-based
funding model with
disciplined investment
review board
Implementing a disciplined “startup-like” model
aligning investments to growth areas for monetization
3D Technology
AI Workflow
Assistants
Digital
Packaging and
Sensors &
Services for
IoT

40
We are Building on Our Technology Legacy of Excellence
Heritage
• 100+ year of inventing and re-
inventing the industry
• Pioneered Managed Document
Services
• Established brand recognition for
high-quality and innovative
technology
Knowledge
• Document process management
and analytics
• Digital capture & intelligent
recognition
• Personalized omnichannel
communications across print &
digital media
• Proactive security across all
offerings
Industry Credibility
2018 recognition from the industry
• A Leader - Contractual Print &
Services, IDC MarketScape1
• A Leader - U.S. Smart Multifunction
Peripherals, IDC MarketScape2
• 13 print devices awarded "Winter
2018 Picks,” most complete software
portfolio, Buyers Lab (BLI)
• Leader in Managed Print Service and
Channel Managed Print Services,
Quocirca
1. IDC MarketScape: Worldwide Contractual Print and Document Services Hardcopy 2018–2019 Vendor Assessment, December 2018, IDC #US44387318
2. IDC MarketScape: U.S. Smart Multifunction Peripheral 2018 Vendor Assessment, February 2018, IDC #US43533617

41
2018 2019 2020 2021
SIMPLIFY TRANSFORM PORTFOLIO
& ACCELERATE SALES
STABILIZE ROAD TO GROWTH
• Deep analysis of market and
revenue trends
• Identification of the “hidden
technical gems”
• Reinforcement of selected
growth strategies and
expansion into new areas
• Expand our technology
solutions
• Broaden services & software
portfolio
• Drive SMB and Xerox Business
Solutions (XBS) organic
coverage and dealer acquisition
• New sales coverage &
compensation
• Continue building strengths in
SMB
• Accelerate expansion in
services and software
• Scale eCommerce platform
• Commercialize select
R&D IP
• Continue to lead/advance our
position in core markets
• Yield revenue from Innovations
(3D print technologies; Sensor
technology; AI / IoT)
• Increase post-sale revenue as a
result of 2019-20 placements
3-Year Revenue Roadmap:
Targeting Growth by 2021*
▲ ▲ ▲▲
*See “Forward-Looking Statements” at the front of this document

Financial ReviewBill Osbourn

43
Why Invest in Xerox
• Strong, sustainable cash generation, returning
over 50% to shareholders
• Simplifying business for sustainable operational
improvements with Project Own It
• Strong innovation capabilities to deploy into
adjacent and new markets
>$3B of Free Cash Flow1 projected over next 3 years*
>200 bps Adjusted1 Operating Margin expansion
projected over next 3 years, expected to drive at least
$4.00 Adjusted1 EPS by 2020*
Revenue trajectory set to improve annually. Flat to
growing revenue by 2021*.
• Laying the foundation to improve revenue
trajectory by leveraging new and existing
markets
R&D investments focused on innovation to increase 20%
in 2019*
• Earned the right with customer base to scale #1 market share in A3, Production and Managed Print
Services2
1Adj measures: see Non-GAAP Financial Measures
*See “Forward-Looking Statements” at the front of this document2Share data (CY2017, Worldwide) from IDC’s Worldwide and U.S. Managed Print and Document Services and Basic Print Services Market
Shares, 2017: Moving Downmarket, June 2018, IDC #US42612918; A3 and Production market shares (3QLTM 2018 equipment sales revenue,
Xerox Corp territory) are from Xerox analysis based on market sources
44
What’s Different
that Will Drive
Improved
Financial
Results?
Project Own It is changing and simplifying the business, driving sustainably lower costs.
Revenue initiatives are supported by higher investments, including funding of longer-term oriented innovation.
Earnings expansion and cash flow targets do not rely on improving revenue in the near term.

45
Aligning Compensation to Key Performance Metrics
Annual Incentive Program (% weightings1)
1Percentages represent the weightings of each measure within the Annual (2019) and Long-term (2019-2021) incentive compensation plans2Adjusted measures: see non-GAAP Financial Measures3Share price at end of 2021 (average of last 20 trading days) plus accumulated dividends over the three-year period
Absolute Revenue $
Adjusted2
Operating Margin
Free Cash Flow2
Unit / Individual Measures
Long-Term (3-Year) Incentive Program (% weightings1)
Absolute Share Price3Free Cash Flow2
Absolute Revenue $
2019 Performance-Based Incentive Program Details
50%25%
25% 25% 25%25%
25%

Sustainable Cash Generative Business Model
~85% of revenues from
multi-year contractual
arrangements
• Contracts are 3+ years on
average
• Customer base is diverse
across industries
• Opportunity to sell more
services and software to
existing customers
Longer Term Contracts
+
Majority of Revenues in
Profitable Post Sale
=
Strong and Stable
Cash Flow
Profitable Post Sale drives
>75% of revenues
• Higher margin profile reflects
inelasticity of demand
• About one third of revenues
tied to profitable supplies
stream
• Low CAPEX required to
support business model

47
Targeting Improvement Across all Financial Measures*
Revenue at CC1
(4.3)% (4.7)% (4.9)%
Adj1 Operating Margin Adj1 EPS ($) Free Cash Flow1 ($B)
11.2% 11.5% 11.6% 3.49 3.45 3.46 0.88 0.87 1.05down
~5%
12.6%
to
13.1%
3.70
to
3.80
1.0
to
1.1
1Adj measures: see Non-GAAP Financial Measures
Note: Revenue decline at actual currency was 2016: (6.1)%, 2017: (4.7)%, 2018: (4.2)%, 2019 guidance ~(6)%. GAAP EPS was 2016: $2.33, 2017: $0.70, 2018: $1.38,
2019 guidance of $2.60 to $2.70.
Operating Cash Flow from Continuing Operations was 2016: $1.02B, 2017: $(179)M, 2018: $1.14B, 2019 guidance of $1.15B to $1.25B.
It is not possible to provide GAAP measures and reconciliations for years 2020 and 2021 without unreasonable effort.
*See “Forward-Looking Statements” at the front of this document
down
~3%
up
>50
bps
4.00+ 1.1+
2016 2017 2018 2019e 2020e
Post Sale Equipment
2016 2017 2018 2019e 2020e2016 2017 2018 2019e 2020e 2016 2017 2018 2019e 2020e** * * * * * *

48
Targeting Continued Strong, Sustainable Cash Flow*
Free Cash Flow1 ($B) Expected 2019 Cash Flow Drivers
• Pre-tax Profit: expected to expand, driven by Project Own It
• Working Capital: targeting improvement, driven by inventory and accounts receivable
• Restructuring Payments: expect ~$200M
• Pension Contributions: expect ~$140M
• Finance Receivables: a projected continued source of $125M+
2016 2017 2018 2019 2020
0.88 0.87 1.05
1.0
to
1.1
1.1+
1Adjusted measures: see non-GAAP Financial Measures
*See “Forward-Looking Statements” at the front of this document
* *

Dec$0.6
$1.05 $1.06
$0.30
$1.0
$0.30$0.25
$0.35
Mar $0.4
2019 2020 2021 2022 2023 2024 2035 2039
49
Capital Structure
Balanced debt maturity ladder primarily supports customer financing activities
• Majority of debt is backed by financial assets
• Capital sources include capital markets, bank loans, securitization
• Net core debt of $700M
• Core debt level managed to be less than 2x expected free cash flow
Ample liquidity provides flexibility
• Cash on hand ($1.1B) and undrawn committed credit facility ($1.8B)
• Sufficient liquidity to manage refinancing of 2019 debt maturities
• Strong cash generation, low CAPEX and stable required pension contributions (pension plans ~88% funded as of 12/31/18, an improvement of $200M from 12/31/17)
Total Debt $ 5.2
- Finance debt* 3.4
Core Debt $ 1.8
- Ending Cash 1.1
Net Core Debt $ 0.7
*$3.9B finance assets @ 7:1 leverage
Debt Maturity Ladder ($B)
$0.96
Our near-term objective is to stabilize current rating and over time
return to investment grade with the execution of our strategy.
Seeking to maintain a strong balance sheet in support of business model and strategy
Debt Composition As of 12/31/2018 ($B)

50
Balanced Capital Allocation
• Managing balance sheet to maintain a strong
and stable capital structure
• Modest CapEx reflecting asset light model;
largest portion is IT related
• Target >50% of annual Free Cash Flow1
returned through dividends and share
repurchases
⎼ Maintaining quarterly common dividend of
$0.25 per share
⎼ Targeting share repurchase of at least $300M
• Unallocated to be deployed opportunistically
based on evaluation of relative returns
2018 2019 Guidance*
Operating Cash Flow $1.14B $1.15 to $1.25B
CapEx $90M ~$150M
Free Cash Flow1 $1.05B $1.0 to $1.1B
Dividends2 ~$250M
Share Repurchase At least $300M
Unallocated $450 to $550M
Cash Flow Guidance
Capital Allocation Framework*
Expected to drive near and long-term shareholder returns
1Free Cash Flow: see non-GAAP Financial Measures2Dividends include common and preferred
*See “Forward-Looking Statements” at the front of this document

51
Expanding Adjusted1 EPS at least 7% in 2019*
Targeted Operating Results Drivers*
Project Own It expected to drive at least 52
cents of net benefit, more than offsetting:
• Revenue decline of ~5%
• Investments to support revenue and innovation initiatives
Targeted Project Own It Sources of Savings
$(0.32)
$(0.15)$(0.10)$3.46
$0.52+
$0.26+ $0.08
$3.70to
$3.80
2018 OperationsContribution
Investments Currencyand Interest
One-timePrYr Gains
Lower ShareCount
LowerTaxes
2019Guidance
13%
22%
14%21%
3%
4%
23%
Shared Services
Procurement
IT
Delivery
Supply Chain
Real Estate
Org Design / Benefit Costs
1Adjusted Measures: see Non-GAAP Financial Measures
*See “Forward-Looking Statements” at the front of this document
*

52
Financial Expectations Improve over Time
2018 2019* 2020* 2021*
Revenue (CC1) (4.9)% Down ~5% Down ~3%• Target at least flat revenue by 2021;
shift TAM over time to higher growth
Adj1 Operating
Margin11.6% 12.6% to 13.1% Up > 50 bps • Target up >50 bps
Adj1 EPS $3.46 $3.70 to $3.80 $4.00+ • Target 7%+ annual growth
Free Cash Flow1 $1.05B $1.0 to $1.1B $1.1B+
• Target $1.1B+, expansion driven by
working capital improvements and
net income growth
1Adjusted measures: see Non-GAAP Financial Measures
Note: Revenue decline at actual currency: 2018 (4.2)%, and 2019 guidance ~(6)%; GAAP EPS: 2018 $1.38, and 2019 guidance $2.60 to $2.70;
Operating Cash Flow from Continuing Operations: 2018 $1.14B, and 2019 guidance $1.15B to $1.25B. It is not possible to provide GAAP measures
and reconciliations for years 2020 and 2021 without unreasonable effort.
*See “Forward-Looking Statements” at the front of this document.
TAM= Total Addressable Market

53
• We have a strong, sustainable
cash generative business model
• Targeting improvement across
all financial measures in 2019
• Employing a balanced capital
allocation policy to drive near
and long-term shareholder
returns
Financial Summary

Non-GAAP Financial Measures

We have reported our financial results in accordance with generally accepted accounting principles (GAAP). In addition, we have discussed our financial results using the non-GAAP measures described below. We believe these non-GAAP measures allow investors to better understand the trends in our business and to better understand and compare our results. Accordingly, we believe it is necessary to adjust several reported amounts, determined in accordance with GAAP, to exclude the effects of certain items as well as their related income tax effects.
A reconciliation of these non-GAAP financial measures to the most directly comparable financial measures calculated and presented in accordance with GAAP are set forth below as well as on our website www.xerox.com/investor.
These non-GAAP financial measures should be viewed in addition to, and not as a substitute for, the company’s reported results prepared in accordance with GAAP.
Adjusted EPS – Reported GAAP Net income and Earnings per share (EPS) were adjusted for the following items:
Amortization of intangible assets:The amortization of intangible assets is driven by our acquisition activity which can vary in size, nature and timing as compared to other companies within our industry and from period to period. The use of intangible assets contributed to our revenues earned during the periods presented and will contribute to our future period revenues as well. Amortization of intangible assetswill recur in future periods.
Restructuring and related costs:Restructuring and related costs include restructuring and asset impairment charges as well as costs associated with our transformation programs beyond those normally included in restructuring and asset impairment charges. Restructuring consists of costs primarily related to severance and benefits paid to employees pursuant to formal restructuring and workforce reduction plans. Asset impairment includes costs incurred for those assets sold, abandoned or made obsolete as a result of our restructuring actions, exiting from a business or other strategic business changes. 55
Non-GAAP Financial Measures

Additional costs for our transformation programs are primarily related to the implementation of strategic actions and initiatives and include third-party professional service costs as well as one-time incremental costs. All of these costs can vary significantly in terms of amount and frequency based on the nature of the actions as well as the changing needs of the business. Accordingly, due to that significant variability, we will exclude these charges since we do not believe they provide meaningful insight into our current or past operating performance nor do we believe they are reflective of our expected future operating expenses as such charges are expected to yield future benefits and savings with respect to our operational performance.
Non-service retirement-related costs: Our defined benefit pension and retiree health costs include several elements impacted by changes in plan assets and obligations that are primarily driven by changes in the debt and equity markets as well as those that are predominantly legacy in nature and related to employees who are no longer providing current service to the company (e.g. retirees and ex-employees). These elements include (i) interest cost, (ii) expected return on plan assets, (iii) amortization of prior plan amendments, (iv) amortized actuarial gains/losses and (v) the impacts of any plan settlements/curtailments. Accordingly, we consider these elements of our periodic retirement plan costs to be outside the operational performance of the business or legacy costs and not necessarily indicative of current or future cash flow requirements. This approach is consistent with the classification of these costs as non-operating in other expenses, net as a result of our adoption of ASU 2017-07 - Reporting of Retirement Related Benefit Costs in 2018. Adjusted earnings will continue to include the service cost elements of our retirement costs, which is related to current employee service as well as the cost of our defined contribution plans.
Transaction and related costs, net: Transaction and related costs, net are expenses incurred in connection with Xerox's planned combination transaction with Fuji Xerox, which was terminated in May 2018, as well as costs and expenses related to the previously disclosed settlement agreement reached with certain shareholders and litigation related to the terminated transaction and other shareholder actions. These costs are considered incremental to our normal operating charges and were incurred or are expected tobe incurred solely as a result of the planned combination transaction and the related shareholder settlement agreement and litigation. Accordingly, we are excluding these expenses from our Adjusted Earnings Measures in order to evaluate our performance on a comparable basis.
56
Non-GAAP Financial Measures (cont’d)

Restructuring and other charges - Fuji Xerox:We adjust our 25% share of Fuji Xerox’s net income for similar items noted above such as Restructuring and related costs and Transaction and related costs, net based on the same rationale discussed above.
Other discrete, unusual or infrequent items: We excluded the following items given their discrete, unusual or infrequent nature and their impact on our results for the period.2018 - Contract termination costs associated with a minimum purchase commitment for IT services. 2017 - Losses on early extinguishment of debt.2017 - A benefit from the remeasurement of a tax matter that related to a previously adjusted item.2017 and 2018 - impacts associated the Tax Cuts and Jobs Act (the "Tax Act") enacted in December 2017. See the “Income Taxes” section for further explanation.
We believe the exclusion of these items allows investors to better understand and analyze the results for the period as compared to prior periods and expected future trends in our business.
Adjusted Operating Income/MarginWe calculate and utilize adjusted operating income and margin measures by adjusting our reported GAAP pre-tax income and margin amounts. In addition to the costs and expenses noted as adjustments for our Adjusted Earnings measures, adjusted operating income and margin also exclude the remaining amounts included in Other expenses, net, which are primarily non-financing interest expense and certain other non-operating costs and expenses. We exclude these amounts in order to evaluate ourcurrent and past operating performance and to better understand the expected future trends in our business. In 2019 we modified the definition of Adjusted operating margin to exclude Equity in net income (loss) of unconsolidated affiliates - accordingly the full-year 2019 guidance for adjusted operating margin is compared to a revised full-year 2018 adjusted operating margin on the same basis.
57
Non-GAAP Financial Measures (cont’d)

Constant CurrencyTo better understand trends in our business, we believe that it is helpful to adjust revenue to exclude the impact of changes in the translation of foreign currencies into U.S. dollars. We refer to this adjusted revenue as “constant currency.” This impact is calculated by translating current period activity in local currency using the comparable prior year period's currency translation rate. This impact is calculated for all countries where the functional currency is the local country currency. The constant currency impact for signings growth is calculated on the basis of plan currency rates. Management believes the constant currency measure provides investors an additional perspective on revenue trends. Currency impact can be determined as the difference between actual growth rates andconstant currency growth rates.
Free Cash FlowTo better understand trends in our business, we believe that it is helpful to adjust operating cash flows from continuing operations by subtracting amounts related to capital expenditures. Management believes this measure gives investors an additional perspective on cash flow from operating activities in excess of amounts required for reinvestment. It provides a measure of our ability to fundacquisitions, dividends and share repurchase. In 2017 we also adjusted operating cash flows for the impacts associated with the incremental voluntary contributions to our U.S. defined benefit pension plans and the termination of our accounts receivable sales programs in the fourth quarter 2017. In addition, we adjusted both 2017 and 2016 operating cash flows for the impacts of certainreporting changes related to collections on beneficial interests received in sales of receivables and restricted cash. We adjusted for these impacts due to the one-time nature of the actions as well as to enable investors to better understand and analyze our operating cash flows as compared to prior periods and expected future trends.
58
Non-GAAP Financial Measures (cont’d)

Summary:
Management believes that all of these non-GAAP financial measures provide an additional means of analyzing the current period’s results against the corresponding prior period’s results. However, these non-GAAP financial measures should be viewed in addition to, and not as a substitute for, the company’s reported results prepared in accordance with GAAP. Our non-GAAP financial measures are not meant to be considered in isolation or as a substitute for comparable GAAP measures and should be read only in conjunction with our consolidated financial statements prepared in accordance with GAAP. Our management regularly uses our supplemental non-GAAP financial measures internally to understand, manage and evaluate our business and make operating decisions. These non-GAAP measures are among the primary factors management uses in planning for and forecasting future periods. Compensation of our executives is based in part on the performance of our business based on these non-GAAP measures.
A reconciliation of these non-GAAP financial measures and the most directly comparable measures calculated and presented in accordance with GAAP are set forth on the following tables:
59
Non-GAAP Financial Measures (cont’d)

60
Net Income and EPS reconciliation
(in millions, except per share amounts)
Net
Income
Diluted
EPS
Net
Income
Diluted
EPS
Net
Income
Diluted
EPS
Reported (1) $ 361 $ 1.38 $ 192 $ 0.70 $ 622 $ 2.33
Restructuring and related costs 158 216 259
Amortization of intangible assets 48 53 58
Transaction and related costs, net 68 9 -
Non-service retirement-related costs 150 188 121
Loss on early extinguishment of debt - 20 -
Contract termination costs - IT services 43 - -
Income tax on adjustments (119) (166) (145)
Restructuring and other charges - Fuji Xerox (2) 95 10 3
Tax Act 89 400 -
Remeasurement of unrecognized tax positions - (16) -
Adjusted 893$ $ 3.46 906$ $ 3.45 918$ $ 3.49
Dividends on preferred stock used in adjusted EPS
calculation(3) $ 24
Weighted average shares for adjusted EPS (3) 258 263 256
Fully diluted shares at December 31, 2018 (4) 240
(1) Net Income (loss) and EPS from continuing operations attributable to Xerox.
Year Ended
December 31, 2016
(2) Other charges in 2018 represent costs associated with the terminated combination transaction.
Year Ended
December 31, 2018
Year Ended
December 31, 2017
(3) For those periods that exclude the preferred stock dividend the average shares for the calculations of diluted EPS include 7 million shares associated with our Series B
convertible preferred stock, as applicable.
(4) Represents common shares outstanding at December 31, 2018 as well as shares associated with our Series B convertible preferred stock plus potential dilutive common
shares as used for the calculation of diluted earnings per share for the year ended December 31, 2018.

61
Operating Income/Margin reconciliation
(in millions) Profit Revenue Margin Profit Revenue Margin Profit Revenue Margin
Reported (1) 598$ 9,830$ 6.1% 570$ 10,265$ 5.6% 568$ 10,771$ 5.3%
Adjustments:
Restructuring and related costs 158 216 259
Amortization of intangible assets 48 53 58
Transaction and related costs, net 68 9 -
Equity in net income of unconsolidated affiliates 33 115 127
Restructuring and other charges - Fuji Xerox (2) 95 10 3
Other expenses, net (3),(4) 268 329 321
Adjusted 1,268$ 9,830$ 12.9% 1,302$ 10,265$ 12.7% 1,336$ 10,771$ 12.4%
Equity in net income of unconsolidated affiliates (33) (115) (127)
Restructuring and other charges - Fuji Xerox (2) (95) (10) (3)
Adjusted (Effective for 2019) 1,140$ 9,830$ 11.6% 1,177$ 10,265$ 11.5% 1,206$ 10,771$ 11.2%
(1) Pre-Tax Income and revenue from continuing operations.(2)Other charges in 2018 represent costs associated with the terminated combination transactions.(3)Includes non-service retirement-related costs of $150 million, $188 million and $121 million for the years ended December 31, 2018, 2017 and 2016, respectively(4)Includes a $43 million penalty associated with the termination of an IT services arrangement for the year ended December 31, 2018.
Year Ended
December 31, 2017
Year Ended
December 31, 2016
Year Ended
December 31, 2018

62
Free Cash Flow reconciliation
(in millions) 2018 2017 2016
Reported(1) $1,140 ($179) 716$
Incremental Voluntary contributions to U.S. defined benefit pension plans — 500 —
Collections on beneficial interests received in sales of receivables — 234 270
Elimination of certain accounts receivables sales programs — 350 —
Restricted cash - classification change (2) — 67 32
Operating Cash Flows from Continuing Operations - Adjusted $1,140 $972 $1,018
Capital expenditures (90) (105) (138)
Free Cash Flow from Continuing Operations $1,050 $867 $880
(1)Net cash provided by (used in) operating activities from continuing operations.
Year Ended
December 31,
(2)Per ASU 2016-18, Statement of Cash Flow s - Restricted Cash, restricted cash and restricted cash equivalents should be included
w ith Cash and cash equivalents w hen reconciling beginning and end-of-period amounts per the Statement of Cash Flow s.

63
Net Income and EPS FY 2019 Guidance reconciliation
(in mi l l ions , except per share amounts) Net Income EPS
Estimated(1) $ 635 ~ $2.60 - $2.70
Adjustments:
Restructuring and related costs(2) 225
Amortization of intangible assets 40
Non-service retirement-related costs 90
Income tax on adjustments (90)
Adjusted $ 900 ~ $3.70 - $3.80
Weighted average shares for adjusted EPS (3) ~ 240
(1) Net Income and EPS from continuing operations attributable to Xerox.(2) Excludes any potential Fuji Xerox restructuring.(3) Fully diluted shares at the end of 2018.
FY 2019

64
Operating Income/Margin FY 2019 Guidance reconciliation
(in millions) Profit Revenue Margin
Estimated (1) $ 705 $ 9,340 ~ 7.2% - 7.7%
Adjustments:
Restructuring and related costs 225
Amortization of intangible assets 40
Non-service retirement-related costs 90
Other Expenses, net 140
Adjusted $ 1,200 $ 9,340 ~ 12.6% - 13.1%
(1) Pre-Tax Income and revenue from continuing operations
Note: The above reconciliation does not reflect any translation currency impact.
FY 2019

65
Free Cash Flow FY 2019 Guidance reconciliation
Free Cash Flow
(in millions) FY 2019
Operating Cash Flow (1) $1,150 - $1,250
Less: capital expenditures (150)
Free Cash Flow $1,000 - $1,100
(1)Net cash provided by operating activities from continuing operations.