xcel energy 2007 nsp-mn 10-k
TRANSCRIPT

UNITED STATES SECURITIES AND EXCHANGE COMMISSION
Washington, D.C. 20549
FORM 10-K (Mark One)
⌧
ANNUAL REPORT PURSUANT TO SECTION 13 OR 15(d) OF THE SECURITIES EXCHANGE ACT OF 1934
For the fiscal year ended Dec. 31, 2007 OR
TRANSITION REPORT PURSUANT TO SECTION 13 OR 15(d) OF THE SECURITIES EXCHANGE ACT OF 1934
For the transition period from to COMMISSION FILE NUMBER 000-31387
NORTHERN STATES POWER COMPANY (Exact name of registrant as specified in its charter)
Minnesota 41-1967505
(State or other jurisdiction of incorporation or organization)
(I.R.S. Employer Identification No.)
414 Nicollet Mall
Minneapolis, Minnesota 55401 (Address of principal executive offices)
(Zip Code)
(612) 330-5500 (Registrant’s telephone number, including area code)
Securities registered pursuant to Section 12(b) of the Act: None
Securities registered pursuant to Section 12(g) of the Act: Common Stock
Indicate by check mark if the registrant is a well-known seasoned issuer, as defined by Rule 405 of the Securities Act. Yes No ⌧ Indicate by check mark if the registrant is not required to file reports pursuant to Section 13 or Section 15(d) of the Exchange Act. Yes No ⌧ Indicate by check mark whether the registrant (1) has filed all reports required to be filed by Section 13 or 15(d) of the Securities Exchange Act of 1934 during the preceding 12 months (or for such shorter period that the registrant was required to file such reports), and (2) has been subject to such filing requirements for the past 90 days. Yes ⌧ No Indicate by check mark if disclosure of delinquent filers pursuant to Item 405 of Regulation S-K is not contained herein, and will not be contained, to the best of registrant’s knowledge, in definitive proxy or information statements incorporated by reference in Part III of this Form 10-K or any amendment to this Form 10-K. ⌧ Indicate by check mark whether the registrant is a large accelerated filer, an accelerated filer, a non-accelerated filer or a smaller reporting company. See the definitions of “large accelerated filer,” “accelerated filer” and “smaller reporting company” in Rule 12b-2 of the Act. (Check one):
Large accelerated filer Accelerated filer ⌧ Non-accelerated filer Smaller Reporting Company Indicate by check mark whether the registrant is a shell company (as defined in Rule 12b-2 of the Act). Yes No ⌧ As of Feb. 25, 2008, 1,000,000 shares of common stock, par value $0.01 per share, were outstanding, all of which were held by Xcel Energy Inc., a Minnesota Corporation. DOCUMENTS INCORPORATED BY REFERENCE: Xcel Energy Inc.’s Definitive Proxy Statement for its 2008 Annual Meeting of Shareholders
is incorporated by reference into Part III of this Form 10-K Northern States Power Company meets the conditions set forth in General Instruction I(1)(a) and (b) of Form 10-K and is therefore filing this form
with the reduced disclosure format permitted by General Instruction I(2).

2
INDEX PART I 3Item 1 — Business 3
DEFINITION OF ABBREVIATIONS AND INDUSTRY TERMS 3COMPANY OVERVIEW 6ELECTRIC UTILITY OPERATIONS 6
Overview 6Summary of Recent Federal Regulatory Developments 7Public Utility Regulation 8Capacity and Demand 9Energy Sources and Related Initiatives 9Fuel Supply and Costs 14Wholesale Commodity Marketing Operations 15Nuclear Power Operations and Waste Disposal 12Electric Operating Statistics 15
NATURAL GAS UTILITY OPERATIONS 16Public Utility Regulation 16Capability and Demand 16Natural Gas Supply and Costs 16Natural Gas Operating Statistics 17
ENVIRONMENTAL MATTERS 18EMPLOYEES 18
Item 1A — Risk Factors 18Item 1B — Unresolved SEC Staff Comments 24Item 2 — Properties 24Item 3 — Legal Proceedings 25Item 4 — Submission of Matters to a Vote of Security Holders 25 PART II 25Item 5 — Market for Registrant’s Common Equity, Related Stockholder Matters and Issuer Purchases of Equity Securities
25
Item 6 — Selected Financial Data 266Item 7 — Management’s Discussion and Analysis of Financial Condition and Results of Operations 26Item 7A — Quantitative and Qualitative Disclosures About Market Risk 29Item 8 — Financial Statements and Supplementary Data 32Item 9 — Changes in and Disagreements with Accountants on Accounting and Financial Disclosure 70Item 9A(T) — Controls and Procedures 70Item 9B — Other Information 70 PART III 71Item 10 — Directors, Executive Officers and Corporate Governance 71Item 11 — Executive Compensation 71Item 12 — Security Ownership of Certain Beneficial Owners and Management and Related Stockholder Matters 71Item 13 — Certain Relationships, Related Transactions and Director Independence 71Item 14 — Principal Accounting Fees and Services 71 PART IV 71Item 15 — Exhibits, Financial Statement Schedules 71 SIGNATURES 76 This Form 10-K is filed by Northern States Power Co., a Minnesota corporation (NSP-Minnesota). NSP-Minnesota is a wholly owned subsidiary of Xcel Energy Inc. Additional information on Xcel Energy is available in various filings with the U.S. Securities and Exchange Commission (SEC). This report should be read in its entirety.

3
PART I
Item l — Business
DEFINITION OF ABBREVIATIONS AND INDUSTRY TERMS Xcel Energy Subsidiaries and Affiliates NMC
Nuclear Management Co., a wholly owned subsidiary of NSP Nuclear Corporation
NSP-Minnesota Northern States Power Co., a Minnesota corporation NSP-Wisconsin Northern States Power Co., a Wisconsin corporation PSCo Public Service Company of Colorado, a Colorado corporation SPS Southwestern Public Service Co., a New Mexico corporation utility subsidiaries NSP-Minnesota, NSP-Wisconsin, PSCo, SPS Xcel Energy Xcel Energy Inc., a Minnesota corporation Federal and State Regulatory Agencies DOE United States Department of Energy EPA United States Environmental Protection Agency FERC
Federal Energy Regulatory Commission. The U.S. agency that regulates the rates and services for transportation of electricity and natural gas and the sale of electricity at wholesale, in interstate commerce, including the sale of electricity at market-based rates.
MPUC
Minnesota Public Utilities Commission. The state agency that regulates the retail rates, services and other aspects of NSP-Minnesota’s operations in Minnesota. The MPUC also has jurisdiction over the capital structure and issuance of securities by NSP-Minnesota.
NERC North American Electric Reliability Council NDPSC
North Dakota Public Service Commission. The state agency that regulates the retail rates, services and other aspects of NSP-Minnesota’s operations in North Dakota.
NRC
Nuclear Regulatory Commission. The federal agency that regulates the operation of nuclear power plants.
PSCW
Public Service Commission of Wisconsin. The state agency that regulates the retail rates, services, securities issuances and other aspects of NSP-Wisconsin’s operations in Wisconsin.
SDPUC
South Dakota Public Utilities Commission. The state agency that regulates the retail rates, services and other aspects of NSP-Minnesota’s operations in South Dakota.
SEC Securities and Exchange Commission Electric, Purchased Gas and Resource Adjustment Clauses
DSM
Demand-side management. Energy conservation, weatherization and other programs to conserve or manage energy use by customers.
FCA
Fuel clause adjustment. A clause included in NSP-Minnesota’s retail electric rate schedules that provides for prospective monthly rate adjustments to reflect the actual cost of electric fuel and purchased energy compared to a prior forecast. The difference between the electric costs collected through the FCA rates and the actual costs incurred in a month are collected or refunded in a subsequent period.
PGA
Purchased gas adjustment. A clause included in NSP-Minnesota’s retail gas rate schedules that provides for prospective monthly rate adjustments to reflect the forecasted cost of purchased gas. The annual difference between the gas costs collected through PGA rates and the actual gas costs is collected or refunded over the subsequent 12-month period.
TCR
Transmission cost recovery adjustment. Allows NSP-Minnesota to recover the cost of transmission facilities not included in the determination of NSP-Minnesota’s base electric rates in retail electric rates in Minnesota. The

4
TCR was approved by the MPUC in 2006 to be effective in 2007 and will be revised annually as new transmission investments and costs are incurred.
Other Terms and Abbreviations AFDC
Allowance for funds used during construction. Defined in regulatory accounts as a non-cash accounting convention that represents the estimated composite interest costs of debt and a return on equity funds used to finance construction. The allowance is capitalized in property accounts and included in income.
ALJ Administrative law judge. A judge presiding over regulatory proceedings. ARO Asset Retirement Obligation. BART Best Available Retrofit Technology CO2 Carbon dioxide CAIR Clean Air Interstate Rule CAMR Clean Air Mercury Rule COLI Corporate-owned life insurance decommissioning
The process of closing down a nuclear facility and reducing the residual radioactivity to a level that permits the release of the property and termination of license. Nuclear power plants are required by the NRC to set aside funds for their decommissioning costs during operation.
derivative instrument
A financial instrument or other contract with all three of the following characteristics: • An underlying and a notional amount or payment provision or both, • Requires no initial investment or an initial net investment that is
smaller than would be required for other types of contracts that would be expected to have a similar response to changes in market factors, and
• Terms require or permit a net settlement, can be readily settled net by means outside the contract or provides for delivery of an asset that puts the recipient in a position not substantially different from net settlement
distribution
The system of lines, transformers, switches and mains that connect electric and natural gas transmission systems to customers.
ERISA Employee Retirement Income Security Act FASB Financial Accounting Standards Board FTRs Financial Transmission Rights GAAP Generally accepted accounting principles generation
The process of transforming other forms of energy, such as nuclear or fossil fuels, into electricity. Also, the amount of electric energy produced, expressed in megawatts (capacity) or megawatt hours (energy).
GHG Greenhouse Gas JOA Joint operating agreement among the Utility Subsidiaries LIBOR London Interbank Offered Rate LNG Liquefied natural gas. Natural gas that has been converted to a liquid. mark-to-market
The process whereby an asset or liability is recognized at fair value and the change in the fair value of that asset or liability is recognized in current earnings in the consolidated statements of operations or in other comprehensive income within equity during the current period.
MERP Metropolitan emissions reduction project. MGP Manufactured gas plant. MISO Midwest Independent Transmission System Operator, Inc. Moody’s Moody’s Investor Services Inc. MPCA Minnesota Pollution Control Agency native load
The customer demand of retail and wholesale customers whereby a utility has an obligation to serve: e.g., an obligation to provide electric or natural gas service created by statute or long-term contract.
natural gas A naturally occurring mixture of hydrocarbon and non-hydrocarbon gases

5
found in porous geological formations beneath the earth’s surface, often in association with petroleum. The principal constituent is methane.
NOx Nitrogen oxide nonutility
All items of revenue, expense and investment not associated, either by direct assignment or by allocation, with providing service to the utility customer.
PFS
Private Fuel Storage, LLC. A consortium of private parties (including NSP-Minnesota) working to establish a private facility for interim storage of spent nuclear fuel.
PUHCA
Public Utility Holding Company Act of 2005. Successor to the Public Utility Holding Company Act of 1935, enacted to regulate the corporate structure and financial operations of utility holding companies. Eliminates most federal regulation of utility holding companies. Transfers other regulatory authority from the SEC to the FERC.
QF
Qualifying facility. As defined under the Public Utility Regulatory Policies Act of 1978, a QF sells power to a regulated utility at a price equal to that which it would otherwise pay if it were to build its own power plant or buy power from another source.
Rate base
The investor-owned plant facilities for generation, transmission and distribution and other assets used in supplying utility service to the consumer.
ROE Return on equity RTO
Regional Transmission Organization. An independent entity, which is established to have “functional control” over a utility’s electric transmission systems, in order to provide non-discriminatory access to transmission of electricity.
SFAS Statement of Financial Accounting Standards SO2 Sulfur dioxide SPP Southwest Power Pool, Inc. Standard & Poor’s Standard & Poor’s Ratings Services TEMT Transmission and Energy Markets Tariff unbilled revenues
Amount of service rendered but not billed at the end of an accounting period. Cycle meter-reading practices result in unbilled consumption between the date of last meter reading and the end of the period.
underlying
A specified interest rate, security price, commodity price, foreign exchange rate, index of prices or rates, or other variable, including the occurrence or nonoccurrence of a specified event such as a scheduled payment under a contract.
VaR Value-at-risk wheeling or transmission
An electric service wherein high voltage transmission facilities of one utility system are used to transmit power generated within or purchased from another system.
Measurements Btu
British thermal unit. A standard unit for measuring thermal energy or heat commonly used as a gauge for the energy content of natural gas and other fuels.
Bcf Billion cubic feet KV Kilovolts KW Kilowatts Kwh Kilowatt hours MMBtu One million Btus MW Megawatts (one MW equals one thousand KW) Watt
A measure of power production or usage equal to the kinetic energy of an object with a mass of 2 kilograms moving with a velocity of one meter per second for one second.

6
COMPANY OVERVIEW
NSP-Minnesota was incorporated in 2000 under the laws of Minnesota. NSP-Minnesota is an operating utility engaged in the generation, purchase, transmission, distribution and sale of electricity in Minnesota, North Dakota and South Dakota. The wholesale customers served by NSP-Minnesota comprised approximately 10 percent of the total sales in 2007. NSP-Minnesota also purchases, transports, distributes and sells natural gas to retail customers and transports customer-owned natural gas in Minnesota and North Dakota. NSP-Minnesota provides electric utility service to approximately 1.4 million customers and natural gas utility service to approximately 0.5 million customers. Approximately 90 percent of NSP-Minnesota’s retail electric operating revenues were derived from operations in Minnesota during 2007. Generally, NSP-Minnesota’s earnings comprise approximately 35 percent to 45 percent of Xcel Energy’s consolidated net income. The electric production and transmission system of NSP-Minnesota is managed as an integrated system with that of NSP-Wisconsin, jointly referred to as the NSP System. The electric production and transmission costs of the entire NSP System are shared by NSP-Minnesota and NSP-Wisconsin. A FERC-approved agreement between the two companies, called the Interchange Agreement, provides for the sharing of all costs of generation and transmission facilities of the NSP System, including capital costs. NSP-Minnesota owns the following direct subsidiaries: United Power and Land Co., which holds real estate; and NSP Nuclear Corp., which owns NMC. NSP-Minnesota conducts its utility business in the following reportable segments: Regulated Electric Utility, Regulated Natural Gas Utility and All Other. Comparative segment revenues and related financial information for fiscal 2007, 2006 and 2005 are set forth in Note 15 to the accompanying consolidated financial statements. NSP-Minnesota focuses on growing through investments in electric and natural gas rate base to meet growing customer demands, environmental and renewable energy initiatives and to maintain or increase reliability and quality of service to customers. NSP-Minnesota files periodic rate cases with state and federal regulators to earn a return on its investments and recover costs of operations.
ELECTRIC UTILITY OPERATIONS Overview Climate Change and Clean Energy — Like most other utilities, NSP-Minnesota is subject to a significant array of environmental regulations focused on many different aspects of its operations. There are significant future environmental regulations under consideration to encourage the use of clean energy technologies and regulate emissions of GHGs to address climate change. NSP-Minnesota’s electric generating facilities are likely to be subject to regulation under climate change policies introduced at either the state or federal level within the next few years. Several of the states in which we operate have proposed or implemented clean energy policies, such as renewable energy portfolio standards or DSM programs, in part designed to reduce the emissions of GHGs. Congress and federal policy makers are considering climate change legislation and a variety of national climate change policies. NSP-Minnesota is advocating with state and federal policy makers for climate change and clean energy policies that will result in significant long-term reduction in GHG emissions, develop low-emitting technologies and secure, cost-effective energy supplies for our customers and our nation. While NSP-Minnesota is not currently subject to state or federal limits on its GHG emissions, NSP-Minnesota has undertaken a number of initiatives to prepare for climate change regulation and reduce our GHG emissions. These initiatives include emission reduction programs, energy efficiency and conservation programs, renewable energy development and technology exploration projects. Although the impact of climate change policy on NSP-Minnesota will depend on the specifics of state and federal policies and legislation, NSP-Minnesota believes that, based on prior state commission practice, NSP-Minnesota would be granted the authority to recover the cost of these initiatives through rates. Utility Restructuring and Retail Competition — The FERC has continued with its efforts to promote more competitive wholesale markets through open-access transmission and other means. As a consequence, NSP-Minnesota can purchase from competing wholesale suppliers and use the transmission systems of the utility subsidiaries on a comparable basis to the utility subsidiaries’ to serve their native load. NSP-Minnesota supports the continued development of wholesale competition and non-discriminatory wholesale open-access transmission services. The retail electric business faces competition as industrial and large commercial customers have some ability to own or operate facilities to generate their own electricity. In addition, customers may have the option of substituting other fuels, such as natural gas or steam/chilled water for heating, cooling and manufacturing purposes, or the option of relocating their

7
facilities to a lower cost region. While NSP-Minnesota faces these challenges, it believes its rates are competitive with currently available alternatives. Summary of Recent Federal Regulatory Developments The FERC has jurisdiction over rates for electric transmission service in interstate commerce and electricity sold at wholesale, hydro facility licensing, natural gas transportation, accounting practices and certain other activities of NSP-Minnesota. State and local agencies have jurisdiction over many of NSP-Minnesota’s activities, including regulation of retail rates and environmental matters. In addition to the matters discussed below, see Note 11 to the consolidated financial statements for a discussion of other regulatory matters. FERC Rules Implementing Energy Policy Act of 2005 (Energy Act) — The Energy Act repealed PUHCA effective Feb. 8, 2006. In addition, the Energy Act required the FERC to conduct several rulemakings to adopt new regulations to implement various aspects of the Energy Act. Since August 2005, the FERC has completed several rulemaking proceedings to modify its regulations on a number of subjects, including:
• Adopting regulations to establish a national Electric Reliability Organization (ERO) to replace the voluntary NERC structure and requiring the ERO to establish mandatory electric reliability standards and imposition of financial or other penalties for violations of adopted standards;
• Certifying the NERC as the ERO and adopting rules making 83 NERC reliability standards mandatory and subject to potential financial penalties up to $1 million per day per violation for non-compliance effective June 18, 2007; and approving delegation agreements between NERC and various regional entities, including the Midwest Reliability Organization (MRO), SPP and Western Electricity Coordinating Council (WECC), whereby the regional entities will be responsible for regional enforcement of approved NERC standards. On Dec. 21, 2007, the FERC approved seven additional NERC mandatory standards to be effective in first quarter 2008;
• Adopting rules allowing utilities in organized wholesale energy markets such as MISO and SPP to seek to eliminate their mandatory Public Utility Regulatory Policies Act (PURPA) QF power purchase obligations; and
• Adopting rules to establish incentives for investment in new electric transmission infrastructure. During 2007, both state and federal legislative initiatives were introduced, with the Xcel Energy subsidiaries taking an active role in their development. While NSP-Minnesota cannot predict the ultimate impact the new regulations will have on its operations or financial results, NSP-Minnesota is taking actions that are intended to comply with and implement these new rules and regulations as they become effective. Electric Transmission Rate Regulation — The FERC regulates the rates charged and terms and conditions for electric transmission services. FERC policy encourages utilities to turn over the functional control over their electric transmission assets and the related responsibility for the sale of electric transmission services to an RTO. NSP-Minnesota and NSP-Wisconsin are members of the MISO RTO. Each RTO separately files regional transmission tariff rates for approval by the FERC. All members within that RTO are then subjected to those rates. On Feb. 15, 2007, the FERC issued final rules (Order No. 890) adopting revisions to its open access transmission service rules. Xcel Energy submitted the required compliance revisions to its Open Access Transmission Tariff (OATT) on July 13, 2007, Sept. 11, 2007 and Dec. 7, 2007, as required. The compliance filings are pending FERC action. On Dec. 28, 2007, the FERC issued an order on rehearing making certain modifications to Order No. 890. The revised rules will be effective in March 2008. Xcel Energy is now reviewing the amended final rules. In addition, in January 2007, the FERC issued interim and proposed rules to modify the current FERC standards of conduct rules governing the functional separation of the Xcel Energy electric transmission function from the wholesale sales and marketing function. The proposed rules are pending final FERC action. While NSP-Minnesota cannot predict the ultimate impact the new regulations will have on its operations or financial results, NSP-Minnesota is taking actions that are intended to comply with and implement these new rules and regulations as they become effective. Centralized Regional Wholesale Markets — FERC rules allow RTOs to operate centralized regional wholesale energy
markets. In April 2005, MISO began operation of a “Day 2” regional day-ahead and real time wholesale energy market. MISO uses security constrained regional economic dispatch and congestion management using Locational Marginal Pricing

8
(LMP) and FTRs. The Day 2 market is intended to provide more efficient generation dispatch over the 15 state MISO region, including the NSP System In September 2007, MISO filed for FERC approval to establish a centralized regional wholesale ancillary services market (ASM) in the second quarter of 2008. The ASM is intended to provide further efficiencies in generation dispatch by allowing for regional regulation response and contingency reserve services through a bid-based market mechanism co-optimized with the Day 2 energy market. In addition, MISO would consolidate the operation of approximately 20 existing NERC approved balancing authorities (the entity responsible for maintaining reliable operations for a defined geographic region) into a single regional balancing authority. Xcel Energy generally supports implementation of the ASM, because it is expected to allow native NSP System generation to be used more efficiently, as certain generation will not always need to be held in reserve and to facilitate the operation of intermittent wind generation on the NSP System required to achieve state-mandated renewable energy supply standards. Comments on the ASM proposal were filed on Oct. 15, 2007 and the FERC held a technical conference on certain market power issues in November 2007. The proposal is pending FERC action. If the FERC approves the ASM tariff in February 2008 without material conditions, and if MISO can demonstrate system and operation readiness, MISO would implement the ASM on June 1, 2008. If approved by the FERC, NSP-Minnesota and NSP-Wisconsin expect to file for state regulatory approvals, as necessary, to recover ASM costs via their fuel and purchased energy cost recovery mechanisms in first quarter 2008. In another development affecting regional wholesale markets, in December 2007, MISO and some MISO transmission owners, including NSP-Minnesota and NSP-Wisconsin, filed proposed changes to the MISO TEMT affecting the revenue distribution of transmission revenues. Without the proposed tariff change, certain MISO transmission owners would experience an increase in prospective transmission revenues, while the revenues to other MISO transmission owners would correspondingly decrease. The proposed change did not affect 2007 results, but would essentially preserve the historic allocation of transmission service revenues in 2008 and future years. In December 2007, Ameren - Union Electric (Ameren UE) protested the proposed change. In February 2008, the FERC issued an order accepting the MISO tariff change effective February 2008 and rejecting the Ameren-UE protest. Market Based Rate Rules — In June 2007, the FERC issued a final order governing its market-based rate authorizations to electric utilities. The FERC reemphasized its commitment to market-based pricing, but is revising the tests it uses to assess whether a utility has market power and has emphasized that it intends to exercise greater oversight where it has market-based rate authorizations. NSP-Minnesota has been granted market-based rate authority and will be subject to the new rule. Public Utility Regulation Summary of Regulatory Agencies and Areas of Jurisdiction — Retail rates, services and other aspects of NSP-Minnesota’s operations are regulated by the MPUC, the NDPSC and the SDPUC within their respective states. The MPUC has regulatory authority over aspects of NSP-Minnesota’s financial activities, including security issuances, property transfers, mergers and transactions between NSP-Minnesota and its affiliates. In addition, the MPUC reviews and approves NSP-Minnesota’s electric resource plans for meeting customers’ future energy needs. The MPUC also certifies the need for generating plants greater than 50 MW and transmission lines greater than 100 KV. No large power plant or transmission line may be constructed in Minnesota except on a site or route designated by the MPUC. The NDPSC and SDPUC have regulatory authority over the need for certain generating and transmission facilities and the siting and routing of certain new generation and transmission facilities in North Dakota and South Dakota, respectively. NSP-Minnesota is subject to the jurisdiction of the FERC with respect to its wholesale electric operations, hydroelectric licensing, accounting practices, wholesale sales for resale and the transmission of electricity in interstate commerce. NSP-Minnesota has received authorization from the FERC to make wholesale electric sales at market-based prices (see market-based rate authority discussion) and is a transmission-owner member of the MISO RTO. Fuel, Purchased Energy and Conservation Cost Recovery Mechanisms — NSP-Minnesota’s retail electric rate schedules in Minnesota, North Dakota and South Dakota include a FCA that provides for monthly adjustments to billings and revenues for changes in prudently incurred cost of fuel, fuel related items and purchased energy. NSP-Minnesota is permitted to recover these costs through FCA mechanisms individually approved by the regulators in each jurisdiction. The FCA mechanisms allow NSP-Minnesota to bill customers for the cost of fuel and fuel related costs used to generate electricity at its plants and energy purchased from other suppliers. In December 2006, the MPUC authorized FCA recovery of all MISO Day 2 charges, except certain administrative charges, which NSP-Minnesota is partially recovering in base rates

9
and partially deferring for future recovery. In general, capacity costs are not recovered through the FCA. NSP-Minnesota’s electric wholesale customers also have a FCA provision in their contracts. NSP-Minnesota is required by Minnesota law to spend a minimum of 2 percent of Minnesota electric revenue on conservation improvement programs. These costs are recovered through an annual cost recovery mechanism for electric conservation and energy management program expenditures. NSP-Minnesota is required to request a new cost recovery level annually. While this law will change to a savings-based requirement beginning in 2010, the costs of providing qualified conservation improvement programs will continue to be recoverable through a rate adjustment mechanism. MERP Rider Regulation — In December 2003, the MPUC approved NSP-Minnesota’s MERP proposal to convert two coal-fueled electric generating plants to natural gas and to install advanced pollution control equipment at a third coal-fired plant. These improvements are expected to significantly reduce air emissions from these facilities, while increasing the capacity at system peak by 300 MW. The first MERP project at the A. S. King plant went into service in July 2007 with the remaining two projects (High Bridge and Riverside) expected to begin operations in 2008 and 2009, respectively, at a cumulative investment of approximately $1 billion. The MPUC approved a rate rider to recover prudent costs of the projects from Minnesota customers beginning Jan. 1, 2006, including a rate of return on the construction work in progress. The MPUC approval has a sliding ROE scale based on actual construction cost compared with a target level of construction costs (based on an equity ratio of 48.5 percent and a debt ratio of 51.5 percent) to incentivize NSP-Minnesota to control construction costs. At Dec. 31, 2007, the estimated ROE was 10.7 percent, based on construction progress to date. Actual Costs as a Percent of Target Costs ROE Less than or equal to 75%............................................................ 11.47%Over 75% and up through 85%.................................................... 11.22 Over 85% and up through 95%.................................................... 11.00 Over 95% and up through 105%.................................................. 10.86 Over 105% and up through 115%................................................ 10.55 Over 115% and up through 125%................................................ 10.22 Over 125%................................................................................... 9.97 Capacity and Demand Uninterrupted system peak demand for the NSP System’s electric utility for each of the last three years and the forecast for 2008, assuming normal weather, are listed below. System Peak Demand (in MW) 2005 2006 2007 2008 Forecast NSP System ..................... 9,104 9,859 9,427 9,737 The peak demand for the NSP System typically occurs in the summer. The 2007 system peak demand for the NSP System occurred on July 26, 2007. Energy Sources and Related Transmission Initiatives NSP-Minnesota expects to use existing electric generating stations, power purchases, DSM options, new generation facilities and phased expansion of existing generation at select power plants to meet its system capacity requirements. Purchased Power — NSP-Minnesota has contractual arrangements to purchase power from other utilities and independent power producers. Capacity is the measure of the rate at which a particular generating source produces electricity. Energy is a measure of the amount of electricity produced from a particular generating source over a period of time. Long-term purchase power contracts typically require a periodic payment to secure the capacity from a particular generating source and a charge for the associated energy actually purchased from such generating source. NSP-Minnesota also makes short-term purchases to replace generation from company-owned units that are unavailable due to maintenance and unplanned outages, to comply with minimum availability requirements, to obtain energy at a lower cost and for various other operating requirements. Purchased Transmission Services — In addition to using their integrated transmission system, NSP-Minnesota and NSP-Wisconsin have contractual arrangements with MISO and regional transmission service providers to deliver power and energy to the NSP System for native load customers, which are retail and wholesale load obligations with terms of more than one year.

10
Excelsior Energy Inc. (Excelsior) — In December 2005, Excelsior, an independent energy developer, filed a power purchase agreement with the MPUC seeking a declaration that NSP-Minnesota be compelled to enter into an agreement to purchase the output from two integrated gas combined cycle (IGCC) plants to be located in northern Minnesota as part of the Mesaba Energy Project. Excelsior filed this petition making claims pursuant to Minnesota statutes relating to an Innovative Energy Project and Clean Energy Technology. NSP-Minnesota opposed the petition. The MPUC referred this matter to a contested case hearing before an ALJ to act on Excelsior’s petition. The contested case proceeding considered a 600 MW unit in phase I and a second 600 MW unit in phase II of the Mesaba Energy Project. The MPUC issued its order for phase 1 of the hearing on Aug. 30, 2007. In it, the MPUC found that:
• The Mesaba Energy Project is an innovative energy project under the applicable statute, • The terms and conditions of the proposed purchased power agreement are inconsistent with the public interest and are
denied, • Excelsior and NSP-Minnesota should resume negotiations towards an acceptable purchased power agreement, with
assistance from the Minnesota Department of Commerce (MDOC) and the guidance provided by the order, and
• The MPUC will explore a statewide market for the output of this project. The MPUC denied rehearing, except for certain clarifications and requiring status reports on negotiations. Excelsior appealed the MPUC’s decision in December 2007. The Minnesota Court of Appeals dismissed the appeal as premature because the MPUC’s order on phase I is not final agency action on the entire case. Meanwhile, the ALJ issued a decision in Phase 2 of this proceeding, recommending denial of Excelsior’s proposed purchased power agreement for a second IGCC project. Exceptions and replies have been filed. The MPUC is expected to take up this matter in 2008. Greenhouse Gas Emissions — The 2007 Minnesota legislature adopted the goal to reduce statewide GHG emissions across all sectors producing those emissions to a level at least 15 percent below 2005 levels by 2015, to a level at least 30 percent below 2005 levels by 2025 and to a level at least 80 percent below 2005 levels by 2050. The legislation prohibits the construction within Minnesota of a new large energy facility, the import or commitment to import from outside Minnesota power from a new large energy facility, or entering into a new long-term power purchase agreement that would increase statewide power sector CO2 emissions. The statute does not impose limitations on CO2 or other GHG emissions on NSP-Minnesota and provided certain exemptions. On Feb. 1, 2008, the MDOC submitted to the legislature a climate change action plan that proposes certain changes to meet the requirements of this section. Renewable Energy Standard (RES) — The 2007 Minnesota legislature adopted a RES statute requiring NSP-Minnesota to acquire 30 percent of its energy requirements by 2020 from qualifying renewable sources, of which 25 percent must be wind energy. The legislation allows all NSP-Minnesota renewable resources to count toward meeting the standard. Costs associated with complying with the standard are recoverable through automatic recovery mechanisms. NSP-Minnesota has filed with the MPUC an renewable energy plan detailing its plans for adding wind resources. This plan seeks to achieve balance in the wind portfolio, with roughly half of new resources being owned by NSP-Minnesota and achieving roughly proportionate shares between community-based energy developments, other power purchase agreements and utility projects. Conservation and DSM Legislation — The 2007 Minnesota legislature adopted a statute establishing a statewide goal to reduce energy demand by 1.5 percent per year and fossil fuel use by 15 percent. The bill requires utilities to propose conservation and DSM programs that achieve at least 1.0 percent per year reduction in energy demand, subject to limitations regarding excessive costs for customers, reliability or other negative consequences. The statute also allows utilities to fund internal infrastructure changes that will contribute to lower energy use and provides for cost recovery outside a rate case for such projects. NSP System Resource Plan — On Dec. 14, 2007, NSP-Minnesota filed its 2007 resource plan with the MPUC. The plan incorporates the actions needed to comply with expansive new legislation regarding GHG emissions control, renewable energy procurement and DSM adopted by the 2007 Minnesota legislature. Due to the expansion of wind generation procurement and DSM obligations, the plan indicates that the type of incremental resources has changed from prior plans. Key highlights of the plan include:
• Additional wind generation resources of 2,600 MW, allowing NSP-Minnesota to comply with our RES of 30 percent renewable energy by 2020.

11
• Increases in DSM of approximately 30 percent energy savings and 50 percent demand savings. • Seek license renewals for Prairie Island’s two units through 2033 and 2034, respectively, and expand capacity at Prairie
Island by 160 MW and Monticello by 71 MW. • Request approval to make environmental upgrades at Sherburne County (Sherco), while expanding capacity by 80 MW.
The environmental upgrades would result in a significant reduction in overall SO2, NOx and mercury emissions from the facility.
• Negotiate and seek approval of purchases from Manitoba Hydro Electric Board (Manitoba Hydro) for 375 MW of intermediate and 350 MW of peaking resources beginning in 2015.
• Incremental peaking and intermediate generation needs of 2,300 MWs. • Carbon emission reductions of 22 percent below 2005 levels by 2020, a six million ton reduction. The MPUC will set a schedule for consideration of the plan early in 2008. NSP-Minnesota Base Load Acquisition Proceeding — On Nov. 1, 2006, NSP-Minnesota filed a proposal with the MPUC for a purchase of 375 MW of capacity and energy from Manitoba Hydro for 2015-2025 and the purchase of 380 MW of wind energy to fulfill the base load need identified in the 2004 resource plan. An alternate supplier proposed a 375 MW share of a lignite coal generation plant to be located in North Dakota and 380 MW of wind energy generation, with an option for Xcel Energy ownership in both components. The MPUC referred the matter to a contested case proceeding. On July 20, 2007, NSP-Minnesota filed a petition asking to suspend the proceeding until NSP-Minnesota can complete its analysis of the impact of the RES and conservation goals on its need for additional resources, as outlined in the July 20, 2007 Notice of Changed Circumstance in the resource plan. In September 2007, the MPUC approved NSP-Minnesota’s Notice of Changed Circumstance and required NSP-Minnesota to file a new resource plan by Dec. 14, 2007. NSP-Minnesota filed the 2007 resource plan, along with a proposal for closing this proceeding as the new plan does not indicate a base load resource need. The MPUC is expected to take up matter of schedule for the base load proceeding in early 2008. Additional Base Load Capacity Projects for Sherco, Monticello and Prairie Island — The MPUC order in the 2004 NSP-Minnesota resource plan indicated that additional capacity from the Sherco, Monticello and Prairie Island plants would be cost-effective and should be pursued. On July 20, 2007, NSP-Minnesota filed a Notice of Changed Circumstance with the MPUC seeking to delay these proceedings until NSP-Minnesota can complete its analysis of the impact of the RES and conservation goals on its need for additional resources. In September 2007, MPUC approved the Notice of Changed Circumstance and directed NSP-Minnesota to file a new resource plan by Dec. 14, 2007. NSP-Minnesota filed the 2007 resource plan, which confirms the cost-effectiveness of these projects and proposed to initiate filings for approval to pursue these projects in the first half of 2008. NSP-Minnesota Transmission Certificates of Need — In March 2003, the MPUC granted four certificates of need to NSP-Minnesota for the construction of various transmission system upgrades for up to 825 MW of renewable energy generation (wind and biomass) in southwest and western Minnesota. The MPUC granted routing permits in 2004-2005 for the major transmission facilities. NSP-Minnesota expects to complete the transmission construction in 2008 at a cost of approximately $230 million. As of Dec. 20, 2007, MISO has determined the new transmission facilities already installed provide transmission outlet capacity for up to 900 MW of renewable generation. In late 2006, NSP-Minnesota filed applications for certificates of need with the MPUC for three additional transmission lines in southwestern Minnesota and one in Chisago County, Minn. In 2007, the MPUC issued a certificate of need authorizing NSP-Minnesota to construct three new 115 KV transmission lines (totaling 35 to 50 miles) in southwestern Minnesota to provide approximately 350 MW of incremental transmission delivery capacity for wind generation. The three projects, including associated substations, are expected to cost $72.5 million. The MPUC order required NSP-Minnesota to file required route permit applications by January 2008 and complete construction by Spring 2009. The route permit applications were filed with the MPUC and SDPUC as required, and are pending MPUC and SDPUC action. In January 2008, the MPUC voted to grant NSP-Minnesota a certificate of need for the Chisago County, Minnesota project, which would replace an existing 69 KV line with 115 and 161 KV facilities and add a new substation at an estimated cost of $64 million and a route permit for the majority of the proposed line. The MPUC set the issue of the disputed route for a half-mile segment of the line for further discussions between the parties. The project would be placed in service in 2010. The PSCW has already approved construction by NSP-Wisconsin and Dairyland Power Cooperative of related 161 KV facilities in Wisconsin.

12
As part of CAPX 2020, NSP-Minnesota and Great River Energy (on behalf of nine other regional transmission providers) filed a certificate of need application in August 2007, for three 345 KV transmission lines serving Minnesota and parts of surrounding states. The current schedule targets an MPUC order by the end of 2008 or early 2009. The three lines would include construction of approximately 700 miles of new facilities at a cost of $1.4 to $1.7 billion, with construction to be completed in phases between 2011 and 2015. The application put forth a potential ownership percentage of 36 to 72 percent for each of the three 345 KV projects for NSP-Minnesota and NSP-Wisconsin (combined). Updated NSP-Minnesota and NSP-Wisconsin cost estimates are expected following the negotiation of project agreements outlining the terms and conditions related to construction management, ownership, operations and maintenance of these facilities. FCA Investigation — In 2003, the MPUC opened an investigation to consider the continuing usefulness of the FCAs for electric utilities in Minnesota. There was no further activity until the MPUC issued a notice for comments on April 5, 2007, as to whether to continue the statewide investigation. Pursuant to the notice, utilities in Minnesota, the MDOC and the Minnesota Office of Attorney General (MOAG) filed initial and reply comments on April 30, 2007 and June 1, 2007, respectively. The utilities generally argued the 2003 investigation could be closed, with remaining issues addressed in the separate investigation initiated by the Dec. 20, 2006, order in the MISO Day 2 cost recovery docket. The MDOC filed comments seeking to continue the investigations. In response, the utilities filed additional comments on Sept. 28, 2007 that indicated a willingness to continue with the investigation and provide more information to both regulators and customers regarding fuel and purchased power costs, plant outages and other factors affecting fuel clause levels. Continued discussions among utilities, the MDOC, MOAG and business customers regarding appropriate FCA reporting detail and provision of additional information to customers is on-going. Grand Meadow Wind Farm — In June 2007, NSP-Minnesota filed an application for a certificate of need for the Grand Meadows wind farm, a 100-MW development to be located in southeast Minnesota. The Grand Meadows project would be implemented under a build-own-transfer agreement between NSP-Minnesota and enXco, a wind project developer. Total project costs are estimated to be approximately $213 million. The MPUC approved the certificate of need and issued a site permit. Construction is expected to start in early 2008. Capital Structure Petition — In December 2007, the MPUC approved NSP-Minnesota’s regular annual capital structure petition for ongoing security issuance and increased capitalization. Mercury Reduction and Emissions Reduction Filings — Pursuant to Minnesota law, in December 2007, NSP-Minnesota filed a plan with the MPCA and MPUC for reducing mercury emissions by up to 90 percent at the Sherco unit 3 and King plants. Estimated project costs amount to approximately $9.1 million. At the same time, NSP-Minnesota submitted a revised filing to the MPUC for a major emissions reduction project at Sherco Units 1and 2 to reduce emissions and expand capacity. The revised filing has estimated project costs of approximately $1.1 billion. The filing also contains alternatives for the MPUC to consider additional capacity and to achieve lower emissions. If selected, these alternatives could range from $90.8 million to $330.8 million in addition to the $1.1 billion proposal. NSP-Minnesota’s investments are subject to the MPUC approval of a cost recovery mechanism. Nuclear Power Operations and Waste Disposal — NSP-Minnesota owns two nuclear generating plants: the Monticello plant and the Prairie Island plant. See additional discussion regarding the nuclear generating plants at Note 12 to the consolidated financial statements. Nuclear power plant operation produces gaseous, liquid and solid radioactive wastes. The discharge and handling of such wastes are controlled by federal regulation. High-level radioactive wastes primarily include used nuclear fuel. Low-level radioactive waste consists primarily of demineralizer resins, paper, protective clothing, rags, tools and equipment that have become contaminated through use in the plant. Low-Level Radioactive Waste Disposal — Federal law places responsibility on each state for disposal of its low-level radioactive waste (LLW) generated within its borders. LLW from NSP-Minnesota’s Monticello and Prairie Island nuclear plants is currently disposed at the Barnwell facility located in South Carolina (all classes of LLW) and at the Clive facility located in Utah (class A LLW only). NSP-Minnesota has an annual contract with Barnwell that is scheduled to expire on June 30, 2008, but is also able to utilize the Clive facility through various LLW processors. NSP-Minnesota has storage capacity available on-site at Prairie Island and Monticello that would allow both plants to continue to operate until the end of their current licensed lives, if off-site LLW disposal facilities were not available to NSP-Minnesota. High-Level Radioactive Waste Disposal — The federal government has the responsibility to dispose of, or permanently store, domestic spent nuclear fuel and other high-level radioactive wastes. The Nuclear Waste Policy Act requires the DOE to

13
implement a program for nuclear high-level waste management. This includes the siting, licensing, construction and operation of a repository for domestically produced spent nuclear fuel from civilian nuclear power reactors and other high-level radioactive wastes at a permanent federal storage or disposal facility. To date, the DOE has not accepted any of NSP-Minnesota’s spent nuclear fuel. See Item 3 — Legal Proceedings and Note 12 to the consolidated financial statements for further discussion of this matter. NSP-Minnesota has on-site storage for spent nuclear fuel at its Monticello and Prairie Island nuclear plants.
• In 1993, the Prairie Island plant was licensed by the federal NRC to store up to 48 casks of spent fuel at the plant. • In 1994, the Minnesota legislature adopted a limit on dry cask storage of 17 casks. • In 2003, the Minnesota legislature enacted revised legislation that will allow NSP-Minnesota to continue to operate the
facility and store spent fuel there until its current licenses with the NRC expire in 2013 and 2014. The legislation transfers the primary authority concerning future spent-fuel storage issues from the state legislature to the MPUC. It also allows for additional storage without the requirement of an affirmative vote from the state legislature, if the NRC extends the licenses of the Prairie Island and Monticello plants and the MPUC grants a certificate of need for such additional storage. It is estimated that operation through the end of the current license will require 12 additional storage casks to be stored at Prairie Island, for a total of 29 casks.
• In October 2006, the MPUC authorized an on-site storage facility and 30 casks at Monticello, which will allow the plant to operate to 2030. The MPUC decision became effective June 1, 2007.
• As of Dec. 31, 2007, there were 24 casks loaded and stored at the Prairie Island plant. See Note 13 in the consolidated financial statements for further discussion of the matter. PFS — NSP-Minnesota is part of a consortium of private parties working to establish a private facility for interim storage of spent nuclear fuel. In 1997, PFS filed a license application with the NRC for a temporary storage site for spent nuclear fuel on the Skull Valley Indian Reservation in Utah. On Feb. 28, 2006, the NRC commissioners issued the license for PFS. The license is contingent on the condition that PFS must demonstrate that it has adequate funding before construction may begin. In December 2005, the U.S. Supreme Court denied Utah’s petition for a writ of certiorari to hear an appeal of a lower court’s ruling on a series of state statutes aimed at blocking the storage and transportation of spent fuel to PFS. Also in December 2005, NSP-Minnesota indicated that it would hold in abeyance future investments in the construction of PFS as long as there is apparent and continuing progress in federally sponsored initiatives for storage, reuse, and/or disposal for the nation’s spent nuclear fuel. In September 2006, the Department of the Interior issued two findings: (1) that it would not grant the leases for rail or intermodal sites and (2) that it was revoking its previous conditional approval of the site lease between PFS and the Skull Valley Indian tribe even though the conditions had been met. The stated reasons were principally lack of progress at Yucca Mountain and lack of Bureau of Indian Affairs staff to monitor this activity. Both findings are expected to be appealed. Prairie Island Steam Generator Replacement — Prairie Island Unit 2 steam generators received required inspections during a scheduled 2005 outage. Based on current rates of degradation and available repair processes, NSP-Minnesota plans to replace these steam generators in the 2013 regular refueling outage. Nuclear Plant Re-licensing — Monticello’s renewed license expires in 2030 and Prairie Island’s licenses for its two units expire in 2013 and 2014. NRC approved Monticello’s renewed license in November 2006 and the MPUC order approving additional spent fuel storage to support twenty additional years of operation went into effect in June 2007. Prairie Island has initiated the necessary plant assessments and aging analysis to support submittal of similar applications to the NRC and the MPUC, currently planned for submittal in early 2008. Nuclear Plant Power Uprates — NSP-Minnesota is seeking approval to increase the capacity of all three nuclear units by a total of approximately 235 MW, to be implemented, between 2009 and 2015. The life extension and a capacity increase for Prairie Island Unit 2 is contingent on replacement of Unit 2’s original steam generators, currently planned for replacement during the refueling outage in 2013. Capital investments for life cycle management and power uprate activities through 2007 have totaled approximately $40 million. For the years 2008 through 2015, spending is estimated at $1.1 billion. NSP-Minnesota plans to seek approval for an alternative recovery mechanism from customers of its nuclear costs. NSP-Minnesota plans to submit the certificates of need for the Monticello uprate and the Prairie Island uprate in the first quarter of 2008. NMC — On Sept. 28, 2007, NSP-Minnesota obtained 100 percent ownership in NMC as a result of WEC exiting the partnership due to the sale of its Point Beach Nuclear Plant to FPL Energy. Accordingly, the results of operations of NMC and the estimated fair value of assets and liabilities were consolidated in NSP-Minnesota’s consolidated financial statements from the Sept. 28, 2007 transaction date. WEC was required to pay an exit fee and surrender all of its equity interest in NMC upon exiting. The effect of this transaction was not material to the financial position or the results of operations to NSP-

14
Minnesota. NSP-Minnesota is in the process of reintegrating its nuclear operations into its generation operations and apply to the NRC to transfer the nuclear operating licenses from NMC to NSP-Minnesota. The transfer of licenses is expected to be completed in 2008. For further discussion of nuclear obligations, see Note 13 to the consolidated financial statements. Fuel Supply and Costs The following table shows the delivered cost per MMBtu of each significant category of fuel consumed for electric generation, the percentage of total fuel requirements represented by each category of fuel and the total weighted average cost of all fuels. NSP System Coal* Nuclear Natural Gas Average FuelGenerating Plants Cost Percent Cost Percent Cost Percent Cost 2007 ........................................ $ 1.56 57 % $ 0.51 38 % $ 7.60 4 % $ 1.47 2006 ........................................ 1.12 59 0.46 38 7.28 3 1.08 2005 ........................................ 1.04 60 0.46 36 8.32 3 1.11
*Includes refuse-derived fuel and wood See additional discussion of fuel supply and costs under Risks associated with Our Business under Item 1A. Fuel Sources — The NSP System normally maintains approximately 30 days of coal inventory at each plant site. Coal inventory levels, however, may vary widely among plants. Coal supply inventories at Dec. 31, 2007, were approximately 47 days usage, based on the maximum burn rate for all of NSP-Minnesota’s coal-fired plants. NSP-Minnesota’s generation stations use low-sulfur western coal purchased primarily under long-term contracts with suppliers operating in Wyoming and Montana. Estimated coal requirements at NSP-Minnesota and NSP-Wisconsin’s major coal-fired generating plants are approximately 12.4 million tons per year. NSP-Minnesota and NSP-Wisconsin have contracted for coal supplies to provide approximately 100 percent of its coal requirements in 2008, 63 percent of its coal requirements in 2009 and 39 percent of its coal requirements in 2010. Any
remaining requirements will be filled through a request for proposal (RFP) process according to the fuel supply operations procurement strategy. NSP-Minnesota and NSP-Wisconsin have a number of coal transportation contracts that provide for delivery of approximately 100 percent of 2008, 2009 and 2010 coal requirements. Coal delivery may be subject to short-term interruptions or reductions due to transportation problems, weather and availability of equipment. To operate NSP-Minnesota’s nuclear generating plants, NSP-Minnesota secures contracts for uranium concentrates, uranium conversion, uranium enrichment and fuel fabrication. The contract strategy involves a portfolio of spot purchases and medium- and long-term contracts for uranium, conversion and enrichment with multiple producers and with a focus on diversification to minimize potential impacts caused by supply interruptions that may be exacerbated by the supply/demand imbalance.
• Current nuclear fuel supply contracts cover 100 percent of uranium concentrates requirements through 2008, approximately 63 percent of the requirements for 2009, 72 percent of the requirements for 2010 through 2012, 69 percent of the requirements for 2013 through 2015, 28 percent of the requirements for 2016 and 2017, with no coverage of requirements for 2018 and beyond. Contracts with additional uranium concentrate suppliers are currently in various stages of negotiations that are expected to provide a portion of the requirements through 2019.
• Current contracts for conversion services cover 100 percent of the requirements through 2011 and approximately 52 percent of the requirements from 2012 through 2015, with no coverage for 2016 and beyond.
• Current enrichment services contracts cover 100 percent of 2008 and approximately 94 percent of 2009 requirements. Approximately 29 percent of the 2010 through 2013 enrichment services requirements are currently covered with no coverage of requirements for 2014 and beyond. These current contracts expire at varying times between 2009 and 2013. A contract for additional enrichment services is being negotiated to provide 100 percent coverage from 2009 through 2013.
• The fuel fabrication contract for Monticello was extended during 2007 to cover one additional reload in 2011. Prairie Island’s fuel fabrication is 100 percent committed for six reloads with an option to extend for three additional reloads. The six reloads provide for fabrication services through at least 2013, while adding the optional reloads would provide

15
for fabrication services to at least 2015. Request for proposals from the fuel fabrication vendors for additional supply for Monticello is planned for 2008 with contract negotiations to follow.
NSP-Minnesota expects sufficient uranium, conversion and enrichment to be available for the total fuel requirements of its nuclear generating plants. Contracts for additional uranium are currently being negotiated that would provide additional supply requirements through 2019. Some exposure to price volatility will remain, due to index-based pricing structures of the contracts. The NSP System uses both firm and interruptible natural gas and standby oil in combustion turbines and certain boilers. Natural gas supplies and associated transportation and storage services for power plants are procured under contracts with various terms to provide an adequate supply of fuel. The NSP System presently has no long-term supply commitments. The transportation and storage contracts expire in various years from 2010 to 2028. Certain natural gas supply and transportation agreements include obligations for the purchase and/or delivery of specified volumes of natural gas or to make payments in lieu of delivery. At Dec. 31, 2007, NSP-Minnesota’s commitments related to these transportation and storage contracts were approximately $575 million. The NSP System has limited on-site fuel oil storage facilities and relies on the spot market for incremental supplies, if needed. Wholesale Commodity Marketing Operations NSP-Minnesota conducts various wholesale marketing operations, including the purchase and sale of electric capacity, energy and energy related products. NSP-Minnesota uses physical and financial instruments to minimize commodity price and credit risk and hedge supplies and purchases. See additional discussion under Item 7A — Quantitative and Qualitative Disclosures About Market Risk.
Electric Operating Statistics Year Ended Dec. 31, 2007 2006 2005 Electric Sales (Millions of Kwh) ........................................................
Residential ........................................................................................ 10,534 10,223 10,177 Commercial and Industrial................................................................ 25,844 25,420 25,207 Public Authorities and Other ............................................................ 275 280 272
Total Retail .................................................................................. 36,653 35,923 35,656 Sales for Resale................................................................................. 4,073 5,435 3,300
Total Energy Sold ....................................................................... 40,726 41,358 38,956 Number of customers at end of period..............................................
Residential ........................................................................................ 1,218,340 1,206,278 1,184,620 Commercial and Industrial................................................................ 146,487 144,315 141,384 Public Authorities and Other ............................................................ 6,072 5,998 5,904
Total Retail .................................................................................. 1,370,899 1,356,591 1,331,908 Wholesale ......................................................................................... 31 35 56
Total Customers .......................................................................... 1,370,930 1,356,626 1,331,964 Electric revenues (Thousands of Dollars) .........................................
Residential ........................................................................................ $ 1,015,315 $ 929,276 $ 865,738 Commercial and Industrial................................................................ 1,774,027 1,665,004 1,527,149 Public Authorities and Other ............................................................ 31,446 30,898 27,369
Total Retail .................................................................................. 2,820,788 2,625,178 2,420,256 Wholesale ......................................................................................... 198,248 227,000 212,152 Interchange Revenues from NSP-Wisconsin .................................... 372,215 322,733 305,202 Other Electric Revenues ................................................................... 85,423 90,460 73,347
Total Electric Revenues.............................................................. $ 3,476,674 $ 3,265,371 $ 3,010,957 Kwh Sales per Retail Customer ............................................................ 26,737 26,480 26,771 Revenue per Retail Customer ............................................................... $ 2,057.62 $ 1,935.13 $ 1,817.13 Residential Revenue per Kwh............................................................... 9.64¢ 9.09¢ 8.51¢ Commercial and Industrial Revenue per Kwh...................................... 6.86 6.55 6.06 Wholesale Revenue per Kwh................................................................ 4.87 4.18 6.43

16
NATURAL GAS UTILITY OPERATIONS The most significant recent developments in the natural gas operations of NSP-Minnesota are continued volatility in wholesale natural gas market prices and the continued trend toward declining use per customer by residential customers as a result of improved building construction technologies and higher appliance efficiencies. From 1997 to 2007, average annual sales to the typical residential customer declined from 112 MMBtu per year to 90 MMBtu per year on a weather-normalized basis. Although recent wholesale price increases do not directly affect earnings because of natural gas cost recovery mechanisms, the high prices are expected to encourage further efficiency efforts by customers. Public Utility Regulation Summary of Regulatory Agencies and Areas of Jurisdiction — Retail rates, services and other aspects of NSP-Minnesota’s operations are regulated by the MPUC and the NDPSC within their respective states. The MPUC has regulatory authority over aspects of NSP-Minnesota’s financial activities, including security issuances, certain property transfers, mergers with other utilities and transactions between NSP-Minnesota and its affiliates. In addition, the MPUC reviews and approves NSP-Minnesota’s natural gas supply plans for meeting customers’ future energy needs. Purchased Gas and Conservation Cost Recovery Mechanisms — NSP-Minnesota’s retail natural gas rates for Minnesota and North Dakota include a PGA clause that provides for prospective monthly rate adjustments to reflect the forecasted cost of purchased natural gas. The annual difference between the natural gas costs collected through PGA rates and the actual natural gas costs are collected or refunded over the subsequent 12-month period. The MPUC and NDPSC have the authority to disallow recovery of certain costs if they find the utility was not prudent in its procurement activities. NSP-Minnesota is required by Minnesota law to spend a minimum of 0.5 percent of Minnesota natural gas revenue on conservation improvement programs. These costs are recovered through an annual cost recovery mechanism for natural gas conservation and energy management program expenditures. NSP-Minnesota is required to request a new cost recovery level annually. While this law will change to a savings-based requirement beginning in 2010 pursuant to 2007 legislation, the costs of providing qualified conservation improvement programs will continue to be recoverable through a rate adjustment mechanism. For a further discussion of rate and regulatory matters see Note 11 to the consolidated financial statements. Capability and Demand Natural gas supply requirements are categorized as firm or interruptible (customers with an alternate energy supply). The maximum daily send-out (firm and interruptible) for NSP-Minnesota was 643,320 MMBtu for 2007, which occurred on Feb. 7, 2007. NSP-Minnesota purchases natural gas from independent suppliers. These purchases are generally priced based on market indices that reflect current prices. The natural gas is delivered under natural gas transportation agreements with interstate pipelines. These agreements provide for firm deliverable pipeline capacity of 562,298 MMBtu/day. In addition, NSP-Minnesota has contracted with providers of underground natural gas storage services. These storage agreements provide storage for approximately 30 percent of winter natural gas requirements and 36 percent of peak day, firm requirements of NSP-Minnesota. NSP-Minnesota also owns and operates one LNG plant with a storage capacity of 2.13 Bcf equivalent and three propane-air plants with a storage capacity of 1.4 Bcf equivalent to help meet its peak requirements. These peak-shaving facilities have production capacity equivalent to 250,300 MMBtu of natural gas per day, or approximately 33 percent of peak day firm requirements. LNG and propane-air plants provide a cost-effective alternative to annual fixed pipeline transportation charges to meet the peaks caused by firm space heating demand on extremely cold winter days. NSP-Minnesota is required to file for a change in natural gas supply contract levels to meet peak demand, to redistribute demand costs among classes, or to exchange one form of demand for another. The 2006-2007 and 2007-2008 entitlement levels are pending MPUC action. Natural Gas Supply and Costs NSP-Minnesota actively seeks natural gas supply, transportation and storage alternatives to yield a diversified portfolio that provides increased flexibility, decreased interruption and financial risk and economical rates. In addition, NSP-Minnesota

17
conducts natural gas price hedging activity that has been approved by the MPUC. This diversification involves numerous domestic and Canadian supply sources with varied contract lengths. The following table summarizes the average delivered cost per MMBtu of natural gas purchased for resale by NSP-Minnesota’s regulated retail natural gas distribution business: 2007 ....................................... $ 7.67 2006 ....................................... 8.32 2005 ....................................... 8.90 The cost of natural gas supply, transportation service and storage service is recovered through the PGA cost recovery mechanism. NSP-Minnesota has firm natural gas transportation contracts with several pipelines, which expire in various years from 2008 through 2027. NSP-Minnesota has certain natural gas supply, transportation and storage agreements that include obligations for the purchase and/or delivery of specified volumes of natural gas or to make payments in lieu of delivery. At Dec. 31, 2007, NSP-Minnesota was committed to approximately $813 million in such obligations under these contracts. NSP-Minnesota purchases firm natural gas supply utilizing long-term and short-term agreements from approximately 25 domestic and Canadian suppliers. This diversity of suppliers and contract lengths allows NSP-Minnesota to maintain competition from suppliers and minimize supply costs.
Natural Gas Operating Statistics Year Ended Dec. 31, 2007 2006 2005 Natural gas deliveries (Thousands of MMBtu) .............................
Residential ..................................................................................... 38,024 33,896 38,224 Commercial and Industrial............................................................. 40,184 35,231 37,215 Other .............................................................................................. 2,276 1,370 2,195
Total Retail ............................................................................... 80,484 70,497 77,634 Transportation and Other ............................................................... 8,528 8,727 8,203
Total Deliveries ........................................................................ 89,012 79,224 85,837 Number of customers at end of period...........................................
Residential ..................................................................................... 430,048 426,479 418,827 Commercial and Industrial............................................................. 39,570 39,056 38,275
Total Retail ............................................................................... 469,618 465,535 457,102 Transportation and Other ............................................................... 14 14 14
Total Customers ....................................................................... 469,632 465,549 457,116 Natural gas revenues (Thousands of Dollars)................................
Residential ..................................................................................... $ 413,790 $ 394,204 $ 449,724 Commercial and Industrial............................................................. 350,640 335,392 359,634
Total Retail ............................................................................... 764,430 729,596 809,358 Transportation and Other ............................................................... 12,541 15,039 12,564
Total Natural Gas Revenues ................................................... $ 776,971 $ 744,635 $ 821,922 MMBtu Sales per Retail Customer .................................................... 171.38 151.43 169.84 Revenue per Retail Customer ............................................................ $ 1,627.77 $ 1,567.22 $ 1,770.63 Residential Revenue per MMBtu....................................................... 10.88 11.63 11.77 Commercial and Industrial Revenue per MMBtu.............................. 8.73 9.52 9.66 Transportation and Other Revenue per MMBtu ................................ 1.47 1.72 1.53

18
ENVIRONMENTAL MATTERS Certain of NSP-Minnesota’s facilities are regulated by federal and state environmental agencies. These agencies have jurisdiction over air emissions, water quality, wastewater discharges, solid wastes and hazardous substances. Various activities require registrations, permits, licenses, inspections and approvals from these agencies. NSP-Minnesota has received all necessary authorizations for the construction and continued operation of its generation, transmission and distribution systems. NSP-Minnesota facilities have been designed and constructed to operate in compliance with applicable environmental standards. NSP-Minnesota strives to comply with all environmental regulations applicable to its operations. However, it is not possible to determine when or to what extent additional facilities or modifications of existing or planned facilities will be required as a result of changes to environmental regulations, interpretations or enforcement policies or, what effect future laws or regulations may have upon NSP-Minnesota’s operations. For more information on environmental contingencies, see Notes 12 and 13 to the consolidated financial statements. EMPLOYEES The number of full-time NSP-Minnesota employees on Dec. 31, 2007 was 3,561. Of these full-time employees, 2,287, or 64 percent, are covered under collective bargaining agreements. See Note 7 in the consolidated financial statements for further discussion of the bargaining agreements. Employees of Xcel Energy Services Inc., a subsidiary of Xcel Energy, also provide services to NSP-Minnesota and are not considered in the above amounts. Item 1A — Risk Factors Risks Associated with Our Business Our profitability depends in part on our ability to recover costs from our customers and there may be changes in circumstances or in the regulatory environment that impair our ability to recover costs from our customers. We are subject to comprehensive regulation by federal and state utility regulatory agencies. The state utility commissions regulate many aspects of our utility operations, including siting and construction of facilities, customer service and the rates that we can charge customers. The FERC has jurisdiction, among other things, over wholesale rates for electric transmission service and the sale of electric energy in interstate commerce. Our profitability is dependent on our ability to recover the costs of providing energy and utility services to our customers. We currently provide service at rates approved by one or more regulatory commissions. These rates are generally regulated based on an analysis of our expenses incurred in a test year. Thus, the rates we are allowed to charge may or may not match our expenses at any given time. While rate regulation is premised on providing a reasonable opportunity to earn a reasonable rate of return on invested capital, there can be no assurance that the applicable regulatory commission will judge all of our costs to have been prudently incurred or that the regulatory process in which rates are determined will always result in rates that will produce full recovery of our costs. Rising fuel costs could increase the risk that we will not be able to fully recover our fuel costs from our customers. Furthermore, there could be changes in the regulatory environment that would impair our ability to recover costs historically collected from our customers. If all of our costs are not recovered through customer rates, we could incur financial operating losses, which, over the long term, could jeopardize our ability to meet our financial obligations. Management currently believes these prudently incurred costs are recoverable given the existing regulatory mechanisms in place. However, changes in regulations or the imposition of additional regulations, including additional environmental regulation or regulation related to climate change, could have an adverse impact on our results of operations and hence could materially and adversely affect our ability to meet our financial obligations, including debt payments. Any reductions in our credit ratings could increase our financing costs and the cost of maintaining certain contractual relationships. We cannot be assured that any of our current ratings will remain in effect for any given period of time or that a rating will not be lowered or withdrawn entirely by a rating agency if, in its judgment, circumstances in the future so warrant. In addition, our credit ratings may change as a result of the differing methodologies or change in the methodologies used by the various rating agencies. For example, Standard and Poor’s calculates an imputed debt associated with capacity payments from purchase power contracts. An increase in the overall level of capacity payments would increase the amount of imputed debt, based on Standard and Poor’s methodology. Therefore, our credit ratings could be adversely affected based on the level of

19
capacity payments associated with purchase power contracts or changes in how imputed debt is determined. Any downgrade could lead to higher borrowing costs. We are subject to interest rate risk. If interest rates increase, we may incur increased interest expense on variable interest debt or short-term borrowings, which could have an adverse impact on our operating results. We are subject to capital market risk. NSP-Minnesota’s operations require significant capital investment in plant, property and equipment; consequently, NSP-Minnesota is an active participant in debt and equity markets. Any disruption in capital markets could have a material impact on our ability to fund our operations. Capital markets are global in nature and are impacted by numerous events throughout the world economy. Capital market disruption events, as evidenced by the collapse in the U.S. sub-prime mortgage market, could prevent NSP-Minnesota from issuing new securities or cause us to issue securities with less than ideal terms and conditions. We are subject to credit risks. Credit risk includes the risk that counterparties that owe us money or product will breach their obligations. Should the counterparties to these arrangements fail to perform, we may be forced to enter into alternative arrangements. In that event, our financial results could be adversely affected and we could incur losses. We are subject to commodity risks and other risks associated with energy markets. We engage in wholesale sales and purchases of electric capacity, energy and energy-related products and are subject to market supply and commodity price risk. Commodity price changes can affect the value of our commodity trading derivatives. We mark certain derivatives to estimated fair market value on a monthly basis (mark-to-market accounting), which may cause earnings volatility. We utilize quoted observable market prices to the maximum extent possible in determining the value of these derivative commodity instruments. For positions for which observable market prices are not available, we utilize observable quoted market prices of similar assets or liabilities or indirectly observable prices based on forward price curves of similar markets. For positions for which we have unobservable market prices, we incorporate estimates and assumptions as to a variety of factors such as pricing relationships between various energy commodities and geographic locations. Actual experience can vary significantly from these estimates and assumptions and significant changes from our assumptions could cause significant earnings variability. If we encounter market supply shortages, we may be unable to fulfill contractual obligations to our retail, wholesale and other customers at previously authorized or anticipated costs. Any such supply shortages could cause us to seek alternative supply services at potentially higher costs or suffer increased liability for unfulfilled contractual obligations. Any significantly higher energy or fuel costs relative to corresponding sales commitments would have a negative impact on our cash flows and could potentially result in economic losses. Potential market supply shortages may not be fully resolved through alternative supply sources and such interruptions may cause short-term disruptions in our ability to provide electric and/or natural gas services to our customers. We are subject to environmental laws and regulations, compliance with which could be difficult and costly. We are subject to a number of environmental laws and regulations that affect many aspects of our past, present and future operations, including air emissions, water quality, wastewater discharges and the generation, transport and disposal of solid wastes and hazardous substances. These laws and regulations require us to obtain and comply with a wide variety of environmental registrations, licenses, permits, inspections and other approvals. Environmental laws and regulations can also require us to restrict or limit the output of certain facilities or the use of certain fuels, to install pollution control equipment at our facilities, clean up spills and correct environmental hazards and other contamination. Both public officials and private individuals may seek to enforce the applicable environmental laws and regulations against us. We may be required to pay all or a portion of the cost to remediate (i.e. clean-up) sites where our past activities, or the activities of certain other parties, caused environmental contamination. At Dec. 31, 2007, these sites included:
• the sites of former manufactured gas plants operated by us or our predecessors; and
• third party sites, such as landfills, at which we are alleged to be a potentially responsible party that sent hazardous materials and wastes.

20
We are also subject to mandates to provide customers with clean energy, renewable energy and energy conservation offerings. These mandates are designed in part to mitigate the potential environmental impacts of utility operations. Failure to meet the requirements of these mandates may result in fines or penalties, which could have a material adverse effect on our results of operations. If our regulators do not allow us to recover all or a part of the cost of capital investment or the operating and maintenance costs incurred to comply with the mandates, it could also have a material adverse effect on our results of operations. In addition, existing environmental laws or regulations may be revised, new laws or regulations seeking to protect the environment may be adopted or become applicable to us and we may incur additional unanticipated obligations or liabilities under existing environmental laws and regulations. We are subject to physical and financial risks associated with climate change. There is a growing consensus that emissions of GHGs are linked to global climate change. Climate change creates physical and financial risk. Physical risks from climate change include an increase in sea level and changes in weather conditions, such as an increase in changes in precipitation and extreme weather events. NSP-Minnesota does not serve any coastal communities so the possibility of sea level rises does not directly affect NSP-Minnesota or its customers. Our customers’ energy needs vary with weather conditions, primarily temperature and humidity. For residential customers, heating and cooling represent their largest energy use. To the extent weather conditions are affected by climate change, customers’ energy use could increase or decrease depending on the duration and magnitude of the changes. Increased energy use due to weather changes may require us to invest in more generating assets, transmission and other infrastructure to serve increased load. Decreased energy use due to weather changes may affect our financial condition, through decreased revenues. Extreme weather conditions in general require more system backup, adding to costs, and can contribute to increased system stresses, including service interruptions. Weather conditions outside of the company’s service territory could also have an impact on NSP-Minnesota’s revenues. NSP-Minnesota buys and sells electricity depending upon system needs and market opportunities. Extreme weather conditions creating high energy demand on our own and/or other systems may raise electricity prices as we buy short-term energy to serve our own system, which would increase the cost of energy we provide to our customers. Severe weather impacts NSP-Minnesota’s service territories, primarily through thunderstorms, tornadoes and snow or ice storms. We include storm restoration in our budgeting process as a normal business expense and we anticipate continuing to do so. To the extent the frequency of extreme weather events increases, this could increase our cost of providing service. Changes in precipitation resulting in droughts or water shortages could adversely affect our operations, principally our fossil generating units. A negative impact to water supplies due to long-term drought conditions could adversely impact our ability to provide electricity to customers, as well as increase the price they pay for energy. We may not recover all costs related to mitigating these physical and financial risks. To the extent climate change impacts a region’s economic health, it may also impact NSP-Minnesota’s revenues. NSP-Minnesota’s financial performance is tied to the health of the regional economies we serve. The price of energy, as a factor in a region’s cost of living as well as an important input into the cost of goods, has an impact on the economic health of our communities. The cost of additional regulatory requirements, such as a tax on GHGs or additional environmental regulation, would normally be borne by consumers through higher prices for energy and purchased goods. To the extent financial markets view climate change and emissions of GHGs as a financial risk, this could negatively affect our ability to access capital markets or cause NSP-Minnesota to receive less than ideal terms and conditions. We may be subject to legislative and regulatory responses to climate change, with which compliance could be difficult and costly. Legislative and regulatory responses related to climate change create financial risk. Increased public awareness and concern may result in more regional and/or federal requirements to reduce or mitigate the effects of GHG. Numerous states have announced or adopted programs to stabilize and reduce GHG and federal legislation has been introduced in both houses of Congress. NSP-Minnesota’s electric generating facilities are likely to be subject to regulation under climate change policies introduced at either the state or federal level within the next few years. NSP-Minnesota is advocating with state and federal policy makers to design climate change regulation that is effective, flexible, low-cost and consistent with the our environmental leadership strategy. Many of the federal and state climate change legislative proposals use a “cap and trade” policy structure, in which GHG emissions from a broad cross-section of the economy would be subject to an overall cap. Under the proposals, the cap becomes more stringent with the passage of time. The proposals establish mechanisms for GHG sources, such as power plants, to obtain “allowances” or permits to emit GHGs during the course of a year. The sources may use the allowances to cover their own emissions or sell them to other sources that do not hold enough emissions for their own operations. Proponents of the cap and trade policy believe it will result in the most cost effective, flexible emission reductions. The

21
impact of legislation and regulations, including a “cap and trade” structure, on NSP-Minnesota and its customers will depend on a number of factors, including whether GHG sources in multiple sectors of the economy are regulated, the overall GHG emissions cap level, the degree to which GHG offsets are allowed, the allocation of emission allowances to specific sources and the indirect impact of carbon regulation on natural gas and coal prices. An important factor is NSP-Minnesota’s ability to recover the costs incurred to comply with any regulatory requirements that are ultimately imposed. We may not recover all costs related to complying with regulatory requirements imposed on NSP-Minnesota. If our regulators do not allow us to recover all or a part of the cost of capital investment or the operating and maintenance costs incurred to comply with the mandates, it could have a material adverse effect on our results of operations. We are subject to the risks of nuclear generation. NSP-Minnesota’s two nuclear stations, Prairie Island and Monticello, subject it to the risks of nuclear generation, which include:
• the risks associated with storage, handling and disposal of radioactive materials and the current lack of a long-term disposal solution for radioactive materials;
• limitations on the amounts and types of insurance commercially available to cover losses that might arise in connection with nuclear operations; and
• uncertainties with respect to the technological and financial aspects of decommissioning nuclear plants at the end of their licensed lives.
The NRC has authority to impose licensing and safety-related requirements for the operation of nuclear generation facilities. In the event of non-compliance, the NRC has the authority to impose fines or shut down a unit, or both, depending upon its assessment of the severity of the situation, until compliance is achieved. Revised safety requirements promulgated by the NRC could necessitate substantial capital expenditures at NSP-Minnesota’s nuclear plants. If an incident did occur, it could have a material adverse effect on our results of operations or financial condition. Furthermore, the non-compliance of other nuclear facilities operators with applicable regulations or the occurrence of a serious nuclear incident at other facilities could result in increased regulation of the industry as a whole, which could then increase NSP-Minnesota’s compliance costs and impact the results of operations of its facilities. Economic conditions could negatively impact our business. Our operations are affected by local, national and worldwide economic conditions. The consequences of a prolonged recession may include a lower level of economic activity and uncertainty regarding energy prices and the capital and commodity markets. A lower level of economic activity might result in a decline in energy consumption, which may adversely affect our revenues and future growth. Instability in the financial markets, as a result of recession or otherwise, also may affect the cost of capital and our ability to raise capital. Worldwide economic activity has an impact on the demand for basic commodities needed for utility infrastructure, such as steel, copper, aluminum, etc., which may impact our ability to acquire sufficient supplies. Additionally, the cost of those commodities may be higher than expected. Our utility operations are subject to long term planning risks. On a periodic basis, or as needed, our utility operations file long term resource plans. These plans are based on numerous assumptions over the relevant planning horizon such as: sales growth, economic activity, costs, regulatory mechanisms, impact of technology on sales and production and customer response. Given the uncertainty in these planning assumptions, there is a risk that the magnitude and timing of resource additions and demand may not coincide. This could lead to under recovery of costs or insufficient resources to meet customer demand. Our operations could be impacted by war, acts of terrorism, threats of terrorism or disruptions in normal operating conditions due to localized or regional events. Our generation plants, fuel storage facilities, transmission and distribution facilities and information systems may be targets of terrorist activities that could disrupt our ability to produce or distribute some portion of our energy products. Any such disruption could result in a significant decrease in revenues and significant additional costs to repair and insure our assets, which could have a material adverse impact on our financial condition and results of operations. The potential for terrorism has subjected our operations to increased risks and could have a material adverse effect on our business. While we have already incurred increased costs for security and capital expenditures in response to these risks, we may experience additional
22
capital and operating costs to implement security for our plants, including our nuclear power plants under the NRC’s design basis threat requirements, such as additional physical plant security and additional security personnel. The insurance industry has also been affected by these events and the availability of insurance covering risks our competitors and we typically insure against may decrease. In addition, the insurance we are able to obtain may have higher deductibles, higher premiums and more restrictive policy terms. A disruption of the regional electric transmission grid, interstate natural gas pipeline infrastructure or other fuel sources, could negatively impact our business. Because our generation, transmission systems and local natural gas distribution companies are part of an interconnected system, we face the risk of possible loss of business due to a disruption caused by an event (severe storm, generator or transmission facility outage, pipeline rupture, railroad disruption, sudden and significant increase or decrease in wind generation) within our operating systems or on a neighboring system or the actions of a neighboring utility. Any such disruption could result in a significant decrease in revenues and significant additional costs to repair assets, which could have a material adverse impact on our financial condition and results. We are subject to business continuity risks associated with our ability to respond to unforeseen events. Our response to unforeseen events will, in part, determine the financial impact of the event on our financial condition and results. It’s difficult to predict the magnitude of such events and associated impacts. We are subject to information security risks. A security breach of our information systems could subject us to financial harm associated with theft or inappropriate release of certain types of information, including, but not limited to, customer or system operating information. We are unable to quantify the potential impact of such an event. Rising energy prices could negatively impact our business. Higher fuel costs could significantly impact our results of operations if requests for recovery are unsuccessful. In addition, the higher fuel costs could reduce customer demand or increase bad debt expense, which could also have a material impact on our results of operations. Delays in the timing of the collection of fuel cost recoveries as compared with expenditures for fuel purchases could have an impact on our cash flows. We are unable to predict the future prices or the ultimate impact of such prices on our results of operations or cash flows. Our operating results may fluctuate on a seasonal and quarterly basis and can be adversely affected by milder weather. Our electric utility and natural gas businesses are seasonal and weather patterns can have a material impact on our operating performance. Demand for electricity is often greater in the summer and winter months associated with cooling and heating. Because natural gas is heavily used for residential and commercial heating, the demand for this product depends heavily upon weather patterns throughout our service territory and a significant amount of natural gas revenues are recognized in the first and fourth quarters related to the heating season. Accordingly, our operations have historically generated less revenues and income when weather conditions are milder in the winter and cooler in the summer. Unusually mild winters and summers could have an adverse effect on our financial condition and results of operations. Our natural gas distribution activities involve numerous risks that may result in accidents and other operating risks and costs. There are inherent in our natural gas distribution activities a variety of hazards and operating risks, such as leaks, explosions and mechanical problems, which could cause substantial financial losses. In addition, these risks could result in loss of human life, significant damage to property, environmental pollution, impairment of our operations and substantial losses to us. In accordance with customary industry practice, we maintain insurance against some, but not all, of these risks and losses. The occurrence of any of these events not fully covered by insurance could have a material adverse effect on our financial position and results of operations. For our distribution lines located near populated areas, including residential areas, commercial business centers, industrial sites and other public gathering areas, the level of damages resulting from these risks is greater.

23
Increased risks of regulatory penalties could negatively impact our business. The Energy Act increased the FERC’s civil penalty authority for violation of FERC statutes, rules and orders. The FERC can now impose penalties of $1 million per violation per day. Effective June 2007, 83 electric reliability standards that were historically subject to voluntary compliance became mandatory and subject to potential civil penalties for violations. If a serious reliability incident did occur, it could have a material adverse effect on our operations or financial results. Increasing costs associated with our defined benefit retirement plans and other employee-related benefits may adversely affect our results of operations, financial position, or liquidity. We have defined benefit and postretirement plans that cover substantially all of our employees. Assumptions related to future costs, return on investments, interest rates and other actuarial assumptions have a significant impact on our funding requirements related to these plans. These estimates and assumptions may change based on actual stock market performance, changes in interest rates and any changes in governmental regulations. In addition, the Pension Protection Act of 2006 changed the minimum funding requirements for defined benefit pension plans beginning in 2008. Therefore, our funding requirements and related contributions may change in the future. Increasing costs associated with health care plans may adversely affect our results of operations, financial position or liquidity. The costs of providing health care benefits to our employees and retirees have increased substantially in recent years. We believe that our employee benefit costs, including costs related to health care plans for our employees and former employees, will continue to rise. The increasing costs and funding requirements associated with our health care plans may adversely affect our results of operations, financial position, or liquidity. As we are a subsidiary of Xcel Energy, we may be negatively affected by events at Xcel Energy and its affiliates. If Xcel Energy were to become obligated to make payments under various guarantees and bond indemnities or to fund its other contingent liabilities, or if Xcel Energy’s credit ratings and access to capital were restricted, this could limit Xcel Energy’s ability to contribute equity or make loans to us, or may cause Xcel Energy to seek additional or accelerated funding from us in the form of dividends. If such event were to occur, we may need to seek alternative sources of funds to meet our cash needs. If either Standard & Poor’s or Moody’s were to downgrade Xcel Energy’s credit rating below investment grade, Xcel Energy may be required to provide credit enhancements in the form of cash collateral, letters of credit or other security to satisfy part or potentially all of these exposures. If either Standard & Poor’s or Moody’s were to downgrade Xcel Energy’s debt securities below investment grade, it would increase Xcel Energy’s cost of capital and restrict its access to the capital markets. This could limit Xcel Energy’s ability to contribute equity or make loans to us, or may cause Xcel Energy to seek additional or accelerated funding from us in the form of dividends. If such event were to occur, we may need to seek alternative sources of funds to meet our cash needs. As of Dec. 31, 2007, Xcel Energy had approximately $6.3 billion of long-term debt and $1.7 billion of short-term debt or current maturities. Xcel Energy provides various guarantees and bond indemnities supporting some of its subsidiaries by guaranteeing the payment or performance by these subsidiaries of specified agreements or transactions. Xcel Energy also has other contingent liabilities resulting from various tax disputes and other matters. Xcel Energy’s exposure under the guarantees is based upon the net liability of the relevant subsidiary under the specified agreements or transactions. The majority of Xcel Energy’s guarantees limit its exposure to a maximum amount that is stated in the guarantees. As of Dec. 31, 2007, Xcel Energy had guarantees outstanding with a maximum stated amount of approximately $76.2 million and $0.1 million of exposure. Xcel Energy has also provided indemnities to sureties in respect of bonds for the benefit of its subsidiaries. The total amount of bonds with these indemnities outstanding as of Dec. 31, 2007, was approximately $31.6 million. Xcel Energy’s total exposure under these indemnities cannot be determined at this time. If Xcel Energy were to become obligated to make payments under these guarantees and bond indemnities or become obligated to fund the other contingent liabilities, it could limit Xcel Energy’s ability to contribute equity or make loans to us, or may cause Xcel Energy to seek additional or accelerated funding from us in the form of dividends. If such event were to occur, we may need to seek alternative sources of funds to meet our cash needs.

24
We are a wholly owned subsidiary of Xcel Energy. Xcel Energy can exercise substantial control over our dividend policy and business and operations and may exercise that control in a manner that may be perceived to be adverse to our interests. Our board of directors, as well as many of our executive officers, are officers of Xcel Energy. Our board makes determinations with respect to a number of significant corporate events, including the payment of our dividends. We have historically paid quarterly dividends to Xcel Energy. In 2007, 2006 and 2005 we paid $226.8 million, $219.6 million and $215.3 million of dividends to Xcel Energy, respectively. If Xcel Energy’s cash requirements increase, our board of directors could decide to increase the dividends we pay to Xcel Energy to help support Xcel Energy’s cash needs. This could adversely affect our liquidity. The amount of dividends that we can pay is also limited to some extent by our indenture for our first mortgage bonds. Item 1B — Unresolved SEC Staff Comments None. Item 2 — Properties Virtually all of the utility plant of NSP-Minnesota is subject to the lien of its first mortgage bond indenture. Electric utility generating stations:
Station, City and Unit Fuel Installed
Summer 2007 Net Dependable
Capability (MW) Steam: Sherburne-Becker, MN
Unit 1 ............................................................... Coal 1976 697 Unit 2 ............................................................... Coal 1977 682 Unit 3 ............................................................... Coal 1987 504 (a)
Prairie Island-Welch, MN Unit 1 ............................................................... Nuclear 1973 551 Unit 2 ............................................................... Nuclear 1974 545
Monticello-Monticello, MN................................. Nuclear 1971 572 King-Bayport, MN............................................... Coal 1968 528 Black Dog-Burnsville, MN
2 Units..............................................................
Coal/Natural Gas 1955-1960 282
2 Units.............................................................. Natural Gas 1987-2002 298 High Bridge-St. Paul, MN
2 Units.............................................................. Coal 1956-1959 271 (b)Riverside-Minneapolis, MN
2 Units.............................................................. Coal 1964-1987 381 Combustion Turbine: Angus Anson-Sioux Falls, SD
3 Units.............................................................. Natural Gas 1994-2005 384 Inver Hills-Inver Grove Heights, MN
6 Units.............................................................. Natural Gas 1972 350 Blue Lake-Shakopee, MN
6 Units.............................................................. Natural Gas 1974-2005 490 Other .................................................................... Various Various 169 Total 6,704
(a) Based on NSP-Minnesota’s ownership interest of 59 percent. (b) High Bridge coal units were removed from service on August 31, 2007.

25
Electric utility overhead and underground transmission and distribution lines (measured in conductor miles) at Dec. 31, 2007: Conductor Miles 500 KV ............................................................................ 2,917 345 KV ............................................................................ 5,564 230 KV ............................................................................ 1,801 161 KV ............................................................................ 295 115 KV ............................................................................ 6,577 Less than 115 KV ............................................................ 82,100 NSP-Minnesota had 367 electric utility transmission and distribution substations at Dec. 31, 2007. Natural gas utility mains at Dec. 31, 2007: Miles Transmission.................................................................... 135 Distribution...................................................................... 9,446 Item 3 — Legal Proceedings In the normal course of business, various lawsuits and claims have arisen against NSP-Minnesota. Management, after consultation with legal counsel, has recorded an estimate of the probable cost of settlement or other disposition for such matters. Other Matters For a discussion of legal claims and environmental proceedings, see Note 12 to the consolidated financial statements under Item 8, incorporated by reference. For a discussion of proceedings involving utility rates, see Pending and Recently Concluded Regulatory Proceedings under Item 1 and Note 11 to the consolidated financial statements under Item 8, incorporated by reference. Item 4 — Submission of Matters to a Vote of Security Holders This is omitted per conditions set forth in general instructions I(1)(a) and (b) of Form 10-K for wholly owned subsidiaries (reduced disclosure format).
PART II Item 5 — Market for Registrant’s Common Equity, Related Stockholder Matters and Issuer Purchases of Equity Securities NSP-Minnesota is a wholly owned subsidiary and there is no market for its common equity securities. NSP-Minnesota’s first mortgage indenture places certain restrictions on the amount of cash dividends it can pay to Xcel Energy, the holder of its common stock. Even with these restrictions, NSP-Minnesota could have paid more than $946 million in additional cash dividends on common stock at Dec. 31, 2007. In addition, NSP-Minnesota had dividend restrictions imposed by its credit agreement, FERC rules and state regulatory commissions.
• Dividends are subject to the FERC’s jurisdiction under the Federal Power Act, which prohibits the payment of dividends out of capital accounts; payment of dividends is allowed out of retained earnings only.
• Covenant restrictions under NSP-Minnesota’s credit agreement include a required debt to total capital ratio. • State regulatory commissions indirectly limit the amount of dividends NSP-Minnesota can pay to Xcel Energy by
requiring a minimum equity ratio of 45.99%. The dividends declared during 2007 and 2006 were as follows:
Quarter Ended (Thousands of Dollars)
March 31, 2007 June 30, 2007 Sept. 30, 2007 Dec. 31, 2007
$ 57,124 $ 57,312 $ 56,282 $ 56,094

26
March 31, 2006 June 30, 2006 Sept. 30, 2006 Dec. 31, 2006
$ 54,616 $ 55,344 $ 55,025 $ 56,104 Item 6 — Selected Financial Data This is omitted per conditions set forth in general instructions I(1)(a) and (b) of Form 10-K for wholly owned subsidiaries (reduced disclosure format). Item 7 — Management’s Discussion and Analysis of Financial Condition and Results of Operations Discussion of financial condition and liquidity for NSP-Minnesota is omitted per conditions set forth in general instructions I (1)(a) and (b) of Form 10-K for wholly owned subsidiaries. It is replaced with management’s narrative analysis and the results of operations for the current year as set forth in general instructions I(2)(a) of Form 10-K for wholly owned subsidiaries (reduced disclosure format). Forward Looking Information The following discussion and analysis by management focuses on those factors that had a material effect on the financial condition and results of operations of NSP-Minnesota during the periods presented, or are expected to have a material impact in the future. It should be read in conjunction with the respective accompanying consolidated financial statements and notes to the consolidated financial statements. Except for the historical statements contained in this report, the matters discussed in the following discussion and analysis are forward-looking statements that are subject to certain risks, uncertainties and assumptions. Such forward-looking statements are intended to be identified in this document by the words “anticipate,” “believe,” “estimate,” “expect,” “intend,” “may,” “objective,” “outlook,” “plan,” “project,” “possible,” “potential,” “should” and similar expressions. Actual results may vary materially. Forward-looking statements speak only as of the date they are made and we do not undertake any obligation to update them to reflect changes that occur after that date. Factors that could cause actual results to differ materially include, but are not limited to: general economic conditions, including the availability of credit and its impact on capital expenditures and the ability of Xcel Energy and its subsidiaries to obtain financing on favorable terms; business conditions in the energy industry; actions of credit rating agencies; competitive factors, including the extent and timing of the entry of additional competition in the markets served by NSP-Minnesota; unusual weather; effects of geopolitical events, including war and acts of terrorism; state, federal and foreign legislative and regulatory initiatives that affect cost and investment recovery, have an impact on rates, have an impact on asset operation or ownership or impose environmental compliance conditions; structures that affect the speed and degree to which competition enters the electric and natural gas markets; costs and other effects of legal and administrative proceedings, settlements, investigations and claims; actions of accounting regulatory bodies; the items described under “Risk Factors” in Item 1A and Exhibit 99.01 of NSP-Minnesota’s Form 10-K for the year ended Dec. 31, 2007. Results of Operations NSP-Minnesota’s net income was approximately $267.3 million for 2007, compared with approximately $272.3 million for 2006. Electric Utility, Short-Term Wholesale and Commodity Trading Margins Electric fuel and purchased power expenses tend to vary with changing retail and wholesale sales requirements and unit cost changes in fuel and purchased power. Due to fuel and purchased energy cost-recovery mechanisms for customers, most fluctuations in energy costs do not materially affect electric utility margin. NSP-Minnesota has two distinct forms of wholesale sales: short-term wholesale and commodity trading. Short-term wholesale refers to energy-related purchase and sales activity and the use of certain financial instruments associated with the fuel required for and energy produced from, NSP-Minnesota’s generation assets and energy and capacity purchased to serve native load. Commodity trading is not associated with NSP-Minnesota’s generation assets or the energy or capacity purchased to serve native load. Short-term wholesale and commodity trading activities are considered part of the electric utility segment. Margins from commodity trading activity conducted at NSP-Minnesota are partially redistributed between PSCo and SPS, both wholly owned subsidiaries of Xcel Energy, pursuant to the JOA approved by the FERC. Margins received pursuant to the JOA are reflected as part of base electric utility revenues. Commodity trading revenues, as discussed in Note 1 to the consolidated financial statements, are reported net of related costs (i.e., on a margin basis) in the consolidated statements of

27
income. Commodity trading expenses include purchased power, transmission, broker fees and other related costs. Short-term wholesale and commodity trading margins reflect the estimated impact of regulatory sharing of margins, if applicable. The following table details the revenues and margin for base electric utility, short-term wholesale and commodity trading activities:
(Millions of Dollars)
Base Electric Utility
Short-TermWholesale
Commodity Trading
ConsolidatedTotals
2007 Electric utility revenues (excluding commodity
trading)........................................................................ $ 3,329 $ 145 $ — $ 3,474 Electric fuel and purchased power.................................. (1,442 ) (135 ) — (1,577)Commodity trading revenues.......................................... — — 112 112 Commodity trading expenses.......................................... — — (109 ) (109)Gross margin before operating expenses ........................ $ 1,887 $ 10 $ 3 $ 1,900 Margin as a percentage of revenues................................ 56.7 % 6.9 % 2.7 % 53.0% 2006 Electric utility revenues (excluding commodity
trading)........................................................................ $ 3,084 $ 178 $ — $ 3,262 Electric fuel and purchased power.................................. (1,287 ) (159 ) — (1,446)Commodity trading revenues.......................................... — — 131 131 Commodity trading expenses.......................................... — — (128 ) (128)Gross margin before operating expenses ........................ $ 1,797 $ 19 $ 3 $ 1,819 Margin as a percentage of revenues................................ 58.3 % 10.7 % 2.3 % 53.6% The following summarizes the components of the changes in base electric revenues and base electric margin for the year ended Dec. 31: Base Electric Revenues (Millions of dollars) 2007 vs. 2006 Fuel and purchased power cost recovery ................................................................. $ 84 Interchange agreement billing with NSP-Wisconsin ............................................... 50 MERP rider.............................................................................................................. 29 Retail sales growth (excluding weather impact) ...................................................... 22 Service and facility fees........................................................................................... 18 Transmission revenues............................................................................................. 17 Estimated impact of weather.................................................................................... 11 Conservation and non-fuel riders............................................................................. 6 Firm wholesale......................................................................................................... 5 Other ........................................................................................................................ 3
Total increase in base electric revenues............................................................... $ 245 Base Electric Margin (Millions of dollars) 2007 vs. 2006 MERP rider........................................................................................................................... $ 29 Retail sales growth (excluding weather impact) ................................................................... 22 Service and facility fees........................................................................................................ 18 Estimated impact of weather................................................................................................. 11 Conservation and non-fuel riders.......................................................................................... 6 Purchased capacity costs....................................................................................................... (12 ) Other, including fuel recovery and transmission .................................................................. 16
Total increase in base electric margin............................................................................... $ 90 Natural Gas Utility Margins — The following table details natural gas revenues and margin. The cost of natural gas tends to vary with changing sales requirements and unit cost of natural gas purchases. However, due to purchased natural gas cost
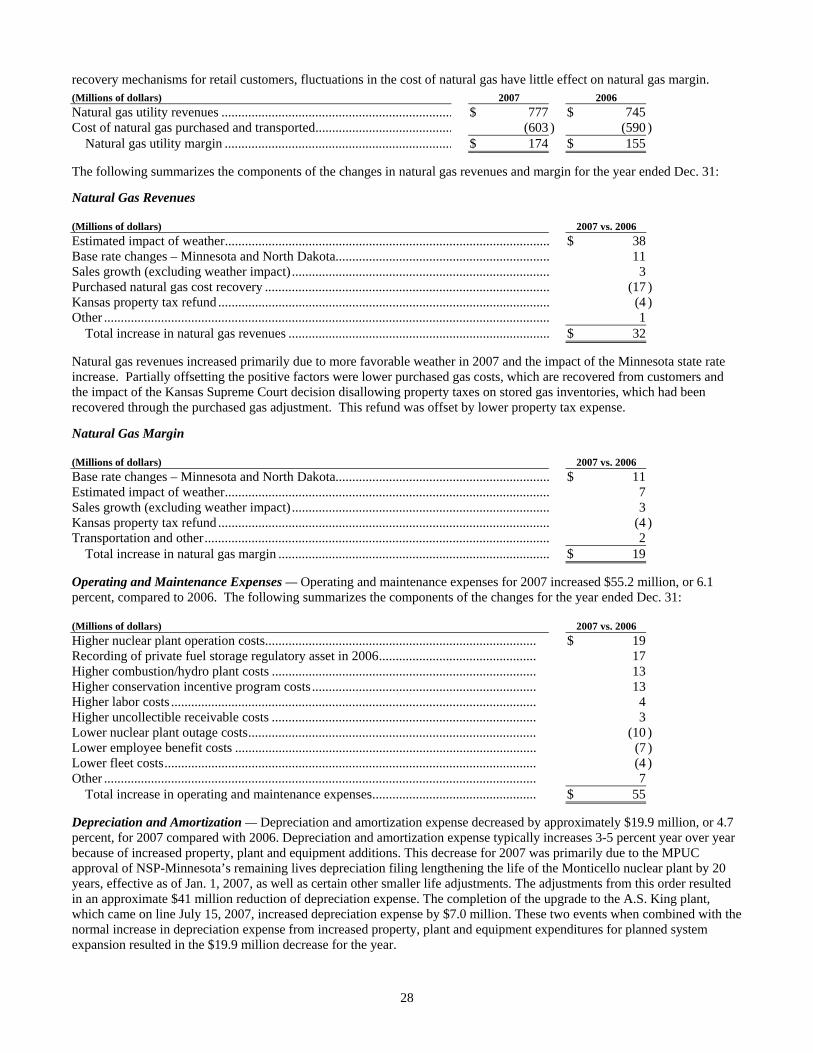
28
recovery mechanisms for retail customers, fluctuations in the cost of natural gas have little effect on natural gas margin.
(Millions of dollars) 2007 2006 Natural gas utility revenues ..................................................................... $ 777 $ 745 Cost of natural gas purchased and transported......................................... (603 ) (590 )
Natural gas utility margin .................................................................... $ 174 $ 155 The following summarizes the components of the changes in natural gas revenues and margin for the year ended Dec. 31: Natural Gas Revenues (Millions of dollars) 2007 vs. 2006 Estimated impact of weather................................................................................................. $ 38 Base rate changes – Minnesota and North Dakota................................................................ 11 Sales growth (excluding weather impact) ............................................................................. 3 Purchased natural gas cost recovery ..................................................................................... (17 ) Kansas property tax refund ................................................................................................... (4 ) Other ..................................................................................................................................... 1
Total increase in natural gas revenues .............................................................................. $ 32 Natural gas revenues increased primarily due to more favorable weather in 2007 and the impact of the Minnesota state rate increase. Partially offsetting the positive factors were lower purchased gas costs, which are recovered from customers and the impact of the Kansas Supreme Court decision disallowing property taxes on stored gas inventories, which had been recovered through the purchased gas adjustment. This refund was offset by lower property tax expense. Natural Gas Margin (Millions of dollars) 2007 vs. 2006 Base rate changes – Minnesota and North Dakota................................................................ $ 11 Estimated impact of weather................................................................................................. 7 Sales growth (excluding weather impact) ............................................................................. 3 Kansas property tax refund ................................................................................................... (4 ) Transportation and other....................................................................................................... 2
Total increase in natural gas margin ................................................................................. $ 19 Operating and Maintenance Expenses — Operating and maintenance expenses for 2007 increased $55.2 million, or 6.1 percent, compared to 2006. The following summarizes the components of the changes for the year ended Dec. 31: (Millions of dollars) 2007 vs. 2006 Higher nuclear plant operation costs................................................................................. $ 19 Recording of private fuel storage regulatory asset in 2006............................................... 17 Higher combustion/hydro plant costs ............................................................................... 13 Higher conservation incentive program costs................................................................... 13 Higher labor costs ............................................................................................................. 4 Higher uncollectible receivable costs ............................................................................... 3 Lower nuclear plant outage costs...................................................................................... (10 ) Lower employee benefit costs .......................................................................................... (7 ) Lower fleet costs............................................................................................................... (4 ) Other ................................................................................................................................. 7
Total increase in operating and maintenance expenses................................................. $ 55 Depreciation and Amortization — Depreciation and amortization expense decreased by approximately $19.9 million, or 4.7 percent, for 2007 compared with 2006. Depreciation and amortization expense typically increases 3-5 percent year over year because of increased property, plant and equipment additions. This decrease for 2007 was primarily due to the MPUC approval of NSP-Minnesota’s remaining lives depreciation filing lengthening the life of the Monticello nuclear plant by 20 years, effective as of Jan. 1, 2007, as well as certain other smaller life adjustments. The adjustments from this order resulted in an approximate $41 million reduction of depreciation expense. The completion of the upgrade to the A.S. King plant, which came on line July 15, 2007, increased depreciation expense by $7.0 million. These two events when combined with the normal increase in depreciation expense from increased property, plant and equipment expenditures for planned system expansion resulted in the $19.9 million decrease for the year.

29
Interest Charges — Interest charges increased by approximately $20.9 million, or 12.6 percent, for 2007, compared with 2006. The increase was due to higher average debt balances. AFDC — AFDC is a non-cash amount capitalized as a part of construction costs representing the cost of financing the construction. Generally, these costs are recovered from customers, in future rates, as the related property is depreciated. NSP-Minnesota’s MERP project consists of converting two coal-fueled electric generating plants located in the Minneapolis - St. Paul metropolitan area to natural gas and installing advanced pollution control equipment at a third coal-fired plant. The first of these projects began operating in July 2007 with the remaining two expected to begin operations in 2008 and 2009. AFDC, resulting in part from these projects, increased by approximately $3.8 million, or 10.8 percent for 2007 compared with the same period in 2006. The increase was partially offset by the current recovery from customers of the financing costs related to MERP through a rate rider, resulting in a lower recognition of AFDC. Income taxes — Income tax expense increased by approximately $54.4 million for 2007 compared with 2006. The increase in tax expense in 2007 was primarily due to an increase in pretax income and higher state tax expense in 2007, and the reversal of a $9.8 million regulatory reserve in 2006. The effective tax rate was 40.5 percent for 2007, compared with 31.9 percent for 2006. Without these charges and benefits, the effective tax rate for 2007 and 2006 would have been 37.8 percent and 36.4 percent, respectively. Item 7A — Quantitative and Qualitative Disclosures About Market Risk DERIVATIVES, RISK MANAGEMENT AND MARKET RISK In the normal course of business, NSP-Minnesota is exposed to a variety of market risks. Market risk is the potential loss that may occur as a result of changes in the market or fair value of a particular instrument or commodity. All financial and commodity-related instruments, including derivatives, are subject to market risk. These risks, as applicable to NSP-Minnesota, are discussed in further detail below. Commodity Price Risk — NSP-Minnesota is exposed to commodity price risk in its electric and natural gas operations. Commodity price risk is managed by entering into both long- and short-term physical purchase and sales contracts for electric capacity, energy and energy-related products and for various fuels used in the generation and distribution activities. Commodity price risk is also managed through the use of financial derivative instruments. NSP-Minnesota’s risk-management policy allows it to manage commodity price risk within each rate-regulated operation to the extent such exposure exists, as allowed by regulation. Short-Term Wholesale and Commodity Trading Risk — NSP Minnesota conducts various short-term wholesale and commodity trading activities, including the purchase and sale of capacity, energy and energy-related instruments. These marketing activities generally have terms of less than one year in length. NSP Minnesota’s risk-management policy allows management to conduct these activities within guidelines and limitations as approved by its risk management committee, which is made up of management personnel not directly involved in the activities governed by the policy. The fair value of the commodity trading contracts at Dec. 31, 2007, were as follows: (Millions of Dollars) Fair value of trading contracts outstanding at Jan. 1, 2007.................................. $ (1.3 ) Contracts realized or settled during the year........................................................ (12.1 ) Fair value of trading contract additions and changes during the year.................. 15.5 Fair value of trading contracts outstanding at Dec. 31, 2007............................... $ 2.1 At Dec. 31, 2007, the fair values by source for the commodity trading net asset or liability balances were as follows: Futures/Forwards
(Thousands of Dollars) Source of
Fair Value
Maturity Less Than
1 Year Maturity
1 to 3 Years
Maturity 4 to 5 Years
Maturity Greater
Than 5 Years
Total Futures/Forwards Fair
Fair Value Futures/Forwards Fair
Value.............................. 1 $ (2,499 ) $ — $ — $ — $ (2,499 ) 2 3,769 980 — — 4,749 $ 1,270 $ 980 $ — $ — $ 2,250

30
Options
(Thousands of Dollars) Source of
Fair Value
Maturity Less Than
1 Year Maturity
1 to 3Years
Maturity 4 to 5 Years
Maturity Greater
Than 5 Years Total Options
Fair Value Options Fair Value............. 2 $ (139 ) $ — $ — $ — $ (139 ) $ (139 ) $ — $ — $ — $ (139 )
(1) — Prices actively quoted or based on actively quoted prices. (2) — Prices based on models and other valuation methods. These represent the fair value of positions calculated using
internal models when directly and indirectly quoted external prices or prices derived from external sources are not available. Internal models incorporate the use of options pricing and estimates of the present value of cash flows based upon underlying contractual terms. The models reflect management’s estimates, taking into account observable market prices, estimated market prices in the absence of quoted market prices, the risk-free market discount rate, volatility factors, estimated correlations of commodity prices and contractual volumes. Market price uncertainty and other risks also are factored into the model.
Normal purchases and sales transactions, as defined by SFAS No. 133, hedge transactions and certain other long-term power purchase contracts are not included in the fair values by source tables as they are not recorded at fair value as part of commodity trading operations. NSP-Minnesota’s short-term wholesale and commodity trading operations measure the outstanding risk exposure to price changes on transactions, contracts and obligations that have been entered into, but not closed, using an industry standard methodology known as VaR. VaR expresses the potential change in fair value on the outstanding transactions, contracts and obligations over a particular period of time, with a given confidence interval under normal market conditions. NSP-Minnesota utilizes the variance/covariance approach in calculating VaR. The VaR model employs a 95-percent confidence interval level based on historical price movement, lognormal price distribution assumption, delta half-gamma approach for non-linear instruments and a three-day holding period for both electricity and natural gas. VaR is calculated on a consolidated basis. The VaRs for the commodity trading operations were: Year ended During 2007 (Millions of Dollars) Dec. 31, 2007 Average High Low Commodity trading (a) ......................................................... $ 0.26 $ 0.47 $ 1.45 $ 0.09 Year ended During 2006 (Millions of Dollars) Dec. 31, 2006 Average High Low Commodity trading (a) ......................................................... $ 0.49 $ 1.32 $ 2.60 $ 0.39
(a) Comprises transactions for NSP-Minnesota, PSCo and SPS. Interest Rate Risk — NSP-Minnesota is subject to the risk of fluctuating interest rates in the normal course of business. NSP-Minnesota’s risk management policy allows interest rate risk to be managed through the use of fixed rate debt, floating rate debt and interest rate derivatives such as swaps, caps, collars and put or call options, subject to regulatory approval when required. At Dec. 31, 2007, a 100-basis-point change in the benchmark rate on NSP-Minnesota’s variable rate debt would impact pretax interest expense by approximately $4.2 million. NSP-Minnesota also maintains trust funds, as required by the NRC, to fund certain costs of nuclear decommissioning. At Dec. 31, 2007, these funds were invested primarily in domestic and international equity securities and fixed-rate fixed-income securities. These funds may be used only for activities related to nuclear decommissioning. The accounting for nuclear decommissioning recognizes that costs are recovered through rates; therefore fluctuations in equity prices, or interest rates do not have an impact on earnings. Credit Risk — NSP-Minnesota is also exposed to credit risk. Credit risk relates to the risk of loss resulting from the nonperformance by a counterparty of its contractual obligations. NSP-Minnesota maintains credit policies intended to minimize overall credit risk and actively monitors these policies to reflect changes and scope of operations.

31
NSP-Minnesota conducts standard credit reviews for all counterparties. NSP-Minnesota employs additional credit risk control mechanisms, such as letters of credit, parental guarantees, standardized master netting agreements and termination provisions that allow for offsetting of positive and negative exposures. The credit exposure is monitored and, when necessary, the activity with a specific counterparty is limited until credit enhancement is provided. At Dec. 31, 2007, a 10-percent increase in prices would have resulted in a net mark-to-market increase in credit risk exposure of $3.6 million, while a decrease of 10 percent would have resulted in a decrease of $2.6 million.

32
Item 8 — Financial Statements and Supplementary Data Management Report on Internal Controls Over Financial Reporting The management of NSP-Minnesota is responsible for establishing and maintaining adequate internal control over financial reporting. NSP-Minnesota’s internal control system was designed to provide reasonable assurance to the company’s management and board of directors regarding the preparation and fair presentation of published financial statements. All internal control systems, no matter how well designed, have inherent limitations. Therefore, even those systems determined to be effective can provide only reasonable assurance with respect to financial statement preparation and presentation. NSP-Minnesota management assessed the effectiveness of the company’s internal control over financial reporting as of Dec. 31, 2007. In making this assessment, it used the criteria set forth by the Committee of Sponsoring Organizations of the Treadway Commission (COSO) in Internal Control – Integrated Framework. Based on our assessment, we believe that, as of Dec. 31, 2007, the company’s internal control over financial reporting is effective based on those criteria. This annual report does not include an attestation report of NSP-Minnesota’s registered public accounting firm regarding internal control over financial reporting. Management’s report was not subject to attestation by NSP-Minnesota’s registered public accounting firm pursuant to temporary rules of the Securities and Exchange Commission that permit NSP-Minnesota to provide only management’s report in this annual report. /S/ DAVID M. SPARBY /S/ BENJAMIN G.S. FOWKE III David M. Sparby Benjamin G.S. Fowke III Executive Vice President, Acting President and Chief Executive Officer
Vice President and Chief Financial Officer
February 25, 2008 February 25, 2008

33
REPORT OF INDEPENDENT REGISTERED PUBLIC ACCOUNTING FIRM Board of Directors and Stockholder Northern States Power Company—Minnesota We have audited the accompanying consolidated balance sheets and statements of capitalization of Northern States Power Company – Minnesota and subsidiaries (the “Company”) as of December 31, 2007 and 2006, and the related consolidated statements of income, common stockholder’s equity and comprehensive income, and cash flows for each of the three years in the period ended December 31, 2007. Our audits also included the financial statement schedule listed in the Index at Item 15. These financial statements and financial statement schedule are the responsibility of the Company’s management. Our responsibility is to express an opinion on the financial statements and financial statement schedule based on our audits. We conducted our audits in accordance with the standards of the Public Company Accounting Oversight Board (United States). Those standards require that we plan and perform the audit to obtain reasonable assurance about whether the financial statements are free of material misstatement. The Company is not required to have, nor were we engaged to perform, an audit of its internal control over financial reporting. Our audits included consideration of internal control as a basis for designing audit procedures that are appropriate in the circumstances, but not for the purpose of expressing an opinion on the effectiveness of the Company’s internal control over financial reporting. Accordingly, we express no such opinion. An audit also includes examining, on a test basis, evidence supporting the amounts and disclosures in the financial statements, assessing the accounting principles used and significant estimates made by management, as well as evaluating the overall financial statement presentation. We believe that our audits provide a reasonable basis for our opinion. In our opinion, such consolidated financial statements present fairly, in all material respects, the financial position of Northern States Power Company – Minnesota and subsidiaries as of December 31, 2007 and 2006, and the results of their operations and their cash flows for each of the three years in the period ended December 31, 2007, in conformity with accounting principles generally accepted in the United States of America. Also, in our opinion, such financial statement schedule, when considered in relation to the basic consolidated financial statements taken as a whole, presents fairly, in all material respects, the information set forth therein. As discussed in Note 6 to the consolidated financial statements, the Company adopted Financial Accounting Standards Board (FASB) Interpretation No. 48, “Accounting for Uncertainty in Income Taxes – an interpretation of FASB Statement No. 109,” as of January 1, 2007. /S/ DELOITTE & TOUCHE LLP Minneapolis, Minnesota February 20, 2008

34
NSP-MINNESOTA AND SUBSIDIARIES CONSOLIDATED STATEMENTS OF INCOME
(Thousands of Dollars) Year Ended Dec. 31 2007 2006 2005 Operating revenues
Electric utility .......................................................................................... $ 3,476,674 $ 3,265,371 $ 3,010,957 Natural gas utility .................................................................................... 776,971 744,635 821,922 Other ........................................................................................................ 18,569 17,609 20,705
Total operating revenues...................................................................... 4,272,214 4,027,615 3,853,584 Operating expenses
Electric fuel and purchased power........................................................... 1,576,901 1,445,590 1,329,553 Cost of natural gas sold and transported .................................................. 602,617 590,094 664,551 Cost of sales — nonregulated and other .................................................. 9,212 7,769 7,762 Operating and maintenance expenses ...................................................... 957,466 902,237 882,552 Depreciation and amortization................................................................. 405,569 425,511 372,956 Taxes (other than income taxes) .............................................................. 130,094 135,903 129,928
Total operating expenses ..................................................................... 3,681,859 3,507,104 3,387,302 Operating income....................................................................................... 590,355 520,511 466,282
Interest and other income — net.............................................................. 6,105 9,431 2,964 Allowance for funds used during construction — equity ........................ 21,826 20,896 16,416
Interest charges and financing costs
Interest charges — including financing costs of $5,271, $6,480 and $7,292, respectively ............................................................................. 186,293 165,381 150,261
Allowance for funds used during construction — debt ........................... (17,334 ) (14,459 ) (14,126 )Total interest charges and financing costs ........................................... 168,959 150,922 136,135
Income before income taxes ........................................................................ 449,327 399,916 349,527 Income taxes ................................................................................................ 182,025 127,606 111,783
Net income........................................................................................... $ 267,302 $ 272,310 $ 237,744
See Notes to Consolidated Financial Statements

35
NSP-MINNESOTA AND SUBSIDIARIES CONSOLIDATED STATEMENTS OF CASH FLOWS
(Thousands of Dollars) Year Ended Dec. 31 2007 2006 2005 Operating activities
Net income ............................................................................................................................ $ 267,302 $ 272,310 $ 237,744 Adjustments to reconcile net income to cash provided by operating activities:
Depreciation and amortization ......................................................................................... 415,651 433,883 378,884 Nuclear fuel amortization................................................................................................. 53,453 47,531 45,158 Deferred income taxes...................................................................................................... 172,004 (83,361 ) 28,846 Amortization of investment tax credits............................................................................ (3,897 ) (4,846 ) (6,611 )Allowance for equity funds used during construction..................................................... (21,826 ) (20,896 ) (16,416 )Net realized and unrealized hedging and derivative transactions ................................... (5 ) 17,587 (2,885 )Impairment of assets ........................................................................................................ — — 2,887 Changes in operating assets and liabilities (net of the effects of consolidation of
NMC Accounts receivable .................................................................................................... (62,772 ) 28,043 (102,347 )Accounts receivable from affiliates ............................................................................ 1,858 20,479 (45,064 )Accrued unbilled revenues.......................................................................................... (6,367 ) 37,994 (85,516 )Inventories ................................................................................................................... (52,226 ) (6,475 ) (27,855 )Recoverable purchased natural gas and electric energy costs .................................... (19,184 ) (1,347 ) (3,954 )Other current assets ..................................................................................................... (2,790 ) (1,905 ) 2,071 Accounts payable ........................................................................................................ (66,920 ) 49,691 121,975 Net regulatory assets and liabilities ............................................................................ (14,661 ) (79,181 ) (23,511 )Other current liabilities ............................................................................................... 7,624 (1,264 ) (22,933 )
Change in other noncurrent assets ................................................................................... 17,719 28,675 (5,373 )Change in other noncurrent liabilities.............................................................................. (38,139 ) 16,626 13,618
Net cash provided by operating activities................................................................... 646,824 753,544 488,718 Investing activities
Utility capital/construction expenditures .............................................................................. (1,060,796 ) (905,352 ) (693,028 )Allowance for equity funds used during construction.......................................................... 21,826 20,896 16,416 Purchase of investments in external decommissioning fund................................................ (712,462 ) (1,288,104 ) (576,001 )Proceeds from sale of investments in external decommissioning fund................................ 669,070 1,240,034 494,529 Cash obtained from consolidation of NMC.......................................................................... 38,950 — — Investments in utility money pool arrangement ................................................................... (423,500 ) (1,359,000 ) — Receipts from utility money pool arrangement .................................................................... 423,500 1,359,000 — Proceeds from sale of assets.................................................................................................. — — 11,228 Investments in affiliates ........................................................................................................ (371,250 ) (345,500 ) (374,904 )Advances from affiliates ....................................................................................................... 342,950 379,200 342,404 Other investments.................................................................................................................. 5,224 6,439 (13,929 )
Net cash used in investing activities ................................................................................ (1,066,488 ) (892,387 ) (793,285 ) Financing activities
Proceeds from (repayment of) short-term borrowings — net .............................................. 252,500 89,000 (90,000 )Proceeds from issuance of long-term debt............................................................................ 343,670 393,724 250,000 Repayment of long-term debt, including reacquisition premiums ....................................... (186,689 ) (210,662 ) (82,031 )Borrowings under utility money pool arrangement.............................................................. 937,600 — — Repayments under utility money pool arrangement ............................................................. (842,500 ) — — Borrowings under 5-year unsecured credit facility............................................................... 200,000 194,000 1,000,000 Repayments under 5-year unsecured credit facility.............................................................. (200,000 ) (444,000 ) (750,000 )Capital contributions from parent ......................................................................................... 150,514 313,856 224,247 Dividends paid to parent ....................................................................................................... (226,824 ) (219,598 ) (215,341 )
Net cash provided by financing activities........................................................................ 428,271 116,320 336,875 Net increase (decrease) in cash and cash equivalents................................................................ 8,607 (22,523 ) 32,308 Cash and cash equivalents at beginning of year ........................................................................ 16,019 38,542 6,234 Cash and cash equivalents at end of year................................................................................... $ 24,626 $ 16,019 $ 38,542 Supplemental disclosure of cash flow information
Cash paid for interest (net of amounts capitalized) .............................................................. $ 151,409 $ 145,585 $ 124,516 Cash paid for income taxes (net of refunds received) .......................................................... 50,016 227,285 122,456
Supplemental disclosure of non-cash flow information
Property, plant and equipment additions in accounts payable.............................................. $ 15,670 $ 36,613 $ 20,535
See Notes to Consolidated Financial Statements

36
NSP-MINNESOTA AND SUBSIDIARIES
CONSOLIDATED BALANCE SHEETS (Thousands of Dollars)
Dec. 31, 2007 Dec. 31, 2006 ASSETS Current assets:
Cash and cash equivalents................................................................................................................................... $ 24,626 $ 16,019 Notes receivable from affiliates .......................................................................................................................... 58,600 30,300 Accounts receivable, net of allowance for bad debts of $20,103 and $13,408, respectively ............................ 441,930 370,635 Accounts receivable from affiliates .................................................................................................................... 31,078 32,936 Accrued unbilled revenues.................................................................................................................................. 226,401 220,034 Recoverable purchased natural gas and electric energy costs ............................................................................ 36,857 17,673 Materials and supplies inventories...................................................................................................................... 93,853 93,183 Fuel inventories ................................................................................................................................................... 77,257 40,257 Natural gas inventories........................................................................................................................................ 99,528 85,016 Derivative instruments valuation ........................................................................................................................ 51,233 62,211 Prepayments and other ........................................................................................................................................ 52,875 32,708
Total current assets......................................................................................................................................... 1,194,238 1,000,972 Property, plant and equipment:
Electric utility plant............................................................................................................................................. 8,855,144 8,245,632 Natural gas utility plant ....................................................................................................................................... 890,371 859,533 Construction work in progress ............................................................................................................................ 818,276 917,275 Common utility and other property..................................................................................................................... 447,527 416,635
Total property, plant and equipment .............................................................................................................. 11,011,318 10,439,075 Less accumulated depreciation ........................................................................................................................... (4,708,496 ) (4,590,719 )Nuclear fuel — net of accumulated amortization: $1,291,370 and $1,237,917, respectively ........................... 179,859 140,152
Net property, plant and equipment................................................................................................................. 6,482,681 5,988,508 Other assets:
Nuclear decommissioning fund investments ...................................................................................................... 1,317,564 1,200,688 Regulatory assets................................................................................................................................................. 359,782 372,349 Prepaid pension asset .......................................................................................................................................... 270,436 276,571 Derivative instruments valuation ........................................................................................................................ 156,975 181,616 Other investments................................................................................................................................................ 20,034 30,892 Other .................................................................................................................................................................... 18,622 27,452
Total other assets ............................................................................................................................................ 2,143,413 2,089,568 Total assets ................................................................................................................................................ $ 9,820,332 $ 9,079,048
LIABILITIES AND EQUITY Current liabilities:
Current portion of long-term debt ....................................................................................................................... $ 31 $ 40 Short-term debt.................................................................................................................................................... 341,500 89,000 Borrowings under utility money pool arrangement............................................................................................ 95,100 — Accounts payable ................................................................................................................................................ 369,394 468,727 Accounts payable to affiliates ............................................................................................................................. 53,975 39,139 Taxes accrued ...................................................................................................................................................... 122,648 126,104 Accrued interest................................................................................................................................................... 61,485 48,308 Dividends payable to parent................................................................................................................................ 56,094 56,105 Derivative instruments valuation ........................................................................................................................ 23,311 36,167 Other .................................................................................................................................................................... 64,968 38,572
Total current liabilities ................................................................................................................................... 1,188,506 902,162 Deferred credits and other liabilities:
Deferred income taxes......................................................................................................................................... 898,725 708,772 Deferred investment tax credits .......................................................................................................................... 43,757 47,654 Asset retirement obligations................................................................................................................................ 1,264,368 1,311,271 Regulatory liabilities ........................................................................................................................................... 639,228 658,571 Derivative instruments valuation ........................................................................................................................ 236,832 248,981 Pension and employee benefit obligations.......................................................................................................... 201,624 209,548 Other liabilities .................................................................................................................................................... 68,585 69,229
Total deferred credits and other liabilities ..................................................................................................... 3,353,119 3,254,026 Commitments and contingent liabilities .................................................................................................................. Capitalization:
Long-term debt .................................................................................................................................................... 2,463,078 2,299,188 Common stock — authorized 5,000,000 shares of $0.01 par value; outstanding 1,000,000 shares.................. 10 10 Additional paid in capital .................................................................................................................................... 1,711,994 1,561,480 Retained earnings ................................................................................................................................................ 1,097,357 1,055,983 Accumulated other comprehensive income ........................................................................................................ 6,268 6,199
Total common stockholder’s equity............................................................................................................... 2,815,629 2,623,672 Total liabilities and equity......................................................................................................................... $ 9,820,332 $ 9,079,048
See Notes to Consolidated Financial Statements

37
NSP-MINNESOTA AND SUBSIDIARIES
CONSOLIDATED STATEMENTS OF COMMON STOCKHOLDER’S EQUITY AND COMPREHENSIVE INCOME
(Dollars in Thousands)
Common Stock Additional Paid Retained
Accumulated Other
Comprehensive Total
Stockholder’s Shares Amount in Capital Earnings Income (Loss) Equity Balance at Dec. 31, 2004 .................. 1,000,000 $ 10 $ 1,023,377 $ 983,940 $ — $ 2,007,327 Net income......................................... 237,744 237,744 Net derivative instrument fair
value changes during the period ............................................ — —
Comprehensive income for 2005....... 237,744 Common dividends declared to
parent............................................. (216,922 ) (216,922 )Contribution of capital by parent ....... 224,247 224,247 Balance at Dec. 31, 2005 .................. 1,000,000 $ 10 $ 1,247,624 $ 1,004,762 $ — $ 2,252,396 Net income......................................... 272,310 272,310 Net derivative instrument fair
value changes during the period, net of tax of $6,513 ........... 9,433 9,433
Comprehensive income for 2006....... 281,743 SFAS No. 158 adoption, net of
tax of $(2,233)............................... (3,234 ) (3,234 )Common dividends declared to
parent............................................. (221,089 ) (221,089 )Contribution of capital by parent ....... 313,856 313,856 Balance at Dec. 31, 2006 .................. 1,000,000 $ 10 $ 1,561,480 $ 1,055,983 $ 6,199 $ 2,623,672 FIN 48 adoption................................. 884 884 Net income......................................... 267,302 267,302 Changes in unrecognized
amounts of pension and retiree medical benefits, net of tax of $(551).............................. 797 797
Net derivative instrument fair value changes during the period, net of tax of $503 .............. (728 ) (728 )
Comprehensive income for 2007....... 268,255 Common dividends declared to
parent............................................. (226,812 ) (226,812 )Contribution of capital by parent ....... 150,514 150,514 Balance at Dec. 31, 2007 .................. 1,000,000 $ 10 $ 1,711,994 $ 1,097,357 $ 6,268 $ 2,815,629
See Notes to Consolidated Financial Statements

38
NSP-MINNESOTA AND SUBSIDIARIES CONSOLIDATED STATEMENTS OF CAPITALIZATION
(Thousands of Dollars) Dec. 31 2007 2006 Long-Term Debt First Mortgage Bonds, Series due:
Aug. 1, 2010, 4.75% ....................................................................................... $ 175,000 $ 175,000 Aug. 28, 2012, 8% .......................................................................................... 450,000 450,000 March 1, 2019, 8.5% (b) ................................................................................. 27,900 27,900 Sept. 1, 2019, 8.5% (b) ................................................................................... 100,000 100,000 July 1, 2025, 7.125% ...................................................................................... 250,000 250,000 March 1, 2028, 6.5%....................................................................................... 150,000 150,000 April 1, 2030, 8.5% (b) ................................................................................... 69,000 69,000 July 15, 2035, 5.25% ...................................................................................... 250,000 250,000 June 1, 2036, 6.25%........................................................................................ 400,000 400,000 July 1, 2037, 6.2% .......................................................................................... 350,000 —
Senior Notes due Aug. 1, 2009, 6.875%............................................................. 250,000 250,000 Retail Notes due July 1, 2042, 8%...................................................................... — 185,000 Other ................................................................................................................... 31 89 Unamortized discount ......................................................................................... (8,822 ) (7,761 )
Total............................................................................................................ 2,463,109 2,299,228 Less current maturities........................................................................................ 31 40
Total long-term debt ................................................................................... $ 2,463,078 $ 2,299,188 Common Stockholder’s Equity
Common stock — authorized 5,000,000 shares of $0.01 par value; outstanding 1,000,000 shares in 2007 and 2006 ......................................... $ 10 $ 10
Additional paid in capital................................................................................ 1,711,994 1,561,480 Retained earnings............................................................................................ 1,097,357 1,055,983 Accumulated other comprehensive income .................................................... 6,268 6,199
Total common stockholder’s equity............................................................ $ 2,815,629 $ 2,623,672
(a) Resource recovery financing
(b) Pollution control financing
See Notes to Consolidated Financial Statements

39
NOTES TO CONSOLIDATED FINANCIAL STATEMENTS
1. Summary of Significant Accounting Policies Business and System of Accounts — NSP-Minnesota is principally engaged in the generation, purchase, transmission, distribution and sale of electricity and in the purchase, transportation, distribution and sale of natural gas. NSP-Minnesota is subject to regulation by the FERC and state utility commissions. All of NSP-Minnesota’s accounting records conform to the FERC uniform system of accounts or to systems required by various state regulatory commissions, which are the same in all material respects. Principles of Consolidation — NSP-Minnesota has subsidiaries, which have been consolidated and for which all intercompany transactions and balances have been eliminated. During 2007, NSP-Minnesota became the sole remaining partner of NMC. This is the result of two of the remaining three partners leaving NMC during 2007. As a result, both companies were required to pay an exit fee and surrender their equity interest in NMC. NSP-Minnesota owns 100 percent of the equity and has a controlling interest. Revenue Recognition — Revenues related to the sale of energy are generally recorded when service is rendered or energy is delivered to customers. However, the determination of the energy sales to individual customers is based on the reading of their meter, which occurs on a systematic basis throughout the month. At the end of each month, amounts of energy delivered to customers since the date of the last meter reading are estimated and the corresponding unbilled revenue is estimated. NSP-Minnesota has various rate-adjustment mechanisms in place that currently provide for the recovery of purchased natural gas and electric fuel and purchased energy costs. These cost-adjustment tariffs may increase or decrease the level of costs recovered through base rates and are revised periodically, for any difference between the total amount collected under the clauses and the recoverable costs incurred. Where applicable under governing state regulatory commission rate orders, fuel costs over-recoveries (the excess of fuel revenue billed to customers over fuel costs incurred) are deferred as current regulatory liabilities and under-recoveries (the excess of fuel costs incurred over fuel revenues billed to customers) are deferred as current regulatory assets. In addition, NSP-Minnesota presents its revenue net of any excise or other fiduciary-type taxes or fees. A summary of significant rate adjustment mechanisms follows:
• NSP-Minnesota’s rates include a cost-of-fuel-and-purchased-energy and a cost-of-gas recovery mechanism allowing dollar-for-dollar recovery of the respective costs, which are trued-up on a two-month and annual basis, respectively. The electric cost-of-fuel-and-purchased-energy mechanism also provides a sharing among shareholders and customers of certain margins on short-term wholesale sales and commodity trading.
• NSP-Minnesota operates under various service quality standards, which could require customer refunds if certain criteria are not met. NSP-Minnesota’s rates also include monthly adjustments for the recovery of conservation and energy-management program costs, which are reviewed annually. NSP-Minnesota is allowed to recover certain costs associated with new transmission facilities to deliver renewable energy resources through a rate rider.
• NSP-Minnesota sells firm power and energy in wholesale markets, which are regulated by the FERC. Certain of these rates include monthly wholesale fuel cost-recovery mechanisms.
Commodity Trading Operations — All applicable gains and losses related to commodity trading activities, whether or not settled physically, are shown on a net basis in the consolidated statements of income. Pursuant to the JOA approved by the FERC, some of the commodity trading margins from NSP-Minnesota are apportioned to PSCo and SPS. Commodity trading activities are not associated with energy produced from NSP-Minnesota’s generation assets or energy and capacity purchased to serve native load. Commodity trading contracts are recorded at fair market value in accordance with SFAS No. 133 “Accounting for Derivative Instruments and Hedging Activities” (SFAS No. 133). In addition, commodity-trading results include the impact of all margin-sharing mechanisms. For more information, see Note 9 to the consolidated financial statements. Types of and Accounting for Derivative Instruments — NSP-Minnesota uses derivative instruments in connection with its utility commodity price, interest rate, short-term wholesale and commodity trading activities, including forward contracts, futures, swaps and options. All derivative instruments not designated and qualifying for the normal purchases and normal sales exception, as defined by SFAS No. 133, are recorded on the consolidated balance sheets at fair value as derivative instruments valuation. The classification of the fair value for those derivative instruments is dependent on the designation of a qualifying hedging relationship. The adjustment to fair value of derivative instruments not designated in a qualifying hedging relationship is reflected in current earnings or as a regulatory asset or liability. The classification is dependent on the

40
applicability of specific regulation. This includes certain instruments used to mitigate market risk for the utility operations and all instruments related to the commodity trading operations. Gains or losses on hedging transactions for the sales of energy or energy-related products are primarily recorded as a component of revenue; hedging transactions for fuel used in energy generation are recorded as a component of fuel costs; hedging transactions for natural gas purchased for resale are recorded as a component of natural gas costs; and interest rate hedging transactions are recorded as a component of interest expense. Certain utility subsidiaries are allowed to recover in electric or natural gas rates the costs of certain financial instruments purchased to reduce commodity cost volatility. Cash Flow Hedges – Qualifying hedging relationships are designated as a hedge of a forecasted transaction or future cash flow (cash flow hedge). The designation of a cash flow hedge permits the classification of fair value to be recorded within Other Comprehensive Income (OCI), to the extent effective. SFAS No. 133 requires that the hedging relationship be highly effective and that a company formally designate a hedging relationship to apply hedge accounting. NSP-Minnesota formally documents all hedging relationships in accordance with SFAS No. 133. The documentation includes, among other factors, the identification of the hedging instrument and the hedged transaction, as well as the risk management objectives and strategies for undertaking the hedged transaction. In addition, at inception and on a quarterly basis, NSP-Minnesota formally assesses whether the derivative instruments being used are highly effective in offsetting changes in either the fair value or cash flows of the hedged items. Changes in the fair value of a derivative designated and qualified as a cash flow hedge, to the extent effective, are included in OCI, until earnings are affected by the hedged transaction. NSP-Minnesota discontinues hedge accounting prospectively when it has determined that a derivative no longer qualifies as an effective hedge, or when it is no longer probable that the hedged forecasted transaction will occur. To test the effectiveness of hedges, a hypothetical hedge is used to mirror all the critical terms of the underlying debt and the dollar-offset method is utilized to assess the effectiveness of the actual hedge at inception and on an ongoing basis. The fair value of interest rate derivatives is determined through counterparty valuations, internal valuations and broker quotes. Gains and losses related to discontinued hedges that were previously accumulated in OCI will remain in OCI until the underlying contract is reflected in earnings; unless it is probable that the hedged forecasted transaction will not occur at which time associated deferred amounts in OCI are immediately recognized in current earnings. Normal Purchases and Normal Sales – NSP-Minnesota enters into contracts for the purchase and sale of commodities for use in their business operations. SFAS No. 133 requires a company to evaluate these contracts to determine whether the contracts are derivatives. Certain contracts that meet the definition of a derivative may be exempted from SFAS No. 133 as normal purchases or normal sales. NSP-Minnesota evaluates all of its contracts when such contracts are entered to determine if they are derivatives and, if so, if they qualify to meet the normal designation requirements under SFAS No. 133. None of the contracts entered into within the commodity trading operations qualify for a normal designation.. For further discussion of NSP-Minnesota’s risk management and derivative activities, see Note 9 to the consolidated financial statements. Property, Plant, and Equipment and Depreciation — Property, plant and equipment is stated at original cost. The cost of plant includes direct labor and materials, contracted work, overhead costs and applicable interest expense. The cost of plant retired is charged to accumulated depreciation and amortization. Removal costs associated with regulatory obligations are recorded as regulatory liabilities. Significant additions or improvements extending asset lives are capitalized, while repair and maintenance costs are charged to expense as incurred. Maintenance and replacement of items determined to be less than units of property are charged to operating expenses as incurred. Planned major maintenance activities are charged to operating expense unless the cost represents the acquisition of an additional unit of property or the replacement of an existing unit of property. Property, plant and equipment also includes costs associated with property held for future use. NSP-Minnesota records depreciation expense related to its plant by using the straight-line method over the plant’s useful life. Actuarial and semi-actuarial life studies are performed on a periodic basis and submitted to the state and federal commissions for review. Upon acceptance by the various commissions, the resulting lives and net salvage rates are used to calculate depreciation. Depreciation expense, expressed as a percentage of average depreciable property, for the years ended Dec. 31, 2007, 2006 and 2005 was 3.6 percent, 3.9 percent and 3.9 percent, respectively. AFDC — AFDC represents the cost of capital used to finance utility construction activity. AFDC is computed by applying a composite pretax rate to qualified construction work in progress. The amount of AFDC capitalized as a utility construction cost is credited to other income and deductions (for equity capital) and interest charges (for debt capital). AFDC amounts capitalized are included in NSP-Minnesota’s rate base for establishing utility service rates. In addition to construction-related amounts, AFDC also is recorded to reflect returns on capital used to finance conservation programs in Minnesota.

41
Generally AFDC costs are recovered from customers, in future rates, as the related property is depreciated. In 2003, the MPUC voted to approve NSP-Minnesota’s MERP proposal to convert two coal-fueled electric generating plants located in the Minneapolis-St. Paul metropolitan area to natural gas and to install advanced pollution control equipment at a third coal-fired plant. These improvements are expected to significantly reduce air emissions from these facilities, while increasing the capacity at system peak by 300 MW. The first of these projects began operating in July 2007 with the remaining two expected to begin operations in 2008 and 2009, at a cumulative investment of approximately $1 billion. The MPUC has approved a more current recovery of the financing costs related to the MERP. The in-service plant costs, including the financing costs during construction, are recovered from customers through a MERP rider resulting in a lower recognition of AFDC. Decommissioning — NSP-Minnesota accounts for the future cost of decommissioning, or retirement, of its nuclear generating plants through annual depreciation accruals using an annuity approach designed to provide for full rate recovery of the future decommissioning costs. The decommissioning calculation covers all expenses, including decontamination and removal of radioactive material and extends over the estimated lives of the plants. The calculation assumes that NSP-Minnesota will recover those costs through rates. The fair value of external nuclear decommissioning fund investments are determined based on quoted market prices for those or similar investments. Unrealized gains or losses on the fund’s assets are included with regulatory assets on the consolidated balance sheets. Nuclear Fuel Expense — Nuclear fuel expense, which is recorded as NSP-Minnesota’s nuclear generating plants use fuel, includes the cost of fuel used in the current period (including AFDC), as well as future disposal costs of spent nuclear fuel, costs associated with the end-of-life fuel segments and fees assessed by the DOE for NSP-Minnesota’s portion of the cost of decommissioning the DOE’s fuel enrichment facility. Environmental Costs — Environmental costs are recorded on an undiscounted basis when it is probable NSP-Minnesota is liable for the costs and the liability can be reasonably estimated. Costs may be deferred as a regulatory asset if it is probable that the costs will be recovered from customers in future rates. Otherwise, the costs are expensed. If an environmental expense is related to facilities currently in use, such as emission-control equipment, the cost is capitalized and depreciated over the life of the plant, assuming the costs are recoverable in future rates or future cash flow. Estimated remediation costs, excluding inflationary increases, are recorded. The estimates are based on experience, an assessment of the current situation and the technology currently available for use in the remediation. The recorded costs are regularly adjusted as estimates are revised and remediation proceeds. If several designated responsible parties exist, costs are estimated and recorded only for NSP-Minnesota’s expected share of the cost. Any future costs of restoring sites where operation may extend indefinitely are treated as a capitalized cost of plant retirement. The depreciation expense levels recoverable in rates include a provision for removal expenses, which may include final remediation costs. Removal costs recovered in rates are classified as a regulatory liability. Legal Costs — Litigation accruals are recorded when it is probable NSP-Minnesota is liable for the costs and the liability can be reasonably estimated. External legal fees related to settlements are expensed as incurred. Income Taxes — NSP-Minnesota accounts for income taxes using the asset and liability method under FAS 109, which requires the recognition of deferred tax assets and liabilities for the expected future tax consequences of events that have been included in the financial statements. NSP-Minnesota defers income taxes for all temporary differences between pretax financial and taxable income, and between the book and tax bases of assets and liabilities. NSP-Minnesota uses the tax rates that are scheduled to be in effect when the temporary differences are expected to turn around, or reverse. The effect of a change in tax rates on deferred tax assets and liabilities is recognized in income in the period that includes the enactment date. Deferred tax assets are reduced by a valuation allowance if, based on the weight of available evidence, it is more likely than not that some portion or all of the deferred tax asset will not be realized. In making such a determination, all available positive and negative evidence, including scheduled reversals of deferred tax liabilities, projected future taxable income, tax planning strategies and recent financial operations, is considered. Due to the effects of past regulatory practices, when deferred taxes were not required to be recorded, the reversal of some temporary differences are accounted for as current income tax expense. Investment tax credits are deferred and their benefits amortized over the estimated lives of the related property. Utility rate regulation also has created certain regulatory assets and liabilities related to income taxes, which are summarized in Note 14 to the consolidated financial statements. For more information on income taxes, see Note 6 to the consolidated financial statements. In July 2006, the FASB issued FIN 48, which prescribes how a company should recognize, measure, present and disclose uncertain tax positions that such company has taken or expects to take in its income tax returns. FIN 48 requires that only
42
income tax benefits that meet the “more likely than not” recognition threshold be recognized or continue to be recognized on its effective date. As required, NSP-Minnesota adopted FIN 48 as of Jan. 1, 2007 and the initial derecognition amounts were reported as a cumulative effect of a change in accounting principle. The cumulative effect of the change, which was reported as an adjustment to the beginning balance of retained earnings, was not material. Following implementation, the ongoing recognition of changes in measurement of uncertain tax positions will be reflected as a component of income tax expense. NSP-Minnesota reports interest and penalties related to income taxes within the interest charges section in the consolidated statements of income. Xcel Energy and its utility subsidiaries, including NSP-Minnesota, file consolidated federal and combined and separate state income tax returns. Income taxes for consolidated or combined subsidiaries are allocated to the subsidiaries based on separate company computations of taxable income or loss. The holding company also allocates its own net income tax benefits to its direct subsidiaries based on the positive tax liability of each company in the consolidated federal or combined state returns as a contribution of capital. Use of Estimates — In recording transactions and balances resulting from business operations, NSP-Minnesota uses estimates based on the best information available. Estimates are used for such items as plant depreciable lives, AROs, decommissioning, tax provisions, uncollectible amounts, environmental costs, unbilled revenues, jurisdictional fuel and energy cost allocations and actuarially determined benefit costs. The recorded estimates are revised when better information is obtained or actual amounts are determinable. Those revisions can affect operating results. Each year the depreciable lives of certain plant assets are reviewed and revised, if appropriate. Cash and Cash Equivalents — NSP-Minnesota considers investments in certain instruments, including commercial paper and money market funds, with a remaining maturity of three months or less at the time of purchase to be cash equivalents. Restricted Cash — At Dec. 31, 2007 and 2006, NSP-Minnesota had restricted cash of $8.4 million and $9.6 million, respectively. The restricted cash balances primarily represent margin deposits held in conjunction with electric futures trading contracts. These balances are presented as a component of other long-term assets on the consolidated balance sheets. Inventory — All inventory for NSP-Minnesota is recorded at average cost. Regulatory Accounting — NSP-Minnesota accounts for certain income and expense items in accordance with SFAS No. 71—“Accounting for the Effects of Certain Types of Regulation.” Under SFAS No. 71:
• certain costs, which would otherwise be charged to expense, are deferred as regulatory assets based on the expected ability to recover them in future rates; and
• certain credits, which would otherwise be reflected as income, are deferred as regulatory liabilities based on the expectation they will be returned to customers in future rates.
Estimates of recovering deferred costs and returning deferred credits are based on specific ratemaking decisions or precedent for each item. Regulatory assets and liabilities are amortized consistent with the period of expected regulatory treatment. If restructuring or other changes in the regulatory environment occur, NSP-Minnesota may no longer be eligible to apply this accounting treatment and may be required to eliminate such regulatory assets and liabilities from its balance sheet. Such changes could have a material effect on NSP-Minnesota’s results of operations in the period the write-off is recorded. See more discussion of regulatory assets and liabilities at Note 14 to the consolidated financial statements. Deferred Financing Costs — Other assets include deferred financing costs, net of amortization, of approximately $18.2 million and $20.4 million at Dec. 31, 2007 and 2006, respectively. NSP-Minnesota is amortizing these financing costs over the remaining maturity periods of the related debt. Debt premiums, discounts, expenses and amounts received or incurred to settle hedges are amortized over the life of the related debt. The premiums and costs associated with modified debt are deferred and amortized over the life of the related new issuance, in accordance with regulatory guidelines. If NSP-Minnesota extinguishes the debt, all unamortized balances shall be expensed at the time of the redemption. Accounts Receivable and Allowance for Bad Debts — Accounts receivable are stated at the actual billed amount net of the allowance for uncollectibles. NSP-Minnesota establishes an allowance for uncollectibles based on a reserve policy that reflects its expected exposure to the credit risk of customers. Renewable Energy Credits — Renewable Energy Credits (RECs) are marketable environmental commodities that represent proof that energy was generated from eligible renewable energy sources. These credits can be bought and sold. RECs are

43
typically used as a form of measurement of compliance to Renewable Portfolio Standards (RPS) enacted by those states that are encouraging construction and consumption of renewable energy, but can also be sold separately from the energy produced. Currently, NSP-MN acquires RECs from the generation or purchase of renewable power. When RECs are acquired in the course of generation or purchase as a result of meeting the load obligation, they are recorded as inventory at actual cost. REC’s acquired for trading purposes are recorded as other investments at actual cost. The cost of RECs that are retired for compliance purposes is recorded as electric fuel and purchased power. The net margin on sales of RECs for trading purposes is recorded as electric utility operating revenues net of any margin sharing requirements. As a result of state regulatory orders, we reduce recoverable fuel costs for the value of certain RECs and record the cost of RECs to satisfy future compliance requirements that are recoverable in future rates as regulatory assets under the criteria of SFAS No. 71. Emission Allowances — Emission allowances are recorded at cost, including the annual SO2 and NOx emission allowance entitlement received at no cost from the EPA. NSP-Minnesota follows the inventory model for all allowances. The sales of allowances are reported in the operating activities section of the consolidated statements of cash flows. The net margin on sales of emission allowances is included in electric utility operating revenues as it is integral to the production process of energy and our revenue optimization strategy for our utility operations. Reclassifications — The consolidated statements of cash flows have been reclassified from prior-period presentation. The reclassifications reflect the presentation of unbilled revenues, recoverable purchased natural gas and electric energy costs and regulatory assets and liabilities as separate items rather than components of other assets and other liabilities within net cash provided by operating activities. In addition, activity related to derivative transactions have been combined into net realized and unrealized hedging and derivative transactions. These reclassifications did not affect total operating, investing or financing within the consolidated statements of cash flows. 2. Recently Issued Accounting Pronouncements Fair Value Measurements (SFAS No. 157) — In September 2006, the FASB issued SFAS No. 157, which provides a single definition of fair value, together with a framework for measuring it and requires additional disclosure about the use of fair value to measure assets and liabilities. SFAS No. 157 also emphasizes that fair value is a market-based measurement and sets out a fair value hierarchy with the highest priority being quoted prices in active markets. Fair value measurements are disclosed by level within that hierarchy. SFAS No. 157 is effective for financial statements issued for fiscal years beginning after Nov. 15, 2007. NSP-Minnesota is evaluating the impact of SFAS No. 157 on its consolidated financial statements and does not expect the impact of implementation to be material. The Fair Value Option for Financial Assets and Financial Liabilities - Including an Amendment of FASB Statement No. 115 (SFAS No. 159) — In February 2007, the FASB issued SFAS No. 159, which provides companies with an option to measure, at specified election dates, many financial instruments and certain other items at fair value that are not currently measured at fair value. A company that adopts SFAS No. 159 will report unrealized gains and losses on items, for which the fair value option has been elected, in earnings at each subsequent reporting date. This statement also establishes presentation and disclosure requirements designed to facilitate comparisons between entities that choose different measurement attributes for similar types of assets and liabilities. This statement is effective for fiscal years beginning after Nov. 15, 2007, effective Jan. 1, 2008. NSP-Minnesota adopted SFAS No. 159 and the adoption did not have a material impact on its consolidated financial statements. Business Combinations (SFAS No. 141 (revised 2007)) — In December 2007, the FASB issued SFAS No. 141R, which establishes principles and requirements for how an acquirer in a business combination recognizes and measures in its financial statements the identifiable assets acquired, the liabilities assumed and any noncontrolling interest; recognizes and measures the goodwill acquired in the business combination or a gain from a bargain purchase; and determines what information to disclose to enable users of the financial statements to evaluate the nature and financial effects of the business combination. SFAS No. 141R is to be applied prospectively to business combinations for which the acquisition date is on or after the beginning of an entity’s fiscal year that begins on or after Dec. 15, 2008. NSP-Minnesota is evaluating the impact of SFAS No. 141R on its consolidated financial statements for any potential business combinations subsequent to Jan. 1, 2009. Noncontrolling Interests in Consolidated Financial Statements, an Amendment of ARB No. 51(SFAS No. 160) — In December 2007, the FASB issued SFAS No. 160, which establishes accounting and reporting standards that require the ownership interest in subsidiaries held by parties other than the parent be clearly identified and presented in the consolidated balance sheets within equity, but separate from the parent’s equity; the amount of consolidated net income attributable to the parent and the noncontrolling interest be clearly identified and presented on the face of the consolidated statement of earnings; and changes in a parent’s ownership interest while the parent retains its controlling financial interest in its

44
subsidiary be accounted for consistently. This statement is effective for fiscal years beginning on or after Dec. 15, 2008. NSP-Minnesota is evaluating the impact of SFAS No. 160 on its consolidated financial statements. 3. Short-Term Borrowings Commercial Paper — At Dec. 31, 2007 and 2006, NSP-Minnesota had commercial paper outstanding of $341.5 million and $89.0 million, respectively. The weighted average interest rates at Dec. 31, 2007 and 2006 were 5.58 percent and 5.45 percent, respectively. Money Pool - Xcel Energy has established a utility money pool arrangement that allows for short-term loans between the utility subsidiaries and from the holding company to the utility subsidiaries at market-based interest rates. The utility money pool arrangement does not allow loans from the utility subsidiaries to the holding company. NSP-Minnesota has approval to borrow up to $250 million under the arrangement. At Dec. 31, 2007, NSP-Minnesota had money pool borrowings of $95.1 million with a weighted average interest rate of 5.64 percent. 4. Long-Term Debt Credit Facilities — At Dec. 31, 2007, NSP-Minnesota had the following committed credit facility in effect, in millions of dollars: Credit Facility
Credit Facility Borrowings Available* Term Maturity
$ 500 $ — $ 152.4 Five year December 2011
* Net of credit facility borrowings, issued and outstanding letters of credit and commercial paper borrowings. The line of credit provides short-term financing in the form of notes payable to banks, letters of credit and back-up support for commercial paper borrowings. NSP-Minnesota has the right to request an extension of the final maturity date by one year. The maturity extension is subject to majority bank group approval. The credit facility has one financial covenant requiring that NSP-Minnesota’s debt-to-total capitalization ratio be less than or equal to 65 percent with which NSP-Minnesota was in compliance at Dec. 31, 2007. If NSP-Minnesota does not comply with the covenant, it is deemed an event of default and any outstanding amounts due under the facility can be declared due by the lender. The credit facility has a cross default provision that provides the borrower will be in default on its borrowings under the facility if any of its subsidiaries, comprising more than 15 percent of the consolidated assets, defaults on any of its indebtedness greater than $50 million. The interest rate is based on either the agent bank’s prime rate or the applicable LIBOR, plus a borrowing margin as based on NSP-Minnesota’s senior unsecured credit ratings from Moody, Standard & Poor and Fitch.
• At Dec. 31, 2007, NSP-Minnesota had no direct borrowings on this line of credit; however, the credit facility was used to provide back-up support for $341.5 million of commercial paper outstanding and $6.1 million of letters of credit
• At Dec. 31, 2006, NSP-Minnesota had no direct borrowings on this line of credit; however, the credit facility was used to provide back-up support for $89.0 million of commercial paper outstanding and $34.5 million of letters of credit.
• At Dec. 31, 2007, $7.2 million letters of credit were outstanding, of which $6.1 million were outstanding under the above credit facility.
• At Dec. 31, 2006, $35.3 million letters of credit were outstanding, of which $34.5 million were outstanding under the above credit facility.
Long-Term Borrowings On June 26, 2007, NSP-Minnesota issued $350 million of 6.20 percent first mortgage bonds, series due July 1, 2037. NSP-Minnesota added the net proceeds from the sale of the first mortgage bonds to its general funds and applied a portion of the proceeds to the repayment of commercial paper. On Aug. 1, 2007, NSP-Minnesota redeemed all of its outstanding 8.00 percent notes, series due 2042, at a redemption price equal to 100 percent of the principal amount of the notes ($25.00), plus accrued and unpaid interest on the notes, if any, to the redemption date. Upon redemption, Xcel Energy recognized approximately $9.3 million in interest expense due to unwinding a fair value interest rate derivative.

45
All property of NSP-Minnesota is subject to the lien of its first mortgage indenture. NSP-Minnesota’s first mortgage indenture places certain restrictions on the amount of cash dividends it can pay Xcel Energy, the holder of its common stock. Even with these restrictions, NSP-Minnesota could have paid more than $946 million in additional cash dividends on common stock at Dec. 31, 2007. Maturities of long-term debt are: (Millions of Dollars) 2008 ...................................................... $ —2009 ...................................................... 250.02010 ...................................................... 175.02011 ...................................................... —2012 ...................................................... 450.0 5. Joint Plant Ownership Following are the investments by NSP-Minnesota in jointly owned plants and the related ownership percentages as of Dec. 31, 2007:
(Thousands of Dollars) Plant in Service
AccumulatedDepreciation
Construction Work in Progress Ownership%
Sherco Unit 3 ....................................................................... $ 503,311 $ 313,733 $ 6,165 59.0 Sherco Common Facilities Units 1, 2 & 3 ........................... 109,836 61,681 62 75.0 Transmission facilities, including substations ..................... 4,832 2,130 — 59.0
Total................................................................................. $ 617,979 $ 377,544 $ 6,227 NSP-Minnesota is part owner of Sherco 3, an 860-MW, coal-fueled electric generating unit. NSP-Minnesota is the operating agent under the joint ownership agreement. NSP-Minnesota’s share of operating expenses and construction expenditures are included in the applicable utility accounts. Each of the respective owners is responsible for funding its portion of the construction costs. 6. Income Taxes Accounting for Uncertainty in Income Taxes — an interpretation of FASB Statement No. 109 (FIN 48) — NSP-Minnesota adopted FIN 48 as of Jan. 1, 2007. NSP-Minnesota is a member of the Xcel Energy affiliated group that files consolidated income tax returns. Xcel Energy has been audited by the Internal Revenue Service (IRS) through tax year 2003, with a limited exception for 2003 research tax credits. The IRS commenced an examination of Xcel Energy’s federal income tax returns for 2004 and 2005 (and research credits for 2003) in the third quarter of 2006, and that examination is anticipated to be complete by March 31, 2008. As of Dec. 31, 2007, the IRS had not proposed any material adjustments to tax years 2003 through 2005. The statute of limitations applicable to Xcel Energy’s 2000 through 2002 federal income tax returns expired as of June 30, 2007. NSP-Minnesota is currently under examination by the state of Minnesota for years 1998 through 2001. No material adjustments have been proposed as of Dec. 31, 2007. As of Dec. 31, 2007, NSP-Minnesota’s earliest open tax years in which an audit can be initiated by state taxing authorities under applicable statutes of limitations is 1998. The amount of unrecognized tax benefits reported was $22.5 million Jan. 1, 2007 and $14.3 million on Dec. 31, 2007. A reconciliation of the beginning and ending amount of unrecognized tax benefit is as follows: (Millions of Dollars) Balance at Jan. 1, 2007 ............................................................................ $ 22.5 Additions based on tax positions related to the current year.................... 5.6 Reductions based on tax positions related to the current year ................. (0.2 ) Additions for tax positions of prior years ................................................ 8.4 Reductions for tax positions of prior years .............................................. (3.4 ) Settlements with taxing authorities.......................................................... (18.6 ) Balance at Dec. 31, 2007 ......................................................................... $ 14.3 These unrecognized tax benefit amounts were reduced by the tax benefits associated with tax credit carryovers of $4.1 million and $2.2 million as of Jan. 1, 2007 and Dec. 31, 2007, respectively.

46
The unrecognized tax benefit balance was $5.5 million and $6.6 million of tax positions on Jan. 1, 2007 and Dec. 31, 2007, respectively, which if recognized would affect the annual effective tax rate. In addition, the unrecognized tax benefit balance included $17.0 million and $7.7 million of tax positions on Jan. 1, 2007 and Dec. 31, 2007, respectively, for which the ultimate deductibility is highly certain but for which there is uncertainty about the timing of such deductibility. A change in the period of deductibility would not affect the effective tax rate but would accelerate the payment of cash to the taxing authority to an earlier period. The decrease in the unrecognized tax benefit balance of $8.2 million from Jan. 1, 2007 to Dec. 31, 2007, was due to the addition of similar uncertain tax positions related to ongoing activity and the resolution of certain federal and state audit matters. NSP-Minnesota’s amount of unrecognized tax benefits could significantly change in the next 12 months as the IRS and state tax audits progress. At this time, due to the uncertain nature of the audit process, it is not reasonably possible to estimate an overall range of possible change. However, as the IRS and state taxing authorities complete the audits that are currently in progress, it is reasonably possible that the amount of unrecognized tax benefits could decrease up to $3 million. The liability for interest related to unrecognized tax benefits is partially offset by the interest benefit associated with tax credit carryovers. The amount of interest income related to unrecognized tax benefits reported within interest charges in 2007 was $0.6 million. The liability for interest related to unrecognized tax benefits was $1.9 million on Dec. 31, 2007. No amounts were accrued for penalties as of Dec. 31, 2007. Other Income Tax Matters — NSP-Minnesota’s federal net operating loss and tax credit carry forwards are estimated to be $20.6 million and $11.9 million, respectively, as of Dec. 31, 2007. The carry forward periods expire between 2021 and 2027. NSP-Minnesota also has state tax credit carry forwards of $1.3 million as of Dec. 31, 2007. The state carry forward periods expire between 2018 and 2022. Total income tax expense from operations differs from the amount computed by applying the statutory federal income tax rate to income before income tax expense. The following is a table reconciling such differences for the years ending Dec. 31: 2007 2006 2005 Federal statutory rate .................................................................................. 35.0 % 35.0 % 35.0 % Increases (decreases) in tax from:
State income taxes, net of federal income tax benefit............................. 8.4 3.6 4.6 Resolution of income tax audits and other.............................................. 0.4 (2.5 ) (1.2 ) Tax credits recognized, net of federal income tax expense..................... (1.5 ) (2.0 ) (2.8 ) Regulatory differences — utility plant items.......................................... (1.7 ) (1.6 ) (1.5 ) Life insurance policies ............................................................................ (0.2 ) (0.2 ) (0.2 ) FIN 48 expense – unrecognized tax benefits .......................................... 0.2 — — Other — net ............................................................................................ (0.1 ) (0.4 ) (1.9 )
Effective income tax rate ............................................................................ 40.5 % 31.9 % 32.0 % The components of income tax expense (benefit) for the years ending Dec. 31 were: (Thousands of Dollars) 2007 2006 2005 Current federal tax expense .......................................................... $ 15,277 $ 178,668 $ 81,518 Current state tax expense .............................................................. 4,987 37,145 8,065 Current FIN 48 tax expense (benefit) ........................................... (6,346 ) — — Current tax credits......................................................................... — — (35 )Deferred federal tax expense (benefit).......................................... 117,433 (66,226 ) 21,491 Deferred state tax expense (benefit) ............................................. 50,151 (13,752 ) 10,629 Deferred FIN 48 tax expense ........................................................ 7,416 — — Deferred tax credits....................................................................... (2,996 ) (3,383 ) (3,274 )Deferred investment tax credits .................................................... (3,897 ) (4,846 ) (6,611 )
Total income tax expense ......................................................... $ 182,025 $ 127,606 $ 111,783

47
The components of deferred income tax at Dec. 31 were: (Thousands of Dollars) 2007 2006 Deferred tax expense (benefit) excluding items below............................ $ 185,214 $ (144,209 )Amortization and adjustments to deferred income taxes on income
tax regulatory assets and liabilities ...................................................... (26,444 ) 65,142 FIN 48 adoption: Deferred tax expense reported as an adjustment to
the beginning balance of retained earnings.......................................... 13,981 — Tax expense allocated to other comprehensive income and other ........... (747 ) (4,294 )Deferred tax expense (benefit)................................................................. $ 172,004 $ (83,361 ) The components of net deferred tax liability (current and noncurrent portions) at Dec. 31 were:
(Thousands of Dollars) 2007 2006 Deferred tax liabilities:
Differences between book and tax bases of property..................... $ 905,225 $ 756,427 Regulatory assets ........................................................................... 74,831 60,897 Deferred costs ................................................................................ 14,135 11,275 Unbilled revenue............................................................................ 9,934 9,886 Other .............................................................................................. 19,079 12,563
Total deferred tax liabilities ....................................................... $ 1,023,204 $ 851,048 Deferred tax assets:
Employee benefits ......................................................................... $ 71,314 $ 57,738 Deferred investment tax credits ..................................................... 17,872 19,463 Regulatory liabilities...................................................................... 15,013 20,590 Tax credit carry forward ................................................................ 13,141 14,817 Bad debts ....................................................................................... 8,211 5,476 Rate refund reserve ........................................................................ 6,710 23,255 Net operating loss carry forward.................................................... 3,358 9,060 Other .............................................................................................. 6,126 4,404
Total deferred tax assets ............................................................ $ 141,745 $ 154,803 Net deferred tax liability ............................................................ $ 881,459 $ 696,245
7. Benefit Plans and Other Postretirement Benefits Pension and other postretirement benefit disclosures below generally represent Xcel Energy consolidated information unless specifically identified as being attributable to NSP-Minnesota. Xcel Energy offers various benefit plans to its benefit employees, including those of NSP-Minnesota. Approximately 52 percent of Xcel Energy employees that receive benefits are represented by several local labor unions under several collective-bargaining agreements. At Dec. 31, 2007, NSP-Minnesota had 2,287 bargaining employees covered under a collective-bargaining agreement, which expires at the end of 2010. Employers’ Accounting for Defined Benefit Pension and Other Postretirement Plans—an amendment of FASB Statements No. 87, 88, 106 and 132(R) (SFAS No. 158) — In September 2006, the FASB issued SFAS No. 158, which requires companies to fully recognize the funded status of each pension and other postretirement benefit plan as a liability or asset on their balance sheets with all unrecognized amounts to be recorded in other comprehensive income. NSP-Minnesota applied regulatory accounting treatment for unrecognized amounts of regulated utility subsidiary employees, which allowed recognition as a regulatory liability reduction rather than as a charge to accumulated other comprehensive income. The effect of adopting in 2006 for the remaining unrecognized amounts was a decrease in accumulated other comprehensive income of $3.2 million. Pension Benefits Xcel Energy has several noncontributory, defined benefit pension plans that cover almost all employees. Benefits are based on a combination of years of service, the employee’s average pay and Social Security benefits. Xcel Energy’s policy is to fully fund into an external trust the actuarially determined pension costs recognized for ratemaking and financial reporting purposes, subject to the limitations of applicable employee benefit and tax laws.

48
Pension Plan Assets — Plan assets principally consist of the common stock of public companies, corporate bonds and U.S. government securities. The target range for our pension asset allocation is 60 percent in equity investments, 20 percent in fixed income investments and 20 percent in nontraditional investments, such as real estate, private equity and a diversified commodities index. The actual composition of pension plan assets at Dec. 31 was: 2007 2006 Equity securities................................................. 60 % 63 %Debt securities ................................................... 22 22 Real estate.......................................................... 4 4 Cash ................................................................... 2 2 Nontraditional investments ................................ 12 9 100 % 100 % Xcel Energy bases its investment-return assumption on expected long-term performance for each of the investment types included in its pension asset portfolio. Xcel Energy considers the actual historical returns achieved by its asset portfolio over the past 20-year or longer period, as well as the long-term return levels projected and recommended by investment experts. The historical weighted average annual return for the past 20 years for the Xcel Energy portfolio of pension investments is 11.8 percent, which is greater than the current assumption level. The pension cost determination assumes the continued current mix of investment types over the long term. The Xcel Energy portfolio is heavily weighted toward equity securities and includes nontraditional investments. A higher weighting in equity investments can increase the volatility in the return levels achieved by pension assets in any year. Investment returns in 2007 were below the assumed level of 8.75 percent while returns in 2006 and 2005 exceeded the assumed level of 8.75 percent. Xcel Energy continually reviews its pension assumptions. In 2008, Xcel Energy will continue to use an investment-return assumption of 8.75 percent. Benefit Obligations — A comparison of the actuarially computed pension benefit obligation and plan assets, on a combined basis, is presented in the following table:
(Thousands of Dollars) 2007 2006 Accumulated Benefit Obligation at Dec. 31......................................................... $ 2,497,898 $ 2,486,370 Change in Projected Benefit Obligation Obligation at Jan. 1 .................................................................................................. $ 2,666,555 $ 2,796,780 Service cost.............................................................................................................. 61,392 61,627 Interest cost.............................................................................................................. 162,774 155,413 Plan amendments ..................................................................................................... (19,955 ) (16,569)Actuarial (gain) loss................................................................................................. 23,325 (82,339)Benefit payments ..................................................................................................... (231,332 ) (248,357)Obligation at Dec. 31 ............................................................................................... $ 2,662,759 $ 2,666,555 Change in Fair Value of Plan Assets Fair value of plan assets at Jan. 1............................................................................. $ 3,183,375 $ 3,093,536 Actual return on plan assets ..................................................................................... 199,230 306,196 Employer contributions............................................................................................ 35,000 32,000 Benefit payments ..................................................................................................... (231,332 ) (248,357)Fair value of plan assets at Dec. 31.......................................................................... $ 3,186,273 $ 3,183,375 Funded Status of Plans at Dec. 31 Funded Status........................................................................................................... $ 523,514 $ 516,820 Noncurrent assets..................................................................................................... 568,055 586,712 Noncurrent liabilities ............................................................................................... (44,541 ) (69,892)Net pension amounts recognized on consolidated balance sheets ........................... $ 523,514 $ 516,820 NSP-Minnesota prepaid pension asset recorded...................................................... $ 270,436 $ 276,571

49
(Thousands of Dollars) 2007 2006 NSP-Minnesota Amounts Not Yet Recognized as Components of Net
Periodic Benefit Cost: Net loss .................................................................................................................... $ 72,479 $ 37,217 Prior service cost...................................................................................................... 57,948 77,393 Total......................................................................................................................... $ 130,427 $ 114,610 SFAS No. 158 Amounts Have Been Recorded as Follows Based Upon
Expected Recovery in Rates: Regulatory liabilities................................................................................................ $ 130,427 $ 114,610 Total......................................................................................................................... $ 130,427 $ 114,610
Measurement Date Dec. 31, 2007 Dec. 31, 2006 Significant Assumptions Used to Measure Benefit Obligations Discount rate for year-end valuation........................................................................ 6.25 % 6.00%Expected average long-term increase in compensation level................................... 4.00 4.00 Cash Flows — Cash funding requirements can be impacted by changes to actuarial assumptions, actual asset levels and other calculations prescribed by the funding requirements of income tax and other pension-related regulations. These regulations did not require cash funding for 2005 through 2007 for Xcel Energy’s pension plans and are not expected to require cash funding in 2008. Plan Changes — The Pension Protection Act of 2006 (PPA) was effective Dec. 31, 2006. PPA requires a change in the conversion basis for lump-sum payments, three-year vesting for plans with account balance or pension equity benefits. These changes are reflected as a plan amendment for purposes of SFAS No. 87 – “Employers’ Accounting for Pensions.” Benefit Costs — The components of net periodic pension cost (credit) are:
(Thousands of Dollars) 2007 2006 2005 Service cost........................................................................................ $ 61,392 $ 61,627 $ 60,461 Interest cost........................................................................................ 162,774 155,413 160,985 Expected return on plan assets........................................................... (264,831 ) (268,065 ) (280,064 )Amortization of prior service cost ..................................................... 25,056 29,696 30,035 Amortization of net loss..................................................................... 15,845 17,353 6,819
Net periodic pension cost (credit) under SFAS No. 87.................. $ 236 $ (3,976 ) $ (21,764 ) NSP-Minnesota Net periodic pension credit ................................................................ $ (9,682 ) $ (11,373 ) $ (18,362 )Credits not recognized due to effects of regulation ........................... 11,147 12,637 19,368
Net benefit cost recognized for financial reporting........................ $ 1,465 $ 1,264 $ 1,006 Significant Assumptions Used to Measure Costs Discount rate...................................................................................... 6.00 % 5.75 % 6.00 %Expected average long-term increase in compensation level............. 4.00 3.50 3.50 Expected average long-term rate of return on assets ......................... 8.75 8.75 8.75 Pension costs include an expected return impact for the current year that may differ from actual investment performance in the plan. The return assumption used for 2008 pension cost calculations will be 8.75 percent. The cost calculation uses a market-related valuation of pension assets. Xcel Energy uses a calculated value method to determine the market-related value of the plan assets. The market-related value begins with the fair market value of assets as of the beginning of the year. The market-related value is determined by adjusting the fair market value of assets to reflect the investment gains and losses (the difference between the actual investment return and the expected investment return on the market-related value) during each of the previous five years at the rate of 20 percent per year. Xcel Energy and its operating utilities also maintain noncontributory, defined benefit supplemental retirement income plans for certain qualifying executive personnel. Benefits for these unfunded plans are paid out of their operating cash flows.

50
Defined Contribution Plans Xcel Energy maintains 401(k) plans that cover substantially all employees. The contributions for NSP-Minnesota were approximately $4.2 million in 2007, $3.9 million in 2006 and $3.8 million in 2005. Postretirement Health Care Benefits Xcel Energy has a contributory health and welfare benefit plan that provides health care and death benefits to most Xcel Energy retirees. The former NSP discontinued contributing toward health care benefits for nonbargaining employees retiring after 1998 and for bargaining employees of NSP-Minnesota and NSP-Wisconsin who retired after 1999. Employees of the former NSP who retired after 1998 are eligible to participate in the Xcel Energy health care program with no employer subsidy. In conjunction with the 1993 adoption of SFAS No. 106 — “Employers’ Accounting for Postretirement Benefits Other Than Pensions,” Xcel Energy elected to amortize the unrecognized accumulated postretirement benefit obligation (APBO) on a straight-line basis over 20 years. Regulatory agencies for nearly all of Xcel Energy’s retail and wholesale utility customers have allowed rate recovery of accrued benefit costs under SFAS No. 106. NSP-Minnesota transitioned to full accrual accounting for SFAS No. 106 costs, with regulatory differences fully amortized prior to 1997. Plan Assets — Certain state agencies that regulate Xcel Energy’s utility subsidiaries also have issued guidelines related to the funding of SFAS No. 106 costs. Also, a portion of the assets contributed on behalf of non-bargaining retirees has been funded into a sub-account of the Xcel Energy pension plans. These assets are invested in a manner consistent with the investment strategy for the pension plan. The actual composition of postretirement benefit plan assets at Dec. 31 was:
2007 2006 Equity and equity mutual fund securities.......... 67 % 67 %Fixed income/debt securities ............................ 21 21 Cash equivalents ............................................... 11 11 Nontraditional investments ............................... 1 1 100 % 100 % Xcel Energy bases its investment-return assumption for the postretirement health care fund assets on expected long-term performance for each of the investment types included in its postretirement health care asset portfolio. Investment-return volatility is not considered to be a material factor in postretirement health care costs. Benefit Obligations — A comparison of the actuarially computed benefit obligation and plan assets for Xcel Energy postretirement health care plans that benefit employees of its utility subsidiaries is presented in the following table: (Thousands of Dollars) 2007 2006 Change in Benefit Obligation Obligation at Jan. 1 .................................................................................................. $ 918,693 $ 938,172 Service cost.............................................................................................................. 5,813 6,633 Interest cost.............................................................................................................. 50,475 52,939 Medicare subsidy reimbursements........................................................................... 2,526 3,561 Plan amendments ..................................................................................................... — (945 )Plan participants’ contributions ............................................................................... 13,211 11,870 Actuarial gain .......................................................................................................... (86,576 ) (27,511 )Benefit payments ..................................................................................................... (73,827 ) (66,026 )Obligation at Dec. 31............................................................................................... $ 830,315 $ 918,693

51
(Thousands of Dollars) 2007 2006 Change in Fair Value of Plan Assets Fair value of plan assets at Jan. 1............................................................................. $ 406,305 $ 351,863 Actual return on plan assets ..................................................................................... 24,623 41,409 Plan participants’ contributions ............................................................................... 13,211 11,870 Employer contributions ........................................................................................... 57,147 67,188 Benefit payments ..................................................................................................... (73,827 ) (66,025 ) Fair value of plan assets at Dec. 31.......................................................................... $ 427,459 $ 406,305 Funded Status at Dec. 31 Funded status ........................................................................................................... $ (402,856 ) $ (512,388 ) Current liabilities ..................................................................................................... (1,755 ) (2,211 ) Noncurrent liabilities ............................................................................................... (401,101 ) (510,177 ) Net amounts recognized in consolidated balance sheets.......................................... $ (402,856 ) $ (512,388 ) NSP-Minnesota Amounts Not Yet Recognized as Components of Net
Periodic Benefit Cost: Net loss .................................................................................................................... $ 88,968 $ 105,868 Transition obligation................................................................................................ 6,765 8,111 Total......................................................................................................................... $ 95,733 $ 113,979 SFAS No. 158 Amounts Have Been Recorded as Follows Based Upon
Expected Recovery in Rates: Regulatory liabilities................................................................................................ $ 91,757 $ 108,513 Deferred income taxes ............................................................................................. 1,624 2,233 Net-of-tax AOCI...................................................................................................... 2,352 3,233 Total......................................................................................................................... $ 95,733 $ 113,979 NSP-Minnesota accrued benefit liability recorded .................................................. $ 164,405 $ 184,868 Measurement Date Dec. 31, 2007 Dec. 31, 2006 Significant Assumptions Used to Measure Benefit Obligations Discount rate for year-end valuation........................................................................ 6.25 % 6.00 % Effective Dec. 31, 2007, Xcel Energy reduced its initial medical trend assumption from 9.0 percent to 8.0 percent. The ultimate trend assumption remained unchanged at 5.0 percent. The period until the ultimate rate is reached is six years. Xcel Energy bases its medical trend assumption on the long-term cost inflation expected in the health care market, considering the levels projected and recommended by industry experts, as well as recent actual medical cost increases experienced by Xcel Energy’s retiree medical plan. A 1-percent change in the assumed health care cost trend rate would have the following effects on NSP-Minnesota: (Millions of Dollars) 1-percent increase in APBO components at Dec. 31, 2007 .................................................... $ 19.3 1-percent decrease in APBO components at Dec. 31, 2007.................................................... (16.1 )1-percent increase in service and interest components of the net periodic cost...................... 1.4 1-percent decrease in service and interest components of the net periodic cost ..................... (1.1 ) Cash Flows — The postretirement health care plans have no funding requirements under income tax and other retirement-related regulations other than fulfilling benefit payment obligations, when claims are presented and approved under the plans. Additional cash funding requirements are prescribed by certain state and federal rate regulatory authorities, as discussed previously. Xcel Energy expects to contribute approximately $49 million during 2008.

52
Benefit Costs — The components of net periodic postretirement benefit cost are: (Thousands of Dollars) 2007 2006 2005 Service cost.............................................................................................. $ 5,813 $ 6,633 $ 6,684 Interest cost.............................................................................................. 50,475 52,939 55,060 Expected return on plan assets................................................................. (30,401 ) (26,757 ) (25,700 ) Amortization of transition obligation....................................................... 14,577 14,444 14,578 Amortization of prior service credit......................................................... (2,178 ) (2,178 ) (2,178 ) Amortization of net loss........................................................................... 14,198 24,797 26,246
Net periodic postretirement benefit cost under SFAS No. 106............ $ 52,484 $ 69,878 $ 74,690 NSP-Minnesota Net periodic postretirement benefit cost recognized —
SFAS No. 106...................................................................................... $ 13,761 $ 17,154 $ 17,569 Significant assumptions used to measure costs (income) Discount rate............................................................................................ 6.00 % 5.75 % 6.00 %Expected average long-term rate of return on assets (before tax)............ 7.5 7.5 5.5-8.5 Projected Benefit Payments The following table lists Xcel Energy’s projected benefit payments for the pension and postretirement benefit plans.
(Thousands of Dollars) Projected Pension Benefit Payments
Gross Projected Postretirement Health
Care Benefit Payments
Expected Medicare Part D Subsidies
Net Projected Postretirement Health
Care Benefit Payments
2008 .................................... $ 215,127 $ 60,706 $ 5,841 $ 54,865 2009 .................................... 215,407 62,674 6,280 56,394 2010 .................................... 222,771 64,508 6,693 57,815 2011 .................................... 222,743 66,428 7,031 59,397 2012 .................................... 227,616 67,497 7,415 60,082 2013-2017........................... 1,196,905 348,035 40,849 307,186 8. Detail of Interest and Other Income (Expense), Net Interest and other income, net of nonoperating expenses, for the years ended Dec. 31 consisted of the following: (Thousands of Dollars) 2007 2006 2005 Interest income......................................................................................... $ 10,208 $ 13,294 $ 7,805 Equity income in unconsolidated affiliates.............................................. 770 1,312 248 Other nonoperating income ..................................................................... 1,048 945 1,171 Insurance policy expenses ....................................................................... (5,921 ) (6,120 ) (5,914 )Other nonoperating expense .................................................................... — — (346 )
Total interest and other income, net................................................. $ 6,105 $ 9,431 $ 2,964 9. Derivative Instruments In the normal course of business, NSP-Minnesota is exposed to a variety of market risks. Market risk is the potential loss or gain that may occur as a result of changes in the market or fair value of a particular instrument or commodity. NSP-Minnesota utilizes, in accordance with approved risk management policies, a variety of derivative instruments to mitigate market risk and to enhance its operations. Commodity Price Risk — NSP-Minnesota is exposed to commodity price risk in its electric and natural gas operations. Commodity price risk is managed by entering into long- and short-term physical purchase and sales contracts for electric capacity, energy and other energy-related products and for various fuels used in the generation of electricity and natural gas utility operations. Commodity risk is also managed through the use of financial derivative instruments. NSP-Minnesota utilizes these derivative instruments to reduce the volatility in the cost of commodities acquired on behalf of its retail

53
customers even though regulatory jurisdiction may provide for recovery of actual costs. The use of derivative instruments is done consistently with the local jurisdictional cost-recovery mechanism. NSP-Minnesota’s risk-management policy allows it to manage commodity price risk within each rate-regulated operation to the extent such exposure exists. Short-Term Wholesale and Commodity Trading Risk — NSP-Minnesota conducts various short-term wholesale and commodity trading activities, including the purchase and sale of electric capacity and energy and other energy-related instruments. NSP-Minnesota’s risk-management policy allows management to conduct these activities within guidelines and limitations as approved by our risk management committee, which is made up of management personnel not directly involved in the activities governed by this policy. Interest Rate Risk — NSP-Minnesota is subject to the risk of fluctuating interest rates in the normal course of business. NSP-Minnesota’s risk-management policy allows interest rate risk to be managed through the use of fixed rate debt, floating rate debt and interest rate derivatives such as swaps, caps, collars and put or call options, subject to regulatory approval when required. Types of and Accounting for Derivative Instruments NSP-Minnesota uses derivative instruments in connection with its utility commodity price, interest rate, short-term wholesale and commodity trading activities, including forward contracts, futures, swaps and options. Qualifying hedging relationships are designated as a hedge of a forecasted transaction or future cash flow (cash flow hedge). The types of qualifying hedging transactions that NSP-Minnesota is currently engaged in are discussed below. Cash Flow Hedges Commodity Cash Flow Hedges — NSP-Minnesota enters into derivative instruments to manage variability of future cash flows from changes in commodity prices. These derivative instruments are designated as cash flow hedges for accounting purposes. At Dec. 31, 2007, NSP-Minnesota had various commodity-related contracts designated as cash flow hedges extending through December 2008. At Dec. 31, 2007, NSP-Minnesota had $0.2 million in accumulated other comprehensive income that is expected to be recognized in earnings during the next 12 months as the hedged transactions settle. NSP-Minnesota had immaterial ineffectiveness related to commodity cash flow hedges during 2007 and 2006. Interest Rate Cash Flow Hedges — NSP-Minnesota enters into various instruments that effectively fix the interest payments on certain floating rate debt obligations or effectively fix the yield or price on a specified benchmark interest rate for a specific period. These derivative instruments are designated as cash flow hedges for accounting purposes. At Dec. 31, 2007, NSP-Minnesota had net gains related to interest rate swaps of approximately $0.2 million in accumulated other comprehensive income that it expects to recognize in earnings during the next 12 months. NSP-Minnesota had no ineffectiveness related to interest rate cash flow hedges during 2007 and 2006. The following table shows the major components of the derivative instruments valuation in the consolidated balance sheets at Dec. 31: 2007 2006
(Thousands of Dollars)
Derivative Instruments Valuation –
Assets
Derivative Instruments Valuation - Liabilities
Derivative Instruments Valuation -
Assets
Derivative Instruments Valuation - Liabilities
Long term purchased power agreements ................................... $ 176,443 $ 245,240 $ 201,003 $ 259,765
Electricity and natural gas trading and hedging derivative instruments................................... 31,765 12,176 42,824 25,383
Interest rate hedging instruments ..... — 2,727 — — Total............................................. $ 208,208 $ 260,143 $ 243,827 $ 285,148
In 2003, as a result of FASB Statement 133 Implementation Issue No. C20, NSP-Minnesota began recording several long-term purchased power agreements at fair value due to accounting requirements related to underlying price adjustments. As these purchases are recovered through normal regulatory recovery mechanisms in the respective jurisdictions, the changes in

54
fair value for these contracts were offset by regulatory assets and liabilities. During the first quarter of 2006, NSP-Minnesota qualified these contracts under the normal purchase exception. Based on this qualification, the contracts are no longer adjusted to fair value and the previous carrying value of these contracts will be amortized over the remaining contract lives along with the offsetting regulatory assets and liabilities. Financial Impact of Qualifying Cash Flow Hedges — The impact of qualifying cash flow hedges on NSP-Minnesota’s accumulated other comprehensive income, included in the consolidated statements of common stockholder’s equity and comprehensive income, is detailed in the following table: (Million of Dollars)Accumulated other comprehensive income related to hedges at Dec. 31, 2004 .................. $ — After-tax net unrealized gains related to derivatives accounted for as hedges..................... — After-tax net realized gains on derivative transactions reclassified into earnings ............... — Accumulated other comprehensive income related to hedges at Dec. 31, 2005 .................. $ — After-tax net unrealized gains related to derivatives accounted for as hedges..................... 9.6 After-tax net realized gains on derivative transactions reclassified into earnings ............... (0.2 )Accumulated other comprehensive income related to hedges at Dec. 31, 2006 .................. $ 9.4 After-tax net unrealized losses related to derivatives accounted for as hedges ................... (0.3 )After-tax net realized gains on derivative transactions reclassified into earnings ............... (0.4 )Accumulated other comprehensive income related to hedges at Dec. 31, 2007 .................. $ 8.7 10. Financial Instruments The estimated Dec. 31 fair values of NSP-Minnesota’s recorded financial instruments are as follows: 2007 2006
(Thousands of Dollars) Carrying Amount Fair Value
Carrying Amount Fair Value
Nuclear decommissioning fund ...................... $ 1,317,564 $ 1,317,564 $ 1,200,688 $ 1,200,688 Other investments ........................................... 9,154 9,154 10,415 10,415 Long-term debt, including current portion...... 2,463,109 2,628,580 2,229,228 2,466,465 The fair value of cash and cash equivalents, notes and accounts receivable and notes and accounts payable are not materially different from their carrying amounts. The fair value of NSP-Minnesota’s debt securities in an external nuclear decommissioning fund and other investments are estimated based on quoted market prices for those or similar investments. The fair value of NSP-Minnesota’s long-term debt is estimated based on the quoted market prices for the same or similar issues, or the current rates for debt of the same remaining maturities and credit quality. The fair value estimates presented are based on information available to management as of Dec. 31, 2007 and 2006. These fair value estimates have not been comprehensively revalued for purposes of these consolidated financial statements since that date and current estimates of fair values may differ significantly. The following tables provide the external decommissioning fund’s approximate gains, losses and proceeds from the sale of securities for the years ended Dec. 31: (Thousands of Dollars) 2007 2006 2005 Realized gains..................................................... $ 38,745 $ 310,066 $ 8,967 Realized losses.................................................... 35,794 32,412 8,990 Proceeds from sale of securities.......................... 669,070 958,294 489,697 (Thousands of Dollars) 2007 2006 Unrealized gains ................................................. $ 80,960 $ 41,355Unrealized losses ................................................ — —

55
Letters of Credit NSP-Minnesota uses letters of credit, generally with terms of one year, to provide financial guarantees for certain operating obligations. At Dec. 31, 2007 and 2006, there were $7.2 million and $35.3 million of letters of credit outstanding. The contract amounts of these letters of credit approximate their fair value and are subject to fees determined in the marketplace. 11. Rate Matters NSP-Minnesota Pending and Recently Concluded Regulatory Proceedings — MPUC Base Rate NSP-Minnesota Natural Gas Rate Case — In November 2006, NSP-Minnesota filed a request with the MPUC to increase Minnesota natural gas rates by $18.5 million annually, or 2.4 percent. The request was based on 11.0 percent ROE, a projected equity ratio of 51.98 percent and a natural gas rate base of $439 million. Interim rates, subject to refund, were set at a $15.9 million increase and went into effect on Jan. 8, 2007. In September 2007, the MPUC issued an order approving a rate increase of approximately $11.9 million, based on an authorized ROE of 9.71 percent and an equity ratio of 51.98 percent. The MPUC subsequently denied NSP-Minnesota’s request for rehearing on the ROE. NSP-Minnesota has filed a compliance filing and refund plan, proposing to implement final rates on Feb. 1, 2008. In January 2008, the MPUC approved the compliance filing. NSP-Minnesota Electric Rate Case — In November 2005, NSP-Minnesota requested an electric rate increase of $168 million or 8.05 percent. This increase was based on a requested an 11 percent ROE, a projected common equity to total capitalization ratio of 51.7 percent and a projected electric rate base of $3.2 billion. In September 2006, the MPUC issued an order approving a rate increase of approximately $131 million for 2006 based on an authorized ROE of 10.54 percent. This amount was reduced in 2007 to $115 million to reflect the return of a large industrial customer, to the NSP-Minnesota system. The MPUC order became effective in November 2006 and final rates were implemented on Feb. 1, 2007. In March 2007, a citizen intervenor submitted a brief asking that the Minnesota Court of Appeals remand to the MPUC on various issues decided by the MPUC. The Court of Appeals issued an Order in January 2008 upholding the MPUC’s decision. Electric, Purchased Gas and Resource Adjustment Clauses TCR — In November 2006, the MPUC approved a TCR rider pursuant to 2005 legislation. The TCR mechanism would allow recovery of incremental transmission investments between rate cases.
• In October 2006, NSP-Minnesota filed for approval of recovery of $14.7 million in 2007 under the TCR tariff. • In March 2007, the MPUC approved recovery of $11.5 million in 2007. • In August 2007, NSP-Minnesota filed for approval of recovery of $19.7 million in Minnesota retail electric rates in 2008
under the TCR tariff. • In December 2007, NSP-Minnesota filed tariff sheets proposing to implement TCR rate factors that would recover
only the non-disputed costs effective Jan. 1, 2008, subject to true-up. In December 2007, the MDOC recommended 2008 recovery of approximately $18.5 million, asserting that certain costs did yet not meet statutory criteria. After further comment and reply, the parties resolved all disputed issues.
• The filing, as amended, is pending MPUC action. RES Rider — In June 2007, NSP-Minnesota filed an application for a new rate rider to recover the costs associated with utility-owned projects implemented in compliance with the RES adopted by the 2007 Minnesota legislature. The proposed rate adjustment would recover the costs associated with the Grand Meadow wind farm, a 100-MW wind project proposed by NSP-Minnesota. The rate rider would recover the 2008 revenue requirements associated with the project of approximately $14.6 million. MPUC action on this request is pending. Mercury Cost Recovery — In December 2006, NSP-Minnesota requested approval of a Mercury Emissions Reduction Rider to recover approximately $5.4 million during 2007 from Minnesota electric retail customers for costs associated with implementing both the mercury and other environmental improvement portions of the Mercury Emissions Reduction Act of 2006. NSP-Minnesota subsequently withdrew the filing and obtained approval to defer costs associated as a regulatory asset

56
for potential future recovery. NSP-Minnesota has since filed a mercury reduction plan with the MPCA and MPUC and expects to file for rate rider recovery in the first half of 2008. Annual Automatic Adjustment Report for 2007 — In September 2007, NSP-Minnesota filed its annual automatic adjustment report for July 1, 2006 through June 30, 2007, which is the basis for the MPUC review of charges that flow through the FCA and PGA mechanisms. During that time period, $1.16 billion in fuel and purchased energy costs, including $384 million of MISO Day 2 energy market charges were recovered from electric customers through the FCA. In addition, approximately $590 million of purchased natural gas and transportation costs were recovered through the PGA. The 2007 annual automatic adjustment report is pending comments and MPUC action. Other MISO Day 2 Market Cost Recovery — In December 2006, the MPUC issued an order ruling that NSP-Minnesota may recover all MISO Day 2 costs, except Schedules 16 and 17 administrative charges, through its FCA effective April 1, 2005. In April 2007, the MOAG filed an appeal of the MPUC order to the Minnesota Court of Appeals challenged the MPUC’s decision to allow FCA recovery of these MISO charges. NSP-Minnesota and the other affected utilities intervened in the appeal and filed briefs urging the court to uphold the MPUC order. The oral argument in the appeal is scheduled for Feb. 27, 2008. The date for a court decision in the appeal is not known. Annual Review of Remaining Lives Depreciation Filing — In September 2007, the MPUC approved NSP-Minnesota’s remaining lives depreciation filing effective to Jan. 1, 2007, lengthening the life of the Monticello nuclear plant by 20 years to 2030 as well as certain other smaller life adjustments. These adjustments reduced the depreciation expense of NSP-Minnesota by approximately $41 million for the period ended Dec. 31, 2007. The MPUC also approved an adjustment to rate base to be used in the next electric rate case that will hold ratepayers indifferent to this change in remaining lives between rate cases. NSP-Minnesota calculated the revenue requirement associated with this adjustment to be approximately $1.4 to $2.8 million, depending on the timing of the next electric rate case. In addition, the lengthening of the remaining life for the Monticello nuclear plant decreased the related ARO by $121 million in the third quarter of 2007 with no impact to net income in 2007. Nuclear Refueling Outage Costs — In November 2007, NSP-Minnesota filed a request asking for a change in the recovery method for costs associated with refueling outages at its nuclear plants. The request seeks approval to amortize refueling outage costs over the period between refueling outages to better match revenue and expenses. This request, if approved, would reduce 2008 expenses for NSP-Minnesota jurisdiction by $25 million due to deferral and amortization over an 18-month period versus expensed as incurred. Comparable filings have been made in North Dakota and South Dakota. Pending Regulatory Proceedings — NDPSC and SDPUC NSP-Minnesota North Dakota Electric Rate Case — In December 2007, NSP-Minnesota filed a request with the NDPSC to increase North Dakota retail electric rates by $20.5 million, or about 14 percent. The request was based on an 11.50 percent ROE, an equity ratio of 51.77 percent, and a jurisdictional rate base of approximately $242 million. Interim rates of $17.2 million became effective in February 2008. Hearings are expected to be held in late June, and final rates are expected to be effective Oct. 1, 2008. NSP-Minnesota and the NDPSC staff reached a stipulation settlement in the rate case in which both parties recommended an ROE of 10.75 percent, with a sharing mechanism for earnings about 10.75 percent. This stipulation settlement is subject to approval by the NDPSC. Pending and Recently Concluded Regulatory Proceedings — FERC FERC Transmission Rate Case — In September 2007, Xcel Energy and MISO filed proposed changes to the MISO TEMT to establish a revised formula transmission rate for the integrated NSP System. The rate filing would establish the transmission service rates for the NSP System based on annual forward looking (rather than historic) transmission costs; provide more current recovery of NSP System transmission investments and allow recovery of certain transmission incentives authorized by the Energy Act and the implementation of FERC rules. Xcel Energy made the filing in anticipation of significant transmission capital additions by NSP-Minnesota and NSP-Wisconsin. A forward looking formula rate will facilitate the financing and construction of the new transmission facilities while providing a current return on invested capital for the portion of the investment subject to FERC rate jurisdiction. In December 2007, the FERC issued an order accepting the rate change effective Jan. 1, 2008, subject to Xcel Energy and MISO making certain changes to the procedures for pre-filing notice of the annual formula rate changes. No party filed for rehearing and Xcel Energy submitted the required compliance filing on Jan. 22, 2008. The rate change is expected to increase 2008 NSP System transmission revenues by $2.7 million.

57
MISO Long-Term Transmission Pricing — In October 2005, MISO filed a proposed change to its Open Access TEMT to regionalize future cost recovery of certain high voltage transmission projects to be constructed for reliability improvements. The tariff, called the Regional Expansion Criteria Benefits phase I (RECB I) and a subsequent proposal based on regional economic benefits (RECB II), would recover varying percentages of eligible reliability transmission costs from all transmission service customers in the MISO 15 state region. In November 2006, the FERC issued an order accepting the RECB I tariff, including the 20 percent limitation. In December 2006, the PSCW and other parties filed an appeal of the RECB I order to the federal Court of Appeals for the District of Columbia. The appeal is pending. In March 2007, the FERC issued an order approving most aspects of the RECB II proposal. Various parties filed requests for rehearing, which the FERC subsequently denied. Transmission service rates in the MISO region presently use a rate design in which the transmission cost depends on the location of the load being served (referred to as “license plate” rates). Costs of existing transmission facilities are thus not regionalized. MISO and its transmission owners filed a successor rate methodology in August 2007, to be effective Feb. 1, 2008. Other entities sought to regionalize some of these costs. The impact of the regionalization of future facilities would depend on the specific facilities placed in service. In January 2008, the FERC issued an order accepting the MISO filing to continue use of license plate rates for existing facilities and RECB (limited regionalization) pricing for certain new facilities. The FERC rejected proposals to regionalize a larger share of the cost of existing or new transmission facilities. Revenue Sufficiency Guarantee Charges — In April 2006, the FERC issued an order determining that MISO had incorrectly applied its TEMT regarding the application of the revenue sufficiency guarantee (RSG) charge to certain transactions. The FERC ordered MISO to resettle all affected transactions retroactive to April 2005. The RSG charges are collected from MISO customers and paid to generators. In October 2006, the FERC issued an order granting rehearing in part and reversed the prior ruling requiring MISO to issue retroactive refunds and ordered MISO to submit a compliance filing to implement prospective changes. In March 2007, the FERC issued orders separately denying rehearing of the FERC order. Several parties have filed separate appeals to the D.C. Circuit Court seeking judicial review of the FERC’s determinations of the allocation of RSG costs among MISO market participants. Xcel Energy has intervened in each of these proceedings. In August 2007, Ameren Services Company (Ameren) and the Northern Indiana Public Service Company (NIPSCO) filed a joint complaint against MISO at the FERC, challenging the MISO’s current FERC-approved methodology for the recovery of RSG costs. Subsequently, eight other entities filed complaints at the FERC effectively adopting the substantive arguments raised by Ameren and NIPSCO. In November 2007, the FERC issued an order that instituted a proceeding in these dockets to review evidence and to establish a RSG cost allocation methodology for market participants under the Midwest ISO Tariff. The refund-effective date established is Aug. 10, 2007. FERC action is pending. 12. Commitments and Contingent Liabilities Capital Commitments — The estimated cost, as of Dec. 31, 2007, of the capital expenditure programs and other capital requirements of NSP-Minnesota is approximately $1.0 billion in 2008, $805 million in 2009 and $910 million in 2010. NSP-Minnesota’s capital forecast includes the following major projects. CAPX 2020 — In June 2006, CapX 2020, an alliance of electric cooperatives, municipals and investor-owned utilities in the upper Midwest, including Xcel Energy, announced that it had identified several groups of transmission projects that proposed to be complete by 2020. Group 1 project investments are expected to total approximately $1.3 billion, with major construction targeted to begin in 2009 or 2010 and ending three or four years later. Xcel Energy’s investment is expected to be approximately $700 million. Approximately 75 percent of the capital expenditures and return on investment for transmission projects are expected to be recovered under an NSP-Minnesota TCR tariff rider mechanism authorized by Minnesota legislation, as well as similar TCR mechanisms passed in North Dakota and South Dakota. Nuclear Capacity Increases and Life Extension — In August 2004, NSP-Minnesota announced plans to pursue 20-year license renewals for the Monticello and Prairie Island nuclear plants, whose licenses will expire between 2010 and 2014. License renewal for Monticello was approved by the NRC in November 2006 and the MPUC issued its approval in October 2006 allowing additional spent fuel storage. Similar applications will be submitted for Prairie Island in 2008, with final state and federal approvals expected in 2010. NSP-Minnesota is pursuing capacity increases of all three units that will total approximately 230 MW, to be implemented, if approved, between 2009 and 2015. The life extension and a capacity increase for Prairie Island Unit 2 is contingent on replacement of Unit 2’s original steam generators, currently planned for replacement during the refueling outage in 2013. Total capital investment for these activities is estimated to be approximately $1 billion between 2006 and 2015. NSP-

58
Minnesota plans to seek approval for an alternative recovery mechanism from customers of its nuclear costs. It is NSP-Minnesota’s plan to submit the certificate of need for Monticello in the first quarter of 2008 and the certificate of need for Prairie Island in the second quarter of 2008. MERP Project — In December 2003, the MPUC approved NSP-Minnesota’s MERP proposal to convert two coal-fueled electric generating plants to natural gas and to install advanced pollution control equipment at a third coal-fired plant. These improvements are expected to significantly reduce air emissions from these facilities, while increasing the capacity at system peak by 300 MW. Major construction for the MERP project began in 2005 and these projects are expected to come on line between 2007 and 2009. The cumulative investment is approximately $1 billion. The MPUC has approved a more current recovery of the financing costs related to the MERP. The in-service plant costs, including the financing costs during construction, are recovered from customers through a MERP rider, which was effective Jan. 1, 2006. Sherco Project — NSP-Minnesota has proposed a $1.1 billion upgrade at the Sherco coal-fired power plant. The project will increase capacity and reduce emissions. The MPUC is expected to rule on the project in 2008. If approved, construction would start in late 2010 and be completed on the final unit in 2014. Wind Generation — NSP-Minnesota plans to invest $212.5 million to acquire 100-MW of wind generation. The project would be eligible for rider recovery in Minnesota. The project received approval by the MPUC in December 2007. The capital expenditure programs of NSP-Minnesota are subject to continuing review and modification. Actual utility construction expenditures may vary from the estimates due to changes in electric and natural gas projected load growth regulatory decisions, the desired reserve margin and the availability of purchased power, as well as alternative plans for meeting NSP-Minnesota’s long-term energy needs. In addition, NSP-Minnesota’s ongoing evaluation of compliance with future requirements to install emission-control equipment and merger, acquisition and divestiture opportunities to support corporate strategies may impact actual capital requirements. Leases — NSP-Minnesota leases a variety of equipment and facilities used in the normal course of business, which are accounted for as operating leases. Rental expense under operating lease obligations was approximately $53.3 million, $35.7 million and $26.1 million for 2007, 2006 and 2005, respectively. Purchase power agreements contributed $29.5 million and $14.5 million in 2007 and 2006, respectively. Included in the future commitments under operating leases are estimated future payments under purchase power agreements that have been accounted for as operating leases in accordance with Emerging Issues Task Force 01-8, “Determining whether an Arrangement Contains a Lease” and SFAS No. 13, “Accounting for Leases.” Future commitments under leases for continuing operations are:
(Millions of Dollars) Other
Operating Leases
Purchased Power Agreement
Operating Leases Total
Operating Leases 2008 .................................................... $ 7.4 $ 31.6 $ 39.0 2009 .................................................... 5.9 32.1 38.0 2010 .................................................... 4.1 32.6 36.7 2011 .................................................... 2.5 33.1 35.6 2012 .................................................... 2.1 33.6 35.7 Thereafter............................................ 4.2 485.4 489.6 Fuel Contracts — NSP-Minnesota has contracts providing for the purchase and delivery of a significant portion of its current coal, nuclear fuel and natural gas requirements. These contracts expire in various years between 2008 and 2028. In addition, NSP-Minnesota may be required to pay additional amounts depending on actual quantities shipped under these agreements. The potential risk of loss, in the form of increased costs from market price changes in fuel, is mitigated through the cost-rate adjustment mechanisms, which provide for pass through of most fuel, storage and transportation costs. The estimated minimum purchases for NSP-Minnesota under these contracts as of Dec. 31, 2007, is as follows:
Coal Nuclear Fuel Natural Gas
Supply Gas Storage & Transportation
(Millions of Dollars) $ 895 $ 476 $ 403 $ 985 Purchased Power Agreements — NSP-Minnesota has entered into agreements with utilities and other energy suppliers for purchased power to meet system load and energy requirements, replace generation from company-owned units under

59
maintenance and during outages and meet operating reserve obligations. NSP-Minnesota has various pay-for-performance contracts with expiration dates through the year 2033. In general, these contracts provide for capacity payments, subject to meeting certain contract obligations and energy payments based on actual power taken under the contracts. Certain contractual payment obligations are adjusted based on indices. However, the effects of these price adjustments are mitigated through cost-of-energy rate adjustment mechanisms. NSP-Minnesota has also executed one additional purchase power agreement that is conditional upon achievement of certain conditions, including becoming operational. Estimated payments under this conditional obligation are $13.3 million, $20.1 million, $20.4 million, $20.8 million, $21.2 million and $299.5 million for 2008 to 2012 and thereafter, respectively. At Dec. 31, 2007, the estimated future payments for capacity, accounted for as executory contracts, that NSP-Minnesota is obligated to purchase, subject to availability, were as follows: (Millions of Dollars) 2008 ........................................................... $ 109.3 2009 ........................................................... 112.2 2010 ........................................................... 113.8 2011 ........................................................... 112.5 2012 ........................................................... 111.7 2013 and thereafter .................................... 620.7 Total*......................................................... $ 1,180.2
* Includes amounts allocated to NSP-Wisconsin through intercompany charges. Environmental Contingencies NSP-Minnesota has been, or is currently, involved with the cleanup of contamination from certain hazardous substances at several sites. In many situations, NSP-Minnesota believes it will recover some portion of these costs through insurance claims. Additionally, where applicable, NSP-Minnesota is pursuing, or intends to pursue, recovery from other potentially responsible parties and through the rate regulatory process. New and changing federal and state environmental mandates can also create added financial liabilities for NSP-Minnesota, which are normally recovered through the rate regulatory process. To the extent any costs are not recovered through the options listed above, NSP-Minnesota would be required to recognize an expense. Site Remediation — NSP-Minnesota must pay all or a portion of the cost to remediate sites where past activities of NSP-Minnesota and some other parties have caused environmental contamination. Environmental contingencies could arise from various situations including the following categories of sites:
• Sites of former MGPs operated by NSP-Minnesota’s subsidiaries, predecessors, or other entities; and
• Third party sites, such as landfills, to which NSP-Minnesota is alleged to be a potentially responsible party (PRP) that sent hazardous materials and wastes.
NSP-Minnesota records a liability when enough information is obtained to develop an estimate of the cost of environmental remediation and revises the estimate as information is received. The estimated remediation cost may vary materially from the initial estimate. To estimate the remediation cost for these sites, assumptions are made when facts are not fully known. For instance, assumptions may be made about the nature and extent of site contamination, the extent of required cleanup efforts, costs of alternative cleanup methods and pollution-control technologies, the period over which remediation will be performed and paid for, changes in environmental remediation and pollution-control requirements, the potential effect of technological improvements, the number and financial strength of other PRPs and the identification of new environmental cleanup sites. Estimates are revised as facts become known. At Dec. 31, 2007, the liability for the cost of remediating these sites was estimated to be $0.9 million, of which $0.3 million was considered to be a current liability. Some of the cost of remediation may be recovered from:
• Insurance coverage; • Other parties that have contributed to the contamination; and
• Customers.

60
Neither the total remediation cost nor the final method of cost allocation among all PRPs of the unremediated sites has been determined. Estimates have been recorded for NSP-Minnesota’s future costs for these sites. Third Party and Other Environmental Site Remediation Asbestos Removal — Some of NSP-Minnesota’s facilities contain asbestos. Most asbestos will remain undisturbed until the facilities that contain it are demolished or removed. NSP-Minnesota has recorded an estimate for final removal of the asbestos as an ARO. See additional discussion of AROs below. It may be necessary to remove some asbestos to perform maintenance or make improvements to other equipment. The cost of removing asbestos as part of other work is immaterial and is recorded as incurred as operating expenses for maintenance projects, capital expenditures for construction projects or removal costs for demolition projects. Other Environmental Requirements CAIR — In March 2005, the EPA issued the CAIR to further regulate SO2 and NOx emissions. The objective of CAIR is to cap emissions of SO2 and NOx in the eastern United States, including Minnesota. CAIR addresses the transportation of fine particulates, ozone and emission precursors to nonattainment downwind states. CAIR has a two-phase compliance schedule, beginning in 2009 for NOx and 2010 for SO2, with a final compliance deadline in 2015 for both emissions. Under CAIR, each affected state will be allocated an emissions budget for SO2 and NOx that will result in significant emission reductions. It will be based on stringent emission controls and forms the basis for a cap-and-trade program. State emission budgets or caps decline over time. States can choose to implement an emissions reduction program based on the EPA’s proposed model program, or they can propose another method, which the EPA would need to approve. NSP- Minnesota has generating facilities that will be impacted by CAIR. On May 30, 2007, the MPCA issued a notice for implementing CAIR. This notice stated that Minnesota will administer the CAIR and the EPA’s Federal Implementation Plan. Preliminary estimates of capital expenditures associated with compliance with CAIR for the NSP System (Minnesota and Wisconsin) range from $30 million to $40 million. To date NSP-Minnesota has spent $16.0 million on CAIR compliance. While NSP-Minnesota expects to comply with the new rules through a combination of additional capital investments in emission controls at various facilities and purchases of emission allowances, it is continuing to review the alternatives. NSP-Minnesota believes the cost of any required capital investment or allowance purchases will be recoverable from customers. CAMR — In March 2005, the EPA issued the CAMR, which regulated mercury emissions from power plants. On Feb. 8, 2008, the D.C. Circuit Court of Appeals vacated CAMR, which impacts federal CAMR requirements, but not necessarily state-only mercury rules and legislation. Costs to comply with the Minnesota Mercury Emissions Reduction Act of 2006 are discussed below. Minnesota Mercury Legislation — In May 2006, the Minnesota legislature enacted the Mercury Emissions Reduction Act of 2006 (Act) providing a process for plans, implementation and cost recovery for utility efforts to curb mercury emissions at certain power plants. For Xcel Energy, the Act covers units at the A. S. King and Sherco generating facilities. Under the Act, Xcel Energy is operating and maintaining continuous mercury emission monitoring systems. The information obtained will be used to establish a baseline from which to measure mercury emission reductions. Mercury emission reduction plans were required to be filed by utilities by Dec. 31, 2007 (dry scrubbed units) and Dec. 31, 2009 (wet scrubbed units) that propose to implement technologies most likely to reduce emissions by 90 percent. Implementation would occur by Dec. 31, 2009 for one of the dry scrubbed units, Dec. 31, 2010 for the remaining dry scrubbed unit and Dec. 31, 2014 for wet scrubbed units. The cost of controls will be determined as part of the engineering analysis portion of the mercury reduction plans and is currently estimated to range from $26.5 to $854.5 million for the mercury control and continuous monitoring equipment for Sherco units 1, 2 and 3 and for A.S. King, with increased operating and maintenance expenses estimated to range from approximately $24.7 to $77.2 million. The lower values include costs to achieve a 50 percent mercury reduction for Sherco units 1 and 2 and a 90 percent mercury reduction for Sherco unit 3 and A. S. King. The higher values include costs to achieve a 90 percent mercury reduction for all Sherco units, as well as for A. S. King. Utilities subject to the Act may also submit plans to address non-mercury pollutants subject to federal and state statutes and regulations, which became effective after Dec. 31, 2004. Cost recovery provisions of the Act also apply to these other environmental initiatives. In September 2006, NSP-Minnesota filed a request with the MPUC for recovery of up to $6.3 million of certain environmental improvement costs that are expected to be recoverable under the Act. In January 2007, the MPUC approved this request to defer these costs as a regulatory asset with a cap of $6.3 million. To date NSP-Minnesota has spent approximately $1.3 million on mercury monitoring implementation.

61
Regional Haze Rules — In June 2005, the EPA finalized amendments to the July 1999 regional haze rules. These amendments apply to the provisions of the regional haze rule that require emission controls, known as BART, for industrial facilities emitting air pollutants that reduce visibility by causing or contributing to regional haze. The EPA requires states to develop implementation plans to comply with BART by December 2007. NSP-Minnesota submitted its BART alternatives analysis for Sherco units 1 and 2 in October 2006. The MPCA reviewed the BART analyses for all units in Minnesota and determined that overall, compliance with CAIR is better than BART. At this time, the MPCA is not requiring any BART specific controls that go beyond controls required for CAIR compliance. Voluntary Capacity Upgrade and Emissions Reduction Filing — In December 2007, NSP-Minnesota filed a plan with the MPCA and MPUC for reducing mercury emissions by up to 90 percent at the Sherco unit 3 and King plants. Estimated project costs amount to approximately $9.1 million. At the same time, NSP-Minnesota submitted a revised filing to the MPUC for a major emissions reduction project at Sherco Units 1and 2 to reduce emissions and expand capacity. The revised filing has estimated project costs of approximately $1.1 billion and encompasses the higher value mercury control costs discussed above in the Minnesota Mercury Legislation section. The filing also contains alternatives for the MPUC to consider to add additional capacity and to achieve even lower emissions. If selected, these alternatives could range from $90.8 to $330.8 million in addition to the $1.1 billion proposal. NSP-Minnesota’s investments are subject to MPUC approval of a cost recovery mechanism. Federal Clean Water Act — The federal Clean Water Act requires the EPA to regulate cooling water intake structures to assure that these structures reflect the “best technology available” for minimizing adverse environmental impacts. In July 2004, the EPA published phase II of the rule, which applies to existing cooling water intakes at steam-electric power plants. Several lawsuits were filed against the EPA in the United States Court of Appeals for the Second Circuit challenging the phase II rulemaking. In January 2007, the court issued its decision and remanded virtually every aspect of the rule to the EPA for reconsideration. In June 2007, the EPA suspended the deadlines and referred any implementation to each state’s best professional judgment until the EPA is able to fully respond to the court-ordered remand. As a result, the rule’s compliance requirements and associated deadlines are currently unknown. It is not possible to provide an accurate estimate of the overall cost of this rulemaking at this time due to the many uncertainties involved. Asset Retirement Obligations NSP-Minnesota records future plant removal obligations as a liability at fair value with a corresponding increase to the carrying values of the related long-lived assets in accordance with SFAS No. 143 — “Accounting for Asset Retirement Obligations” (SFAS No. 143). This liability will be increased over time by applying the interest method of accretion to the liability and the capitalized costs will be depreciated over the useful life of the related long-lived assets. The recording of the obligation for regulated operations has no income statement impact due to the deferral of the adjustments through the establishment of a regulatory asset pursuant to SFAS No. 71. Recorded ARO — AROs have been recorded for plant related to nuclear production, steam production, electric transmission and distribution, gas distribution and office buildings. The steam production obligation includes asbestos, ash containment facilities and decommissioning. The asbestos recognition associated with the steam production includes certain plants at NSP-Minnesota. NSP-Minnesota also recorded asbestos recognition for its general office building. Generally, this asbestos abatement removal obligation originated in 1973 with the Clean Air Act, which applied to the demolition of buildings or removal of equipment containing asbestos that can become airborne on removal. AROs also have been recorded for NSP-Minnesota steam production related to ash-containment facilities such as bottom ash ponds, evaporation ponds and solid waste landfills. The origination date on the ARO recognition for ash-containment facilities at steam plants was the in-service date of various facilities. NSP-Minnesota recognized an ARO for the retirement costs of natural gas mains and for the removal of electric transmission and distribution equipment. The electric transmission and distribution ARO consists of many small potential obligations associated with polychlorinated biphenyls (PCBs), mineral oil, storage tanks, treated poles, lithium batteries, mercury and street lighting lamps. These electric and natural gas assets have many in-service dates for which it is difficult to assign the obligation to a particular year. Therefore, the obligation was measured using an average service life. For the nuclear assets, the ARO associated with the decommissioning of two NSP-Minnesota nuclear generating plants, Monticello and Prairie Island, originates with the in-service date of the facility. Monticello began operation in 1971. Prairie Island units 1 and 2 began operation in 1973 and 1974, respectively. See Note 13 to the consolidated financial statements for further discussion of nuclear obligations.

62
A reconciliation of the beginning and ending aggregate carrying amounts of NSP-Minnesota’s AROs is shown in the table below for the 12 months ended Dec. 31, 2007 and Dec. 31, 2006, respectively:
(Thousands of Dollars)
BeginningBalance
Jan. 1, 2007 Liabilities
Recognized Liabilities
Settled Accretion
Revisions To Prior Estimates
Ending Balance
Dec. 31, 2007 Electric Utility Plant: Steam production asbestos............... $ 22,169 $ — $ — $ 1,262 $ (1,008 ) $ 22,423 Steam production ash
containment ................................. 17,163 — — 948 — 18,111 Nuclear production
decommissioning ......................... 1,256,763 — — 73,914 (120,931 ) 1,209,746 Electric transmission and
distribution................................... 940 — — 20 (835 ) 125 Gas Utility Plant: Gas transmission and
distribution................................... 12,378 — — 307 — 12,685 Common Utility and Other
Property: Common general plant asbestos ...... 1,858 — 100 (680 ) 1,278
Total liability ............................... $ 1,311,271 $ — $ — $ 76,551 $ (123,454 ) $ 1,264,368
(Thousands of Dollars)
BeginningBalance
Jan. 1, 2006 Liabilities
Recognized Liabilities
Settled Accretion
Revisions To Prior Estimates
Ending Balance
Dec. 31, 2006 Electric Utility Plant: Steam production asbestos............ $ 21,719 $ — $ — $ 1,229 $ (779 ) $ 22,169 Steam production ash
containment .............................. 16,887 — — 933 (657 ) 17,163 Steam production retirement......... 3,152 — (3,309 ) 157 — — Nuclear production
decommissioning ...................... 1,184,968 — — 71,795 — 1,256,763 Electric transmission and
distribution................................ 1,100 — — 29 (189 ) 940 Gas Utility Plant: Gas transmission and
distribution................................ 12,059 — — 299 20 12,378 Common Utility and Other
Property: Common general plant asbestos ... 3,034 — 162 (1,338 ) 1,858
Total liability ............................ $ 1,242,919 $ — $ (3,309 ) $ 74,604 $ (2,943 ) $ 1,311,271 The fair value of NSP-Minnesota assets legally restricted for purposes of settling the nuclear AROs is $1.3 billion as of Dec. 31, 2007, including external nuclear decommissioning investment funds and internally funded amounts. On Sept. 21, 2007, the MPUC approved NSP-Minnesota’s remaining lives depreciation filing lengthening the life of the Monticello nuclear plant by 20 years, effective Jan. 1, 2007, which decreased the related ARO and related regulatory asset by $120.9 million in the third quarter of 2007. Removal Costs — NSP-Minnesota accrues an obligation for plant removal costs for generation, transmission and distribution facilities. Generally, the accrual of future non-ARO removal obligations is not required. However, long-standing ratemaking practices approved by applicable state and federal regulatory commissions have allowed provisions for such costs in historical depreciation rates. These removal costs have accumulated over a number of years based on varying rates as authorized by the appropriate regulatory entities. Given the long periods over which the amounts were accrued and the changing of rates through time, NSP-Minnesota has estimated the amount of removal costs accumulated through historic depreciation expense based on current factors used in the existing depreciation rates. Accordingly, the recorded amounts of estimated future removal costs are considered regulatory liabilities under SFAS No. 71. Removal costs as of Dec. 31, 2007 and 2006 were $342 million and $355 million, respectively.

63
Nuclear Insurance NSP-Minnesota’s public liability for claims resulting from any nuclear incident is limited to $10.8 billion under the Price-Anderson amendment to the Atomic Energy Act of 1954, as amended. NSP-Minnesota has secured $300 million of coverage for its public liability exposure with a pool of insurance companies. The remaining $10.5 billion of exposure is funded by the Secondary Financial Protection Program, available from assessments by the federal government in case of a nuclear accident. NSP-Minnesota is subject to assessments of up to $100.6 million per reactor per accident for each of its three licensed reactors, to be applied for public liability arising from a nuclear incident at any licensed nuclear facility in the United States. The maximum funding requirement is $15 million per reactor during any one year. These maximum assessment amounts are both subject to inflation adjustment by the NRC and state premium taxes. The NRC’s last adjustment was effective Aug. 20, 2003. The next adjustment is due on or before Aug. 20, 2008. NSP-Minnesota purchases insurance for property damage and site decontamination cleanup costs from Nuclear Electric Insurance Ltd. (NEIL). The coverage limits are $2.3 billion for each of NSP-Minnesota’s two nuclear plant sites. NEIL also provides business interruption insurance coverage, including the cost of replacement power obtained during certain prolonged accidental outages of nuclear generating units. Premiums are expensed over the policy term. All companies insured with NEIL are subject to retroactive premium adjustments if losses exceed accumulated reserve funds. Capital has been accumulated in the reserve funds of NEIL to the extent that NSP-Minnesota would have no exposure for retroactive premium assessments in case of a single incident under the business interruption and the property damage insurance coverage. However, in each calendar year, NSP-Minnesota could be subject to maximum assessments of approximately $15.0 million for business interruption insurance and $32.1 million for property damage insurance if losses exceed accumulated reserve funds. Legal Contingencies In the normal course of business, NSP-Minnesota is subject to claims and litigation arising from prior and current operations. NSP-Minnesota is actively defending these matters and has recorded a liability related to the probable cost of settlement or other disposition when it can be reasonably estimated. Environmental Litigation Carbon Dioxide Emissions Lawsuit — In July 2004, the attorneys general of eight states and New York City, as well as several environmental groups, filed lawsuits in U.S. District Court in the Southern District of New York against five utilities, including Xcel Energy, to force reductions in CO2 emissions. The other utilities include American Electric Power Co., Southern Co., Cinergy Corp. and Tennessee Valley Authority. The lawsuits allege that CO2 emitted by each company is a public nuisance as defined under state and federal common law because it has contributed to global warming. The lawsuits do not demand monetary damages. Instead, the lawsuits ask the court to order each utility to cap and reduce its CO2 emissions. In October 2004, Xcel Energy and the other defendants filed a motion to dismiss the lawsuit. On Sept. 19, 2005, the court granted the motion to dismiss on constitutional grounds. Plaintiffs filed an appeal to the Second Circuit Court of Appeals. In June 2007 the Second Circuit Court of Appeals issued an order requesting the parties to file a letter brief regarding the impact of the United States Supreme Court’s decision in Massachusetts v. EPA, 127 S.Ct. 1438 ( April 2, 2007) on the issues raised by the parties on appeal. Among other things, in its decision in Massachusetts v. EPA, the United States Supreme Court held that CO2 emissions are a “ pollutant” subject to regulation by the EPA under the Clean Air Act. In response to the request of the Second Circuit Court of Appeals, in June 2007, the defendant utilities filed a letter brief stating the position that the United States Supreme Court’s decision supports the arguments raised by the utilities on appeal. The Court of Appeals has taken the matter under advisement and is expected to issue an opinion in due course. Comer vs. Xcel Energy Inc. et al. — In April 2006, Xcel Energy received notice of a purported class action lawsuit filed in U.S. District Court in the Southern District of Mississippi. The lawsuit names more than 45 oil, chemical and utility companies, including Xcel Energy, as defendants and alleges that defendants’ CO2 emissions “were a proximate and direct cause of the increase in the destructive capacity of Hurricane Katrina.” Plaintiffs allege in support of their claim, several legal theories, including negligence and public and private nuisance and seek damages related to the loss resulting from the hurricane. Xcel Energy believes this lawsuit is without merit and intends to vigorously defend itself against these claims. In August 2007, the court dismissed the lawsuit in its entirety against all defendants on constitutional grounds. In September 2007, plaintiffs filed a notice of appeal to the Fifth Circuit Court of Appeals. The Court of Appeals has taken the matter under advisement and is expected to issue an opinion in due course.

64
Employment, Tort and Commercial Litigation Hoffman vs. Northern States Power Company — In March 2006, a purported class action complaint was filed in Minnesota state court, on behalf of NSP-Minnesota’s residential customers in Minnesota, North Dakota and South Dakota for alleged breach of a contractual obligation to maintain and inspect the points of connection between NSP-Minnesota’s wires and customers’ homes within the meter box. Plaintiffs claim NSP-Minnesota’s alleged breach results in an increased risk of fire and is in violation of tariffs on file with the MPUC. Plaintiffs seek injunctive relief and damages in an amount equal to the value of inspections plaintiffs claim NSP-Minnesota was required to perform over the past six years. In August 2006, NSP-Minnesota filed a motion for dismissal on the pleadings. In November 2006, the court issued an order denying NSP-Minnesota’s motion, but later, pursuant to a motion by NSP-Minnesota, certified the issues raised in NSP-Minnesota’s original motion for appeal as important and doubtful and NSP-Minnesota filed an appeal with the Minnesota Court of Appeals. On Jan. 22, 2008, the Minnesota Court of Appeals determined the plaintiffs’ claims are barred by the filed rate doctrine and remanded the case to the district court for dismissal. Nuclear Waste Disposal Litigation — In 1998, NSP-Minnesota filed a complaint in the U.S. Court of Federal Claims against the United States requesting breach of contract damages for the DOE’s failure to begin accepting spent nuclear fuel by Jan. 31, 1998, as required by the contract between the DOE and NSP-Minnesota. At trial, NSP-Minnesota claimed damages in excess of $100 million through Dec. 31, 2004. On Sept. 26, 2007, the court awarded NSP-Minnesota $116.5 million in damages. In December 2007, the court denied the DOE’s motion for reconsideration. In February 2008 the DOE filed an appeal to the U.S. Court of Appeals for the Federal Circuit. Results of the judgment will not be recorded in earnings until the appeal and regulatory treatment and amounts to be shared with ratepayers have been resolved. Given the uncertainties, it is unclear as to how much, if any, of this judgment will ultimately have a net impact on earnings. In August 2007, NSP-Minnesota filed a second complaint against the DOE in the Court of Federal Claims (NSP II), again claiming breach of contract damages for the DOE’s continuing failure to abide by the terms of the contract. This lawsuit claims damages for the period Jan. 1, 2005 through June 30, 2007, which includes costs associated with the storage of spent nuclear fuel at Prairie Island and Monticello, as well as the costs of complying with state regulation relating to the storage of spent nuclear fuel. The amount of such damages is expected to exceed $40 million. In January 2008, the court granted the DOE’s motion to stay, subject to reevaluation after a decision has been filed in any one of the five pending appeals of nuclear waste storage cases. Siewert vs. Xcel Energy — In June 2004, plaintiffs, the owners and operators of a Minnesota dairy farm, brought an action in Minnesota state court against NSP-Minnesota alleging negligence in the handling, supplying, distributing and selling of electrical power systems; negligence in the construction and maintenance of distribution systems; and failure to warn or adequately test such systems. Plaintiffs allege decreased milk production, injury and damage to a dairy herd as a result of stray voltage resulting from NSP-Minnesota’s distribution system. Plaintiffs claim losses of approximately $7 million. NSP-Minnesota denies all allegations. After its motion to dismiss plaintiffs’ claims was denied, NSP-Minnesota filed a motion to certify questions for immediate appellate review. In October 2007 the court granted NSP- Minnesota’s motion for certification and the parties have filed briefs on appeal. Saemrow Dairy Partnership vs. Xcel Energy — In December 2006, plaintiffs, the owners and operators of a Minnesota dairy farm, brought an action in Minnesota state court against NSP-Minnesota alleging negligence in the handling, supplying, distributing and selling of electrical power systems and in the construction and maintenance of distribution systems. They also alleged failure to warn or adequately test such systems. Plaintiffs allege decreased milk production, injury and damage to a dairy herd as a result of stray voltage resulting from NSP-Minnesota’s distribution system. Plaintiffs claim losses approximately $9 million. NSP-Minnesota denies all allegations. Mediation has been set for March 2008; and in the event the matter is not resolved, trial is set for October 2008. 13. Nuclear Obligations Fuel Disposal — NSP-Minnesota is responsible for temporarily storing used or spent nuclear fuel from its nuclear plants. The DOE is responsible for permanently storing spent fuel from NSP-Minnesota’s nuclear plants as well as from other U.S. nuclear plants. NSP-Minnesota has funded its portion of the DOE’s permanent disposal program since 1981. The fuel disposal fees are based on a charge of 0.1 cent per kilowatt-hour sold to customers from nuclear generation. Fuel expense includes the DOE fuel disposal assessments of approximately $13 million in 2007, $13 million in 2006 and $12 million in 2005. In total, NSP-Minnesota had paid approximately $373 million to the DOE through Dec. 31, 2007. However, it is not determinable whether the amount and method of the DOE’s assessments to all utilities will be sufficient to fully fund the DOE’s permanent storage or disposal facility.

65
The Nuclear Waste Policy Act of 1982 required the DOE to begin accepting spent nuclear fuel no later than Jan. 31, 1998. In 1996, the DOE notified commercial spent-fuel owners of an anticipated delay in accepting spent nuclear fuel by the required date and conceded that a permanent storage or disposal facility will not be available until at least 2010. NSP-Minnesota and other utilities have commenced lawsuits against the DOE to recover damages caused by the DOE’s failure to meet its statutory and contractual obligations. NSP-Minnesota has its own temporary on-site storage facilities for spent fuel at its Monticello and Prairie Island nuclear plants, which consist of storage pools at both sites and a dry cask facility at Prairie Island. With the dry cask storage facility licensed by the NRC, approved in 1994 and again in 2003, management believes it has adequate storage capacity to continue operation of its Prairie Island nuclear plant until at least the end of its current license terms in 2013 and 2014. The Monticello nuclear plant has storage capacity in the storage pool to continue operations until 2010. In 2005, NSP-Minnesota filed a certificate of need to allow interim storage of spent fuel at the Monticello nuclear plant to support license renewal and operation for an additional 20 years. In October 2006, the MPUC issued its approval allowing additional interim spent fuel storage. Minnesota Statutes provide that the MPUC decision become effective June 1, 2007, which allowed the legislature the opportunity to review the MPUC action if desired. On Nov. 8, 2006, the NRC renewed the operating license of the Monticello nuclear plant for an additional 20 years. All of the alternatives for spent fuel storage are being investigated until a DOE facility is available, including pursuing the establishment of a private facility for interim storage of spent nuclear fuel as part of a consortium of electric utilities. Nuclear fuel expense includes payments to the DOE for the decommissioning and decontamination of the DOE’s uranium-enrichment facilities. In 1993, NSP-Minnesota recorded the DOE’s initial assessment of $46 million, which was payable in annual installments for 15 years until 2007. NSP-Minnesota amortized each installment to expense on a monthly basis. The final annual assessment was received and paid in 2006. The amortization of this annual assessment was completed in September 2007. NSP-Minnesota has obtained rate recovery of these DOE assessments through the cost-of-energy adjustment clause as the assessments were amortized. Regulatory Plant Decommissioning Recovery — Decommissioning of NSP-Minnesota’s nuclear facilities, as last approved by the MPUC, is planned for the period from cessation of operations through 2050, assuming the prompt dismantlement method. NSP-Minnesota is currently recording the regulatory costs for decommissioning over the MPUC-approved cost-recovery period and including the accruals in a regulatory liability account. The total decommissioning cost obligation is recorded as an ARO in accordance with SFAS No. 143. Monticello began operation in 1971 with an original license to operate until 2010. Prairie Island units 1 and 2 began operation in 1973 and 1974, respectively and are currently licensed to operate until 2013 and 2014, respectively. In 2003, the Minnesota legislature changed a law that had limited expansion of on-site storage. On Sept. 28, 2006, the MPUC approved Xcel Energy’s request for a certificate of need to authorize construction and operation of a dry spent fuel storage facility at Monticello to become effective June 1, 2007. On Nov. 8, 2006, the NRC renewed the operating license of the Monticello nuclear plant for an additional 20 years to 2030. In June 2007, NSP-Minnesota filed for depreciation life extension of the Monticello nuclear plant based on previous NRC and MPUC process approvals. The Monticello 20-year depreciation life extension until September 2030 was granted by the MPUC on Sept. 21, 2007. Construction of the Monticello Independent Spent Fuel Storage facility, as allowed by the certificate of need approved in 2006, commenced on June 4, 2007. Installation of the horizontal storage modules began in October of 2007 with a fuel loading campaign anticipated to begin in the Spring of 2008. Plant assessments and other work for the Prairie Island applications started in 2006. The Prairie Island operating license extension for an additional 20 years of operation is anticipated to be filed by the end of the first quarter of 2008 with the NRC. The total obligation for decommissioning currently is expected to be funded 100 percent by external funds, as approved by the MPUC when decommissioning commences. The MPUC last approved NSP-Minnesota’s nuclear decommissioning study request in March 2006, using 2005 cost data with the next update due in October 2008. The MPUC approval decreasing 2006 decommissioning funding for Minnesota retail customers resulted from an extension of remaining life for the Monticello unit by 10 years (from 2010 to 2020). Contributions to the external fund started in 1990 and are expected to continue until plant decommissioning begins. The assets held in trusts, primarily consisted of investments in fixed income securities, such as tax-exempt municipal bonds and U.S. government securities that mature in one to 20 years and common stock of public companies. NSP-Minnesota plans to reinvest matured securities until decommissioning begins. Consistent with cost recovery in utility customer rates, NSP-Minnesota records annual decommissioning expense based on periodic site-specific cost studies and a presumed level of dedicated funding. Cost studies quantify decommissioning costs in current dollars. Current authorized funding presumes that costs will escalate in the future at a rate of 3.61 percent per year. The total estimated decommissioning costs that will ultimately be paid, net of income earned by external trust funds, is

66
currently being accrued using an annuity approach over the approved plant-recovery period. This annuity approach uses an assumed rate of return on funding, which is currently 5.40 percent, net of tax, for external funding. The net unrealized gain on nuclear decommissioning investments is deferred as a regulatory liability based on the assumed offsetting against decommissioning costs in current ratemaking treatment. In 2006, the Nuclear Decommissioning Trust (NDT) fund also recorded the sale of certain investments in the non-qualified fund and the reinvestment of the proceeds into the qualified fund. The sale and reinvestment, along with the transfer of securities was part of a transaction intended to consolidate trust fund accounts into an income tax advantaged fund, resulting from the Energy Act. The transfer of funds was completed in the fourth quarter of 2006. At Dec. 31, 2007, NSP-Minnesota had recorded and recovered in rates cumulative decommissioning expense of $1.2 billion. The following table summarizes the funded status of NSP-Minnesota’s decommissioning obligation based on approved regulatory recovery parameters. Xcel Energy believes future decommissioning cost expense will continue to be recovered in customer rates. These amounts are not those recorded in the financial statements for the ARO in accordance with SFAS No. 143. (Thousands of Dollars) 2007 2006 Estimated decommissioning cost obligation from most recently approved study (2005
dollars) ................................................................................................................................... $ 1,683,750 $ 1,683,750 Effect of escalating costs to 2007 and 2006 dollars (3.61 percent per year).............................. 123,761 60,783 Estimated decommissioning cost obligation in current dollars.................................................. 1,807,511 1,744,533 Effect of escalating costs to payment date (3.61 percent per year)............................................ 1,319,315 1,382,293 Estimated future decommissioning costs (undiscounted) .......................................................... 3,126,826 3,126,826 Effect of discounting obligation (using risk-free interest rate) .................................................. (1,502,030 ) (1,675,114 )Discounted decommissioning cost obligation............................................................................ 1,624,796 1,451,712 Assets held in external decommissioning trust .......................................................................... 1,317,564 1,200,688 Discounted decommissioning obligation in excess of assets currently held in external
trust ........................................................................................................................................ $ 307,232 $ 251,024 Decommissioning expenses recognized include the following components: (Thousands of Dollars) 2007 2006 2005 Annual decommissioning cost expense reported as depreciation expense:
Externally funded................................................................................................ $ 43,392 $ 48,069 $ 80,582 Internally funded (including interest costs) ........................................................ (759 ) (5,046 ) (57,561 )
Net decommissioning expense recorded................................................................. $ 42,633 $ 43,023 $ 23,021 Reductions to expense for internally-funded portions in 2007, 2006 and 2005 are a direct result of the 2005 decommissioning study jurisdictional allocation and 100 percent external funding approval, effectively unwinding the remaining internal fund over the remaining operating life of the unit. The 2005 nuclear decommissioning filing approved in 2006 has been used for the regulatory presentation and all the updated parameters were used for 2005. The change in estimated decommission obligations was calculated using a life extension cost estimate for Monticello. 14. Regulatory Assets and Liabilities NSP-Minnesota’s consolidated financial statements are prepared in accordance with the provisions of SFAS No. 71, as discussed in Note 1 to the consolidated financial statements. Under SFAS No. 71, regulatory assets and liabilities can be created for amounts that regulators may allow to be collected, or may require to be paid back to customers in future electric and natural gas rates. Any portion of the business that is not rate regulated cannot use SFAS No. 71 accounting. If changes in the utility industry or the business of NSP-Minnesota no longer allow for the application of SFAS No. 71 under GAAP, NSP-Minnesota would be required to recognize the write-off of regulatory assets and liabilities in its consolidated statement of income. The components of unamortized regulatory assets and liabilities on the consolidated balance sheets of NSP-Minnesota are:
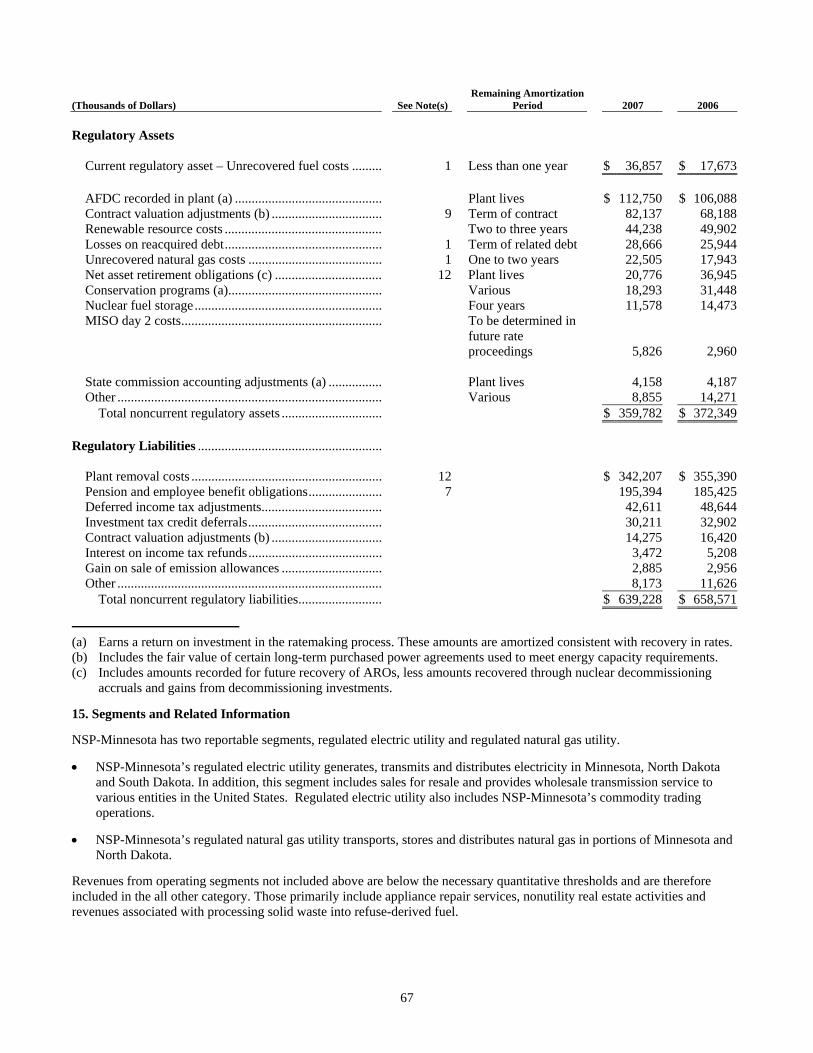
67
Remaining Amortization (Thousands of Dollars) See Note(s) Period 2007 2006 Regulatory Assets
Current regulatory asset – Unrecovered fuel costs ......... 1 Less than one year $ 36,857 $ 17,673
AFDC recorded in plant (a) ............................................ Plant lives $ 112,750 $ 106,088 Contract valuation adjustments (b) ................................. 9 Term of contract 82,137 68,188 Renewable resource costs ............................................... Two to three years 44,238 49,902 Losses on reacquired debt............................................... 1 Term of related debt 28,666 25,944 Unrecovered natural gas costs ........................................ 1 One to two years 22,505 17,943 Net asset retirement obligations (c) ................................ 12 Plant lives 20,776 36,945 Conservation programs (a).............................................. Various 18,293 31,448 Nuclear fuel storage........................................................ Four years 11,578 14,473 MISO day 2 costs............................................................
To be determined in future rate proceedings 5,826 2,960
State commission accounting adjustments (a) ................ Plant lives 4,158 4,187 Other ............................................................................... Various 8,855 14,271
Total noncurrent regulatory assets .............................. $ 359,782 $ 372,349 Regulatory Liabilities .......................................................
Plant removal costs ......................................................... 12 $ 342,207 $ 355,390 Pension and employee benefit obligations...................... 7 195,394 185,425 Deferred income tax adjustments.................................... 42,611 48,644 Investment tax credit deferrals........................................ 30,211 32,902 Contract valuation adjustments (b) ................................. 14,275 16,420 Interest on income tax refunds........................................ 3,472 5,208 Gain on sale of emission allowances .............................. 2,885 2,956 Other ............................................................................... 8,173 11,626
Total noncurrent regulatory liabilities......................... $ 639,228 $ 658,571
(a) Earns a return on investment in the ratemaking process. These amounts are amortized consistent with recovery in rates. (b) Includes the fair value of certain long-term purchased power agreements used to meet energy capacity requirements. (c) Includes amounts recorded for future recovery of AROs, less amounts recovered through nuclear decommissioning
accruals and gains from decommissioning investments. 15. Segments and Related Information NSP-Minnesota has two reportable segments, regulated electric utility and regulated natural gas utility.
• NSP-Minnesota’s regulated electric utility generates, transmits and distributes electricity in Minnesota, North Dakota and South Dakota. In addition, this segment includes sales for resale and provides wholesale transmission service to various entities in the United States. Regulated electric utility also includes NSP-Minnesota’s commodity trading operations.
• NSP-Minnesota’s regulated natural gas utility transports, stores and distributes natural gas in portions of Minnesota and North Dakota.
Revenues from operating segments not included above are below the necessary quantitative thresholds and are therefore included in the all other category. Those primarily include appliance repair services, nonutility real estate activities and revenues associated with processing solid waste into refuse-derived fuel.

68
Operating results from the regulated electric utility and regulated natural gas utility serve as the primary basis for the chief operating decision maker (CODM) to evaluate the dual performance of NSP-Minnesota. To report net income for regulated electric and regulated natural gas utility segments, NSP-Minnesota must assign or allocate all costs and certain other income. In general, costs are:
• directly assigned wherever applicable; • allocated based on cost causation allocators wherever applicable; or
• allocated based on a general allocator for all other costs not assigned by the above two methods. The accounting policies of the segments are the same as those described in Note 1 to the consolidated financial statements. These segments are managed separately because the revenue streams are dependent upon regulated rate recovery, which are separately determined for each segment.
(Thousands of Dollars) Regulated
Electric Utility
RegulatedNatural
Gas Utility All
Other Reconciling Eliminations
ConsolidatedTotal
2007 Operating revenues from external
customers ................................................ $ 3,476,674 $ 776,971 $ 18,569 $ — $ 4,272,214 Intersegment revenues ................................ 655 16,261 — (16,916 ) —
Total revenues......................................... $ 3,477,329 $ 793,232 $ 18,569 $ (16,916 ) $ 4,272,214 Depreciation and amortization.................... $ 372,270 $ 32,896 $ 403 $ — $ 405,569 Financing costs, mainly interest
expense ................................................... 151,012 17,256 707 (16 ) 168,959 Income tax expense..................................... 165,531 11,315 5,179 — 182,025 Net income (loss)........................................ $ 246,086 $ 21,485 $ (269 ) $ — $ 267,302 2006 ............................................................ Operating revenues from external
customers ................................................ $ 3,265,371 $ 744,635 $ 17,609 $ — $ 4,027,615 Intersegment revenues ................................ 496 8,929 — (9,425 ) —
Total revenues......................................... $ 3,265,867 $ 753,564 $ 17,609 $ (9,425 ) $ 4,027,615 Depreciation and amortization.................... $ 393,560 $ 31,566 $ 385 $ — $ 425,511 Financing costs, mainly interest
expense ................................................... 134,347 15,539 1,040 (4 ) 150,922 Income tax expense (benefit) ...................... 138,077 5,448 (15,919 ) — 127,606 Net income.................................................. $ 242,815 $ 9,674 $ 19,821 $ — $ 272,310 2005 ............................................................ Operating revenues from external
customers ................................................ $ 3,010,957 $ 821,922 $ 20,705 $ — $ 3,853,584 Intersegment revenues ................................ 297 15,689 — (15,986 ) —
Total revenues......................................... $ 3,011,254 $ 837,611 $ 20,705 $ (15,986 ) $ 3,853,584 Depreciation and amortization.................... $ 341,725 $ 30,501 $ 730 $ — $ 372,956 Financing costs, mainly interest
expense ................................................... 120,982 14,515 660 (22 ) 136,135 Income tax expense (benefit) ...................... 116,517 7,717 (12,451 ) — 111,783 Net income.................................................. $ 199,964 $ 23,782 $ 13,998 $ — $ 237,744 16. Related Party Transactions Xcel Energy Services Inc. provides management, administrative and other services for the subsidiaries of Xcel Energy, including NSP-Minnesota. The services are provided and billed to each subsidiary in accordance with Service Agreements executed by each subsidiary. Costs are charged directly to the subsidiary which uses the service whenever possible and are allocated if they cannot be directly assigned. Xcel Energy has established a utility money pool arrangement with the utility subsidiaries. See Note 3 for further discussion of this borrowing arrangement.

69
Utility Engineering Corp. (UE), a former Xcel Energy subsidiary, provided construction services to NSP-Minnesota, for which it was paid $2.3 million in 2005. UE was sold in April 2005. Nuclear Plant Operation — On Sept. 28, 2007, NSP-Minnesota obtained 100 percent ownership in NMC as a result of WEC exiting the partnership due to the sale of its Point Beach Nuclear Plant to FPL Energy. Accordingly, the results of operations of NMC and the estimated fair value of assets and liabilities were consolidated in NSP-Minnesota’s consolidated financial statements from the Sept. 28, 2007 transaction date. WEC was required to pay an exit fee and surrender all of its equity interest in NMC upon exiting. NSP-Minnesota is in the process of reintegrating its nuclear operations into its generation operations and apply to the NRC to transfer the nuclear operating licenses from NMC to NSP-Minnesota. The transfer of licenses is expected to be completed in early 2008. In accordance with the Nuclear Power Plant Operating Services Agreement, NSP-Minnesota also pays its proportionate share of the operating expenses and capital improvement costs incurred by NMC. NSP-Minnesota paid the NMC $235.2 million in 2007, $292.5 million in 2006 and $257.1 million in 2005. The electric production and transmission costs of the entire NSP system are shared by NSP-Minnesota and NSP-Wisconsin. The Interchange Agreement provides for the sharing of all costs of generation and transmission facilities of the system, including capital costs. The table below contains significant affiliate transactions among the companies and related parties including billings under the Interchange Agreement for the years ended Dec. 31: (Thousands of Dollars) 2007 2006 2005 Operating revenues:
Electric utility .......................................................................................... $ 372,215 $ 322,733 $ 305,202 Natural gas utility .................................................................................... 366 350 386
Operating expenses: Purchased power...................................................................................... 79,345 61,342 60,801 Transmission expense.............................................................................. 40,872 38,061 37,803 Other operations — paid to Xcel Energy Services Inc. ........................... 267,281 284,108 284,906
Interest expense ........................................................................................... 1,742 1,083 494 Interest income............................................................................................. 1,422 4,497 1,326 Accounts receivable and payable with affiliates at Dec. 31, was: 2007 2006
(Thousands of Dollars) Accounts
Receivable Accounts Payable
Accounts Receivable
Accounts Payable
NSP-Wisconsin........................................................................ $ 20,918 $ — $ 9,905 $ — PSCo ........................................................................................ — 17,440 — 6,598 SPS .......................................................................................... — 8,332 — 4,015 Other subsidiaries of Xcel Energy ........................................... 10,160 28,203 23,031 28,526 $ 31,078 $ 53,975 $ 32,936 $ 39,139 NSP-Wisconsin obtains short-term borrowings from NSP-Minnesota at NSP-Minnesota’s average daily interest rate, including the cost of NSP-Minnesota’s compensating balance requirements. At Dec. 31, 2007 and 2006, NSP-Minnesota had notes receivable outstanding from NSP-Wisconsin in the amount of $58.6 million and $30.3 million, respectively. 17. Summarized Quarterly Financial Data (Unaudited) Quarter Ended (Thousands of Dollars) March 31, 2007 June 30, 2007 Sept. 30, 2007 Dec. 31, 2007 Revenue ................................................................... $ 1,145,635 $ 976,725 $ 1,089,170 $ 1,060,684 Operating income..................................................... 97,858 122,804 244,430 125,263 Net income............................................................... 42,503 56,374 121,456 46,969

70
Quarter Ended (Thousands of Dollars) March 31, 2006 June 30, 2006 Sept. 30, 2006 Dec. 31, 2006 Revenue ................................................................... $ 1,087,713 $ 829,345 $ 1,080,203 $ 1,030,354 Operating income..................................................... 123,028 75,020 221,925 100,538 Net income............................................................... 58,942 30,120 130,705 52,543 Item 9 — Changes in and Disagreements With Accountants on Accounting and Financial Disclosure During 2006 and 2007, and through the date of this report, there were no disagreements with the independent public accountants for NSP-Minnesota on accounting principles or practices, financial statement disclosures or auditing scope or procedures. Item 9A(T) — Controls and Procedures Disclosure Controls and Procedures NSP-Minnesota maintains a set of disclosure controls and procedures designed to ensure that information required to be disclosed in reports that it files or submits under the Securities Exchange Act of 1934 is recorded, processed, summarized and reported within the time periods specified in Securities and Exchange Commission rules and forms. In addition, the disclosure controls and procedures ensure that information required to be disclosed is accumulated and communicated to management, including the chief executive officer (CEO) and chief financial officer (CFO), allowing timely decisions regarding required disclosure. As of Dec. 31, 2007, based on an evaluation carried out under the supervision and with the participation of NSP-Minnesota’s management, including the CEO and CFO, of the effectiveness of its disclosure controls and the procedures, the CEO and CFO have concluded that NSP-Minnesota’s disclosure controls and procedures are effective. Internal Control Over Financial Reporting No change in NSP-Minnesota’s internal control over financial reporting has occurred during the most recent fiscal quarter that has materially affected, or is reasonably likely to materially affect, NSP-Minnesota’s internal control over financial reporting. NSP-Minnesota maintains internal control over financial reporting to provide reasonable assurance regarding the reliability of the financial reporting. NSP-Minnesota has evaluated and documented its controls in process activities, in general computer activities, and on an entity-wide level. During the year and in preparation for issuing its report for the year ended Dec. 31, 2007 on internal controls under section 404 of the Sarbanes-Oxley Act of 2002, NSP-Minnesota conducted testing and monitoring of its internal control over financial reporting. Based on the control evaluation, testing and remediation performed, NSP-Minnesota did not identify any material control weaknesses, as defined under the standards and rules issued by the Public Company Accounting Oversight Board (PCAOB) and as approved by the SEC and as indicated in Management Report on Internal Controls herein. This annual report does not include an attestation report of NSP-Minnesota’s registered public accounting firm regarding internal control over financial reporting. Management’s report was not subject to attestation by NSP-Minnesota’s registered public accounting firm pursuant to temporary rules of the Securities and Exchange Commission that permit NSP-Minnesota to provide only management’s report in this annual report. Item 9B — Other Information None.

71
PART III
Items 10, 11, 12 and 13 of Part III of Form 10-K have been omitted from this report for NSP-Minnesota in accordance with conditions set forth in general instructions I (1) (a) and (b) of Form 10-K for wholly-owned subsidiaries. Item 10 — Directors, Executive Officers and Corporate Governance Item 11 — Executive Compensation Item 12 — Security Ownership of Certain Beneficial Owners and Management and Related Stockholder Matters Item 13 — Certain Relationships, Related Transactions and Director Independence Item 14 — Principal Accounting Fees and Services Information concerning fees paid to the principal accountant for each of the last two years is contained in the Xcel Energy Proxy Statement for its 2008 Annual Meeting of Shareholders, which is incorporated by reference. PART IV Item 15 — Exhibits, Financial Statement Schedules 1. Consolidated Financial Statements:
Management Report on Internal Controls — For the year ended Dec. 31, 2007. Report of Independent Registered Public Accounting Firm — For the years ended Dec. 31, 2007, 2006 and 2005. Consolidated Statements of Income — For the three years ended Dec. 31, 2007, 2006 and 2005. Consolidated Statements of Cash Flows — For the three years ended Dec. 31, 2007, 2006 and 2005. Consolidated Balance Sheets — As of Dec. 31, 2007 and 2006.
2. Schedule II — Valuation and Qualifying Accounts and Reserves for the years ended Dec. 31, 2007, 2006 and 2005. 3. Exhibits
*Indicates incorporation by reference
+Executive Compensation Arrangements and Benefit Plans Covering Executive Officers and Directors
2.01*
Agreement and Plan of Merger, dated as of March 24, 1999, by and between Northern States Power Co. (a Minnesota corporation) and New Century Energies, Inc. (Exhibit 2.1 to New Century Energies, Inc. Form 8-K (file no. 001-12907) dated March 24, 1999).
3.01*
Articles of Incorporation and Amendments of Northern Power Corp. (renamed Northern States Power Co. (a Minnesota corporation) on Aug. 21, 2000)(Exhibit 3.01 to Form 10-12G (file no. 000-31709) dated Oct. 5, 2000).
3.02*
By-Laws of Northern States Power Co. (a Minnesota corporation) (Exhibit 3.02 to Form 10-12G (file no. 000-31709) dated Oct. 5, 2000).
4.01*
Supplemental and Restated Trust Indenture, dated May 1, 1988, from Northern States Power Co. (a Minnesota corporation) to Harris Trust and Savings Bank, as Trustee. (Exhibit 4.02 to Form 10-K of NSP-Minnesota for the year 1988, file no. 001-03034). Supplemental Indentures between NSP-Minnesota and said Trustee, supplemental to Exhibit 4.14, dated as follows:
4.02* July 1, 1989 (Exhibit 4.01 to Form 8-K (file no. 001-03034) dated July 7, 1989). 4.03* June 1, 1990 (Exhibit 4.01 to Form 8-K (file no. 001-03034) dated June 1, 1990). 4.04* Oct. 1, 1992 (Exhibit 4.01 to Form 8-K (file no. 001-03034) dated Oct. 13, 1992). 4.05* April 1, 1993 (Exhibit 4.01 to Form 8-K (file no. 001-03034) dated March 30, 1993). 4.06* Dec. 1, 1993 (Exhibit 4.01 to Form 8-K (file no. 001-03034) dated Dec. 7, 1993). 4.07* Feb. 1, 1994 (Exhibit 4.01 to Form 8-K (file no. 001-03034) dated Feb. 10, 1994). 4.08* Oct. 1, 1994 (Exhibit 4.01 to Form 8-K (file no. 001-03034) dated Oct. 5, 1994). 4.09* June 1, 1995 (Exhibit 4.01 to Form 8-K (file no. 001-03034) dated June 28, 1995). 4.10* April 1, 1997 (Exhibit 4.47 to Form 10-K (file no. 001-03034) for the year 1997). 4.11* March 1, 1998 (Exhibit 4.01 to Form 8-K (file no. 001-03034) dated March 11, 1998). 4.12* May 1, 1999 (Exhibit 4.49 to NSP-Minnesota Form 10-12G (file no. 000-31709) dated Oct. 5, 2000). 4.13* June 1, 2000 (Exhibit 4.50 to NSP-Minnesota Form 10-12G (file no. 000-31709) dated Oct. 5, 2000).

72
4.14*
Aug. 1, 2000 (Assignment and Assumption of Trust Indenture) (Exhibit 4.51 to NSP-Minnesota Form 10-12G (file no. 000-31709) dated Oct. 5, 2000).
4.15* June 1, 2002 (Exhibit 4.05 to Form 10-Q (file no. 000-31709) dated Sept. 30, 2002). 4.16* June 1, 2002 (Exhibit 4.06 to Form 10-Q (file no. 000-31709) dated Sept. 30, 2002). 4.17* Aug. 1, 2002 (Exhibit 4.01 to Form 8-K (file no. 001-31387) dated Aug. 22, 2002). 4.18* Aug. 1, 2003 (Exhibit 4.01 to Form 8-K (file no. 001-31387) dated Aug. 6, 2003). 4.19* May 1, 2003 (Exhibit 4.73 to Form 10-K (file no. 000-03034) for the year ended Dec. 31, 2003). 4.20*
July 1, 2005 (Exhibit 4.01 to NSP-Minnesota Current Report on Form 8-K (file no. 001-31387) dated July 14, 2005).
4.21*
Trust Indenture, dated July 1, 1999, between Northern States Power Co. (a Minnesota corporation) and Norwest Bank Minnesota, National Association, as Trustee. (Exhibit 4.01 to NSP-Minnesota Form 8-K (file no. 001-03034) dated July 21, 1999).
4.22*
Supplemental Trust Indenture, dated July 15, 1999, between Northern States Power Co. (a Minnesota corporation) and Norwest Bank Minnesota, National Association, as Trustee. (Exhibit 4.02 to NSP-Minnesota Form 8-K (file no. 001-03034) dated July 21, 1999).
4.23*
Supplemental Trust Indenture, dated Aug. 18, 2000, supplemental to the Indenture dated July 1, 1999, among Xcel Energy, Northern States Power Co. (a Minnesota corporation) and Wells Fargo Bank Minnesota, National Association, as Trustee. (Exhibit 4.63 to NSP-Minnesota Form 10-12G (file no. 000-31709) dated Oct. 5, 2000).
4.24*
Supplemental Trust Indenture dated June 1, 2002, supplemental to the Indentures dated Feb. 1, 1937 and May 1, 1988, between Northern States Power Co. (a Minnesota Corporation) and BNY Midwest Trust Co., as successor trustee (Exhibit 4.05 to Form 10-Q (file no. 000-31709) dated Sept. 30, 2002).
4.25*
Supplemental Trust Indenture dated July 1, 2002, supplemental to the Indentures dated Feb. 1, 1937 and May 1, 1988, between Northern States Power Co. (a Minnesota Corporation) and BNY Midwest Trust Co., as successor trustee (Exhibit 4.06 to Form 10-Q (file no. 000-31709) dated Sept. 30, 2002).
4.26*
Supplemental Trust Indenture dated July 1, 2002, supplemental to the Indenture dated July 1, 1999, between Northern States Power Co. (a Minnesota Corporation) and Wells Fargo Bank Minnesota, National Association, as trustee (Exhibit 4.01 to Form 8-K (file no. 000-31709) dated July 8, 2002).
4.27*
Supplemental Trust Indenture dated Aug. 1, 2002, supplemental to the Indentures dated Feb. 1, 1937 and May 1, 1988, between Northern States Power Co. (a Minnesota Corporation) and BNY Midwest Trust Co., as successor trustee (Exhibit 4.01 to Form 8-K (file no. 001-31387) dated Aug. 22, 2002).
4.28*
Supplemental Trust Indenture dated Aug. 1, 2003 between Northern States Power Co. (a Minnesota corporation) and BNY Midwest Trust Co., supplementing indentures dated Feb. 1, 1937 and May 1, 1988 (Exhibit 4.01 to Form 8-K (file no. 001-31387) dated Aug. 6, 2003).
4.29*
Supplemental Trust Indenture dated May 1, 2003 between Northern States Power Co. (a Minnesota corporation) and BNY Midwest Trust Co., supplementing indentures dated Feb. 1, 1937 and May 1, 1988.
4.30*
Supplemental Indenture dated July 1, 2005 between NSP-Minnesota and BNY Midwest Trust Company, as successor Trustee, creating $250,000,000 principal amount of 5.25 percent First Mortgage Bonds, Series due July 15, 2035 (Exhibit 4.01 to NSP-Minnesota Current Report on Form 8-K, dated July 14, 2005).
4.31*
Supplemental Indenture dated May 1, 2006 between NSP-Minnesota and BNY Midwest Trust Company, as successor Trustee, creating $400,000,000 principal amount of 6.25 percent First Mortgage Bonds, Series due June 1, 2036 (Exhibit 4.01 to NSP-Minnesota Current Report on Form 8-K, dated May 18, 2006).
4.32*
$500,000,000 Credit Agreement dated Dec. 14, 2006 between NSP-Minnesota and various lenders (Exhibit 99.01 to Form 8-K (file no. 000-31387) dated Dec. 14, 2006).
4.33*
Supplemental Indenture, dated June 1, 2007, between NSP-Minnesota and BNY Midwest Trust Company, as successor Trustee. (Exhibit 4.01 to NSP-Minnesota Form 8-K (file no. 001-31387) dated June 19, 2007).
10.01*+ Xcel Energy Omnibus Incentive Plan (Exhibit A to Form DEF-14A (file no. 001-03034) filed Aug. 29, 2000). 10.02*+
Employment Agreement dated March 24, 1999, among Northern States Power Co. (a Minnesota corporation), New Century Energies, Inc. and Wayne H. Brunetti (Exhibit 10(b) to New Century Energies, Inc. Form 10-Q, (file no. 001-12927) dated March 31, 1999).
10.03*+
Amended and Restated Executive Long-Term Incentive Award Stock Plan. (Exhibit 10.02 to NSP-Minnesota Form 10-Q (file no. 001-03034) for the quarter ended March 31, 1998).
10.04*+
New Century Energies Omnibus Incentive Plan, (Exhibit A to New Century Energies, Inc. Form DEF 14A (file no. 001-12927) filed March 26, 1998.
10.05*+
Supplemental Executive Retirement Plan (Exhibit 10(e) (1) to New Century Energies, Inc. Form 10-K (file no. 001-12927) dated Dec. 31, 1998).
10.06*+ Supplemental Executive Retirement Plan for Key Management Employees, as amended and restated March 26,

73
1991 (Exhibit 10(e)(2) to PSCo Form 10-K (file no. 001-3280) dated Dec. 31, 1991). 10.07*+
Supplemental Retirement Income Plan as amended July 23, 1991 (Exhibit 10(d) to SPS Form 10-K, (file no. 001-03789) dated Aug. 31, 1996).
10.08*+
Xcel Energy Senior Executive Severance and Change-in-Control Policy dated Oct. 22, 2003 (Exhibit 10.10 to SPS Form S-4, (file no. 333-112032) dated Jan. 21, 2004).
10.09*+
Stock Equivalent Plan for Non-Employee Directors of Xcel Energy as amended and restated Jan. 1, 2004 (Exhibit B to Form DEF-14A (file no. 001-03034) dated Apr. 9, 2004).
10.10*+
Xcel Energy Nonqualified Deferred Compensation Plan (2002 restatement) (Exhibit 10.23 to Xcel Energy Form 10-K (file no. 001-03034) dated March 15, 2004).
10.11*+
Xcel Energy Non-employee Directors’ Deferred Compensation Plan (Exhibit 10.24 to Xcel Energy Form 10-K (file no. 001-03034) dated March 15, 2004).
10.12*
Form of Services Agreement between Xcel Energy Services Inc. and utility companies (Exhibit H-1 to Form U5B (file no. 001-03034) dated Nov. 16, 2000).
10.13*
Securities Litigation Settlement Agreement as of Dec. 31, 2004 and approved Jan. 14, 2005 (Exhibit 10.01 to Form 8-K (file no. 001-03034) dated Jan. 14, 2005).
10.14*
ERISA Actions Settlement Agreement as of Dec. 31, 2004 and approved Jan. 14, 2005 (Exhibit 10.02 to Form 8-K (file no. 001-03034) dated Jan. 14, 2005).
10.15*
Shareholder Derivative Action Settlement Agreement as of Dec. 31, 2004 and approved Jan. 14, 2005 (Exhibit 10.03 to Form 8-K (file no. 001-03034) dated Jan. 14, 2005).
10.16*+
Employment Agreement, effective Dec. 15, 1997, between company and Mr. Paul J. Bonavia, as amended (Exhibit 10.25 to Xcel Energy Form 10-K (file no. 001-03034) for the year ended Dec. 31, 2004).
10.17*+
Xcel Energy Executive Annual Incentive Award Plan Form of Restricted Stock Agreement (Exhibit 10.06 to Xcel Energy Form 10-Q (file no. 001-03034) dated June 30, 2005).
10.18*+
Xcel Energy Omnibus Incentive Plan Form of Restricted Stock Unit Agreement (Exhibit 10.05 to Xcel Energy Form 10-Q (file no. 001-03034) dated June 30, 2005).
10.19*+
Xcel Energy Omnibus Incentive Plan Form of Performance Share Agreement (Exhibit 10.04 to Xcel Energy Form 10-Q (file no. 001-03034) dated June 30, 2005).
10.20*+
Xcel Energy Omnibus Incentive Plan Form of Restricted Stock Unit Agreement (Exhibit 10.07 to Xcel Energy Form 10-Q (file no. 001-03034) dated June 30, 2005).
10.21*
Xcel Energy Omnibus 2005 Incentive Plan (Exhibit 10.01 to Form 8-K (file no. 001-03034) dated May 25, 2005).
10.22*
Xcel Energy Executive Annual Incentive Award Plan (Exhibit 10.02 to Form 8-K (file no. 001-03034) dated May 25, 2005).
10.23*
Xcel Energy Amended Employment Agreement, between Xcel Energy Inc. and Wayne H. Brunetti (Exhibit 10.01 to Form 8-K (file no. 001-03034) dated June 29, 2005).
10.24*
Xcel Energy Supplemental Executive Retirement Plan (Exhibit 10.01 to Form 8-K (file no. 001-03034) dated Dec. 13, 2005).
10.25*+
First Amendment to the Xcel Energy Senior Executive Severance and Change-In-Control Policy dated Oct. 25, 2006.
10.26*+
Agreement, dated March 20, 2007 between Mr. Gary R. Johnson and Xcel Energy Inc. (Exhibit 10.1 to Form 8-K (file no. 001-03034) dated March 20, 2007).
10.27*
Letter dated Sept. 19, 2007, from Xcel Energy Inc. to the U.S. Department of Justice (DOJ) submitting its offer to settle the COLI tax dispute and Letter dated Sept. 21, 2007 from the DOJ to Xcel Energy Inc. accepting the settlement offer. (Exhibit 10.1 to Form 10-Q (file no. 001-03034) for the quarter ended Sept. 30, 2007).
10.28*+
Second Amendment to the Xcel Energy Senior Executive Severance and Change-in-Control Policy. (Exhibit 10.01 to Xcel Energy’s Form 8-K (file no. 001-03034) dated May 23, 2007).
10.29*+
Amendment Four to Employment Agreement between Xcel Energy Inc. and Paul Bonavia (Exhibit 10.02 to Xcel Energy’s Form 8-K (file no. 001-03034) dated May 23, 2007).
10.30*
Facilities Agreement, dated July 21, 1976, between Northern States Power Co. (a Minnesota corporation) and the Manitoba Hydro-Electric Board relating to the interconnection of the 500 kilovolt (kv) line. (Exhibit 5.06I to file no. 2-54310).
10.31*
Transactions Agreement, dated July 21, 1976, between Northern States Power Co. (a Minnesota corporation) and the Manitoba Hydro-Electric Board relating to the interconnection of the 500 kv line. (Exhibit 5.06J to file no. 2-54310).
10.32*
Coordinating Agreement, dated July 21, 1976, between Northern States Power Co. (a Minnesota corporation) and the Manitoba Hydro-Electric Board relating to the interconnection of the 500 kv line. (Exhibit 5.06K to file no. 2-54310).

74
10.33*
Ownership and Operating Agreement, dated March 11, 1982, between Northern States Power Co. (a Minnesota corporation), Southern Minnesota Municipal Power Agency and United Minnesota Municipal Power Agency concerning Sherburne County Generating Unit No. 3. (Exhibit 10.01 to Form 10-Q for the quarter ended Sept. 30, 1994, file no. 001-03034).
10.34*
Power Agreement, dated June 14, 1984, between Northern States Power Co. (a Minnesota corporation) and the Manitoba Hydro-Electric Board, extending the agreement scheduled to terminate on April 30, 1993, to April 30, 2005. (Exhibit 10.03 to Form 10-Q for the quarter ended Sept. 30, 1994, file no. 001-03034).
10.35*
Power Agreement, dated August 1988, between Northern States Power Co. (a Minnesota corporation) and Minnkota Power Co. (Exhibit 10.08 to Form 10-K for the year 1988, file no. 001-03034).
10.36*
Amended agreement for the sale of thermal energy dated Jan. 1, 1983 between NRG Energy (formerly known as Norenco Corp.) and Northern States Power Co. (a Minnesota corporation) and Norenco Corp. (Exhibit 10.33 to NRG’s Registration on Form S-1, file no. 333-35096).
10.37*
Operations and maintenance agreement dated Nov. 1, 1996 between NRG Energy and Northern States Power Co. (a Minnesota corporation). (Exhibit 10.34 to NRG’s Registration on Form S-1, file no. 333-35096).
10.38*
Amended Agreement for the sale of thermal energy and wood byproduct dated Dec. 1, 1986 between Northern States Power Co. (a Minnesota corporation) and Norenco Corp. (Exhibit 10.36 to NRG’s Registration on Form S-1, file no. 333-35096).
10.39*
Restated Interchange Agreement dated Jan. 16, 2001 between Northern States Power Co. (a Wisconsin corporation) and Northern States Power Co. (a Minnesota corporation) (Exhibit 10.01 to NSP-Wisconsin Form S-4 (file no. 333-112033) dated Jan. 21, 2004).
10.40*
500 megawatt System Participation Power Sale Agreement dated July 30, 2002 between Northern States Power Co. (a Minnesota corporation) and the Manitoba Hydro-Electric Board (Exhibit 99.01 to NSP-Minnesota Form 8-K (file no.001-31387) dated March 25, 2003).
12.01 Statement of Computation of Ratio of Earnings to Fixed Charges. 23.01 Consent of Independent Registered Public Accounting Firm. 31.01
Principal Executive Officer’s certification pursuant to 18 U.S.C. Section 1350, as adopted pursuant to Section 302 of the Sarbanes-Oxley Act of 2002.
31.02
Principal Financial Officer’s certification pursuant to 18 U.S.C. Section 1350, as adopted pursuant to Section 302 of the Sarbanes-Oxley Act of 2002.
32.01
Certification pursuant to 18 U.S.C. Section 1350, as adopted pursuant to Section 906 of the Sarbanes-Oxley Act of 2002.
99.01 Statement pursuant to Private Securities Litigation Reform Act of 1995.

75
SCHEDULE II
NSP-MINNESOTA AND SUBSIDIARIES VALUATION AND QUALIFYING ACCOUNTS
Years Ended Dec. 31, 2007, 2006 and 2005 (Thousands of Dollars)
Additions
Balance atbeginning of period
Charged to costs and
expenses
Charged to other
accounts (1)
Deductions from
reserves(2)
Balance at end
of period Reserve deducted from related assets: Allowance for bad debts: 2007 ............................................................. $ 13,408 $ 23,336 $ 5,853 $ 22,494 $ 20,103 2006 ............................................................. 10,128 19,972 6,102 22,794 13,408 2005 ............................................................. 7,845 13,997 4,089 15,803 10,128
(1) Recovery of amounts previously written off. (2) Principally bad debts written off or transferred.

76
SIGNATURES
Pursuant to the requirements of Section 13 or 15(d) of the Securities Exchange Act of 1934, the registrant has duly caused this annual report to be signed on its behalf by the undersigned, thereunto duly authorized. NORTHERN STATES POWER COMPANY /s/ BENJAMIN G.S. FOWKE III Benjamin G.S. Fowke III
Vice President and Chief Financial Officer (Principal Financial Officer)
February 25, 2008 Pursuant to the requirements of the Securities Exchange Act of 1934, this report has been signed below by the following persons on behalf of the registrant and in the capacities and on the date indicated. /s/ DAVID M. SPARBY /s/ RICHARD C. KELLY David M. Sparby Executive Vice President, Acting President, Chief Executive Officer and Director (Principal Executive Officer)
Richard C. Kelly Chairman and Director
/s/ TERESA S. MADDEN /s/ BENJAMIN G.S. FOWKE III Teresa S. Madden Vice President and Controller (Principal Accounting Officer)
Benjamin G.S. Fowke III Vice President, Chief Financial Officer and Director (Principal Financial Officer)
/s/ PAUL J. BONAVIA Paul J. Bonavia Vice President and Director
SUPPLEMENTAL INFORMATION TO BE FURNISHED WITH REPORTS FILED PURSUANT TO SECTION 15(D) OF THE ACT BY REGISTRANTS WHICH HAVE NOT REGISTERED SECURITIES PURSUANT TO SECTION 12 OF THE ACT NSP-Minnesota has not sent, and does not expect to send, an annual report or proxy statement to its security holder.

1
Exhibit 12.01
NSP-MINNESOTA AND SUBSIDIARIES STATEMENT OF COMPUTATION OF
RATIO OF EARNINGS TO FIXED CHARGES (Thousands of Dollars)
Year ended Dec. 31, 2007 2006 2005 2004 2003 Earnings as defined:
Pretax income from continuing operations............................................. $ 449,327 $ 399,916 $ 349,527 $ 324,887 $ 269,466
Add: Fixed charges .................................. 211,660 176,169 158,352 150,610 153,352 Earnings as defined.............................. $ 660,987 $ 576,085 $ 507,879 $ 475,497 $ 422,818
Fixed charges: Interest charges ........................................ $ 186,293 $ 165,381 $ 150,261 $ 142,147 $ 135,764 Interest component of operating leases.... 25,367 10,788 8,091 8,463 8,401 Distributions on redeemable preferred
securities of subsidiary trust................. — — — — 9,187 Total fixed charges............................... $ 211,660 $ 176,169 $ 158,352 $ 150,610 $ 153,352
Ratio of earnings to fixed charges ............... 3.1 3.3 3.2 3.2 2.8

1
Exhibit 23.01
CONSENT OF INDEPENDENT REGISTERED PUBLIC ACCOUNTING FIRM We consent to the incorporation by reference in Registration Statement No. 333-59098, No. 333-123494 and No. 333-147958 on Form S-3 of our report dated February 20, 2008 (which report expresses an unqualified opinion and includes an explanatory paragraph relating to the adoption of Financial Accounting Standards Board (FASB) Interpretation No. 48, “Accounting for Uncertainty in Income Taxes – an interpretation of FASB Statement No. 109”), relating to the consolidated financial statements and financial statement schedule of Northern States Power Company – Minnesota appearing in this Annual Report on Form 10-K of Northern States Power Company – Minnesota for the year ended December 31, 2007. /S/ DELOITTE & TOUCHE LLP Minneapolis, Minnesota February 20, 2008

1
Exhibit 31.01
CERTIFICATION
I, David M. Sparby, certify that: 1. I have reviewed this report on Form 10-K of Northern States Power Co. (a Minnesota corporation); 2. Based on my knowledge, this report does not contain any untrue statement of a material fact or omit to state a material
fact necessary to make the statements made, in light of the circumstances under which such statements were made, not misleading with respect to the period covered by this report;
3. Based on my knowledge, the financial statements and other financial information included in this report, fairly present
in all material respects the financial condition, results of operations and cash flows of the registrant as of, and for, the periods presented in this report;
4. The registrant’s other certifying officer and I are responsible for establishing and maintaining disclosure controls and
procedures (as defined in Exchange Act Rules 13a-15(e) and 15d-15(e)) and internal control over financial reporting (as defined in Exchange Act Rules 13a-15(f) and 15d-15(f)) for the registrant and have:
a) Designed such disclosure controls and procedures or caused such disclosure controls and procedures to be designed
under our supervision, to ensure that material information relating to the registrant, including its consolidated subsidiaries, is made known to us by others within those entities, particularly during the period in which this report is being prepared;
b) Designed such internal control over financial reporting, or caused such internal control over financial reporting to
be designed under our supervision, to provide reasonable assurance regarding the reliability of financial reporting and the preparation of financial statements for external purposes in accordance with generally accepted accounting principles;
c) Evaluated the effectiveness of the registrant’s disclosure controls and procedures and presented in this report our
conclusions about the effectiveness of the disclosure controls and procedures, as of the end of the period covered by this report based on such evaluation;
c) Disclosed in this report any change in the registrant’s internal control over financial reporting that occurred during
the registrant’s most recent fiscal quarter (the registrant’s fourth fiscal quarter in the case of an annual report) that has materially affected or is reasonably likely to materially affect, the registrant’s internal control over financial reporting; and
5. The registrant’s other certifying officer and I have disclosed, based on our most recent evaluation of internal control
over financial reporting, to the registrant’s auditors and the audit committee of the registrant’s board of directors (or persons performing the equivalent functions);
a) All significant deficiencies and material weaknesses in the design or operation of internal control over financial
reporting which are reasonably likely to adversely affect the registrant’s ability to record, process, summarize and report financial information; and
b) Any fraud, whether or not material, that involves management or other employees who have a significant role in the
registrant’s internal control over financial reporting. /s/ DAVID M. SPARBY David M. Sparby Executive Vice President, Acting President and
Chief Executive Officer Date: February 25, 2008

1
Exhibit 31.02
CERTIFICATION
I, Benjamin G.S. Fowke III, certify that: 1. I have reviewed this report on Form 10-K of Northern States Power Co. (a Minnesota corporation); 2. Based on my knowledge, this report does not contain any untrue statement of a material fact or omit to state a material
fact necessary to make the statements made, in light of the circumstances under which such statements were made, not misleading with respect to the period covered by this report;
3. Based on my knowledge, the financial statements and other financial information included in this report, fairly present
in all material respects the financial condition, results of operations and cash flows of the registrant as of, and for, the periods presented in this report;
4. The registrant’s other certifying officer and I are responsible for establishing and maintaining disclosure controls and
procedures (as defined in Exchange Act Rules 13a-15(e) and 15d-15(e)) and internal control over financial reporting (as defined in Exchange Act Rules 13a-15(f) and 15d-15(f)) for the registrant and have:
a) Designed such disclosure controls and procedures or caused such disclosure controls and procedures to be designed
under our supervision, to ensure that material information relating to the registrant, including its consolidated subsidiaries, is made known to us by others within those entities, particularly during the period in which this report is being prepared;
b) Designed such internal control over financial reporting, or caused such internal control over financial reporting to be
designed under our supervision, to provide reasonable assurance regarding the reliability of financial reporting and the preparation of financial statements for external purposes in accordance with generally accepted accounting principles;
c) Evaluated the effectiveness of the registrant’s disclosure controls and procedures and presented in this report our
conclusions about the effectiveness of the disclosure controls and procedures, as of the end of the period covered by this report based on such evaluation;
d) Disclosed in this report any change in the registrant’s internal control over financial reporting that occurred during
the registrant’s most recent fiscal quarter (the registrant’s fourth fiscal quarter in the case of an annual report) that has materially affected or is reasonably likely to materially affect, the registrant’s internal control over financial reporting; and
5. The registrant’s other certifying officer and I have disclosed, based on our most recent evaluation of internal control
over financial reporting, to the registrant’s auditors and the audit committee of the registrant’s board of directors (or persons performing the equivalent functions);
a) All significant deficiencies and material weaknesses in the design or operation of internal control over financial
reporting which are reasonably likely to adversely affect the registrant’s ability to record, process, summarize and report financial information; and
b) Any fraud, whether or not material, that involves management or other employees who have a significant role in the
registrant’s internal control over financial reporting. /s/ BENJAMIN G.S. FOWKE III Benjamin G.S. Fowke III Vice President and Chief Financial Officer Date: February 25, 2008

1
Exhibit 32.01
OFFICER CERTIFICATION
CERTIFICATION PURSUANT TO
18 U.S.C. SECTION 1350, AS ADOPTED PURSUANT TO
SECTION 906 OF THE SARBANES-OXLEY ACT OF 2002
In connection with the Annual Report of NSP-Minnesota on Form 10-K for 2007, as filed with the Securities and Exchange Commission on the date hereof (Form 10-K), each of the undersigned officers of NSP-Minnesota certifies, pursuant to 18 U.S.C. Section 1350, as adopted pursuant to Section 906 of the Sarbanes-Oxley Act of 2002, that, to such officer’s knowledge: (1) The Form 10-K fully complies with the requirements of Section 13(a) or 15(d) of the Securities Exchange Act of 1934;
and (2) The information contained in the Form 10-K fairly presents, in all material respects, the financial condition and results of
operations of NSP-Minnesota as of the dates and for the periods expressed in the Form 10-K. Date: February 25, 2008
/s/ DAVID M. SPARBY David M. Sparby Executive Vice President, Acting President and Chief Executive Officer /s/ BENJAMIN G.S. FOWKE III Benjamin G.S. Fowke III Vice President and Chief Financial Officer The foregoing certification is being furnished solely pursuant to 18 U.S.C. Section 1350 and is not being filed as part of the Report or as a separate disclosure document. A signed original of this written statement required by Section 906, or other document authenticating, acknowledging or otherwise adopting the signature that appears in typed form within the electronic version of this written statement required by Section 906, has been provided to NSP-Minnesota and will be retained by NSP-Minnesota and furnished to the Securities and Exchange Commission or its staff upon request.

1
Exhibit 99.01
NSP-MINNESOTA CAUTIONARY FACTORS
The Private Securities Litigation Reform Act provides a “safe harbor” for forward-looking statements to encourage such disclosures without the threat of litigation, providing those statements are identified as forward-looking and are accompanied by meaningful, cautionary statements identifying important factors that could cause the actual results to differ materially from those projected in the statement. Forward-looking statements are made in written documents and oral presentations of NSP-Minnesota. These statements are based on management’s beliefs as well as assumptions and information currently available to management. When used in NSP-Minnesota’s documents or oral presentations, the words “anticipate,” “estimate,” “expect,” “projected,” objective,” “outlook,” “forecast,” “possible,” “potential” and similar expressions are intended to identify forward-looking statements. In addition to any assumptions and other factors referred to specifically in connection with such forward-looking statements, factors that could cause NSP-Minnesota’s actual results to differ materially from those contemplated in any forward-looking statements include, among others, the following:
• Economic conditions, including their impact on capital expenditures and the ability of NSP-Minnesota to obtain financing on favorable terms, inflation rates and monetary fluctuations;
• Business conditions in the energy business; • Demand for electricity in the nonregulated marketplace; • Trade, monetary, fiscal, taxation and environmental policies of governments, agencies and similar organizations in
geographic areas where NSP-Minnesota has a financial interest; • Customer business conditions, including demand for their products or services and supply of labor and materials used in
creating their products and services; • Financial or regulatory accounting principles or policies imposed by the Financial Accounting Standards Board, the SEC,
the Federal Energy Regulatory Commission and similar entities with regulatory oversight; • Availability or cost of capital such as changes in: interest rates; market perceptions of the utility industry, NSP-
Minnesota, Xcel Energy or any of its other subsidiaries; or security ratings; • Factors affecting utility operations such as unusual weather conditions; catastrophic weather-related damage; unscheduled
generation outages, maintenance or repairs; unanticipated changes to fossil fuel, nuclear fuel or natural gas supply costs or availability due to higher demand, shortages, transportation problems or other developments; nuclear or environmental incidents; or electric transmission or natural gas pipeline constraints;
• Employee workforce factors, including loss or retirement of key executives, collective bargaining agreements with union employees, or work stoppages;
• Increased competition in the utility industry; • State, federal and foreign legislative and regulatory initiatives that affect cost and investment recovery, have an impact on
rate structures and affect the speed and degree to which competition enters the electric and natural gas markets; industry restructuring initiatives; transmission system operation and/or administration initiatives; recovery of investments made under traditional regulation; nature of competitors entering the industry; retail wheeling; a new pricing structure; and former customers entering the generation market;
• Rate-setting policies or procedures of regulatory entities, including environmental externalities, which are values established by regulators assigning environmental costs to each method of electricity generation when evaluating generation resource options;
• Nuclear regulatory policies and procedures, including operating regulations and spent nuclear fuel storage; • Social attitudes regarding the utility and power industries; • Cost and other effects of legal and administrative proceedings, settlements, investigations and claims; • Technological developments that result in competitive disadvantages and create the potential for impairment of existing
assets; • Significant slowdown in growth or decline in the U.S. economy, delay in growth or recovery of the U.S. economy or
increased cost for insurance premiums, security and other items; • Risks associated with implementation of new technologies; and
• Other business or investment considerations that may be disclosed from time to time in NSP-Minnesota’s SEC filings, including “Risk Factors” in Item 1A , or in other publicly disseminated written documents.
NSP-Minnesota undertakes no obligation to publicly update or revise any forward-looking statements, whether as a result of new information, future events or otherwise. The foregoing review of factors should not be construed as exhaustive.